Home Blog Page 45

Geologists identify deep-earth structures that may signal hidden metal lodes

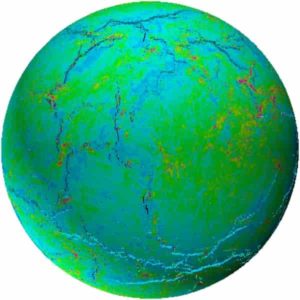
A new study shows that giant ore deposits are tightly distributed above where rigid rocks that comprise the nuclei of ancient continents begin to thin, far below the surface (white areas). Redder areas indicate the thinnest rocks beyond the boundary; bluer ones, the thickest. Circles, triangles and squares show known large sediment-hosted deposits of different metals. (Adapted from Hoggard et al., Nature Geoscience, 2020)

If the world is to maintain a sustainable economy and fend off the worst effects of climate change, at least one industry will soon have to ramp up dramatically: the mining of metals needed to create a vast infrastructure for renewable power generation, storage, transmission and usage. The problem is, demand for such metals is likely to far outstrip currently both known deposits and the existing technology used to find more ore bodies.

Now, in a new study, scientists have discovered previously unrecognized structural lines 100 miles or more down in the earth that appear to signal the locations of giant deposits of copper, lead, zinc and other vital metals lying close enough to the surface to be mined, but too far down to be found using current exploration methods. The discovery could greatly narrow down search areas, and reduce the footprint of future mines, the authors say. The study appears this week in the journal Nature Geoscience.

“We can’t get away from these metals-they’re in everything, and we’re not going to recycle everything that was ever made,” said lead author Mark Hoggard, a postdoctoral researcher at Harvard University and Columbia University’s Lamont-Doherty Earth Observatory. “There’s a real need for alternative sources.”

The study found that 85 percent of all known base-metal deposits hosted in sediments-and 100 percent of all “giant” deposits (those holding more than 10 million tons of metal)-lie above deeply buried lines girdling the planet that mark the edges of ancient continents. Specifically, the deposits lie along boundaries where the earth’s lithosphere-the rigid outermost cladding of the planet, comprising the crust and upper mantle-thins out to about 170 kilometers below the surface.

Up to now, all such deposits have been found pretty much at the surface, and their locations have seemed to be somewhat random. Most discoveries have been made basically by geologists combing the ground and whacking at rocks with hammers. Geophysical exploration methods using gravity and other parameters to find buried ore bodies have entered in recent decades, but the results have been underwhelming. The new study presents geologists with a new, high-tech treasure map telling them where to look.

Due to the demands of modern technology and the growth of populations and economies, the need for base metals in the next 25 years is projected to outpace all the base metals so far mined in human history. Copper is used in basically all electronics wiring, from cell phones to generators; lead for photovoltaic cells, high-voltage cables, batteries and super capacitors; and zinc for batteries, as well as fertilizers in regions where it is a limiting factor in soils, including much of China and India. Many base-metal mines also yield rarer needed elements, including cobalt, iridium and molybdenum. One recent study suggests that in order to develop a sustainable global economy, between 2015 and 2050 electric passenger vehicles must increase from 1.2 million to 1 billion; battery capacity from 0.5 gigawatt hours to 12,000; and photovoltaic capacity from 223 gigawatts to more than 7,000.

The new study started in 2016 in Australia, where much of the world’s lead, zinc and copper is mined. The government funded work to see whether mines in the northern part of the continent had anything in common. It built on the fact that in recent years, scientists around the world have been using seismic waves to map the highly variable depth of the lithosphere, which ranges down to 300 kilometers in the nuclei of the most ancient, undisturbed continental masses, and tapers to near zero under the younger rocks of the ocean floors. As continents have shifted, collided and rifted over many eons, their subsurfaces have developed scar-like lithospheric irregularities, many of which have now been mapped.

The study’s authors found that the richest Australian mines lay neatly along the line where thick, old lithosphere grades out to 170 kilometers as it approaches the coast. They then expanded their investigation to some 2,100 sediment-hosted mines across the world, and found an identical pattern. Some of the 170-kilometer boundaries lie near current coastlines, but many are nestled deep within the continents, having formed at various points in the distant past when the continents had different shapes. Some are up to 2 billion years old.

The scientists’ map shows such zones looping through all the continents, including areas in western Canada; the coasts of Australia, Greenland and Antarctica; the western, southeastern and Great Lakes regions of the United States; and much of the Amazon, northwest and southern Africa, northern India and central Asia. While some of the identified areas already host enormous mines, others are complete blanks on the mining map.

The authors believe that the metal deposits formed when thick continental rocks stretched out and sagged to form a depression, like a wad of gum pulled apart. This thinned the lithosphere and allowed seawater to flood in. Over long periods, these watery low spots got filled in with metal-bearing sediments from adjoining, higher-elevation rocks. Salty water then circulated downward until reaching depths where chemical and temperature conditions were just right for metals picked up by the water in deep parts of the basin to precipitate out to form giant deposits, anywhere from 100 meters to 10 kilometers below the then-surface. The key ingredient was the depth of the lithosphere. Where it is thickest, little heat from the hot lower mantle rises to potential near-surface ore-forming zones, and where it is thinnest, a lot of heat gets through. The 170-kilometer boundary seems to be Goldilocks zone for creating just the right temperature conditions, as long as the right chemistry also is present.

“It really just hits the sweet spot,” said Hoggard. “These deposits contain lots of metal bound up in high-grade ores, so once you find something like this, you only have to dig one hole.” Most current base-metal mines are sprawling, destructive open-pit operations. But in many cases, deposits starting as far down as a kilometer could probably be mined economically, and these would “almost certainly be taken out via much less disruptive shafts,” said Hoggard.

The study promises to open exploration in so far poorly explored areas, including parts of Australia, central Asia and western Africa. Based on a preliminary report of the new study that the authors presented at an academic conference last year, a few companies appear to have already claimed ground in Australia and North America. But the mining industry is notoriously secretive, so it is not clear yet how widespread such activity might be.

“This is a truly profound finding and is the first time anyone has suggested that mineral deposits formed in sedimentary basins … at depths of only kilometers in the crust were being controlled by forces at depths of hundreds of kilometers at the base of the lithosphere,” said a report in Mining Journal reviewing the preliminary presentation last year.

The study’s other authors are Karol Czarnota of Geoscience Australia, who led the initial Australian mapping project; Fred Richards of Harvard University and Imperial College London; David Huston of Geoscience Australia; and A. Lynton Jaques and Sia Ghelichkhan of Australian National University.

Hoggard has put the study into a global context on his website: https://mjhoggard.com/2020/06/29/treasure-maps

Reference:
Mark J. Hoggard, Karol Czarnota, Fred D. Richards, David L. Huston, A. Lynton Jaques, Sia Ghelichkhan. Global distribution of sediment-hosted metals controlled by craton edge stability. Nature Geoscience, 2020; 13: 504-510 DOI: 10.1038/s41561-020-0593-2

Note: The above post is reprinted from materials provided by Earth Institute at Columbia University. Original written by Kevin Krajick.

Precise measurement of liquid iron density under extreme conditions

Our planet has a layered structure of silicate mantle and metallic core. The liquid outer core is located 2900 km below the surface where the pressure and temperature are extremely high, >136 gigapascal (1.36 million atmospheres) and >4000 C. The sound speed and density profiles of the deep-interior of our planet is given by seismological observations.
CREDIT: Assistant Professor Yoichi Nakajima

Using the large synchrotron radiation facility SPring-8 in Japan, a collaboration of researchers from Kumamoto University, the University of Tokyo, and others from Japan and France have precisely measured the density of liquid iron under conditions similar to those at Earth’s outer core: 1,000,000 atm and 4,000 degrees C. Accurate density measurements of liquid iron under such extreme conditions is very important for understanding the chemical make-up of our planet’s core.

The Earth has a solid metal inner core and a liquid metal outer core located some 2,900 km (1,800 mi) below the surface, both of which are under very high pressures and temperatures. Since the main component of the outer core is iron, and its density is considerably lower than that of pure iron, it was thought to contain a large amount of light elements like hydrogen and oxygen. Identifying the type and amount of these light elements will allow for a better understanding of the origin of the Earth, specifically the materials that made up the Earth and the environment at the core when it separated from the mantle. However, this first requires an accurate measurement of the density of pure liquid iron at extreme pressure and temperature similar to the molten core so densities can be compared.

As pressure rises, the melting point of iron also rises, which makes it difficult to study the density of liquid iron under ultra-high pressure. Previous high-pressure liquid iron density measurements claimed that it was about 10% higher than the density of liquid iron under core conditions, but the shock compression experiments used were assumed to have a large error.

The current work improves upon these measurements by using the high-intensity X-ray at the SPring-8 facility to measure the X-ray diffraction of liquid iron under ultra-high pressures and high temperatures, and applies a novel analytical method to calculate the liquid density. Additionally, the sound speed profile of the liquid was measured under extreme conditions up to 450,000 atm. Data was collected at various temperatures and pressures then combined with previous shock-wave data to calculate density for conditions over the entire Earth’s core.

Currently, the best way to estimate the density of the Earth’s outer core is from seismic observations. Comparing the outer core density to the experimental measurements in this study finds that pure iron is about 8% more dense than that of the Earth’s outer core. Oxygen, which has been regarded as a major impurity in the past, cannot explain the density difference, suggesting the presence of other light elements. This revelation is a big step towards estimating the chemical composition of the core — a first-class problem in Earth Science.

“Worldwide, many attempts to measure the density, speed of sound, and structure of liquids under ultrahigh pressures using laser-heated diamond cells have been made for over 30 years, but none have been successful so far,” said Dr. Yoichi Nakajima, one of the main members of the research collaboration. “We expect that the technological innovations achieved in this study will dramatically accelerate research on liquids under high pressures. Eventually, we believe that this will deepen our understanding of the liquid metallic core and magma deep within the Earth and other rocky planets.”

Reference:
Yasuhiro Kuwayama, Guillaume Morard, Yoichi Nakajima, Kei Hirose, Alfred Q. R. Baron, Saori I. Kawaguchi, Taku Tsuchiya, Daisuke Ishikawa, Naohisa Hirao, Yasuo Ohishi. Equation of State of Liquid Iron under Extreme Conditions. Physical Review Letters, 2020; 124 (16) DOI: 10.1103/physrevlett.124.165701

Note: The above post is reprinted from materials provided by Kumamoto University.

Higher concentration of metal in Moon’s craters provides new insights to its origin

Moon
Moon

Life on Earth would not be possible without the Moon; it keeps our planet’s axis of rotation stable, which controls seasons and regulates our climate. However, there has been considerable debate over how the Moon was formed. The popular hypothesis contends that the Moon was formed by a Mars-sized body colliding with Earth’s upper crust which is poor in metals. But new research suggests the Moon’s subsurface is more metal-rich than previously thought, providing new insights that could challenge our understanding of that process.

Today, a study published in Earth and Planetary Science Letters sheds new light on the composition of the dust found at the bottom of the Moon’s craters. Led by Essam Heggy, research scientist of electrical and computer engineering at the USC Viterbi School of Engineering, and co-investigator of the Mini-RF instrument onboard NASA Lunar Reconnaissance Orbiter (LRO), the team members of the Miniature Radio Frequency (Mini-RF) instrument on the Lunar Reconnaissance Orbiter (LRO) mission used radar to image and characterize this fine dust. The researchers concluded that the Moon’s subsurface may be richer in metals (i.e. Fe and Ti oxides) than scientists had believed.

According to the researchers, the fine dust at the bottom of the Moon’s craters is actually ejected materials forced up from below the Moon’s surface during meteor impacts. When comparing the metal content at the bottom of larger and deeper craters to that of the smaller and shallower ones, the team found higher metal concentrations in the deeper craters.

What does a change in recorded metal presence in the subsurface have to do with our understanding of the Moon? The traditional hypothesis is that approximately 4.5 billion years ago there was a collision between Earth and a Mars-sized proto-planet (named Theia). Most scientists believe that that collision shot a large portion of Earth’s metal-poor upper crust into orbit, eventually forming the Moon.

One puzzling aspect of this theory of the Moon’s formation, has been that the Moon has a higher concentration of iron oxides than the Earth — a fact well-known to scientists. This particular research contributes to the field in that it provides insights about a section of the moon that has not been frequently studied and posits that there may exist an even higher concentration of metal deeper below the surface. It is possible, say the researchers that the discrepancy between the amount of iron on the Earth’s crust and the Moon could be even greater than scientists thought, which pulls into question the current understanding of how the Moon was formed.

The fact that our Moon could be richer in metals than the Earth challenges the notion that it was portions of Earth’s mantle and crust that were shot into orbit. A greater concentration of metal deposits may mean that other hypotheses about the Moon’s formation must be explored. It may be possible that the collision with Theia was more devastating to our early Earth, with much deeper sections being launched into orbit, or that the collision could have occurred when Earth was still young and covered by a magma ocean. Alternatively, more metal could hint at a complicated cool-down of an early molten Moon surface, as suggested by several scientists.

According to Heggy, “By improving our understanding of how much metal the Moon’s subsurface actually has, scientists can constrain the ambiguities about how it has formed, how it is evolving and how it is contributing to maintaining habitability on Earth.” He further added, “Our solar system alone has over 200 moons — understanding the crucial role these moons play in the formation and evolution of the planets they orbit can give us deeper insights into how and where life conditions outside Earth might form and what it might look like.”

Wes Patterson of the Planetary Exploration Group (SRE), Space Exploration Sector (SES) at Johns Hopkins University Applied Physics Laboratory, who is the project’s principal investigator for Mini-RF and a co-author of the study, added, “The LRO mission and its radar imager Mini-RF are continuing to surprise us with new insights into the origins and complexity of our nearest neighbor.”

The team plans to continue carrying out additional radar observations of more crater floors with the Mini-RF experiment to verify the initial findings of the published investigation.

This research project was funded through the University of Southern California under NASA award NNX15AV76G.

Reference:
E. Heggy, E.M. Palmer, T.W. Thompson, B.J. Thomson, G.W. Patterson. Bulk composition of regolith fines on lunar crater floors: Initial investigation by LRO/Mini-RF. Earth and Planetary Science Letters, 2020; 541: 116274 DOI: 10.1016/j.epsl.2020.116274

Note: The above post is reprinted from materials provided by University of Southern California. Original written by Ben Paul.

Uncovering the two ‘faces’ of the Earth

Earth
Earth

New Curtin University-led research has uncovered how rocks sourced from the Earth’s mantle are linked to the formation and breakup of supercontinents and super oceans over the past 700 million years, suggesting that the Earth is made up of two distinct “faces.”

The research, published in the leading journal Nature Geoscience, examined the chemical and isotopic “make-up” of rocks sourced from thousands of kilometers below the surface to better understand how the Earth’s mantle responds to plate movements that occur near its surface.

Lead author Dr. Luc-Serge Doucet, from the Earth Dynamics Research Group in Curtin’s School of Earth and Planetary Sciences, said the Earth’s mantle is currently divided into two main domains, African and Pacific, but little is known about their formation and history and they are commonly assumed to be chemically the same.

“Our team used trace metals such as lead, strontium, and neodymium, from hotspot volcanic islands including the Hawaiian islands in the Pacific Ocean and the La Reunion island in the Indian Ocean, to examine whether these two domains have the same chemical ‘make-up,'” Dr. Doucet said.

“We found that the African domain was ‘enriched’ by subducted continental materials, which was linked to the assembly and breakup of the supercontinent Pangaea, whereas no such feature was found in the Pacific domain.”

The team found that the contents of the two mantle domains are not exactly the same as previously thought. Instead, the Earth appears to have two chemically distinct hemispheric “faces,” with the Pacific ring of fire being the surface expression of the boundary between the two.

Co-author John Curtin Distinguished Professor Zheng Xiang Li, head of the Earth Dynamics Research Group, said the two chemically distinct hemispheres discovered by the team can best be explained by the distinct evolutionary histories of the two mantle domains during the Rodinia to Pangaea supercontinent cycles.

“We found that the African mantle domain contains continental materials, which were brought down by the subduction system for at least the past 600 million years. However, the Pacific mantle domain has been protected from the infiltration of such materials,” Professor Li said.

“Our research findings are significant as they showcase a dynamic relationship between plate tectonic processes that operate near the surface and the formation and evolution of Earth’s deep mantle structures. The work helps us to understand what drives plate tectonics and the formation and reservation of global geotectonic features such as the Pacific ring of fire. The dynamic and interactive nature of the entire Earth system has important implications on the formation of Earth resources, the evolution of Earth environment, and even the evolution of life.”

The research was co-authored by researchers from Curtin’s School of Earth and Planetary Sciences, Tanta University in Egypt, St Francis Xavier University in Canada, Université Libre de Bruxelles in Belgium, Queen’s University in Canada, and the Chinese Academy of Sciences in Beijing.

Reference:
Doucet et al., Distinct formation history for deep-mantle domains reflected in geochemical differences. Nature Geoscience (2020). doi.org/10.1038/s41561-020-0599-9

Note: The above post is reprinted from materials provided by Curtin University.

How do the Geodes get Colorful?

Amethyst-Geode in the parent rock
Amethyst Geode in the parent rock

What is Geode?

Geodes are secondary geological formations that form within sedimentary and volcanic rocks. Geodes are hollow, vaguely circular rocks, in which masses of mineral matter are isolated (which may include crystals). The crystals are formed by the filling of vesicles by minerals deposited from hydrothermal fluids in volcanic and sub-volcanic rocks; or by the dissolution of syn-genetic concretions and partial filling by the same or other minerals precipitated from water, groundwater or hydrothermal fluids.

Geodes can form in any cavity but the term is usually reserved in igneous and sedimentary rocks for more or less rounded formations. They may form in gas bubbles in igneous rocks, such as vesicles in basaltic lava; or in rounded cavities in sedimentary formations, as in the American Midwest. Dissolved silicates and/or carbonates are deposited on the inside surface after rock surrounding the cavity hardens. Over time, this slow feed of mineral constituents from groundwater or hydrothermal solutions allows crystals to form inside the hollow chamber. Bedrock containing geodes eventually weathers and decomposes, leaving them present at the surface if they are composed of resistant material such as quartz.

What gives them their color?

Geode banding is the result of variable impurities and coloration. Iron oxides will impart rust hues to siliceous solutions such as iron-stained quartz that is commonly observed. Most geodes contain crystals with clear quartz, while others have crystals with purple amethyst. Others may have agate, chalcedony, or jasper banding, or crystals like calcite , dolomite, celestite, and so on. There’s no easy way to say what a geode’s inside holds before it’s sliced open or broken apart. In appearance, however, geodes from a given region are usually similar.

Although geodes can be colorful naturally, some are colored artificially. Often these dyed stones have a brighter, more intense color than what naturally appears. Why dye geodes for people? Colorful geodes tend to sell well, and can imitate rare stones in a cheap way.

The world’s largest Amethyst geode
Purple Amethyst : What causes the purple color of amethyst?

Zultanite : What is Zultanite Mineral? Where to find Zultanite?

zultanite gemstones, rough and crystal form lighting
Zultanite gemstones, rough and crystal form lighting

What is Zultanite Mineral?

Zultanite is a gem variety of the mineral diaspore, mined in the İlbir Mountains of southwest Turkey at an elevation of over 4,000 feet. Depending on its light source, zultanite’s color varies between a yellowish green, light gold, and purplish pink.

Gem-quality transparent color-change (diaspore) Zultanite ® was discovered in the early 1970s. Commercial mining started in 2006 when Zultanite Gems LLC was awarded mining rights to the deposit. Jewelers started to purchase several small stones in the 1990s, but larger fine-quality crystals remained a collector’s collection. During that time, very few stores around the world were lucky enough to offer these precious stones.

The diasporic metabauxite (diasporite) deposit of Turkey’s Milas (Muğla) area is an unique deposit, comprising both metamorphic (primary) and hydrothermal-remobilized (secondary) diaspore produced during various geological times. Microscopic crystals of metamorphic origin are common and are the major component of the metabauxite ore that was metamorphosed from the Late Cretaceous to the Late Paleocene period. However, secondary macroscopic diaspore crystals that fill fracture zones that cross the metabauxite ore formed during the Late Paleocene, Eocene and Oligocene periods as a result of subsequent hydrothermal solutions that eliminated metabauxite constituents. Macroscopic diaspore crystals, based on size, appearance, occurrence and origin, can be distinguished from the metamorphosed microscopic diaspore crystals.

Zultanite
2.40 cts. Zultanite® Wobito Snowflake Gemstone 8 mm. Credit: Zultanite Gems LLC

Approximately 60 percent of the macroscopic diaspore crystals are opaque in appearance and light green in color, and are not considered attractive. The other 40 percent, by contrast, are the quality of gems and exhibit a marked change in color under different types of lighting. The crystals in daylight are usually olive-green, and soil-brown. A small number of color-changing crystals show such as green in daytime or equivalent illumination and carmine in low-watt tungsten lights.

The diaspore crystals of gem quality have standard V-shaped twinnings of varying sizes. The crystals, when gathered, show outstanding lustre. They have perfect cleavage in the direction [0 1 0], and good cleavage in [1 1 0]. Most samples of gem diaspore are olive-green but a few are soil-brown. Many olive-green anisotropic crystals show especially noticeable color-change with different light sources, typically olive-green color under direct sunlight, intermittent daylight, D65 fluorescent lamp, but by contrast, a carmine color under low wattage tungsten, mercury and quartz lamps.

The color-changing quality of these diaspore crystals can be grouped into categories: olive-green or soil-brown and light bordeaux, olive-green and lavender-rose, olive-green and morello-cherry (Gem News of GIA, 1994).

Many Anatolian diaspore samples of olive-green and soil-brown color were analyzed to determine their average bulk chemical composition and quantify the presence of trace elements.

Pure diaspore has about 84.98 wt.% Al2O3 and 15.02 wt.% H2O. These values for our samples were both lower than expected with the difference being largely made up by Fe2O3, SiO2, and TiO2. In addition, the trace element analyses of the samples show significant amounts of Fe, Ti, Mn, and Cr, respectively. These chemical data indicate that the Anatolian diaspore crystals are not pure diaspore (Keller, 1978; Löffler and Mader, 2004), despite the fact that they are flawless gem material. The existence of these unexpected elements may be further evidence for the polycrystalline structure (Klug and Farkas, 1981)of the Anatolian diaspore (zultanite) crystals we describe below and must have resulted from their unusual mode of formation

Here’s a brief overview of the mineral Diaspore and its gemstone trade name(s) Zultanite ® /Csarite TM and some of the people concerned, just to address any unanswered concerns about what it is and how these trade names come along with photographs and some noted related posts. At the end of this article there are pictures of the Zultanite ® 96 carat “Sultans Shield” and the Jewelry Ensemble Zultanite ® “Shooting Star” motif priced at more than $1.5 million: designed by Stephen Webster of London.

What color is Zultanite?

Zultanite is one of the most rare and transparent gemstones in the Diaspore family. Its colors range from yellow, cognac, pink to red. The most intense red hues are due to manganese concentrations. Like Alexandrite, Zultanite also presents impressive color change.

Where to find Zultanite?

Zultanite is mined only by Zultanite Gems, LLC, at a remote location in the Anatolian mountains of Turkey, directly from the host rock at an altitude of more than 1000 metres. The Turkish deposit remains the only Zultanite source in the world (colour-change, diaspore gem quality).

Is Zultanite expensive?

High quality zultanite up to 1 carat that is eye clean and has an excellent cut will sell for roughly $200 per carat


Reference:

  1. Mineralogical characteristics of unusual “Anatolian” diaspore (zultanite) crystals from the İlbirdağı diasporite deposit, Turkey. DOI: 10.1016/j.jafrearsci.2010.01.002
  2. Zultanite Gems LLC

Tiny Japanese dinosaur eggs help unscramble Cretaceous ecosystem

An egg of Himeoolithus murakamii (left), outlined egg with intact eggshell remains (black area) (middle), and reconstruction of Himeoolithus murakamii and their probable parent dinosaur (right).
An egg of Himeoolithus murakamii (left), outlined egg with intact eggshell remains (black area) (middle), and reconstruction of Himeoolithus murakamii and their probable parent dinosaur (right). Photo by University of Tsukuba and Museum of Nature and Human Activities,Hyogo

When most of us think of dinosaurs, we envision large, lumbering beasts, but these giants shared their ecosystems with much smaller dinosaurs, the smaller skeletons of which were generally less likely to be preserved. The fossilized egg shells of these small dinosaurs can shed light on this lost ecological diversity.

Led by the University of Tsukuba, researchers scoured an exceptional fossil egg site first discovered in 2015 in Hyogo Prefecture, southwestern Japan, and reported their findings in a new study published in Cretaceous Research.

The Kamitaki Egg Quarry, found in a red-brown mudstone layer of the Ohyamashimo Formation, deposited in an Early Cretaceous (about 110 million years old) river flood plain, was carefully and intensively excavated in the winter of 2019, and yielded over 1300 egg fossils. Most were isolated fragments, but there were a few partial and almost complete eggs.

According to lead author Professor Kohei Tanaka, “our taphonomic analysis indicated that the nest we found was in situ, not transported and redeposited, because most of the eggshell fragments were positioned concave-up, not concave-down like we see when egg shells are transported.”

Most of these fossil eggs belong to a new egg genus and species, called Himeoolithus murakamii, and are exceptionally small, with an estimated mass of 9.9 grams — about the size of a modern quail egg. However, biological classification analysis implies that the eggs belonged not to early birds, but to their cousins, the non-avian theropod dinosaurs (the group that includes well-known carnivores like Tyrannosaurus and Velociraptor). That puts Himeoolithus murakamii among the smallest non-avian theropod eggs reported to date. These tiny eggs were notably elongated in shape — unusual for similarly small eggs among Cretaceous birds, but typical among larger non-avian theropod eggs.

In addition to the abundant Himeoolithus murakamii egg shells, five more ootaxa (distinct types of egg fossils) were recognized in the Kamitaki locality. All of these ootaxa belonged to small non-avian theropods.

As Professor Tanaka explains, “the high diversity of these small theropod eggs makes this one of the most diverse Early Cretaceous egg localities known. Small theropod skeletal fossils are quite scarce in this area. Therefore, these fossil eggs provide a useful window into the hidden ecological diversity of dinosaurs in the Early Cretaceous of southwestern Japan, as well as into the nesting behavior of small non-avian theropods.”

Reference:
Kohei Tanaka, Darla K. Zelenitsky, François Therrien, Tadahiro Ikeda, Katsuhiro Kubota, Haruo Saegusa, Tomonori Tanaka, Kenji Ikuno. Exceptionally small theropod eggs from the Lower Cretaceous Ohyamashimo Formation of Tamba, Hyogo Prefecture, Japan. Cretaceous Research, 2020; 114: 104519 DOI: 10.1016/j.cretres.2020.104519

Note: The above post is reprinted from materials provided by University of Tsukuba.

300-million-year-old fish resembles a sturgeon but took a different evolutionary path

In a new report, paleontologists Lauren Sallan and Jack Stack re-examine the “enigmatic and strange” prehistoric fish Tanyrhinichthys mcallisteri.
In a new report, paleontologists Lauren Sallan and Jack Stack re-examine the “enigmatic and strange” prehistoric fish Tanyrhinichthys mcallisteri. Image: Nobu Tamura

Sturgeon, a long-lived, bottom-dwelling fish, are often described as “living fossils,” owing to the fact that their form has remained relatively constant, despite hundreds of millions of years of evolution.

In a new study in the Zoological Journal of the Linnean Society, researchers led by Jack Stack, a 2019 University of Pennsylvania graduate, and paleobiologist Lauren Sallan of Penn’s School of Arts & Sciences, closely examine the ancient fish species Tanyrhinichthys mcallisteri, which lived around 300 million years ago in an estuary environment in what is today New Mexico. Although they find the fish to be highly similar to sturgeons in its features, including its protruding snout, they show that these characteristics evolved in a distinct evolutionary path from those species that gave rise to modern sturgeons.

The find indicates that, although ancient, the features that enabled Tanyrhinichthys to thrive in its environment arose multiple times in different fish lineages, a burst of innovation that was not previously fully appreciated for fish in this time period.

“Sturgeon are considered a ‘primitive’ species, but what we’re showing is that the sturgeon lifestyle is something that’s been selected for in certain conditions and has evolved over and over again,” says Sallan, senior author on the work.

“Fish are very good at finding solutions to ecological problems,” says Stack, first author on the study, who worked on the research as a Penn undergraduate and is now a graduate student at Michigan State University. “This shows the degree of both innovation and convergence that’s possible in fishes. Once their numbers got up large enough, they started producing brand new morphologies that we now see have evolved numerous times through the history of fishes, under similar ecological conditions. ”

The first fossil of Tanyrhinichthys was found in 1984 in a fossil-rich area called the Kinney Brick Quarry, about a half hour east of Albuquerque. The first paleontologist to describe the species was Michael Gottfried, a Michigan State faculty member who now serves as Stack’s advisor for his master’s degree.

“The specimen looks like someone found a fish and just pulled on the front of its skull,” Stack says. Many modern fish species, from the swordfish to the sailfish, have protuberant snouts that extend out in front of them, often aiding in their ability to lunge at prey. But this characteristic is much rarer in ancient fishes. In the 1980s when Gottfried described the initial specimen, he posited that the fish resembled a pike, an ambush predator with a longer snout.

During the last decade, however, several more specimens of Tanyrhinichthys have been found in the same quarry. “Those finds were an impetus for this project, now that we had better information on this enigmatic and strange fish,” Stack says.

At the time that Tanyrhinichthys roamed the waters, Earth’s continents were joined in the massive supercontinent called Pangea, surrounded by a single large ocean. But it was an ice age as well, with ice at both poles. Just before this period, the fossil record showed that ray-finned fishes, which now dominate the oceans, were exploding in diversity. Yet 300 million years ago, “it was like someone hit the pause button,” Sallan says. “There’s an expectation that there would be more diversity, but not much has been found, likely owing to the fact that there just hasn’t been enough work on this time period, especially in the United States, and particularly in the Western United States.”

Aiming to fill in some of these gaps by further characterizing Tanyrhinichthys, Stack, Sallan, and colleagues closely examined the specimens in detail and studied other species that dated to this time period. “This sounds really simple, but it’s obviously difficult in execution,” Stack notes, as fossils are compressed flat when they are preserved. The researchers inferred a three-dimensional anatomy using the forms of modern fishes to guide them.

What they noticed cast doubt on the conception of Tanyrhinichthys as resembling a pike. While a pike has an elongated snout with its jaws at the end of it, allowing it to rush its prey head-on, Tanyrhinichthys has an elongated snout with its jaws at the bottom.

“The whole form of this fish is similar to other bottom dwellers,” Stack says. Sallan also noticed canal-like structures on its snout concentrated in the top of its head, suggestive of the locations where sensory organs would attach. “These would have detected vibrations to allow the fish to consume its prey,” says Sallan.

The researchers noted that many of the species that dwelled in similar environments possessed longer snouts, which Sallan called “like an antenna for your face.”

“This also makes sense because it was an estuary environment,” Sallan says, “with large rivers feeding into it, churning up the water, and making it murky. Rather than using your eyesight, you have to use these other sensory organs to detect prey.”

Despite this, other features of the different ancient fishes’ morphology were so different from Tanyrhinichthys that they do not appear to have shared a lineage with one another, nor do modern sturgeon descend from Tanyrhinichthys. Instead the long snouts appear to be an example of convergent evolution, or many different lineages all arriving at the same innovation to adapt well to their environment.

“Our work, and paleontology in general, shows that the diversity of life forms that are apparent today has roots that extend back into the past,” says Stack.

Reference:
Lauren Sallan, Spencer G Lucas, John-Paul Hodnett, Jack Stack. Tanyrhinichthys mcallisteri, a long-rostrumed Pennsylvanian ray-finned fish (Actinopterygii) and the simultaneous appearance of novel ecomorphologies in Late Palaeozoic fishes. Zoological Journal of the Linnean Society, 2020; DOI: 10.1093/zoolinnean/zlaa044

Note: The above post is reprinted from materials provided by University of Pennsylvania.

New Argentine fossils uncover history of celebrated conifer group

Pictured left is an exceptionally preserved male pollen cone of Araucaria huncoensis showing characteristic cylindrical shape and many long, pointed bracts at the base. Pictured right is a leafy branch fossil of Araucaria huncoensis, showing rare preservation of a branching point connecting two leafy branch segments and a connected growth point on the right segment. The branches are usually shed from the tree as individual segments.
Pictured left is an exceptionally preserved male pollen cone of Araucaria huncoensis showing characteristic cylindrical shape and many long, pointed bracts at the base. Pictured right is a leafy branch fossil of Araucaria huncoensis, showing rare preservation of a branching point connecting two leafy branch segments and a connected growth point on the right segment. The branches are usually shed from the tree as individual segments. IMAGE: Gabriella Rossetto-Harris, Penn State University

Newly unearthed, surprisingly well-preserved conifer fossils from Patagonia, Argentina, show that an endangered and celebrated group of tropical West Pacific trees has roots in the ancient supercontinent that once comprised Australia, Antarctica and South America, according to an international team of researchers.

“The Araucaria genus, which includes the well-known Norfolk Island pine, is unique because it’s so abundant in the fossil record and still living today,” said Gabriella Rossetto-Harris, a doctoral student in geosciences at Penn State and lead author of the study. “Though they can grow up to 180 feet tall, the Norfolk Island pine is also a popular houseplant that you might recognize in a dentist’s office or a restaurant.”

Araucaria grew all around the world starting about 170 million years ago in the Jurassic period. Around the time of the dinosaur extinction 66 million years ago, the conifer became restricted to certain parts of the Southern Hemisphere, said co-author Peter Wilf, professor of geosciences and associate in the Earth and Environmental Systems Institute (EESI).

Today, four major groups of Araucaria exist, and the timing of when and where these living lineages evolved is still debated, Rossetto-Harris said. One grows in South America, and the other three are spread across New Caledonia, New Guinea and Australia, including Norfolk Island. Many are now endangered or vulnerable species. The Norfolk pine group, the most diverse with 16 species, is usually thought to have evolved near its modern range in the West Pacific well after the Gondwanan supercontinent split up starting about 50 million years ago, Rossetto-Harris added.

Researchers from Penn State and the Museo Paleontológico Egidio Feruglio, Chubut, Argentina, found the fossils at two sites in Patagonia — Río Pichileufú, which has a geologic age of about 47.7 million years, and Laguna del Hunco, with a geologic age of about 52.2 million years. They analyzed the fossil characteristics and compared them to modern species to determine to which living group the fossils belonged. Then they developed a phylogenetic tree to show the relationships between the fossil and living species. They reported their findings in a recent issue of the American Journal of Botany.

Unlike the monkey puzzle trees of the living South American group of Araucaria, which have large, sharp leaves, the Patagonian conifer fossils have small, needle-like leaves and cone remains that closely resemble the Australasian Norfolk Island pine group, according to the researchers. They also found a fossil of a pollen cone attached to the end of a branch, which is also characteristic of the group.

“The new discovery of a fossil pollen cone still attached to a branch is rare and spectacular,” said Rossetto-Harris, who is also an EESI Environmental Scholar. “It allows us to create a more complete picture of what the ancestors of these trees were like.”

The researchers used 56 new fossils from Río Pichileufú to expand the taxonomic description of Araucaria pichileufensis, a species first described in 1938 using only a handful of specimens.

“Historically, scientists have lumped together the Araucaria fossils found at Río Pichileufú and Laguna del Hunco as the same species,” Rossetto-Harris said. “The study shows, for the first time, that although both species belong to the Norfolk pine group of Araucaria, there is a difference in conifer species between the two sites.”

The researchers named the new species from Laguna del Hunco Araucaria huncoensis, for the site where it was found. The fossils are about 30 million years older than many estimates for when the Australasian lineage evolved, according to Rossetto-Harris.

The findings suggest that 52 million years ago, before South America completely separated from Antarctica, and during the first few million years after separation was underway, relatives of Norfolk Island pines were part of a rainforest that stretched across Australasia and Antarctica and up into Patagonia, said Rossetto-Harris.

The change in the Araucaria species from the older Laguna del Hunco site to the younger Río Pichileufú site may be a response to the climatic cooling and drying that occurred after South America first became isolated.

“We’re seeing the last bits of these forests before the Drake Passage between Patagonia and Antarctica began to really widen and deepen and set forth a lot of big climatic changes that would eventually cause this version of Araucaria to go extinct in South America, but survive in the Australian rainforest and later spread and thrive in New Caledonia,” Rossetto-Harris said.

The study shows how tiny details can provide the definition needed to reveal big, important stories about the history of life, Wilf added.

The National Science Foundation, National Geographic Society, Botanical Society of America, Geological Society of America, and Penn State provided funding for this project.

Reference:
Gabriella Rossetto‐Harris, Peter Wilf, Ignacio H. Escapa, Ana Andruchow‐Colombo. Eocene Araucaria Sect. Eutacta from Patagonia and floristic turnover during the initial isolation of South America. American Journal of Botany, 2020; 107 (5): 806 DOI: 10.1002/ajb2.1467

Note: The above post is reprinted from materials provided by Penn State.

How water in the deep Earth triggers earthquakes and tsunamis

Representative Image: Photo taken March 11, 2011, by Sadatsugu Tomizawa and released via Jiji Press on March 21, 2011, showing tsunami waves hitting the coast of Minamisoma in Fukushima prefecture, Japan. Credit: Sadatsugu Tomizawa CC BY-NC-ND 2.0

In a new study, published in the journal Nature, an international team of scientists provide the first conclusive evidence directly linking deep Earth’s water cycle and its expressions with magmatic productivity and earthquake activity.

Water (H2O) and other volatiles (e.g. CO2 and sulphur) that are cycled through the deep Earth have played a key role in the evolution of our planet, including in the formation of continents, the onset of life, the concentration of mineral resources, and the distribution of volcanoes and earthquakes.

Subduction zones, where tectonic plates converge and one plate sinks beneath another, are the most important parts of the cycle — with large volumes of water going in and coming out, mainly through volcanic eruptions. Yet, just how (and how much) water is transported via subduction, and its effect on natural hazards and the formation of natural resources, has historically been poorly understood.

Lead author of the study, Dr George Cooper, Honorary Research Fellow at the University of Bristol’s School of Earth Sciences, said: “As plates journey from where they are first made at mid-ocean ridges to subduction zones, seawater enters the rocks through cracks, faults and by binding to minerals. Upon reaching a subduction zone, the sinking plate heats up and gets squeezed, resulting in the gradual release of some or all of its water. As water is released it lowers the melting point of the surrounding rocks and generates magma. This magma is buoyant and moves upwards, ultimately leading to eruptions in the overlying volcanic arc. These eruptions are potentially explosive because of the volatiles contained in the melt. The same process can trigger earthquakes and may affect key properties such as their magnitude and whether they trigger tsunamis or not.”

Exactly where and how volatiles are released and how they modify the host rock remains an area of intense research.

Most studies have focused on subduction along the Pacific Ring of Fire. However, this research focused on the Atlantic plate, and more specifically, the Lesser Antilles volcanic arc, located at the eastern edge of the Caribbean Sea.

“This is one of only two zones that currently subduct plates formed by slow spreading. We expect this to be hydrated more pervasively and heterogeneously than the fast spreading Pacific plate, and for expressions of water release to be more pronounced,” said Prof. Saskia Goes, Imperial College London.

The Volatile Recycling in the Lesser Antilles (VoiLA) project brings together a large multidisciplinary team of researchers including geophysicists, geochemists and geodynamicists from Durham University, Imperial College London, University of Southampton, University of Bristol, Liverpool University, Karlsruhe Institute of Technology, the University of Leeds, The Natural History Museum, The Institute de Physique du Globe in Paris, and the University of the West Indies.

“We collected data over two marine scientific cruises on the RRS James Cook, temporary deployments of seismic stations that recorded earthquakes beneath the islands, geological fieldwork, chemical and mineral analyses of rock samples, and numerical modelling,” said Dr Cooper.

To trace the influence of water along the length of the subduction zone, the scientists studied boron compositions and isotopes of melt inclusions (tiny pockets of trapped magma within volcanic crystals). Boron fingerprints revealed that the water-rich mineral serpentine, contained in the sinking plate, is a dominant supplier of water to the central region of the Lesser Antilles arc.

“By studying these micron-scale measurements it is possible to better understand large-scale processes. Our combined geochemical and geophysical data provide the clearest indication to date that the structure and amount of water of the sinking plate are directly connected to the volcanic evolution of the arc and its associated hazards,” said Prof. Colin Macpherson, Durham University

“The wettest parts of the downgoing plate are where there are major cracks (or fracture zones). By making a numerical model of the history of fracture zone subduction below the islands, we found a direct link to the locations of the highest rates of small earthquakes and low shear wave velocities (which indicate fluids) in the subsurface,” said Prof. Saskia Goes.

The history of subduction of water-rich fracture zones can also explain why the central islands of the arc are the largest and why, over geologic history, they have produced the most magma.

“Our study provides conclusive evidence that directly links the water-in and water-out parts of the cycle and its expressions in terms of magmatic productivity and earthquake activity. This may encourage studies at other subduction zones to find such water-bearing fault structures on the subducting plate to help understand patterns in volcanic and earthquake hazards,” said Dr Cooper.

“In this research we found that variations in water correlate with the distribution of smaller earthquakes, but we would really like to know how this pattern of water release may affect the potential — and act as a warning system — for larger earthquakes and possible tsunami,” said Prof. Colin Macpherson.

Reference:
Cooper, G. F., Macpherson, C. G., Blundy, J. D., Maunder, B., Allen, R. W., Goes, S., Collier, J. S, Bie, L., Harmon, N., Hicks, S. P., Iveson, A. A., Prytulak, P., Rietbrock, A., Rychert, C., Davidson J. P. & the VoiLA team. Variable water input controls evolution of the Lesser Antilles volcanic arc. Nature, 2020 DOI: 10.1038/s41586-020-2407-5

Note: The above post is reprinted from materials provided by University of Bristol.

Natural fluid injections triggered Cahuilla earthquake swarm

 Illustration of the natural fluid injection process that triggered the Cahuilla swarm.
Illustration of the natural fluid injection process that triggered the Cahuilla swarm.

A naturally occurring injection of underground fluids drove a four-year-long earthquake swarm near Cahuilla, California, according to a new seismological study that utilizes advances in earthquake monitoring with a machine-learning algorithm. In contrast to mainshock/aftershock sequences, where a large earthquake is followed by many smaller aftershocks, swarms typically do not have a single standout event.

The study, which will be published on June 19 in the journal Science, illustrates an evolving understanding of how fault architecture governs earthquake patterns. “We used to think of faults more in terms of two dimensions: like giant cracks extending into the earth,” says Zachary Ross, assistant professor of geophysics and lead author of the Science paper. “What we’re learning is that you really need to understand the fault in three dimensions to get a clear picture of why earthquake swarms occur.”

The Cahuilla swarm, as it is known, is a series of small temblors that occurred between 2016 and 2019 near Mt. San Jacinto in Southern California. To better understand what was causing the shaking, Ross and colleagues from Caltech, the United States Geological Survey (USGS), and the University of Texas at Austin used earthquake-detection algorithms with deep neural networks to produce a highly detailed catalog of more than 22,000 seismic events in the area ranging in magnitude from 0.7 to 4.4.

When compiled, the catalog revealed a complex but narrow fault zone, just 50 meters wide with steep curves when viewed in profile. Plotting those curves, Ross says, was crucial to understanding the reason for the years of regular seismic activity.

Typically, faults are thought to either act as conduits for or barriers to the flow of underground fluids, depending on their orientation to the direction of the flow. While Ross’s research supports that generally, he and his colleagues found that the architecture of the fault created complex conditions for underground fluids flowing within it.

The researchers noted the fault zone contained undulating subterranean channels that connected with an underground reservoir of fluid that was initially sealed off from the fault. When that seal broke, fluids were injected into the fault zone and diffused through the channels, triggering earthquakes. This natural injection process was sustained over about four years, the team found.

“These observations bring us closer to providing concrete explanations for how and why earthquake swarms start, grow, and terminate,” Ross says.

Next, the team plans to build off these new insights and characterize the role of this type of process throughout the whole of Southern California.

Reference:
Zachary E. Ross, Elizabeth S. Cochran, Daniel T. Trugman, Jonathan D. Smith. 3D fault architecture controls the dynamism of earthquake swarms. Science, 2020 DOI: 10.1126/science.abb0779

Note: The above post is reprinted from materials provided by California Institute of Technology. Original written by Robert Perkins.

Eruption of Alaska’s Okmok volcano linked to period of extreme cold in ancient Rome

Alaska’s Umnak Island in the Aleutians showing the huge, 10-km wide caldera (upper right) largely created by the 43 BCE Okmok II eruption at the dawn of the Roman Empire. Landsat-8 Operational Land Imager image from May 3, 2014
Alaska’s Umnak Island in the Aleutians showing the huge, 10-km wide caldera (upper right) largely created by the 43 BCE Okmok II eruption at the dawn of the Roman Empire. Landsat-8 Operational Land Imager image from May 3, 2014. Credit: U.S. Geological Survey.

An international team of scientists and historians has found evidence connecting an unexplained period of extreme cold in ancient Rome with an unlikely source: a massive eruption of Alaska’s Okmok volcano, located on the opposite side of the Earth.

Around the time of Julius Caesar’s death in 44 BCE, written sources describe a period of unusually cold climate, crop failures, famine, disease, and unrest in the Mediterranean Region -impacts that ultimately contributed to the downfall of the Roman Republic and Ptolemaic Kingdom of Egypt. Historians have long suspected a volcano to be the cause, but have been unable to pinpoint where or when such an eruption had occurred, or how severe it was.

In a new study published this week in Proceedings of the National Academy of Sciences (PNAS), a research team led by Joe McConnell, Ph.D. of the Desert Research Institute in Reno, Nev. uses an analysis of tephra (volcanic ash) found in Arctic ice cores to link the period of unexplained extreme climate in the Mediterranean with the caldera-forming eruption of Alaska’s Okmok volcano in 43 BCE.

“To find evidence that a volcano on other side of the earth erupted and effectively contributed to the demise of the Romans and the Egyptians and the rise of the Roman Empire is fascinating,” McConnell said. “It certainly shows how interconnected the world was even 2,000 years ago.”

The discovery was initially made last year in DRI’s Ice Core Laboratory, when McConnell and Swiss researcher Michael Sigl, Ph.D. from the Oeschger Centre for Climate Change Research at the University of Bern happened upon an unusually well preserved layer of tephra in an ice core sample and decided to investigate.

New measurements were made on ice cores from Greenland and Russia, some of which were drilled in the 1990s and archived in the U.S., Denmark, and Germany. Using these and earlier measurements, they were able to clearly delineate two distinct eruptions — a powerful but short-lived, relatively localized event in early 45 BCE, and a much larger and more widespread event in early 43 BCE with volcanic fallout that lasted more than two years in all the ice core records.

The researchers then conducted a geochemical analysis of the tephra samples from the second eruption found in the ice, matching the tiny shards with those of the Okmok II eruption in Alaska — one of the largest eruptions of the past 2,500 years.

“The tephra match doesn’t get any better,” said tephra specialist Gill Plunkett, Ph.D. from Queen’s University Belfast. “We compared the chemical fingerprint of the tephra found in the ice with tephra from volcanoes thought to have erupted about that time and it was very clear that the source of the 43 BCE fallout in the ice was the Okmok II eruption.”

Working with colleagues from the U.K., Switzerland, Ireland, Germany, Denmark, Alaska, and Yale University in Connecticut, the team of historians and scientists gathered supporting evidence from around the globe, including tree-ring-based climate records from Scandinavia, Austria and California’s White Mountains, and climate records from a speleothem (cave formations) from Shihua Cave in northeast China. They then used Earth system modeling to develop a more complete understanding of the timing and magnitude of volcanism during this period and its effects on climate and history.

According to their findings, the two years following the Okmok II eruption were some of the coldest in the Northern Hemisphere in the past 2,500 years, and the decade that followed was the fourth coldest. Climate models suggest that seasonally averaged temperatures may have been as much as 7oC (13oF) below normal during the summer and autumn that followed the 43 BCE eruption of Okmok, with summer precipitation of 50 to 120 percent above normal throughout Southern Europe, and autumn precipitation reaching as high as 400 percent of normal.

“In the Mediterranean region, these wet and extremely cold conditions during the agriculturally important spring through autumn seasons probably reduced crop yields and compounded supply problems during the ongoing political upheavals of the period,” said classical archaeologist Andrew Wilson, D.Phil. of the University of Oxford. “These findings lend credibility to reports of cold, famine, food shortage and disease described by ancient sources.”

“Particularly striking was the severity of the Nile flood failure at the time of the Okmok eruption, and the famine and disease that was reported in Egyptian sources,” added Yale University historian Joe Manning, Ph.D. “The climate effects were a severe shock to an already stressed society at a pivotal moment in history.”

Volcanic activity also helps to explain certain unusual atmospheric phenomena that were described by ancient Mediterranean sources around the time of Caesar’s assassination and interpreted as signs or omens — things like solar halos, the sun darkening in the sky, or three suns appearing in the sky (a phenomenon now known as a parahelia, or ‘sun dog’). However, many of these observations took place prior to the eruption of Okmok II in 43 BCE, and are likely related to a smaller eruption of Mt. Etna in 44 BCE.

Although the study authors acknowledge that many different factors contributed to the fall of the Roman Republic and Ptolemaic Kingdom, they believe that the climate effects of the Okmok II eruption played an undeniably large role — and that their discovery helps to fill a knowledge gap about this period of history that has long puzzled archaeologists and ancient historians.

“People have been speculating about this for many years, so it’s exciting to be able to provide some answers,” McConnell said.

Reference:
Joseph R. McConnell et al. Extreme climate after massive eruption of Alaska’s Okmok volcano in 43 BCE and effects on the late Roman Republic and Ptolemaic Kingdom. PNAS, 2020 DOI: 10.1073/pnas.2002722117

Note: The above post is reprinted from materials provided by Desert Research Institute.

Geochemists solve mystery of Earth’s vanishing crust

Scientists examined hundreds of samples taken along the global ridges that contain recycled ancient oceanic crust in variable amounts. "Depleted" segments of the ridge received lower than "normal" amounts of recycled crust, while "enriched" segments contain a larger proportion of recycled crust.
Scientists examined hundreds of samples taken along the global ridges that contain recycled ancient oceanic crust in variable amounts. “Depleted” segments of the ridge received lower than “normal” amounts of recycled crust, while “enriched” segments contain a larger proportion of recycled crust. Credit: Caroline McNiel/National MagLab

Thank goodness for the Earth’s crust: It is, after all, that solid, outermost layer of our planet that supports everything above it.

But much of what happens below that layer remains a mystery, including the fate of sections of crust that vanish back into the Earth. Now, a team of geochemists based at the Florida State University-headquartered National High Magnetic Field Laboratory has uncovered key clues about where those rocks have been hiding.

The researchers provided fresh evidence that, while most of the Earth’s crust is relatively new, a small percentage is actually made up of ancient chunks that had sunk long ago back into the mantle then later resurfaced. They also found, based on the amount of that “recycled” crust, that the planet has been churning out crust consistently since its formation 4.5 billion years ago—a picture that contradicts prevailing theories.

Their research is published in the journal Science Advances.

“Like salmon returning to their spawning grounds, some oceanic crust returns to its breeding ground, the volcanic ridges where fresh crust is born,” said co-author Munir Humayun, a MagLab geochemist and professor at Florida State’s Department of Earth, Ocean and Atmospheric Science (EOAS). “We used a new technique to show that this process is essentially a closed loop, and that recycled crust is distributed unevenly along ridges.”

In addition to Humayun, the research team included MagLab postdoctoral researcher Shuying Yang, lead author on the paper, and MagLab Geochemistry Group Director and EOAS Chair Vincent Salters.

The Earth’s oceanic crust is formed when mantle rock melts near fissures between tectonic plates along undersea volcanic ridges, yielding basalt. As new crust is made, it pushes the older crust away from the ridge toward continents, like a super slow conveyer belt. Eventually, it reaches areas called subduction zones, where it is forced under another plate and swallowed back into the Earth.

Scientists have long theorized about what happens to subducted crust after being reabsorbed into the hot, high-pressure environment of the planet’s mantle. It might sink deeper into the mantle and settle there, or rise back to the surface in plumes, or swirl through the mantle, like strands of chocolate through a yellow marble cake. Some of that “chocolate” might eventually rise up, re-melt at mid-ocean ridges, and form new rock for yet another millions-year-long tour of duty on the sea floor.

This new evidence supports the “marble cake” theory.

Scientists had already seen clues supporting the theory. Some basalts collected from mid-ocean ridges, called enriched basalts, have a higher percentage of certain elements that tend to seep from the mantle into the melt from which basalt is formed; others, called depleted basalts, had much lower levels.

To shed more light on the mystery of the disappearing crust, the team chemically analyzed 500 samples of basalt collected from 30 regions of ocean ridges. Some were enriched, some were depleted and some were in between.

Early on, the team discovered that the relative proportions of germanium and silicon were lower in melts of recycled crust than in the “virgin” basalt emerging from melted mantle rock. So they developed a new technique that used that ratio to identify a distinct chemical fingerprint for subducted crust.

They devised a precise method of measuring that ratio using a mass spectrometer at the MagLab. Then they crunched the numbers to see how these ratios differed among the 30 regions sampled, expecting to see variations that would shed light on their origins.

At first the analysis revealed nothing of note. Concerned, Yang, a doctoral candidate at the time, consulted with her adviser. Humayun suggested looking at the problem from a wider angle: Rather than compare basalts of different regions, they could compare enriched and depleted basalts.

After quickly re-crunching the data, Yang was thrilled to see clear differences among those groups of basalts.

“I was very happy,” recalled Yang, lead author on the paper. “I thought, ‘I will be able to graduate!'”

The team had detected lower germanium-to-silicon ratios in enriched basalts—the chemical fingerprint for recycled crust—across all the regions they sampled, pointing to its marble cake-like spread throughout the mantle. Essentially, they solved the mystery of the vanishing crust.

It was a lesson in missing the forest for the trees, Humayun said.

“Sometimes you’re looking too closely, with your nose in the data, and you can’t see the patterns,” he said. “Then you step back and you go, ‘Whoa!'”

Digging deeper into the patterns they found, the scientists unearthed more secrets. Based on the amounts of enriched basalts detected on global mid-ocean ridges, the team was able to calculate that about 5 to 6 percent of the Earth’s mantle is made of recycled crust, a figure that sheds new light on the planet’s history as a crust factory. Scientists had known the Earth cranks out crust at the rate of a few inches a year. But has it done so consistently throughout its entire history?

Their analysis, Humayun said, indicates that, “The rates of crust formation can’t have been radically different from what they are today, which is not what anybody expected.”

Reference:
“Elemental constraints on the amount of recycled crust in the generation of mid-oceanic ridge basalts (MORBs)” Science Advances (2020). DOI: 10.1126/sciadv.aba2923

Note: The above post is reprinted from materials provided by Florida State University.

The geological record of mud deposits

Mud Volcanoes
Representative Image: Mud Volcanoes

The nature of the sediments on the Basque continental shelf is very heterogeneous. From the point of view of distribution, two clearly differentiated sectors can be picked out in terms of grain size. “In the area of Bizkaia medium to coarse-sized sands predominate, whereas on the coast of Gipuzkoa there is a predomination of deposits of very fine sand, silts and clays, currently known as the Basque Mud Patch (BMP),” explained Maria Jesus Irabien, researcher in the UPV/EHU’s Department of Mineralogy and Petrology.

“This mud patch has an irregular surface area of approximately 680 km2. Metals and contaminants, in general, are more likely to build up in this type of muddy material. So if what we are aiming to do is study anthropogenic, industrial or human influence, it is necessary to explore the mud patch in the area of Gipuzkoa,” said the researcher in the Harea: Coastal Geology group of the UPV/EHU.

So, as Irabien pointed out, “we analyzed three cores (19-46 cm deep) from a multidisciplinary perspective that includes the analysis of various metals, foraminifera (small organisms characterized by a shell or chalky conch), pollen and various natural and artificial isotopes”.

“The results obtained have made it possible to calculate that the sediments build up at an approximate rate of one millimeter per year. An increase in the concentrations of metals from the end of the 19th century onwards can also be observed, showing that the influence of industrialization and human activity taking place in the Basque Country extends to the marine environment. In the case of lead (Pb), for example, the content in the most recent samples is five times higher than in that recorded in the past. However, the foraminifera are not affected by this contamination. Finally, the pollen analysis displays a growing trend in conifers and a reduction in indigenous species (Deciduous Quercus), possibly as a result of reforestation,” highlighted the researcher of the Harea: Coastal Geology group of the UPV/EHU.

“The results confirm that the influence of coastal anthropogenic activities extends to the adjacent shelf where muddy deposits are likely to act as a trap for contaminants,” said Irabien.

The researcher stresses “the importance of continuing to make interpretations of this type in marine depths to get to know marine evolution from a historical perspective. It is clear that human activity is exerting a significant influence on the coast, too; the only advantage that all this has is knowing we can stop,” concluded María Jesús Irabien.

Reference:
María Jesús Irabien et al, Recent coastal anthropogenic impact recorded in the Basque mud patch (southern Bay of Biscay shelf), Quaternary International (2020). DOI: 10.1016/j.quaint.2020.03.042

Note: The above post is reprinted from materials provided by University of the Basque Country.

Big-boned marsupial unearths evolution of wombat burrowing behavior

Life reconstruction of the giant wombat relative Mukupirna nambensis on the shores of Lake Pinpa 25 million years ago. Also shown are stiff-tailed ducks (foreground) and flamingos (background), the remains of which are known from the same fossil deposit. Credit: Painting by Peter Schouten.

The discovery of a new species of ancient marsupial, named Mukupirna nambensis, is reported this week in Scientific Reports. The anatomical features of the specimen, which represents one of the oldest known Australian marsupials discovered so far, add to our understanding of the evolution of modern wombats and their characteristic burrowing behavior.

Robin Beck and colleagues describe the remains of a skull and partial skeleton from the Lake Eyre Basin of South Australia. The fossil dates back to the late Oligocene period ― approximately 25–26 million years ago ― and belongs to a new species of Vombatiformes, once one of the most diverse evolutionary groups of marsupial, of which only three species of wombat and the koala are alive today. The authors name the species Mukupirna nambensis from the words muku (“bones”) and pirna (“big”) of the Dieri and Malyangapa languages spoken in the surrounding areas of Lake Eyre and Lake Frome. The creature’s body mass is estimated to have been between 143–171kg, roughly five times larger than living wombat species.

A number of anatomical features identified in the skeleton are indicative of digging behavior, such as adaptations to the forearms commonly seen in burrowing animals. Yet, evidence from previous fossils dated to a later time, suggest Mukupirna was less well-adapted to burrowing than its later relatives. Given this and its size, Mukupirna may not have been capable of the true burrowing behavior seen in modern wombats, but may have used scratch-digging to access food items below the surface, such as roots and tubers. Another adaptation characteristic of living wombat species ― specialized molars capable of continuous growth ― were also absent, suggesting anatomical adaptations of the skeleton for digging pre-date dental changes in wombat evolution.

Reference:
A new family of diprotodontian marsupials from the latest Oligocene of Australia and the evolution of wombats, koalas, and their relatives (Vombatiformes), Scientific Reports (2020). DOI: 10.1038/s41598-020-66425-8

Note: The above post is reprinted from materials provided by Nature Publishing Group.

Purple Amethyst : What causes the purple color of amethyst?

Purple Amethyst
Purple Amethyst. Image by Rudy and Peter Skitterians from Pixabay

Amethyst is a purple quartz type (SiO2) and owes its violet color to irradiation, iron impurities and, in some cases, other transition metals, and the presence of other trace elements resulting in complex crystal lattice substitutions. The hardness of the stone is the same as quartz, making it ideal for use in jewelry.

Amethyst occurs in primary shades from a light pinkish purple color to a deep purple color. Amethyst may have one or both secondary shades, red and blue. High-quality amethyst can be found in Russia, Sri Lanka, Peru, Uruguay and the Far East. The perfect classification is called “Ultra Siberian” which has a predominant purple hue of around 75–80 per cent, with 15–20 per cent blue which (depending on the light source) red secondary hues. ‘Rose de France’ has a distinctly light shade of purple, reminiscent of a lavender / lila shade. These pale colors were once considered undesirable but have recently become popular as a result of intensive marketing.

How does Amethyst get its color?

The color of amethyst has been shown to result from the substitution of trivalent iron (Fe3 +) for silicon in the structure in the presence of trace elements of a large ion radius and, to a certain extent, the amethyst color can naturally result from the displacement of the transition elements even if the iron concentration is low. Real amethyst is dichroic in reddish violet and blue violet, but when it is hot, it turns yellow-orange, yellow-brown, or dark brownish, and can resemble citrine, but, unlike true citrine, it lacks its dichroic. Amethyst can result in ametrine when partially heated.

The color of the amethyst comes from the quartz color centers. They are produced when small amounts of iron are irradiated (from the normal radiation in the rocks).

The purple color of ghost town glass comes from small amounts of manganese in the glass when exposed to ultraviolet light. Manganese was used as a clearing ingredient in glass from 1860 to 1915. Compared to this, lead was used, followed by the use of selenium.

Quartz will commonly contain trace amounts of iron (from 10 to 100 parts per million pieces of iron). Some of this iron is present in sites normally occupied by silicon, and some are interstitial (in sites where the atom is not normally present). The iron is usually at +3 valence.

Gamma ray radiation (from radioactive decay in the underlying rocks) is capable of shaking the electron out of the iron lattice and depositing the electron in the interstitial carbon. This +4 iron absorbs those wavelengths (357 and 545 nanometres) of light producing the colour of the amethyst. You need to get a quartz that contains the right amount of iron and then undergoes sufficiently natural radiation to create the color centers.

Amethyst Identification

Color: Purple, violet, dark purple
Crystal habit: 6-sided prism ending in 6-sided pyramid (typical)
Twinning: Dauphine law, Brazil law, and Japan law
Cleavage: None
Fracture: Conchoidal
Mohs scale hardness: 7–lower in impure varieties
Luster: Vitreous/glassy
Streak: White
Diaphaneity: Transparent to translucent
Specific gravity: 2.65 constant; variable in impure varieties

Roebling Opal : Amazing Rare blue and green Opal Found in Nevada

The Roebling Opal
The Roebling Opal. Photo by Chip Clark / Smithsonian Institution

Roebling Opal

The Roebling Opal, discovered in Humboldt County’s Virgin Valley, was donated to the Smithsonian in 1917. The 1.5 pound black fire opal is considered one of the museum’s most impressive specimens.

The Opal was named for its creator Colonel Washington Augustus Roebling who is in the Smithsonian Museum of Natural History ‘s permanent collection of the same name.

The Roebling Opal, from Virgin Valley, Nevada, is an exceptional 2,585ct opal rough piece. The opal was deposited in voids from silica-rich water that existed after buried tree limbs had rotted away, In some cases to opal casts of the original parts of the tree. Although extremely beautiful, opal is not commonly used in jewellery from this location because it tends to crack or crack. Opals with a vivid play-of-color and a black or other dark body color are called black opals. The Roebling Opal is a black opal with flashes of blue and green play-of-color.

This opalised log from Nevada is one of the many treasures in the Smithsonian National Gem Collection. For several millions of years Western USA has been the site of plentiful volcanism and associated hydrothermal systems, and because much of it is silica-rich, there is plenty of raw material for mineralized waters to create these parts by replacing buried and rotted trees and logs, the Petrified Forest in Arizona being a popular example (though unfortunately agatised rather than opalised).

What Is Opal?

Opal is a hydrated amorphous form of silica; its water content may range from 3 to 21% by weight, but is usually between 6 and 10%. Because of its amorphous character, it is classed as a mineraloid, unlike the other crystalline forms of silica, which are classed as minerals. It is deposited at a relatively low temperature and may occur in the fissures of almost any kind of rock, being most commonly found with limonite, sandstone, rhyolite, marl, and basalt.

Opal is the national gemstone of Australia. Australian opal has often been cited as accounting for 95-97% of the world’s supply of precious opal, with the state of South Australia accounting for 80% of the world’s supply. Recent data suggests that the world supply of precious opal may have changed. In 2012, Ethiopian opal production was estimated to be 14,000 kg (31,000 lb) by the United States Geological Survey. USGS data from the same period (2012), reveals that Australian opal production to be $41 million. Because of the units of measurement, it is not possible to directly compare Australian and Ethiopian opal production, but these data and others suggest that the traditional percentages given for Australian opal production may be overstated. Yet, the validity of data in the USGS report appears to conflict with that of Laurs and others and Mesfin, who estimated the 2012 Ethiopian opal output (from Wegal Tena) to be only 750 kg (1,650 lb).

Read more : What Is Opal?


How seismometers record church bells ringing

Seismic recordings with bell ringing signals in four European locations to mark the passage of time: Lunas (France), Riolos (Greece), Sta. Marيa de Montmagastrell (Spain) y Oriolo (Italy). Each plot corresponds to one day. Each trace represents the same minute at every hour on that day. Time scale is in seconds. (Image: Jordi Dيaz, ICTJA-CSIC)
  • A new study analyses the vibrations generated by the ringing of the bells to indicate the passage of time recorded by seismometers installed near bell towers from 4 European countries
  • The research, published in Journal of Seismology, compares the signal patterns and provides information on the traditions followed to mark the hours in Greece, France, Italy and Spain

A new study made by Jordi Díaz, researcher at Institute of Earth Sciences Jaume Almera of the Spanish National Research Council (ICTJA-CSIC), has compared the different types of bell ringing to indicate the passage of time used in several European countries using recordings of seismometers installed near bell towers. The study, which has been published recently in “Journal of Seismology”, describes the characteristics of the seismic signal recorded by stations installed close to four churches from Greece, France, Italy and Spain. The work reflects the existing differences traditions still active in Europe to mark the hours with bell ringing.

According to Jordi Díaz, one of the objectives of this study is to show “that bridges can be built between very different scientific disciplines, such as seismology and social sciences, since the seismic data offers a new tool to study ethnographic aspects related to how the passage of time is marked in different European cultures”.

Seismometers are very sensitive instruments. As the main objective of this equipment is to detect seismic waves generated by distant and local earthquakes, the preferred locations for the stations are quiet areas to acquire the cleanest possible signal. Small chapels and churches are often seen as a good option to install seismometers, since most of the time they are not used and they offer the requirements for security and electrical power. However, the vibrations induced by eventual bells ringing can be recorded by seismometers and this can affect the data quality.

“The recorded signal contains high values in the upper frequency band, which may indicates that the signals are generated by the acoustic waves produced by the bells and converted to mechanical vibrations close to the seismometers, rather than the vibrations of the bell tower “, said Jordi Díaz.

Díaz became interested in analysing the seismic signal of bell ringing during the deployment of seismic stations carried out in the framework of the TopoIberia-Iberarray project (2007).

“One of the seismometers was installed in the church of Santa Maria de Montmagastrell (Spain). We had been told that the bells wouldn’t ring. But we could check soon that it was not the case. When we looked the records, we were able to see clearly the signal of the ringing bell. Since then, I have found here and there other stations that have recorded the same type of signals”, said Jordi Díaz.

Díaz collected data from seismometers installed close to the churches of Riolos Kato Achaia (Greece), Oriolo (Italy), Lunas (France) and Santa María de Montmagastrell (Spain). Once the data was processed, the scientist was able to identify some of the characteristics and differences on how each church marked the passage of the hours. Díaz could identify, for instance, the periods during which the bells remained active and inactive, since in France, Greece and Spain cases the chimes during nigh time were supressed. The researcher determined also the patterns and the intervals between bell strokes in each particular case.

In the Greek case, for example, hourly announcements are supressed from 13:00 to 17:00, probably to preserve the rest time after lunch. In the French case, according to the recorded signal, the medieval tradition of the Angelus is preserved: three times a day, at 07:00, 12:00 and 19:00, a triple stroke of the bells is repeated three times. In the Spanish case, the particular characteristic is how the hour quarters are indicated: smaller ringing bells are played every quarter and the exact hour bell calls are preceded by four strikes, one for each quarter.

In the Italian example, the seismic signal shows a complex pattern. First, bells ring during night and day time. Second, each hour quarter is marked by a bell stroke that includes the number of chimes corresponding to the previous hour and the number of smaller strikes corresponding to the quarter. This manner of bell ringing results in a total of 768 bell strikes during a single day.

“The data presented here can be interesting to perform studies analysing the relationship between acoustic and mechanic waves”, said Jordi Díaz.

The researcher also highlights the potential use of this type of signals from a seismological point of view. “These signals may be used, as long as they provide a large number of repetitive sources, to explore changes in the mechanical properties of the subsoil, as it is currently being done with environmental seismic noise”.

Díaz considers that this study is also an opportunity to increase the interest of the general public in seismology. “I think that this survey can be used to reach an audience that does not usually worry about seismic records nor Earth Sciences, showing that seismic data can also be used in other scientific disciplines “.

Reference:
Díaz, J. (2020). “Church Bells and Ground Motions”. Journal of Seismology. DOI: 10.1007/s10950-020-09935-2

Note: The above post is reprinted from materials provided by Instituto de Ciencias de la Tierra Jaume Almera – ICTJA-CSIC. The original article was written by Jordi Díaz.

Coal-burning in Siberia led to climate change 250 million years ago

A lump of coal weathering out from Siberian flood basalts in a quarry near the town of Ust Ilimsk Credit: Scott Simper

A team of researchers led by Arizona State University (ASU) School of Earth and Space Exploration professor Lindy Elkins-Tanton has provided the first ever direct evidence that extensive coal burning in Siberia is a cause of the Permo-Triassic Extinction, the Earth’s most severe extinction event. The results of their study have been recently published in the journal Geology.

For this study, the international team led by Elkins-Tanton focused on the volcaniclastic rocks (rocks created by explosive volcanic eruptions) of the Siberian Traps, a region of volcanic rock in Russia. The massive eruptive event that formed the traps is one of the largest known volcanic events in the last 500 million years. The eruptions continued for roughly two million years and spanned the Permian-Triassic boundary. Today, the area is covered by about three million square miles of basaltic rock.

This is ideal ground for researchers seeking an understanding of the Permo-Triassic extinction event, which affected all life on Earth approximately 252 million years ago. During this event, up to 96% of all marine species and 70% of terrestrial vertebrate species became extinct.

Calculations of sea water temperature indicate that at the peak of the extinction, the Earth underwent lethally hot global warming, in which equatorial ocean temperatures exceeded 104 degrees Fahrenheit. It took millions of years for ecosystems to be re-established and for species to recover.

Among the possible causes of this extinction event, and one of the most long-hypothesized, is that massive burning coal led to catastrophic global warming, which in turn was devastating to life. To search for evidence to support this hypothesis, Elkins-Tanton and her team began looking at the Siberian Traps region, where it was known that the magmas and lavas from volcanic events burned a combination of vegetation and coal.

While samples of volcaniclastics in the region were initially difficult to find, the team eventually discovered a scientific paper describing outcrops near the Angara River. “We found towering river cliffs of nothing but volcaniclastics, lining the river for hundreds of miles. It was geologically astounding,” says Elkins-Tanton.

Over six years, the team repeatedly returned to Siberia for field work. They flew to remote towns and were dropped by helicopter either to float down rivers collecting rocks, or to hike across the forests. They ultimately collected over 1,000 pounds of samples, which were shared with a team of 30 scientists from eight different countries.

As the samples were analyzed, the team began seeing strange fragments in the volcaniclastics that seemed like burnt wood, and in some cases, burnt coal. Further field work turned up even more sites with charcoal, coal, and even some sticky organic-rich blobs in the rocks.

Elkins-Tanton then collaborated with fellow researcher and co-author Steve Grasby of the Geological Survey of Canada, who had previously found microscopic remains of burnt coal on a Canadian arctic island. Those remains dated to the end-Permian and were thought to have wafted to Canada from Siberia as coal burned in Siberia. Grasby found that the Siberian Traps samples collected by Elkins-Tanton had the same evidence of burnt coal.

“Our study shows that Siberian Traps magmas intruded into and incorporated coal and organic material,” says Elkins-Tanton. “That gives us direct evidence that the magmas also combusted large quantities of coal and organic matter during eruption.”

And the changes at the end-Permian extinction bear remarkable parallels to what is happening on Earth today, including burning hydrocarbons and coal, acid rain from sulfur, and even ozone-destroying halocarbons.

“Seeing these similarities gives us extra impetus to take action now, and also to further understand how the Earth responds to changes like these in the longer term,” says Elkins-Tanton.

Reference:
F. Goodarzi, O.H. Ardakani, R.V. Veselovskiy, B.A. Black, S.E. Grasby, L.T. Elkins-Tanton. Field evidence for coal combustion links the 252 Ma Siberian Traps with global carbon disruption. Geology, 2020; DOI: 10.1130/G47365.1

Note: The above post is reprinted from materials provided by Arizona State University.

Scientists detect unexpected widespread structures near Earth’s core

Earthquakes send sound waves through the Earth. Seismograms record the echoes as those waves travel along the core-mantle boundary, diffracting and bending around dense rock structures. New research from University of Maryland provides the first broad view of these structures, revealing them to be much more widespread than previously known. Credit: Doyeon Kim/University of Maryland

University of Maryland geophysicists analyzed thousands of recordings of seismic waves, sound waves traveling through the Earth, to identify echoes from the boundary between Earth’s molten core and the solid mantle layer above it. The echoes revealed more widespread, heterogenous structures — areas of unusually dense, hot rock — at the core-mantle boundary than previously known.

Scientists are unsure of the composition of these structures, and previous studies have provided only a limited view of them. Better understanding their shape and extent can help reveal the geologic processes happening deep inside Earth. This knowledge may provide clues to the workings of plate tectonics and the evolution of our planet.

The new research provides the first comprehensive view of the core-mantle boundary over a wide area with such detailed resolution. The study was published in the June 12, 2020, issue of the journal Science.

The researchers focused on echoes of seismic waves traveling beneath the Pacific Ocean basin. Their analysis revealed a previously unknown structure beneath the volcanic Marquesas Islands in the South Pacific and showed that the structure beneath the Hawaiian Islands is much larger than previously known.

“By looking at thousands of core-mantle boundary echoes at once, instead of focusing on a few at a time, as is usually done, we have gotten a totally new perspective,” said Doyeon Kim, a postdoctoral fellow in the UMD Department of Geology and the lead author of the paper. “This is showing us that the core-mantle boundary region has lots of structures that can produce these echoes, and that was something we didn’t realize before because we only had a narrow view.”

Earthquakes generate seismic waves below Earth’s surface that travel thousands of miles. When the waves encounter changes in rock density, temperature or composition, they change speed, bend or scatter, producing echoes that can be detected. Echoes from nearby structures arrive more quickly, while those from larger structures are louder. By measuring the travel time and amplitude of these echoes as they arrive at seismometers in different locations, scientists can develop models of the physical properties of rock hidden below the surface. This process is similar to the way bats echolocate to map their environment.

For this study, Kim and his colleagues looked for echoes generated by a specific type of wave, called a shear wave, as it travels along the core-mantle boundary. In a recording from a single earthquake, known as a seismogram, echoes from diffracted shear waves can be hard to distinguish from random noise. But looking at many seismograms from many earthquakes at once can reveal similarities and patterns that identify the echoes hidden in the data.

Using a machine learning algorithm called Sequencer, the researchers analyzed 7,000 seismograms from hundreds of earthquakes of 6.5 magnitude and greater occurring around the Pacific Ocean basin from 1990 to 2018. Sequencer was developed by the new study’s co-authors from Johns Hopkins University and Tel Aviv University to find patterns in radiation from distant stars and galaxies. When applied to seismograms from earthquakes, the algorithm discovered a large number of shear wave echoes.

“Machine learning in earth science is growing rapidly and a method like Sequencer allows us to be able to systematically detect seismic echoes and get new insights into the structures at the base of the mantle, which have remained largely enigmatic,” Kim said.

The study revealed a few surprises in the structure of the core-mantle boundary.

“We found echoes on about 40% of all seismic wave paths,” said Vedran Lekić, an associate professor of geology at UMD and a co-author of the study. “That was surprising because we were expecting them to be more rare, and what that means is the anomalous structures at the core-mantle boundary are much more widespread than previously thought.”

The scientists found that the large patch of very dense, hot material at the core-mantle boundary beneath Hawaii produced uniquely loud echoes, indicating that it is even larger than previous estimates. Known as ultralow-velocity zones (ULVZs), such patches are found at the roots of volcanic plumes, where hot rock rises from the core-mantle boundary region to produce volcanic islands. The ULVZ beneath Hawaii is the largest known.

This study also found a previously unknown ULVZ beneath the Marquesas Islands.

“We were surprised to find such a big feature beneath the Marquesas Islands that we didn’t even know existed before,” Lekić said. “This is really exciting, because it shows how the Sequencer algorithm can help us to contextualize seismogram data across the globe in a way we couldn’t before.”

Reference:
D. Kim, V. Lekić, B. Ménard, D. Baron and M. Taghizadeh-Popp. Sequencing Seismograms: A Panoptic View of Scattering in the Core-Mantle Boundary Region. Science, 2020 DOI: 10.1126/science.aba8972

Note: The above post is reprinted from materials provided by University of Maryland.

Related Articles