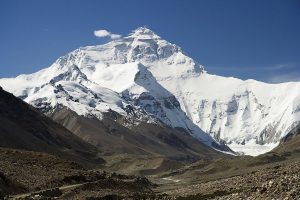
Mount Everest North Face as seen from the path to the base camp, Tibet. Credit: Luca Galuzzi/Wikipedia
Nepal is sending a team of government-appointed climbers up Mount Everest to remeasure its height, officials said Monday, hoping to quash persistent speculation that the world’s tallest mountain has shrunk.
Four government surveyors will depart Wednesday for Everest, which lies on the Himalayan range straddling the border of Nepal and China.
Its official height is 8,848 metres (29,029 feet), first recorded by an Indian survey in 1954. Numerous other teams have measured the peak, although the 1954 height remains the widely accepted figure.
But a heated debate erupted in the aftermath of a massive earthquake in Nepal in 2015, with suggestions the powerful tremor had knocked height off the lofty peak.
Nepal’s Survey Department commissioned a team of surveyors in 2017 to prepare for an Everest expedition in the hope of putting the matter to rest.
“We are sending a team because there were questions regarding the height of Everest after the earthquake,” the expedition’s co-ordinator from the Survey Department, Susheel Dangol, told AFP.
Four government surveyors have spent two years fine tuning their methodology for measuring the peak, collecting readings from the ground and training for the extreme conditions they will encounter at the top of the world.
They will ascend the treacherous mountain armed with advanced equipment to collect the remaining data to derive the true height of the peak, officials say.
“It will not be easy to work in that terrain, but we are confident our mission will be successful,” said the expedition’s leader and chief surveyor, Khim Lal Gautam, who summited Everest in 2011.
It also provides Nepal a chance to measure the fabled mountain for which it is famous, the impoverished country having never conducted its own survey.
In May 1999 an American team added two metres to Everest’s height when it used GPS technology to survey the peak. That figure is now used by the US National Geographic Society, but otherwise not widely accepted.
Later, Nepal became embroiled in a diplomatic row with China after the latter claimed the peak was four metres shorter than the accepted height.
Nepal rests on a major fault line between two tectonic plates: one bearing India that pushes against the other carrying Europe and Asia, the process that created the Himalayas.
Note: The above post is reprinted from materials provided by AFP .
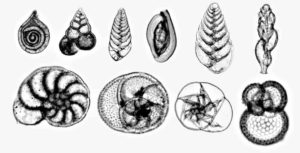
A photomicrograph showing 10 species of foraminifera, a type of plankton. In this paper led by The University of Texas at Austin, researchers examined foraminifera fossils and found a link between the rate of species recovery after an extinction event and evolution. Credit: United States Geological Survey/Randolph Femmer
It takes at least 10 million years for life to fully recover after a mass extinction, a speed limit for the recovery of species diversity that is well known among scientists. Explanations for this apparent rule have usually invoked environmental factors, but research led by The University of Texas at Austin links the lag to something different: evolution.
The recovery speed limit has been observed across the fossil record, from the “Great Dying” that wiped out nearly all ocean life 252 million years ago to the massive asteroid strike that killed all nonavian dinosaurs. The study, published April 8 in the journal Nature Ecology & Evolution, focused on the later example. It looks at how life recovered after Earth’s most recent mass extinction, which snuffed out most dinosaurs 66 million years ago. The asteroid impact that triggered the extinction is the only event in Earth’s history that brought about global change faster than present-day climate change, so the authors said the study could offer important insight on recovery from ongoing, human-caused extinction events.
The idea that evolution — specifically, how long it takes surviving species to evolve traits that help them fill open ecological niches or create new ones — could be behind the extinction recovery speed limit is a theory proposed 20 years ago. This study is the first to find evidence for it in the fossil record, the researchers said.
The team tracked recovery over time using fossils from a type of plankton called foraminifera, or forams. The researchers compared foram diversity with their physical complexity. They found that total complexity recovered before the number of species — a finding that suggests that a certain level of ecological complexity is needed before diversification can take off.
In other words, mass extinctions wipe out a storehouse of evolutionary innovations from eons past. The speed limit is related to the time it takes to build up a new inventory of traits that can produce new species at a rate comparable to before the extinction event.
Lead author Christopher Lowery, a research associate at the University of Texas Institute for Geophysics (UTIG), said that the close association of foram complexity with the recovery speed limit points to evolution as the speed control.
“We see this in our study, but the implication should be that these same processes would be active in all other extinctions,” Lowery said. “I think this is the likely explanation for the speed limit of recovery for everything.”
Lowery co-authored the paper with Andrew Fraass, a research associate at the University of Bristol who did the research while at Sam Houston State University. UTIG is a research unit of the UT Jackson School of Geosciences.
The researchers were inspired to look into the link between recovery and evolution because of earlier research that found recovery took millions of years despite many areas being habitable soon after Earth’s most recent mass extinction. This suggested a control factor other than the environment alone.
They found that although foram diversity as a whole was decimated by the asteroid, the species that survived bounced back quickly to refill available niches. However, after this initial recovery, further spikes in species diversity had to wait for the evolution of new traits. As the speed limit would predict, 10 million years after extinction, the overall diversity of forams was nearly back to levels observed before the extinction event. Foram fossils are prolific in ocean sediments around the world, allowing the researchers to closely track species diversity without any large gaps in time.
Pincelli Hull, an assistant professor at Yale University, said the paper sheds light on factors driving recovery.
“Before this study, people could have told you about the basic patterns in diversity and complexity, but they wouldn’t have been able to answer how they relate to one another in a quantitative sense,” she said.
The authors said that recovery from past extinctions offers a road map for what might come after the modern ongoing extinction, which is driven by climate change, habitat loss, invasive species and other factors.
Reference:
Christopher M. Lowery, Andrew J. Fraass. Morphospace expansion paces taxonomic diversification after end Cretaceous mass extinction. Nature Ecology & Evolution, 2019; DOI: 10.1038/s41559-019-0835-0
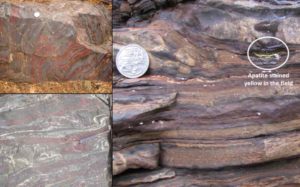
Rocks with banded iron formations and biosignatures – 1,900 million years old, Michigan, US (top left), 2,700 million years old, Ontario, Canada (bottom left) and 2,500 million years old, Karijini National Park, Western Australia (right). Credit: Dr Dominic Papineau, UCL
The discovery provides a new characteristic ‘biosignature’ to track the remains of ancient life preserved in rocks which are significantly altered over billions of years and could help identify life elsewhere in the Solar System.
The research, published in two papers — one in the Journal of the Geological Society and another in Earth and Planetary Science Letters — solves the longstanding problem of how scientists can track records of life on Earth in highly metamorphosed rocks more than 3,700 million years old, with organic material often turning into the carbon-based mineral graphite.
In the first study, published in Earth and Planetary Science Letters, the team analysed ten rock samples of banded iron formations (BIF) from Canada, India, China, Finland, USA and Greenland spanning over 2,000 million years of history.
They argue that carbon preserved in graphite-like crystals -‘graphitic carbon’- located alongside minerals such as apatite, which our teeth and bones are made of, and carbonate, are the biosignatures of the oldest life forms on Earth.
“Life on Earth is all carbon-based and over time, it decomposes into different substances, such as carbonate, apatite and oil. These become trapped in layers of sedimentary rock and eventually the oil becomes graphite during subsequent metamorphism in the crust,” explained Dr Dominic Papineau (UCL Earth Sciences, Center for Planetary Sciences and the London Centre for Nanotechnology).
“Our discovery is important as it is hotly debated whether the association of graphite with apatite is indicative of a biological origin of the carbon found in ancient rocks. We now have multiple strands of evidence that these mineral associations are biological in banded iron formations. This has huge implications for how we determine the origin of carbon in samples of extra-terrestrial rocks returned from elsewhere in the Solar System.”
The team investigated the composition of BIF rocks as they are almost always of Precambrian age (4,600 million years old to 541 million years old) and record information about the oldest environments on Earth.
For this, they analysed the composition of rocks ranging from 1,800 million years old to more than 3,800 million years old using a range of methods involving photons, electrons, and ions to characterise the composition of graphite and other minerals of potential biogenic origin.
“Previously, it was assumed that finding apatite and graphite together in ancient rocks was a rare occurrence but this study shows that it is commonplace in BIF across a range of rock metamorphic grades,” said team member Dr Matthew Dodd (UCL Earth Sciences and the London Centre for Nanotechnology).
The apatite and graphite minerals are thought to have two possible origins: mineralised products of decayed biological organic matter, which includes the breakdown of molecules in oil at high temperatures, or formation through non-biological reactions which are relevant to the chemistry of how life arose from non-living matter.
By showing evidence for the widespread occurrence of graphitic carbon in apatite and carbonate in BIF along with its carbon-isotope composition, the researchers conclude that the minerals are most consistent with a biological origin from the remains of Earth’s oldest life forms.
To investigate the extent to which high-temperature metamorphism causes a loss in molecular, elemental and isotope signatures from biological matter in rocks, they analysed the same minerals from a 1,850 million year old BIF rock in Michigan which had metamorphosed in 550 degree Celsius heat.
In this second study, published today in Journal of the Geological Society, the team show that several biosignatures are found in the graphitic carbon and the associated apatite, carbonate and clays.
They used a variety of high-tech instruments to detect traces of key molecules, elements, and carbon isotopes of graphite and combined this with several microscopy techniques to study tiny objects trapped in rocks which are invisible to the naked eye.
Together, all of their observations of the composition are consistent with an origin from decayed biomass, such as that of ancient animal fossils in museums, but which has been strongly altered by high temperatures.
“Our new data provide additional lines of evidence that graphite associated with apatite in BIF is most likely biological in origin. Moreover, by taking a range of observations from throughout the geological record, we resolve a long-standing controversy regarding the origin of isotopically light graphitic carbon with apatite in the oldest BIF,” said Dr Papineau.
“We’ve shown that biosignatures exist in highly metamorphosed iron formations from Greenland and northeastern Canada which are more than 3,850 million years old and date from the beginning of the sedimentary rock record.”
The work was kindly funded in part by NASA.
References:
Dominic Papineau, Bradley T. De Gregorio, James Sagar, Richard Thorogate, Jianhua Wang, Larry Nittler, David A. Kilcoyne, Hubertus Marbach, Martin Drost, Geoff Thornton. Fossil biomass preserved as graphitic carbon in a late Paleoproterozoic banded iron formation metamorphosed at more than 550°C. Journal of the Geological Society, 2019; jgs2018-097 DOI: 10.1144/jgs2018-097
Matthew S. Dodd, Dominic Papineau, Zhen-Bing She, Chakravadhanula Manikyamba, Yu-Sheng Wan, Jonathan O’Neil, Juha A. Karhu, Hanika Rizo, Franco Pirajno. Widespread occurrences of variably crystalline 13C-depleted graphitic carbon in banded iron formations. Earth and Planetary Science Letters, 2019; 512: 163 DOI: 10.1016/j.epsl.2019.01.054
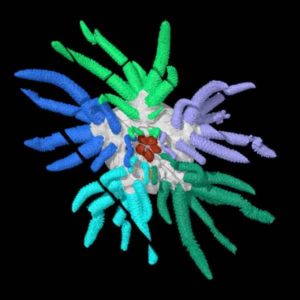
This is a 3D reconstruction of Sollasina cthulhu. Tube feet are shown in different colors. Credit: Imran Rahman, Oxford University Museum of Natural History
An exceptionally-preserved fossil from Herefordshire in the UK has given new insights into the early evolution of sea cucumbers, the group that includes the sea pig and its relatives, according to a new article published today in the journal Proceedings of the Royal Society B.
Palaeontologists from the UK and USA created an accurate 3D computer reconstruction of the 430 million-year-old fossil which allowed them to identify it as a species new to science. They named the animal Sollasina cthulhu due to its resemblance to monsters from the fictional Cthulhu universe created by author H.P. Lovecraft.
Although the fossil is just 3 cm wide, its many long tentacles would have made it appear quite monstrous to other small sea creatures alive at the time. It is thought that these tentacles, or ‘tube feet’, were used to capture food and crawl over the seafloor.
Like other fossils from Herefordshire, Sollasina cthulhu was studied using a method that involved grinding it away, layer-by-layer, with a photograph taken at each stage. This produced hundreds of slice images, which were digitally reconstructed as a ‘virtual fossil’.
This 3D reconstruction allowed palaeontologists to visualise an internal ring, which they interpreted as part of the water vascular system — the system of fluid-filled canals used for feeding and movement in living sea cucumbers and their relatives.
Lead author, Dr Imran Rahman, Deputy Head of Research at Oxford University Museum of Natural History said:
“Sollasina belongs to an extinct group called the ophiocistioids, and this new material provides the first information on the group’s internal structures. This includes an inner ring-like form that has never been described in the group before. We interpret this as the first evidence of the soft parts of the water vascular system in ophiocistioids.”
The new fossil was incorporated into a computerized analysis of the evolutionary relationships of fossil sea cucumbers and sea urchins. The results showed that Sollasina and its relatives are most closely related to sea cucumbers, rather than sea urchins, shedding new light on the evolutionary history of the group.
Co-author Dr Jeffrey Thompson, Royal Society Newton International Fellow at University College London, said:
“We carried out a number of analyses to work out whether Sollasina was more closely related to sea cucumbers or sea urchins. To our surprise, the results suggest it was an ancient sea cucumber. This helps us understand the changes that occurred during the early evolution of the group, which ultimately gave rise to the slug-like forms we see today.”
The fossil was described by an international team of researchers from Oxford University Museum of Natural History, University of Southern California, Yale University, University of Leicester, and Imperial College London. It represents one of many important finds recovered from the Herefordshire fossil site in the UK, which is famous for preserving both the soft as well as the hard parts of fossils.
The fossil slices and 3D reconstruction are housed at Oxford University Museum of Natural History.
Reference:
Imran A. Rahman, Jeffrey R. Thompson, Derek E. G. Briggs, David J. Siveter, Derek J. Siveter, Mark D. Sutton. A new ophiocistioid with soft-tissue preservation from the Silurian Herefordshire Lagerstätte, and the evolution of the holothurian body plan. Proceedings of the Royal Society B: Biological Sciences, 2019; 286 (1900): 20182792 DOI: 10.1098/rspb.2018.2792
Professor Philip Piper from the ANU School of Archaeology and Anthropology inspects the cast of a hominin third metatarsal discovered in 2007. The bone is from a new species of hominin. Credit: Lannon Harley, ANU
An international team of researchers have uncovered the remains of a new species of human in the Philippines, proving the region played a key role in hominin evolutionary history. The new species, Homo luzonensis is named after Luzon Island, where the more than 50,000 year old fossils were found during excavations at Callao Cave.
Co-author and a lead member of the team, Professor Philip Piper from The Australian National University (ANU) says the findings represent a major breakthrough in our understanding of human evolution across Southeast Asia.
The researchers uncovered the remains of at least two adults and one juvenile within the same archaeological deposits.
“The fossil remains included adult finger and toe bones, as well as teeth. We also recovered a child’s femur. There are some really interesting features — for example, the teeth are really small,” Professor Piper said.
“The size of the teeth generally, though not always, reflect the overall body-size of a mammal, so we think Homo luzonensis was probably relatively small. Exactly how small we don’t know yet. We would need to find some skeletal elements from which we could measure body-size more precisely” Professor Piper said.
“It’s quite incredible, the extremities, that is the hand and feet bones are remarkably Australopithecine-like. The Australopithecines last walked the earth in Africa about 2 million years ago and are considered to be the ancestors of the Homo group, which includes modern humans.
“So, the question is whether some of these features evolved as adaptations to island life, or whether they are anatomical traits passed down to Homo luzonensis from their ancestors over the preceding 2 million years.”
While there are still plenty of questions around the origins of Homo luzonensis, and their longevity on the island of Luzon, recent excavations near Callao Cave produced evidence of a butchered rhinoceros and stone tools dating to around 700,000 years ago.
“No hominin fossils were recovered, but this does provide a timeframe for a hominin presence on Luzon. Whether it was Homo luzonensis butchering and eating the rhinoceros remains to be seen,” Professor Piper said.
“It makes the whole region really significant. The Philippines is made up of a group of large islands that have been separated long enough to have potentially facilitated archipelago speciation. There is no reason why archaeological research in the Philippines couldn’t discover several species of hominin. It’s probably just a matter of time.”
Homo luzonensis shares some unique skeletal features with the famous Homo floresiensis or ‘the hobbit’, discovered on the island of Flores to the south east of the Philippine archipelago.
In addition, stone tools dating to around 200,000 years ago have been found on the island of Sulawesi, meaning that ancient hominins potentially inhabited many of the large islands of Southeast Asia.
Reference:
Florent Détroit, Armand Salvador Mijares, Julien Corny, Guillaume Daver, Clément Zanolli, Eusebio Dizon, Emil Robles, Rainer Grün, Philip J. Piper. A new species of Homo from the Late Pleistocene of the Philippines. Nature, 2019; 568 (7751): 181 DOI: 10.1038/s41586-019-1067-9
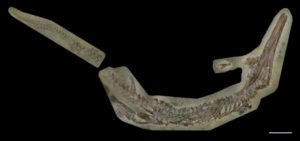
A newly identified species of marine crocodile, Cricosaurus bambergensis, has given insights into how a group of ancient animals evolved. The ancestor of today’s crocodiles belonged to a group of animals that developed a tail fin and paddle-like limbs for life in the sea. Credit: Heinrich Mallison
A newly identified species of 150 million-year-old marine crocodile has given insights into how a group of ancient animals evolved.
The ancestor of today’s crocodiles belonged to a group of animals that developed a tail fin and paddle-like limbs for life in the sea, resembling dolphins more than crocodiles.
These slender animals, which fed on fast-moving prey such as squid and small fish, lived during the Jurassic era in shallow seas and lagoons in what is now Germany. Related species have previously been found in Mexico and Argentina.
Quarry discovery
An international team of scientists, including researchers from Germany and the University of Edinburgh, identified the new species from a remarkably well-preserved skeleton.
The fossil was discovered in 2014 in a quarry near the town of Bamberg in Bavaria, Germany by a team from the Naturkunde-Museum Bamberg, where it is now housed. The species, Cricosaurus bambergensis, takes its name from the town.
Researchers compared the fossil with those from other museum collections, and confirmed that it was a previously unseen species.
Anatomical features
The skeleton has several distinguishing features in its jaws, the roof of its mouth and tail, some of which have not been seen in any other species.
Experts created digital images of the fossil in high resolution, to enable further research. They expect the fossil will aid greater understanding of a wider family of ancient animals, known as metriorhynchid, to which this species belonged.
The research, carried out with Naturkunde-Museum Bielefeld, Eberhard-Karls Universität Tübingen and commercial partners Palaeo3D, is published in Acta Palaeontologica Polonica.
Dr Mark Young, of the University of Edinburgh’s School of GeoSciences, who took part in the study, said: “The rock formations of southern Germany continue to give us fresh insights into the age of dinosaurs. These rock layers were deposited at a time when Europe was covered by a shallow sea, with countries such as Germany and the UK being a collection of islands.”
Sven Sachs, from the Naturkunde-Museum Bielefeld, who led the project, said: “The study reveals peculiar features at the palate that have not been described in any fossil crocodile so far. There are two depressions which are separated by a pronounced bar. It is not clear what these depressions were good for.”
Reference:
Sven Sachs, Mark Young, Pascal Abel, Heinrich Mallison. A new species of the metriorhynchid crocodylomorph Cricosaurus from the Upper Jurassic of southern Germany. Acta Palaeontologica Polonica, 2019; 64 DOI: 10.4202/app.00541.2018
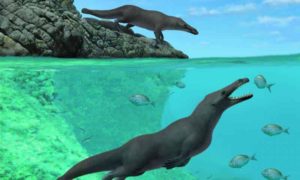
This illustration shows an artistic reconstruction of two individuals of Peregocetus, one standing along the rocky shore of nowadays Peru and the other preying upon sparid fish. The presence of a tail fluke remains hypothetical. Credit: A. Gennari
Cetaceans, the group including whales and dolphins, originated in south Asia more than 50 million years ago from a small, four-legged, hoofed ancestor. Now, researchers reporting the discovery of an ancient four-legged whale — found in 42.6-million-year-old marine sediments along the coast of Peru — have new insight into whales’ evolution and their dispersal to other parts of the world. The findings are reported in the journal Current Biology on April 4.
The presence of small hooves at the tip of the whale’s fingers and toes and its hip and limbs morphology all suggest that this whale could walk on land, according to the researchers. On the other hand, they say, anatomical features of the tail and feet, including long, likely webbed appendages, similar to an otter, indicate that it was a good swimmer too.
“This is the first indisputable record of a quadrupedal whale skeleton for the whole Pacific Ocean, probably the oldest for the Americas, and the most complete outside India and Pakistan,” says Olivier Lambert of the Royal Belgian Institute of Natural Sciences.
Some years ago, study co-author Mario Urbina of Museo de Historia Natural-UNMSM, Peru, discovered a promising area for digging fossils in the coastal desert of southern Peru, named Playa Media Luna. In 2011, an international team, including members from Peru, France, Italy, the Netherlands, and Belgium, organized a field expedition, during which they excavated the remains of an ancient whale they’ve since named Peregocetus pacificus. It means “the traveling whale that reached the Pacific.”
“When digging around the outcropping bones, we quickly realized that this was the skeleton of a quadrupedal whale, with both forelimbs and hind limbs,” Lambert says.
With the help of microfossils, the sediment layers where the skeleton was positioned were precisely dated to the middle Eocene, 42.6 million years ago. Anatomical details of the skeleton allowed them to infer that the animal was capable of maneuvering its large body (up to 4 meters long, tail included), both on land and in the water. For instance, features of the caudal vertebrae (in the tail) are reminiscent of those of beavers and otters, suggesting a significant contribution of the tail during swimming.
The geological age of the new four-limbed whale and its presence along the western coast of South America strongly support the hypothesis that early cetaceans reached the New World across the South Atlantic, from the western coast of Africa to South America, the researchers report. The whales would have been assisted in their travel by westward surface currents and by the fact that, at the time, the distance between the two continents was half what it is today. The researchers suggest that, only after having reached South America, the amphibious whales migrated northward, finally reaching North America.
The international team continues to study the remains of other whales and dolphins from Peru. “We will keep searching in localities with layers as ancient, and even more ancient, than the ones of Playa Media Luna, so older amphibious cetaceans may be discovered in the future,” Lambert says.
Reference:
Olivier Lambert, Giovanni Bianucci, Rodolfo Salas-Gismondi, Claudio Di Celma, Etienne Steurbaut, Mario Urbina, Christian de Muizon. An Amphibious Whale from the Middle Eocene of Peru Reveals Early South Pacific Dispersal of Quadrupedal Cetaceans. Current Biology, 2019; DOI: 10.1016/j.cub.2019.02.050
Note: The above post is reprinted from materials provided by Cell Press.
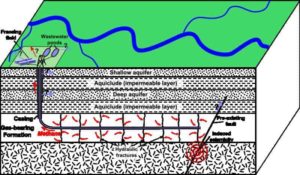
Schematic depiction of hydraulic fracturing for shale gas, showing main possible environmental effects. Credit: Mikenorton/Wikipedia
Two moderate-sized earthquakes that struck the southern Sichuan Province of China last December and January were probably caused by nearby fracking operations, according to a new study published in Seismological Research Letters.
The December 2018 magnitude 5.7 and the January 2019 magnitude 5.3 earthquakes in the South Sichuan Basin caused extensive damage to farmhouses and other structures in the area. The December earthquake was especially destructive, injuring 17 people and resulting in a direct economic loss of about 50 million Chinese Yuan Renminbi (roughly $US 7.5 million).
The Changning shale gas block in the South Sichuan Basin has been the site of fracking operations since 2010, with extensive horizontal fracking injection wells becoming more common since 2014. The earthquake rate in the Changning block rose dramatically at the same time that systematic fracking began.
In the United States, wastewater disposal from oil and gas operations, where water produced during hydrocarbon extraction is injected back into rock layers, is thought to be the primary cause of induced earthquakes, especially in Oklahoma. However, there is growing evidence that hydraulic fracturing, or fracking, which uses injected water to break apart rock layers during hydrocarbon extraction, may have caused moderate-size earthquakes at some sites in Ohio, Oklahoma and western Canada.
Both wastewater disposal and fracking have induced earthquakes in the south Sichuan basin, say Xinglin Lei of the Geological Survey of Japan and colleagues. In their new study in SRL, the researchers present “a full chain of evidence” to show that the December and January earthquakes were induced by fracking operations.
They pinpointed the location of the earthquakes, finding that they were relatively shallow (between two and ten kilometers below the surface), as would be expected for induced earthquakes. The December and January quakes also coincided in time and space with injection at nearby fracking well pads. They did not have the exact injection volumes at these well pads to better understand the relationship between injection activities and the evolution of seismicity.
Lei and colleagues’ modeling of seismic activity show that most of the activity came from the initial mainshocks, with little aftershock activity, which is also consistent with the pattern seen for induced earthquakes. Finally, their calculations show that overpressure on the rock pores, produced by the fracking injections, was strong enough to activate preexisting faults in the region. These faults were mostly unmapped and not in a favorable orientation to slip under normal tectonic activity, the researchers note.
“For most well pads, the associated seismicity fades out quickly after the hydraulic fracture ended or halted,” said Lei, although he noted that their analysis did raise the possibility of seeing signs of fault reactivation from previous seismicity.
“In my opinion, repeated moderate earthquakes can be caused as long as the injection is continuing, since a moderate earthquake releases very limited strain,” he added. “The national regulations in China should be updated with the requirement for operators to take action if some signs of fault reactivation were observed.”
The researchers say more information is needed about faults and their stress patterns in areas of the Sichuan basin surrounding fracking well pads, to guide drilling in a way that would avoid moderate seismic activity. “Moderate earthquakes were observed in a limited number of sites,” said Lei. “If these sites could be screened out, the risk of moderate earthquakes would be greatly reduced.”
Lei and colleagues would like to see researchers, regulators and oil and gas operators work together to better understand what causes injection-induced seismicity in the South Sichuan Basin, to allow effective and safe fracking operations.
Reference:
Xinglin Lei, Zhiwei Wang, Jinrong Su. The December 2018 ML 5.7 and January 2019 ML 5.3 Earthquakes in South Sichuan Basin Induced by Shale Gas Hydraulic Fracturing. Seismological Research Letters, 2019; DOI: 10.1785/0220190029
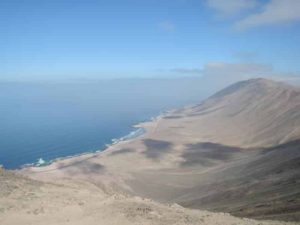
The seismological station Patache is located at an altitude of 830 meters less then two kilometers away from the coast. Credit: C. Sens-Schönfelder, GFZ
Using a single seismometer, researchers have shown that seismic waves excited by the surf, together with the effect of the Earth’s tides on the subsoil, can be used to better understand the properties of the Earth without having to drill into the ground. Knowledge of subsurface stress or strain fluctuations is important for safety in construction and mining, and monitoring geological processes in volcanoes and fault zones, for example.
Anyone who wants to take a look inside the Earth needs a signal that can penetrate rocks, minerals and other opaque material. Seismic waves represent such a signal. If you record them with a seismometer, you can draw conclusions from the recorded data about the state of the subsurface through which the waves have passed. Knowledge of subsurface stress or strain fluctuations is just as important for safety in construction and mining, for example, as it is for monitoring geological processes in volcanoes and fault zones. Now Christoph Sens-Schönfelder from the GFZ German Research Centre for Geosciences in Potsdam and Tom Eulenfeld from the University of Jena have been able to show that the seismic waves excited by the surf, together with the effect of the Earth’s tides on the subsoil, can be used to better understand the properties of the Earth.
Seismic waves not only provide information about the structure of the Earth’s material, but also about the forces acting on it. For example, deformations of the subsurface change the velocity at which a wave travels. In order to draw conclusions about the subsurface forces from the velocity, however, data is required on how the material reacts to deformations under known conditions. Until now, such data have only been available from laboratory experiments, not from the field.
Christoph Sens-Schönfelder and Tom Eulenfeld have now succeeded for the first time in using a single seismometer to measure how sensitively seismic waves react to the deformation of the Earth’s material they propagate in. In order to achieve that, they evaluated the velocity of the seismic noise generated by the surf. They report on this in the journal Physical Review Letters.
Measuring deformations in the Earth’s interior from the surface
“We use two different signals that the environment provides us with naturally,” explains Christoph Sens-Schönfelder. “Due to the tidal effect of the moon and the sun, the universe conducts a permanent deformation experiment with the Earth. The luminaries pull with great regularity on our planet. To observe this pulling, we use the seismic noise in the underground that is generated by the surf.”
The relation investigated by Christoph Sens-Schönfelder and Tom Eulenfeld allows in principle a measurement of the deformations inside the Earth by means of recordings of seismographs on the Earth’s surface. And that without having to drill into the ground.
The data that the two researchers investigated was recorded by the Integrated Plate Boundary Observatory in the Atacama Desert in northern Chile. Improved software was needed to detect even the slightest changes in wave velocity and to combine these changes with the deformation of the subsurface by the tides. Since this tidal deformation is known with high accuracy, it is possible to characterize the subsurface more comprehensively than before.
Reference:
Christoph Sens-Schönfelder and Tom Eulenfeld. Probing the in situ elastic nonlinearity of rocks with earth tides and seismic noise. Phys. Rev. Lett., 2019 [link]
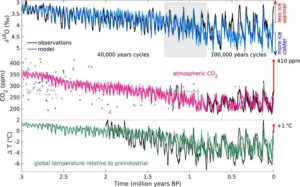
Transien modelling results: Atmospheric CO2 concentration (in pink) compared to ice core data (solid line) and other proxies. Willeit et al, 2019
CO2 greenhouse gas amounts in the atmosphere are likely higher today than ever before in the past 3 million years. For the first time, a team of scientists succeeded to do a computer simulation that fits ocean floor sediment data of climate evolution over this period of time. Ice age onset, hence the start of the glacial cycles from cold to warm and back, the study reveals, was mainly triggered by a decrease of CO2-levels. Yet today, it is the increase of greenhouse gases due to the burning of fossil fuels that is fundamentally changing our planet, the analysis further confirms. Global mean temperatures never exceeded the preindustrial levels by more than 2 degrees Celsius in the past 3 million years, the study shows — while current climate policy inaction, if continued, would exceed the 2 degrees limit already in the next 50 years.
Changes in CO2 levels were a main driver of the ice ages
“We know from the analysis of sediments on the bottom of our seas about past ocean temperatures and ice volumes, but so far the role of CO2 changes in shaping the glacial cycles has not been fully understood,” says Matteo Willeit of the Potsdam Institute for Climate Impact Research, lead author of the study now published in Science Advances. “It is a breakthrough that we can now show in computer simulations that changes in CO2 levels were a main driver of the ice ages, together with variations of how the Earth’s orbits around the sun, the so-called Milankovitch cycles. These are actually not just simulations: we compared our results with the hard data from the deep sea, and they prove to be in good agreement. Our results imply a strong sensitivity of the Earth system to relatively small variations in atmospheric CO2. As fascinating as this is, it is also worrying.”
Studying Earth’s past and its natural climate variability is key to understanding possible future pathways of humanity. “It seems we’re now pushing our home planet beyond any climatic conditions experienced during the entire current geological period, the Quaternary,” says Willeit. “A period that started almost 3 million years ago and saw human civilization beginning only 11,000 years ago. So, the modern climate change we see is big, really big; even by standards of Earth history.”
Learning from Earth’s past to understand the future
Building on previous research at PIK, the researchers reproduced the main features of natural climate variability over the last few million years with an efficient numerical model — a computer simulation based on astronomical and geological data and algorithms representing the physics and chemistry of our planet. The simulation was driven only by well-known changes in the ways the Earth circles the sun, the so-called orbital cycles, and different scenarios for slowly varying boundary conditions, namely CO2 outgassing from volcanoes. The study also lookedt into changes in sediment distribution of the Earth surface, since ice sheets slide more easily on gravel than on bedrock. It has also accounted for the role of atmospheric dust, which makes the ice surface darker and thereby contributes to melting.
“The fact that the model can reproduce the main features of the observed climate history gives us confidence in our general understanding of how the climate system works,” says co-author Andrey Ganopolski, author of several previous groundbreaking studies the new analysis now builds upon. “The simulations we develop have to be simple enough to allow for thousands of calculation runs of many thousands of years, and yet have to capture the critical factors that drive our climate. This is what we have achieved. And it is confirming how outstandingly important changes in CO2 levels are for Earth’s climate.”
Reference:
M. Willeit, A. Ganopolski, R. Calov, V. Brovkin. Mid-Pleistocene transition in glacial cycles explained by declining CO2 and regolith removal. Science Advances, 2019; 5 (4): eaav7337 DOI: 10.1126/sciadv.aav7337
Data produced by internet users can help to speed up the detection of earthquakes. Fast and accurate information is essential in the case of earthquakes: Epicentre location, depth and magnitude are minimum requirements to reliably estimate their possibly catastrophic consequences.
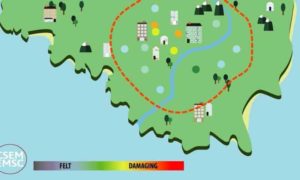
An international team of scientists has presented a method to combine in real time data from seismic networks with information derived from users looking for earthquake information on specific websites, the smartphone LastQuake app and via Twitter. This method significantly reduces the time needed to detect and locate those earthquakes that are felt by the public. The team reported about their results in the journal Science Advances.
Robert J. Steed, Amaya Fuenzalida and Remy Bossu of the European-Mediterranean Seismological Centre (EMSC) in France carried out the research with colleagues from France, Hungary and Germany. The EMSC is one of the top global earthquake information centers which distributes global seismic data for free to the public via its websites (http://www.emsc-csem.org, m.emsc.eu) and its LastQuake smartphone app and Twitter.
It also promotes the use of crowdsourcing to collect eyewitness reports, photos and videos following earthquakes in order to improve situational awareness. This research was done in collaboration with István Bondár (MTA CSFK), an expert in seismic location and the global earthquake monitoring service of the German Centre for Geosciences, GEOFON, which is among the fastest sources for earthquake information world-wide. GEOFON operates a network of around one hundred stations and combines this real-time data with that of other open networks to automatically analyze earthquake activity world-wide.
Usually within three to eight minutes after an earthquake, software developed at GFZ is able to compute location and magnitude of the earthquake. This information is made available online and shared immediately with partner organizations. The new method to compute location can accelerate the detection time to only one to three minutes for felt earthquakes. After feeling an earthquake, people tend to rapidly seek information from the internet or tweet about their observations.
The sudden increase in demand for earthquake information from websites like the EMSC can be detected and an approximate determination made of their geographical origin. This crowdsourcing data collected by the EMSC, in combination with seismic data provided by GFZ, accelerates the detection of felt earthquakes. The algorithm incorporates usage of the EMSC websites and the EMSC’s smartphone app LastQuake as well as searching for the word “earthquake” in 59 languages on Twitter.
The team used the crowdsourcing approach to analyze more than 1500 earthquakes during the years 2016 and 2017. The time required to arrive at a reliable detection could be reduced by on average more than a minute compared to the analysis of only seismic data.
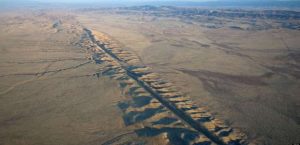
Aerial photo of the San Andreas Fault in the Carrizo Plain, northwest of Los Angeles. Credit: Wikipedia.
There have been no major ground rupturing earthquakes along California’s three highest slip rate faults in the past 100 years. A new study published in Seismological Research Letters concludes that this current “hiatus” has no precedent in the past 1000 years.
U.S. Geological Survey researchers Glenn Biasi and Kate Scharer analyzed long paleoseismic records from the San Andreas, San Jacinto and Hayward Faults for the past 1000 years, to determine how likely it might be to have a 100-year gap in earthquakes across the three faults. They found that the gap was very unlikely—along the lines of a 0.3% chance of occurring, given the seismic record of the past 1000 years.
The results emphasize that the hiatus is exceptional, and that the gap isn’t some sort of statistical fluke created by incomplete paleoseismic records, said Biasi.
The analysis also indicates that the next 100 years of California earthquakes along these faults could be a busy one, he noted. “If our work is correct, the next century isn’t going to be like the last one, but could be more like the century that ended in 1918.”
Between 1800 and 1918, there were eight large ground-rupturing earthquakes along the faults, including the well-known 1906 earthquake in San Francisco and the similar-sized 1857 rupture of the San Andreas in southern California, but nothing so large since.
“We know these big faults have to carry most of the [tectonic] motion in California, and sooner or later they have to slip,” said Biasi. “The only questions are how they’re going to let go and when.”
The three faults and their major branches analyzed by the researchers accommodate the majority of the slip between the Pacific and North American plate boundary. Paleoseismic records from the faults predict that there would be three to four large ground-rupturing earthquakes (magnitude 6.5 or larger) each century.
Biasi and Scharer examined the best available paleoseismic records from sites along the three faults to determine whether the current gap could be explained by missing data, or incorrect radiocarbon dating of past earthquakes. From these data, they calculated the probability that there would be a 100-year gap in ground-rupturing earthquakes across all three faults.
“Our paper confirms that this hiatus is very improbable and it’s our view that our efforts will be better spent considering explanations for this, rather than trying to bend the data to make the hiatus a ‘statistically improbable but could happen’ kind of thing,” said Biasi.
“We’re saying, no, it’s not a data problem, it’s not a data choice problem, it doesn’t matter how you slice this,” he added. “We just have not had earthquakes that past records predict that we should have had.”
He likened the hiatus to what a person might see if they pulled up a chair alongside a freeway to count passing cars. “You might say that a certain number of cars per hour is kind of representative, and then something happens and you go ten minutes of seeing no cars. If it’s just ten minutes, you could say it was a statistical fluke.”
But if the freeway stays clear of traffic for a long time, “the other reason there might be no cars is that up around the bend, there’s a wreck,” said Biasi.
The researchers would like more seismologists to focus on the reasons—”the wreck around the bend”— behind the current hiatus.
“We had the flurry of very large earthquakes from 1800 to 1918,” Biasi said. “It’s possible that among them they just wrung out—in the sense of wringing out a dishrag—a tremendous amount of energy out the system.”
There may be stronger long-range interactions between the faults than suspected, or there may be unknown features of the mantle and lower crust below the faults that affect the probability of ground-rupturing earthquakes, he noted.
Reference:
“The Current Unlikely Earthquake Hiatus at California’s Transform Boundary Paleoseismic Sites,” Seismological Research Letters (2019). DOI: 10.1785/0220180244
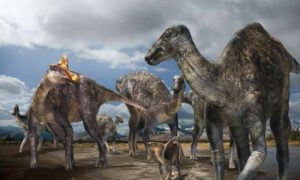
Paleontologists from Hokkaido University in Japan, in cooperation with paleontologists from the Perot Museum of Nature and Science in Dallas, Texas, have discovered the first-confirmed occurrence of a lambeosaurine (crested ‘duck-billed’ dinosaur) from the Arctic – part of the skull of a lambeosaurine dinosaur from the Liscomb Bonebed (71-68 Ma) found on Alaska’s North Slope. The discovery proves for the first time that lambeosaurines inhabited the Arctic during the Late Cretaceous. See paper in Scientific Reports. Credit – Illustration by Masato Hattori. Credit: Masato Hattori
Paleontologists from Hokkaido University in Japan, in cooperation with paleontologists from the Perot Museum of Nature and Science in Dallas, Texas, have discovered the first-confirmed occurrence of a lambeosaurine (crested ‘duck-billed’ dinosaur) from the Arctic—part of the skull of a lambeosaurine dinosaur from the Liscomb Bonebed (71-68 Ma) found on Alaska’s North Slope. The bonebed was previously known to be rich in hadrosaurine hadrosaurids (non-crested ‘duck-billed’ dinosaurs).
The discovery proves for the first time that lambeosaurines inhabited the Arctic during the Late Cretaceous. In addition, the numeric abundance of hadrosaurine fossils compared to the lambeosaurine fossils in the marine-influenced environment of the Liscomb Bonebed suggests the possibility that hadrosaurines and lambeosaurines had different habitat preferences.
The paleontologists’ findings were published today in Scientific Reports. The paper, titled “The first definite lambeosaurine bone from the Liscomb Bonebed of the Upper Cretaceous Prince Creek Formation, Alaska, United States,” is co-authored by Yoshitsugu Kobayashi, Ph.D., and Ryuji Takasaki, of Hokkaido University, in cooperation with Anthony R. Fiorillo, Ph.D., of the Perot Museum of Nature and Science. Other authors are Ronald Tykoski, Ph.D. of the Perot Museum and Paul McCarthy, Ph.D., of the University of Alaska.
“This new discovery illustrates the geographic link between lambeosaurines of North America and the Far East,” said Takasaki. “Hopefully, further work in Alaska will reveal how closely the dinosaurs of Asia and North America are connected.”
The newly discovered fossil, which is housed in the collections of the Perot Museum of Nature and Science, is a supraoccipital, one of the bones that forms the braincase. The new supraoccipital differs from those of hadrosaurines by the presence of large supraoccipital bosses and it’s short, front-to-back length. Since these features are commonly seen in other members of Lambeosaurinae, the newly discovered supraoccipital was assigned to that group.
“This first definitive evidence of a crested hadrosaur in the Cretaceous Arctic tells us that we still have much to learn about the biodiversity and the biologically productive environments of the ancient north, and that the story these fossils tell us is continually evolving,” adds Dr. Fiorillo.
The Arctic is an extreme environment that is low in temperature, lacks sunlight during winters, and has seasonally limited food resources. Though it was warmer during the Late Cretaceous, the Arctic was surely one of the most challenging places to live for large vertebrates at the time. The Prince Creek Formation on the North Slope of Alaska is a world-famous rock unit for studying dinosaurs of the ancient Arctic. Because the dinosaurs found there lived in the ancient Arctic rather than in tropical or sub-tropical conditions, these dinosaurs challenge much of what we think we know about dinosaurs. The Liscomb Bonebed (71-68 Ma), which was deposited near the ancient Arctic shoreline, is especially rich in dinosaur bones, with more than 6,000 bones collected from it thus far.
More than 99 percent of dinosaur fossils known from the Liscomb Bonebed are hadrosaurs, a group of large, duck-billed herbivorous dinosaurs who lived during the Late Cretaceous and were found throughout much of the northern hemisphere. All of the hadrosaur fossils from the Liscomb Bonebed were long considered to belong to a hadrosaurine duck-billed dinosaur called Edmontosaurus. Up until now, all of the hadrosaurids known from across the Arctic, including those from the Liscomb Bonebed, were considered to belong to crest-less hadrosaurines.
The discovery of a fossil from a lambeosaurine hadrosaurid in the Liscomb Bonebed is historically important for Japanese paleontologists. The first “Japanese” dinosaur, Nipponosaurus, is a lambeosaurine hadrosaur. Based on the new discovery, Hokkaido University and the Perot Museum together used this discovery to further investigate the ecology of the Arctic hadrosaurids.
Although the new discovery reveals Arctic inhabitance by lambeosaurines, more specific taxonomic status and potential functional adaptations to the severe Arctic environment remain unknown due to incompleteness of the specimen. Additional excavation and further research will help answer these questions.
Reference:
Ryuji Takasaki et al, The First Definite Lambeosaurine Bone From the Liscomb Bonebed of the Upper Cretaceous Prince Creek Formation, Alaska, United States, Scientific Reports (2019). DOI: 10.1038/s41598-019-41325-8
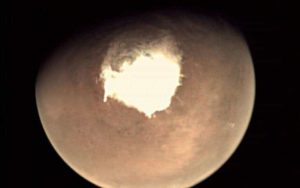
The presence of methane has long been a point of contention among Mars experts. Credit: EUROPEAN SPACE AGENCY/AFP/File / HO
The mystery of methane on Mars may finally be solved as scientists Monday confirmed the presence of the life-indicating gas on the Red Planet as well as where it might have come from.
In the 15 years since a European probe reported traces of the gas in the Martian atmosphere, debate has raged over the accuracy of the readings showing methane, which on Earth is produced by simple lifeforms.
Because methane gas dissipates relatively quickly—within around 12 years on Earth—and due to the difficulty of observing Mars’ atmosphere, many scientists questioned previous studies that relied on a single data set.
Now an international team of experts have compared observations from two separate spacecraft, taken just one day apart in 2013, to find independent proof of methane on our neighbouring planet.
Furthermore, they conducted two parallel experiments to determine the most likely source of methane on Mars to be an ice sheet east of Gale Crater—itself long assumed to be a dried up lake.
“This is very exciting and largely unexpected,” Marco Giuranna, from Rome’s National Astrophysics Institute, told AFP.
“Two completely independent lines of investigation pointed to the same general area of the most likely source for the methane.”
Europe’s Mars Express probe measured 15.5 parts per billion in the atmosphere above the Gale Crater on June 16, 2013. The presence of methane in the vicinity was confirmed by readings taken 24 hours earlier by NASA’s Curiosity rover.
Using the data, Giuranna and the team divided the region around the crater into grids of 250 by 250 square kilometres.
One study then ran a million computer-modelled emissions scenarios for each section while another team studied images of the planet surface for features associated on Earth with the release of methane.
‘Indicator of life’
The most likely source was a sheet of frozen methane beneath a rock formation, which the team believes periodically ejects the gas into the atmosphere.
Giuranna said that while methane is a sign of life on Earth, its presence on Mars doesn’t necessarily constitute evidence of something similar on the Red Planet.
“Methane is important because it could be an indicator of microbial life,” he said. “But life is not required to explain these detections because methane can be produced by abiotic processes.”
“Though not a direct biosignature of life, methane can add to the habitability of martian settings, as certain types of microbes can use methane as a source of carbon and energy,” he added.
Though there is no liquid water on Mars, the European Space Agency said in February its imaging equipment had shown further evidence of dried up river beds, suggesting the Red Planet may once have been home to simple organisms.
Giuranna said that further research was needed to determine the extent of the methane ice sheet near Gale Crater.
If founded to be extensive, the methane it contains “could support a sustained human presence” on Mars as a possible source of fuel for industrial processes and a propellant for returning manned missions to Earth, he said.
The study is reported in Nature Geoscience this week.
Reference:
Independent confirmation of a methane spike on Mars and a source region east of Gale Crater, Nature Geoscience (2019). DOI: 10.1038/s41561-019-0331-9
Note: The above post is reprinted from materials provided by AFP .
Iron-oxidizing bacteria live in environments as extreme as the deep ocean and as common as roadside ditches. A recent paper in Frontiers proposes distributing the iron that these bacteria naturally produce to ‘fertilize’ phytoplankton and help remove excess carbon dioxide from the atmosphere. Credit: Bigelow Laboratory for Ocean Sciences
Distributing iron particles produced by bacteria could “fertilize” microscopic ocean plants and ultimately lower atmospheric carbon levels, according to a new paper in Frontiers.
“It is important that we explore ideas for climate change mitigation that can supplement the effects of decreasing carbon emissions,” said David Emerson, a senior research scientist at Bigelow Laboratory for Ocean Sciences and author of the paper. “The more ideas we test, the better decisions we can make for our planet’s future.”
Emerson’s paper proposes a novel way to provide iron to large areas of the ocean, 30 percent of which is poor in the essential element. This method takes advantage of minerals synthesized by iron-oxidizing bacteria, which feed on the tiny spark of energy they generate by transferring electrons between iron and oxygen. This process produces rust minerals as byproducts, which are of the right chemical composition to be used by the tiny ocean plants called phytoplankton that help remove carbon dioxide from the atmosphere.
Iron-oxidizing bacteria live in environments as extreme as the deep ocean and as common as roadside ditches. Emerson believes that cultivating iron-oxidizing bacteria in shallow ponds could be a simple, inexpensive way to produce nanoparticles of iron that have specific properties needed to “fertilize” the ocean. Using iron fertilization as a climate change mitigation tool was first proposed in the 1990s, and Emerson believes implementing a controlled research program is the next step in exploring its efficacy.
“This research has tremendous potential to integrate disciplines from phytoplankton ecology, to atmospheric science, to engineering,” Emerson said. “At minimum, we would gain a better sense of how the ocean works. At best, iron additions would act on a short time scale to help mitigate climate change.”
Most iron enters the ocean as dust that blows seaward from the Sahara and other major deserts. Emerson believes that using aircraft to distribute a fine iron powder over deficient ocean regions would approximate natural iron inputs. Timing flights with seasonal phytoplankton “blooms” would stimulate growth and boost populations.
Phytoplankton live in the sunlit upper layer of the ocean, which is kept in chemical equilibrium with the atmosphere through constant exchanges between the air and sea. They grow using carbon dissolved in the upper ocean. When they die, some of the phytoplankton sink, sending that carbon to the deep ocean, where it remains for thousands of years. As this cycle pumps carbon into the remote ocean depths, more atmospheric carbon diffuses into the upper ocean. Stimulating phytoplankton growth with iron fertilization could ramp up this process, ultimately shuttling more of the excess atmospheric carbon into the deep ocean.
“In addition to cutting carbon emissions, we need to remove more carbon from the atmosphere to limit global climate change,” Emerson said. “These geoengineering approaches are not solutions to the whole problem, but they are potential ways we can mitigate the worst effects.”
Evidence in the geologic record indicates that the amount of iron captured by the ocean may have helped moderate global climate in the past and played an important role in controlling earlier ice ages. When events like volcanic eruptions add large amounts of iron to the atmosphere, they may have the effect of fertilizing the ocean—increasing phytoplankton activity and ultimately carbon drawdown.
“It’s important to start investing in thoughtful and extensive research programs now,” Emerson said. “The worst thing would be if, in several decades, people faced with horrible consequences of climate change started taking dramatic action without understanding the long-term effects. We need to explore and develop a continuum of solutions, from actions we can take as individuals to large-scale efforts.”
Reference:
David Emerson, Biogenic Iron Dust: A Novel Approach to Ocean Iron Fertilization as a Means of Large Scale Removal of Carbon Dioxide From the Atmosphere, Frontiers in Marine Science (2019). DOI: 10.3389/fmars.2019.00022
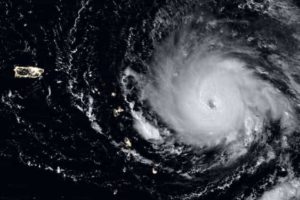
Hurricane Irma forming over the Atlantic Ocean in September 2017. A new study finds that volcanic eruptions can influence the strength and frequency of hurricanes around the world. Credit: NASA
A new study led by Lamont-Doherty Earth Observatory researcher Suzana Camargo and Université du Québec à Montréal’s Francesco Pausata provides deeper insight into how large volcanic eruptions affect hurricane activity.
Previous studies could not clearly determine the effects of volcanic eruptions on hurricanes, because the few large volcanic eruptions in the last century coincided with El Niño-Southern Oscillation events, which also influence hurricane activity.
In the study published today in the Proceedings of the National Academy of Sciences of the United States of America, Camargo and Pausata approached this relationship by simulating very large volcanic eruptions in the tropics multiple times. Their modeling told a more complex story than previous papers had indicated.
“This is the first study to explain the mechanism of how large volcanic eruptions influences hurricanes globally,” said Camargo.
According to their findings, large tropical volcanic eruptions can affect hurricanes by shifting the Intertropical Convergence Zone, a region that circles the Earth near the Equator and greatly influences rainfall and hurricane activity.
As the Intertropical Convergence Zone moves after a large volcanic eruption, it affects both the intensity and frequency of hurricanes, causing some regions to experience an increase in activity and other regions to experience a decrease. For example, a large eruption in the tropical regions of the Northern Hemisphere leads to a southward shift of the Intertropical Convergence Zone.
This results in an increase in hurricane activity between the Equator and the 10°N line, and a decrease further north. The zone’s southward shift has further effects in the Southern Hemisphere, causing a decrease in activity on the coasts of Australia, Indonesia, and Tanzania, while Madagascar and Mozambique experience an increase. These changes can last for up to four years following the eruption.
Camargo and Pausata were able to separate the effects of volcanic eruptions and El Niño-Southern Oscillation on hurricane activity and show the different impacts that the two factors have on hurricanes globally. Their findings are important in helping scientists better understand the relationship between volcanoes and hurricanes.
Reference:
Francesco S. R. Pausata et al. Tropical cyclone activity affected by volcanically induced ITCZ shifts, Proceedings of the National Academy of Sciences (2019). DOI: 10.1073/pnas.1900777116
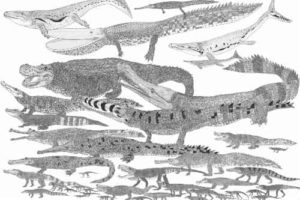
Crocodylomorphs were a highly morphologically and ecologically diverse clade. These extinct crocodile relatives had a much richer variety of skull shapes than living crocodilians, suggesting a wide range of feeding strategies. Credit: Darren Naish, Tetrapod Zoology
Ancient aquatic crocodiles fed on softer and smaller prey than their modern counterparts and the evolution of skull shape and function allowed them to spread into new habitats, reveal paleobiology researchers from the University of Bristol and UCL.
For the study, published today in Paleontology, the team digitally reconstructed the skull of an extinct species of marine crocodile and compared it to similar living species to gain new insights into the diet of ancient crocodiles and their role in ecosystems around 230 million years ago.
Modern crocodiles are known for their characteristic anatomy and apex predator role in semiaquatic ecosystems but their ancient ancestors, which lived side-by-side with the first dinosaurs in the Late Triassic period, were tiny land-dwellers that soon gave rise to a great diversity of forms.
One group, the thalattosuchians, went into the sea and became marine specialists. They had long, thin snouts, resembling that of the living gharial, which feeds on fish in rivers in India. An early member of this group, Pelagosaurus typus, inhabited shallow marine environments in what is now Europe during the Early Jurassic.
By looking at the different shapes of their skulls, scientists were able to work out what crocodiles were eating. As reported in the journal Palaeontology today, the biomechanical and macro-evolutionary approaches applied during this latest study show how ancient crocodiles came to occupy diverse and specialized ecological niches.
Ph.D. student Antonio Ballell, from the University of Bristol’s School of Earth Sciences and lead author of the study, said: “We used up-to-date techniques to explore how the skull of these extinct crocodilians functioned and evolved. Our first aim was to compare how the skull stressed and strained under simulated feeding loads in Pelagosaurus compared to the living gharial and gain new understanding of how the extinct species fed.”
Using modern computational methods, coupled with 3-D digital skull models obtained from CT scans of Pelagosaurus and the gharial, the research team was able to look for muscle scars in the fossils that mark where the muscles once attached to reconstruct the jaw-closing musculature.
This approach was coupled with finite element analysis, an engineering technique that predicts how biological structures behave under specific loading scenarios such as feeding loads.
Co-author, Dr. Laura Porro from UCL Cell and Development Biology, said “Modern computational techniques allow palaeobiologists to ‘bring extinct species back to life’ and infer how they fed and lived from the anatomical information provided by fossils. Using CT scans, we are able to visualise internal areas of the skull and scars on the bones, indicating where muscles attached, that scientists had never observed before. Engineering methods allowed us to test how the skull responds to biting, 230 million years after this animal’s last meal.”
Their results show that the weaker jaw of Pelagosaurus might indicate that it specialized on softer and smaller prey than the modern gharial.
The team also analysed how fast feeding-related characters of the jaws evolved in a wide range of extinct crocodilian species. This showed that traits related to the long snouts of thalattosuchians evolved rapidly, suggesting that they occupied a very specific marine ecological niche soon after the origin of the lineage.
Co-author Dr. Benjamin Moon from the University of Bristol added: “Pelagosaurus and closely related species differ from other crocs in their slender lower jaws, and this helped their evolutionary success in the Early Jurassic, when marine ecosystems were still recovering from the devastating End-Triassic mass extinction.”
The study contributes to the increasing understanding of functional evolution of crocodylomorphs and the ecological dynamics of Mesozoic marine reptiles.
Antonio Ballell concluded: “Our findings highlight the spectacular diversity of feeding strategies present in extinct crocodile relatives and how this was important in the evolution and diversification of the group. We found that different lineages explored and conquered ecological niches in different ways.
“The evolutionary history of crocodiles was very complex and looking at it from a functional perspective is fundamental to understand it”.
Reference:
Antonio Ballell et al. Convergence and functional evolution of longirostry in crocodylomorphs, Palaeontology (2019). DOI: 10.1111/pala.12432
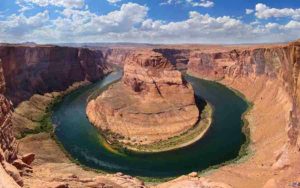
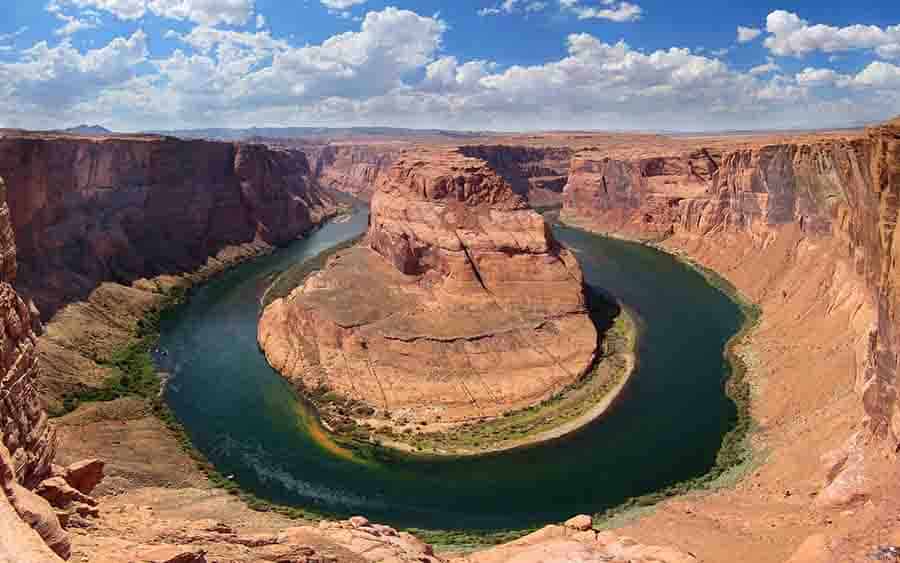
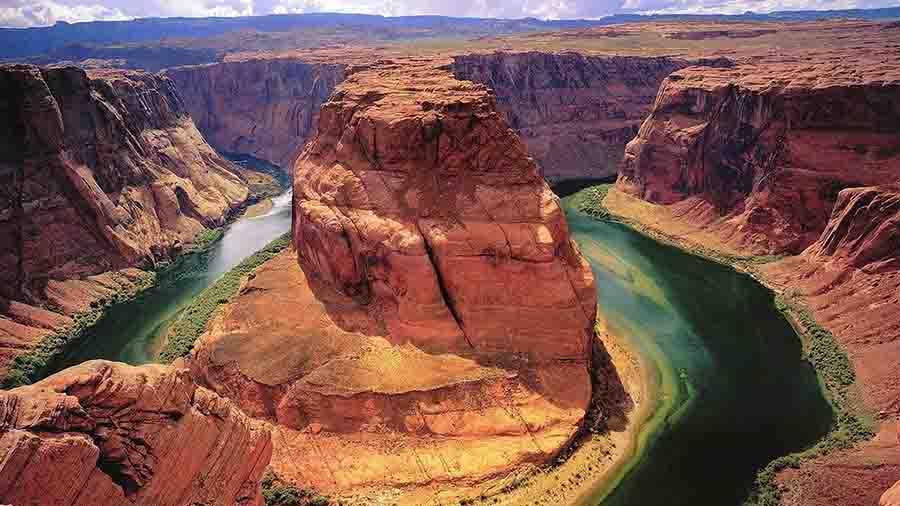
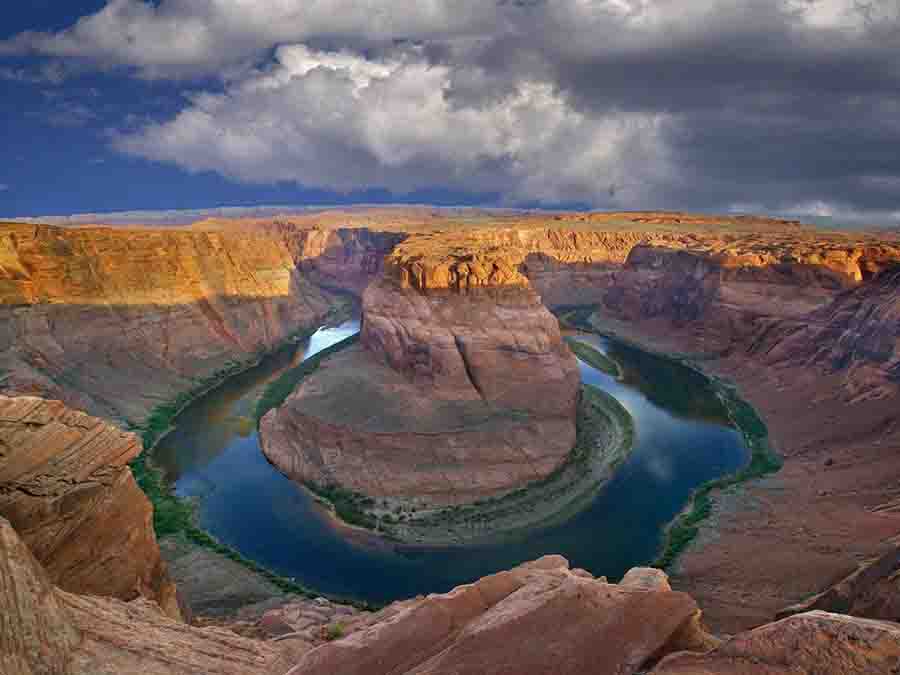
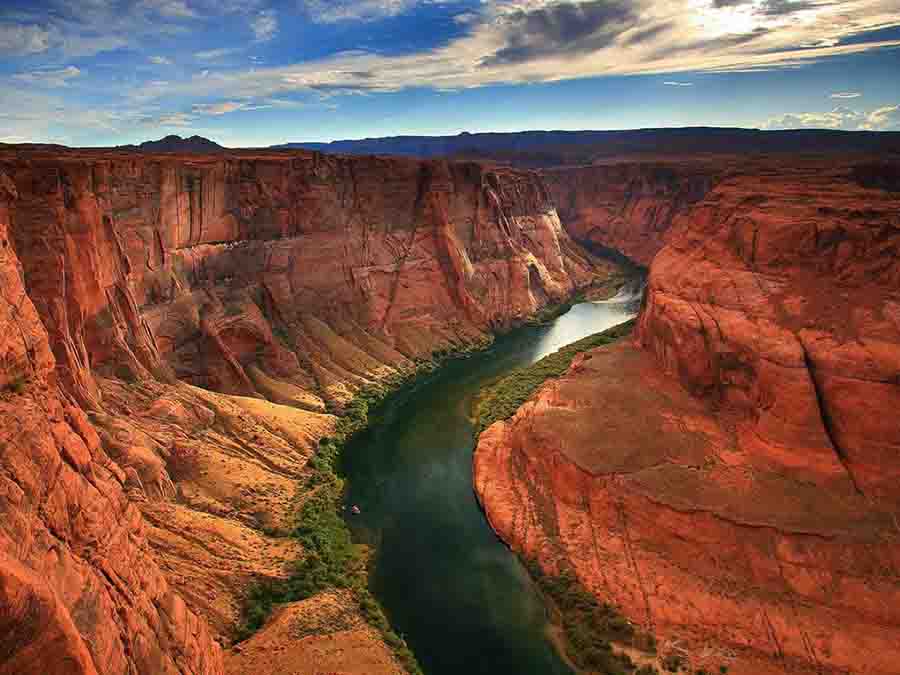
Horseshoe Bend is a horseshoe-shaped incised meander of the Colorado River located near the town of Page, Arizona, in the United States.
Horseshoe Bend is located 5 miles (8.0 km) downstream from the Glen Canyon Dam and Lake Powell within Glen Canyon National Recreation Area, about 4 miles (6.4 km) southwest of Page.
It is accessible via hiking a 1.5-mile (2.4 km) round trip from U.S. Route 89. Horseshoe Bend can be viewed from the steep cliff above.
The overlook is 4,200 feet (1,300 m) above sea level, and the Colorado River is at 3,200 feet (980 m) above sea level, making it a 1,000-foot (300 m) drop.
The rock walls of Horseshoe Bend contain hematite, platinum, garnet, and other minerals.
How to get there
Horseshoe Bend is just south of Page, Arizona. From the Glen Canyon Dam on US-89 head south for 5.1 miles. You’ll pass along the edge of Page, Arizona. At around 5 miles from the Glen Canyon Dam, you’ll see a sign for Horseshoe Bend Overlook. Turn right into parking area. If coming from the south, take US-89 north to Page, Arizona and before coming into town you’ll see a Horseshoe Bend Overlook sign. Turn left into the parking lot.
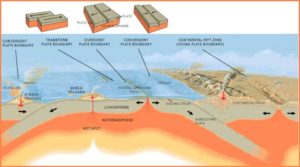
This image shows the three main types of plate boundaries: divergent, convergent, and transform. Image courtesy of the U.S. Geological Survey.
What are Plate Boundaries?
Plate boundaries are the edges where two plates meet. Most geologic activities, including volcanoes, earthquakes, and mountain building, take place at plate boundaries. “Read More about: What is Plate Tectonics? “
What are the 4 types of plate boundary?
There are four types of plate boundaries: Divergent boundaries — where new crust is generated as the plates pull away from each other. Convergent boundaries — where crust is destroyed as one plate dives under another.
Divergent boundaries: where new crust is generated as the plates pull away from each other.
Convergent boundaries: where crust is destroyed as one plate dives under another.
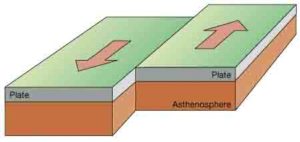
Transform boundaries: where crust is neither produced nor destroyed as the plates slide horizontally past each other.
Plate boundary zones: broad belts in which boundaries are not well defined and the effects of plate interaction are unclear.
Plate Boundary Types
Divergent boundary (Constructive)
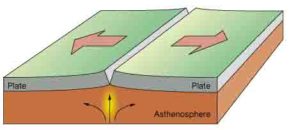
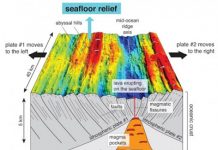
Occurs when two tectonic plates move away from each other. Along these boundaries, lava spews from long fissures and geysers spurt superheated water. Frequent earthquakes strike along the rift. Beneath the rift, magma—molten rock—rises from the mantle.
Divergent plate boundaries
It oozes up into the gap and hardens into solid rock, forming new crust on the torn edges of the plates. Magma from the mantle solidifies into basalt, a dark, dense rock that underlies the ocean floor. Thus at divergent boundaries, oceanic crust, made of basalt, is created.
Convergent boundary (Destructive)
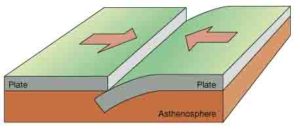
Convergent plate boundaries
When two plates come together, The impact of the two colliding plates buckles the edge of one or both plates up into a rugged mountain range, and sometimes bends the other down into a deep seafloor trench. A chain of volcanoes often forms parallel to the boundary, to the mountain range, and to the trench. Powerful earthquakes shake a wide area on both sides of the boundary.
If one of the colliding plates is topped with oceanic crust, it is forced down into the mantle where it begins to melt. Magma rises into and through the other plate, solidifying into new crust. Magma formed from melting plates solidifies into granite, a light colored, low-density rock that makes up the continents. Thus at convergent boundaries, continental crust, made of granite, is created, and oceanic crust is destroyed.
Transform boundaries (Conservative)
Transform plate boundaries
Two plates sliding past each other, Natural or human-made structures that cross a transform boundary are offset—split into pieces and carried in opposite directions. Rocks that line the boundary are pulverized as the plates grind along, creating a linear fault valley or undersea canyon. As the plates alternately jam and jump against each other, earthquakes rattle through a wide boundary zone. In contrast to convergent and divergent boundaries, no magma is formed. Thus, crust is cracked and broken at transform margins, but is not created or destroyed.
Plate boundary zones
Plate boundary zones occur where the effects of the interactions are unclear, and the boundaries, usually occurring along a broad belt, are not well defined and may show various types of movements in different episodes.
Cretaceous-Paleogene clay in the Geulhemmergroeve tunnels near Geulhem, The Netherlands. Credit: Mark A. Wilson
What is K-T Boundary?
The Cretaceous–Tertiary extinction event, now called the Cretaceous–Palaeogene extinction event. It may be called the K/T extinction event or K/Pg event for short. This is the famous event which killed the dinosaurs at the end of the Cretaceous period.
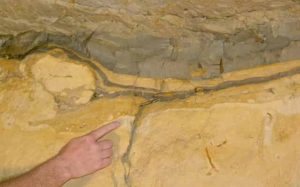
Sixty-five million years ago about 70% of all species then living on Earth disappeared within a very short period. The disappearances included the last of the great dinosaurs. Paleontologists speculated and theorized for many years about what could have caused this “mass extinction,” known, as the K-T event (Cretaceous-Tertiary Mass Extinction event). Then in 1980 Alvarez, Alvarez, Asaro, and Michel reported their discovery that the peculiar sedimentary clay layer that was laid down at the time of the extinction showed an enormous amount of the rare element iridium.
First seen in the layer near Gubbio, Italy, the same enhancement was soon discovered to be world wide in that one particular 1-cm (0.4-in.) layer, both on land and at sea. The Alvarez team suggested that the enhancement was the product of a huge asteroid impact. On Earth most of the iridium and a number of other rare elements such as platinum, osmium, ruthenium, rhodium, and palladium are believed to have been carried down into Earth’s core, along with much of the iron, when Earth was largely molten.
Primitive “chondritic” meteorites (and presumably their asteroidial parents) still have the primordial solar system abundances of these elements. A chondritic asteroid 10 km (6 mi.) in diameter would contain enough iridium to account for the worldwide clay layer enhancement. This enhancement appears to hold for the other elements mentioned as well.
Since the original discovery, many other pieces of evidence have come to light that strongly support the impact theory. The high temperatures generated by the impact would have caused enormous fires, and indeed soot is found in the boundary clays. A physically altered form of the mineral quartz that can only be formed by the very high pressures associated with impacts has been found in the K-T layer.
Geologists who preferred other explanations for the K-T event said, “show us the crater.” In 1990 a cosmochemist named Alan Hildebrand became aware of geophysical data taken 10 years earlier by geophysicists looking for oil in the Yucatan region of Mexico. There a 180-km (112-mi.) diameter ring structure called “Chicxulub” seemed to fit what would be expected from a 65-million-year-old impact, and further studies have largely served to confirm its impact origin. The Chicxulub crater has been age dated (by the 40Ar/39Ar method) at 65 million years! Such an impact would cause enormous tidal waves, and evidence of just such waves at about that time has been found all around the Gulf.
One can never prove that an asteroid impact “killed the dinosaurs.” Many species of dinosaurs (and smaller flora and fauna) had in fact died out over the millions of years preceding the K-T events. The impact of a 10-km asteroid would most certainly have been an enormous insult to life on Earth. Locally, there would have been enormous shock wave heating and fires, tremendous earthquake, hurricane winds, and trillions of tons of debris thrown everywhere. It would have created months of darkness and cooler temperatures globally. There would have been concentrated nitric acid rains worldwide. Sulfuric acid aerosols may have cooled Earth for years. Life certainly could not have been easy for those species which did survive. Fortunately such impacts occur only about once every hundred million years.
What killed the dinosaurs?
Dinosaur fossils are only found below the K/T boundary. This shows they became extinct before, or during the event. Mosasaurs, plesiosaurs, pterosaurs and many species of plants and invertebrates also became extinct.
Mammalian and bird groups got through the event with some extinctions. Those that survived became widespread and varied during their later evolutionary radiation.
Scientists think the K/T extinctions were caused by something sudden and powerful, such as one or more massive asteroid or meteor impacts, and increased volcanic activity.
Scientists study what happened to the dinosaurs and other groups to learn what caused the K/T extinction event. How quickly they died out around the world is an important clue.
Scientists also study patterns in rocks to learn the causes. Several impact craters and massive volcanic activity, such as that in the Deccan Traps in India, are dated to about the same time as the extinctions. Those impacts and volcanoes would have reduced sunlight and hindered photosynthesis, disrupting Earth’s ecology.