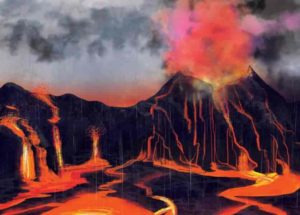
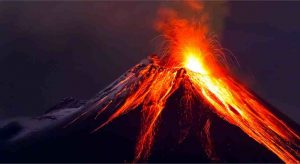
A volcano erupts in a driving rain. Credit: Illustration/Margaret Weiner/UC Creative Services
Biggest Mass Extinction
Researchers say mercury buried in ancient rock provides the strongest evidence yet that volcanoes caused the biggest mass extinction in the history of the Earth.
The extinction 252 million years ago was so dramatic and widespread that scientists call it “the Great Dying.” The catastrophe killed off more than 95 percent of life on Earth over the course of hundreds of thousands of years.
Paleontologists with the University of Cincinnati and the China University of Geosciences said they found a spike in mercury in the geologic record at nearly a dozen sites around the world, which provides persuasive evidence that volcanic eruptions were to blame for this global cataclysm.
The study was published this month in the journal Nature Communications.
The eruptions ignited vast deposits of coal, releasing mercury vapor high into the atmosphere. Eventually, it rained down into the marine sediment around the planet, creating an elemental signature of a catastrophe that would herald the age of dinosaurs.
“Volcanic activities, including emissions of volcanic gases and combustion of organic matter, released abundant mercury to the surface of the Earth,” said lead author Jun Shen, an associate professor at the China University of Geosciences.
The mass extinction occurred at what scientists call the Permian–TriassicBoundary. The mass extinction killed off much of the terrestrial and marine life before the rise of dinosaurs. Some were prehistoric monsters in their own right, such as the ferocious gorgonopsids that looked like a cross between a sabre-toothed tiger and a Komodo dragon.
The eruptions occurred in a volcanic system called the Siberian Traps in what is now central Russia. Many of the eruptions occurred not in cone-shaped volcanoes but through gaping fissures in the ground. The eruptions were frequent and long-lasting and their fury spanned a period of hundreds of thousands of years.
“Typically, when you have large, explosive volcanic eruptions, a lot of mercury is released into the atmosphere,” said Thomas Algeo, a professor of geology in UC’s McMicken College of Arts and Sciences.
“Mercury is a relatively new indicator for researchers. It has become a hot topic for investigating volcanic influences on major events in Earth’s history,” Algeo said.
Researchers use the sharp fossilized teeth of lamprey-like creatures called conodonts to date the rock in which the mercury was deposited. Like most other creatures on the planet, conodonts were decimated by the catastrophe.
The eruptions propelled as much as 3 million cubic kilometers of ash high into the air over this extended period. To put that in perspective, the 1980 eruption of Mount St. Helens in Washington sent just 1 cubic kilometer of ash into the atmosphere, even though ash fell on car windshields as far away as Oklahoma.
In fact, Algeo said, the Siberian Traps eruptions spewed so much material in the air, particularly greenhouse gases, that it warmed the planet by an average of about 10 degrees centigrade.
The warming climate likely would have been one of the biggest culprits in the mass extinction, he said. But acid rain would have spoiled many bodies of water and raised the acidity of the global oceans. And the warmer water would have had more dead zones from a lack of dissolved oxygen.
“We’re often left scratching our heads about what exactly was most harmful. Creatures adapted to colder environments would have been out of luck,” Algeo said. “So my guess is temperature change would be the No. 1 killer. Effects would exacerbated by acidification and other toxins in the environment.”
Stretching over an extended period, eruption after eruption prevented the Earth’s food chain from recovering.
“It’s not necessarily the intensity but the duration that matters,” Algeo said. “The longer this went on, the more pressure was placed on the environment.”
Likewise, the Earth was slow to recover from the disaster because the ongoing disturbances continued to wipe out biodiversity, he said.
Earth has witnessed five known mass extinctions over its 4.5 billion years.
Scientists used another elemental signature — iridium — to pin down the likely cause of the global mass extinction that wiped out the dinosaurs 65 million years ago. They believe an enormous meteor struck what is now Mexico.
The resulting plume of superheated earth blown into the atmosphere rained down material containing iridium that is found in the geologic record around the world.
Shen said the mercury signature provides convincing evidence that the Siberian Traps eruptions were responsible for the catastrophe. Now researchers are trying to pin down the extent of the eruptions and which environmental effects in particular were most responsible for the mass die-off, particularly for land animals and plants.
Shen said the Permian extinction could shed light on how global warming today might lead to the next mass extinction. If global warming, indeed, was responsible for the Permian die-off, what does warming portend for humans and wildlife today?
“The release of carbon into the atmosphere by human beings is similar to the situation in the Late Permian, where abundant carbon was released by the Siberian eruptions,” Shen said.
Algeo said it is cause for concern.
“A majority of biologists believe we’re at the cusp of another mass extinction — the sixth big one. I share that view, too,” Algeo said. “What we should learn is this will be serious business that will harm human interests so we should work to minimize the damage.”
People living in marginal environments such as arid deserts will suffer first. This will lead to more climate refugees around the world.
“We’re likely to see more famine and mass migration in the hardest hit places. It’s a global issue and one we should recognize and proactively deal with. It’s much easier to address these problems before they reach a crisis.”
Reference:
Jun Shen, Jiubin Chen, Thomas J. Algeo, Shengliu Yuan, Qinglai Feng, Jianxin Yu, Lian Zhou, Brennan O’Connell, Noah J. Planavsky. Evidence for a prolonged Permian–Triassic extinction interval from global marine mercury records. Nature Communications, 2019; 10 (1) DOI: 10.1038/s41467-019-09620-0
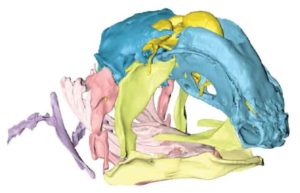
This is the overall anterolateral view of the skull of the Coelacanth’s foetus. The brain is in yellow. Credit: Dutel et al.
Coelacanth Latimeria Chalumnae
An international team of researchers presents the first observations of the development of the skull and brain in the living coelacanth Latimeria chalumnae. Their study, published in Nature, provides new insights into the biology of this iconic animal and the evolution of the vertebrate skull.
The coelacanth Latimeria is a marine fish closely related to tetrapods, four-limbed vertebrates including amphibians, mammals and reptiles. Coelacanths were thought to have been extinct for 70 million years, until the accidental capture of a living specimen by a South African fisherman in 1938. Eighty years after its discovery, Latimeria remains of scientific interest for understanding the origin of tetrapods and the evolution of their closest fossil relatives — the lobe-finned fishes.
One of the most unusual features of Latimeria is its hinged braincase, which is otherwise only found in many fossil lobe-finned fishes from the Devonian period (410-360 million years ago). The braincase of Latimeria is completely split into an anterior and posterior portion by a joint called the “intracranial joint.” In addition, the brain lies far at the rear of the braincase and takes up only 1% of the cavity housing it. This mismatch between the brain and its cavity is totally unequalled among living vertebrates. How the coelacanth skull grows and why the brain remains so small has puzzled scientists for years. To answer these questions, researchers studied specimens at different stages of cranial development from several public natural history collections.
Although many specimens of adult coelacanths are available in natural history collections, earlier life stages such as fetuses are extremely rare. Scientists hence used state-of-the-art imaging techniques to visualize the internal anatomy of the specimens without damaging them. They notably digitalized a 5 cm-long fetus, the earliest developmental stage available for Latimeria, with synchrotron X-ray microtomography at the European Synchrotron (ESRF). Over the last two decades, the ESRF has developed unique expertise in designing non-invasive techniques widely used for evolutionary biology studies.
In addition, the researchers also imaged other stages with a powerful Magnetic Resonance Imaging (MRI) scanner at the Brain and Spine Institute (Paris, France), and a conventional X-ray micro-CTscan at the Muséum national d’Histoire naturelle (Paris, France). These data were used to generate detailed 3D models, which allowed scientists to describe how the form of the skull, the brain and the notochord (a tube extending below the brain and the spinal cord in the early stages of life) changes from a fetus to an adult.
They also observed how these structures are positioned relative to each other at each stage, and compared their observations with what is known about the formation of the skull in other vertebrates.
In contrast to most other vertebrates, where the notochord is replaced by the vertebral column early in embryonic development, the notochord expands considerably in Latimeria. The dramatic enlargement of the notochord likely influences the patterning of the braincase, and might underpin the formation of the intracranial joint. The brain might also be affected by the enlargement of the notochord, as relative size dramatically decreases during development.
These results illuminate for the first time the development of the living coelacanth skull and brain, and open up new avenues for research on the evolution of the vertebrate head.
Hugo Dutel, lead author and research associate in palaeobiology at the University of Bristol, UK, says, “These are very unique observations, but they represent only a tiny step forward compared to the amount we know on the development of other species. There are still more questions than answers! Latimeria still holds many clues for our understanding of vertebrate evolution, and it is important to protect this threatened species and its environment.”
Reference:
Dutel, H., Galland, M., Tafforeau, P., Long, J.A., Fagan, M.J., Janvier, P., Herrel, A., Santin, M.D., Clément, G., Herbin, M. Neurocranial development of the coelacanth and the evolution of the sarcopterygian head. Nature, 2019 DOI: 10.1038/s41586-019-1117-3
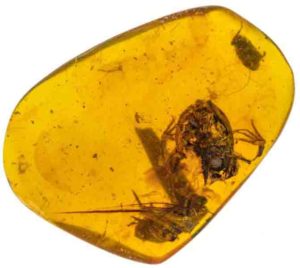
Representative Image: The best-preserved fossil of the group includes the skull, forelimbs, part of a backbone and a partial hind limb of a small, juvenile frog now known as Electrorana limoae. Next to its hindlimb is an unidentified beetle. Credit: Lida Xing/China University of Geosciences
Geologic time scales are critical to understanding the timing, duration, and connection of geologic events. They are not static, and can be improved with research, integration, and refinements realized from biostratigraphic repetitive analysis. Over the past century they have proven important tools in petroleum exploration and studies of climatic and geologic events. Still, many geologists may not know the importance of microfossils to the construction of time scales and biostratigraphy.
Biostratigraphy was first applied by the petroleum industry nearly a century ago in the U.S. Gulf of Mexico (GoM) to help understand the geology of this structurally and stratigraphically complex basin. Nevertheless, only a few industrial time scales have been published for this region. BP conducted a multi-decade microfossil research program (circ. 2000) to produce an integrated planktonic foraminifera and calcareous nannofossil deep-water GoM time scale. This integrated framework was constructed from the heritage time scales of BP (Amoco, Arco) and the analyses of hundreds of GoM wells over several decades.
Today, the culmination of this research is the BP Gulf of Mexico Neogene Astronomically-Tuned Time Scale (BP GNATTS) that spans the past 25 million year record from the Late Oligocene (25.05 million years ago) to recent time. This time scale was primarily calibrated utilizing an orbitally tuned composite section from Ocean Drilling Program Leg 154 on Ceará Rise and provides a stratigraphic resolution (number of events per unit of geologic time) of 144 thousand years. This is approximately double that of published GoM time scales and a fivefold increase over the highest resolution global calcareous microfossil timescales.
The resolution of this time scale has provided a valuable aid in seismic correlations between GoM mini-basins. When applied and integrated with geological and geophysical data it has helped reveal subsurface details through detection of unconformities (missing time), sediment redeposition, slumps, faults, and sand to sand correlation.
The BP GNATTS has been successfully tested outside of the GoM in the Mediterranean Sea, and with a resolution comparable to eccentricity (~120 thousand years), it lends itself as a possible tool for better calibration of global records of sea level and paleoclimatic events. One of the most compelling results of this work is best illuminated in the paper’s final sentence. “Results presented here lend conviction to the promise that microfossil biostratigraphy is far from the end of its constructive growth, rather it is a discipline with great current utility and with a realistic expectation for developing new and exciting applications.”
Reference:
J.A. Bergen, S. Truax III, E. de Kaenel, S. Blair, E. Browning, J. Lundquist, T. Boesiger, M. Bolivar, K. Clark. BP Gulf of Mexico Neogene Astronomically-tuned Time Scale (BP GNATTS). GSA Bulletin, 2019; DOI: 10.1130/B35062.1
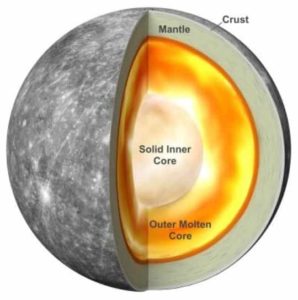
An illustration of Mercury’s interior based on new research that shows the planet has a solid inner core. Credit: Antonio Genova
Mercury Have Metallic Cores
Scientists have long known that Earth and Mercury have metallic cores. Like Earth, Mercury’s outer core is composed of liquid metal, but there have only been hints that Mercury’s innermost core is solid. Now, in a new study, scientists report evidence that Mercury’s inner core is indeed solid and that it is very nearly the same size as Earth’s solid inner core.
Some scientists compare Mercury to a cannonball because its metal core fills nearly 85 percent of the volume of the planet. This large core — huge compared to the other rocky planets in our solar system — has long been one of the most intriguing mysteries about Mercury. Scientists had also wondered whether Mercury might have a solid inner core.
The findings of Mercury’s solid inner core, published in AGU’s journal Geophysical Research Letters, help scientists better understand Mercury but also offer clues about how the solar system formed and how rocky planets change over time.
“Mercury’s interior is still active, due to the molten core that powers the planet’s weak magnetic field, relative to Earth’s,” said Antonio Genova, an assistant professor at Sapienza University of Rome who led the research while at NASA Goddard Space Flight Center in Greenbelt, Maryland. “Mercury’s interior has cooled more rapidly than our planet’s. Mercury may help us predict how Earth’s magnetic field will change as the core cools.”
To figure out what Mercury’s core is made of, Genova and his colleagues had to get, figuratively, closer. The team used several observations from NASA’s MESSENGER mission to probe Mercury’s interior. The researchers looked, most importantly, at the planet’s spin and gravity.
The MESSENGER spacecraft entered orbit around Mercury in March 2011 and spent four years observing this nearest planet to our Sun until it was deliberately brought down to the planet’s surface in April 2015.
Scientists used radio observations from MESSENGER to determine Mercury’s gravitational anomalies (areas of local increases or decreases in mass) and the location of its rotational pole, which allowed them to understand the orientation of the planet.
Each planet spins on an axis, also known as the pole. Mercury spins much more slowly than Earth, with its day lasting about 58 Earth days. Scientists often use tiny variations in the way an object spins to reveal clues about its internal structure. In 2007, radar observations made from Earth revealed small shifts in Mercury’s spin, called librations, that proved some of the planet’s core must be liquid-molten metal. But observations of the spin rate alone were not sufficient to give a clear measurement of what the inner core was like. Could there be a solid core lurking underneath, scientists wondered?
Gravity can help answer that question. “Gravity is a powerful tool to look at the deep interior of a planet because it depends on the planet’s density structure,” said Sander Goossens, a researcher at NASA Goddard and co-author of the new study.
As MESSENGER orbited Mercury over the course of its mission and got closer and closer to the surface, scientists recorded how the spacecraft accelerated under the influence of the planet’s gravity. The density structure of a planet can create subtle changes in a spacecraft’s orbit. In the later parts of the mission, MESSENGER flew about 120 miles above the surface, and less than 65 miles during its last year. The final low-altitude orbits provided the best data yet and allowed for Genova and his team to make the most accurate measurements about the internal structure of Mercury yet taken.
Genova and his team put data from MESSENGER into a sophisticated computer program that allowed them to adjust parameters and figure out what the interior composition of Mercury must be like to match the way it spins and the way the spacecraft accelerated around it. The results showed that for the best match, Mercury must have a large, solid inner core. They estimated that the solid, iron core is about 1,260 miles (2,000 kilometers) wide and makes up about half of Mercury’s entire core (about 2,440 miles, or nearly 4,000 kilometers, wide). In contrast, Earth’s solid core is about 1,500 miles (2,400 kilometers) across, taking up a little more than a third of this planet’s entire core.
“We had to pull together information from many fields: geodesy, geochemistry, orbital mechanics and gravity to find out what Mercury’s internal structure must be,” said Erwan Mazarico, a planetary scientist at NASA Goddard and co-author of the new study.
The fact that scientists needed to get close to Mercury to find out more about its interior highlights the power of sending spacecraft to other worlds, according to the researchers. Such accurate measurements of Mercury’s spin and gravity were simply not possible to make from Earth. New discoveries about Mercury are practically guaranteed to be waiting in MESSENGER’s archives, with each discovery about our local planetary neighborhood giving us a better understanding of what lies beyond.
“Every new bit of information about our solar system helps us understand the larger universe,” Genova said.
Reference:
Antonio Genova, Sander Goossens, Erwan Mazarico, Frank G. Lemoine, Gregory A. Neumann, Weijia Kuang, Terence J. Sabaka, Steven A. Hauck, David E. Smith, Sean C. Solomon, Maria T. Zuber. Geodetic Evidence That Mercury Has A Solid Inner Core. Geophysical Research Letters, 2019; DOI: 10.1029/2018GL081135
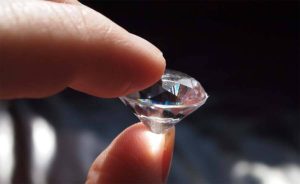
Diamond cutting is the practice of transforming a diamond into a faceted gem from a rough stone. Due to its extreme difficulty, cutting diamonds requires specialized knowledge, tools, equipment and techniques.
The first diamond cutter and polisher guild (diamantaire) was formed in Nuremberg, Germany in 1375 and resulted in the development of different “cut” types. In relation to diamonds, this has two meanings. The first of these is the shape: square, oval, etc.
The second concerns the specific quality of cutting within the shape, and the quality and price will vary considerably depending on the quality of cutting. Because diamonds are one of the hardest materials, they use special diamond – coated surfaces to grind down the diamond.
Diamond cutting is concentrated in a few cities around the world, as well as overall processing. Antwerp, Tel Aviv, and Dubai are the main diamond trading centers from where roughs are sent to India and China’s main processing centers.
Diamonds are cut and polished in Surat, India and the Chinese cities of Guangzhou and Shenzhen. India has held 19 – 31 % of the world’s polished diamond market in recent years and China has held 17 percent of the world’s market share in the last year. New York City is another major diamond center.
Are Diamonds Cut by Hand or Machine?
By Hand And Machine. The process of cutting diamonds. Upon arrival of a rough diamond in India, New York, Antwerp, or elsewhere, a highly trained diamond cutter either cuts it by hand or using a machine. Despite the fact that diamond cutting machines are highly accurate and useful, hand cutting a diamond is an incredible craft work.
How Long Does It Take To Cut a Diamond?
The saw can cut through a 1-carat rough diamond in 4 to 8 hours, but it can take much longer if it hits a knot.
Where Are Diamonds Cut and Polished?
In South Africa, Belgium, China, Israel, Russia and the United States, apart from India, diamond cutting and polishing takes place. It takes great skill to cut a rough diamond. In the four Cs used to measure the value of a diamond, it is an integral step.
What are Diamond Cutting Process Stages?
The following steps include a simplified round brilliant cutting process:
Planning: Using computer software, modern day diamond planning is done.
Marking:outlining the best possible diamond shape and cut.
Sawing the rough stone:as not all diamonds are sawn depending on the shape of the rough diamond.
Table The girdle bruting.
Blocking 8 main pavilion facets: these facets are divided into 4 corners and 4 pavilions as the diamond’s atomic structure causes the corners and pavilions to run in different directions.
Crown: the crown is made up of eight main facets, divided into four corners and four bezels.
Final bruting: ensuring a perfectly round and smooth diamond girdle.
All 16 main facets are polished.
Brillianteering: 8 stars and 16 pavilions and 16 crown halves are added and polished.
Quality control: monitoring for symmetry, polishing and cutting (angles) after completion of the diamond.
How Diamond Cutting Is Done?
Diamond cutting is done by cleaning or sawing the diamond with a steel blade or a laser like the Sarine Quazer 3. The rough diamond is usually placed in a wax or cement mold to hold it in place and then cleaved along its tetrahedral plane, its weakest point. If no point of weakness exists, instead sawing is used. As new and better technology has become available, the process of cutting a diamond has changed over time.
A scaif, developed in the 1400s, was the first product that changed the way diamonds were handled. This was used to cut facets into diamonds and for the first time showed off the true beauty of a diamond. Diamond cutting was transformed using this machine to enable complex diamond shapes, cuts and designs that have never been seen before.
Once the stone is analyzed and cleaved, in one of three ways it must be bruted or girdled. The most common is when spinning axles set the cut diamonds opposite each other, turning in opposite directions so that the opposing diamonds grind against each other, breaking each other in a smooth and round shape.
It is also possible to bruise diamonds using lasers or grind them against a copper disk set with diamond dust that acts like a piece of sandpaper. The final step is polishing, followed by a final inspection, sometimes involving cleaning the diamond in acid to get a clear view.
The diamond is ready for grading and trading once the diamond cutting and polishing processes are complete.
How is Diamond Polished?
The next stage is to create and form the facets of the diamond once the rounded shape of the rough is formed. The cutter places the rough on a rotating arm and the rough is polished using a spinning wheel. This creates the diamond’s smooth and reflective facets.
Interestingly, this process of polishing is further divided into two steps: blocking and brillianting.
Blocking Process
In the blocking process, a single cut stone is made by adding 8 pavilion mains, 8 crowns, 1 culet and 1 table facet. This step is important in creating a template for the next stage.
Brillianteer Process
The brillianteer will then finish the job by adding and bringing it to a total of 57 facets in the remaining facets. He has great responsibility as at this stage the diamond’s fire and brilliance is determined.
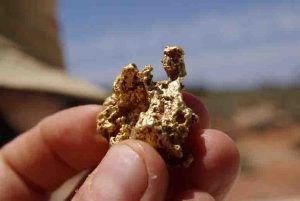
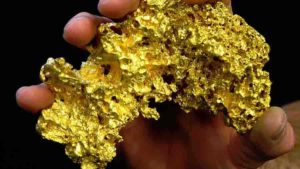
Gold nugget found in the field. Credit: University of Adelaide
Gold Mines In The United States
Since the discovery of gold at the Reed farm in North Carolina in 1799, gold mining in the United States has continued. The first documented occurrence of gold occurred in Virginia in 1782. Some minor gold production took place in North Carolina as early as 1793, but did not create excitement.
The discovery on the Reed farm in 1799 which was identified as gold in 1802 and subsequently mined marked the first commercial production.
Gold production on a large scale began in 1848 with the California Gold Rush.
In the autumn of 1942, the War Production Board Limitation Order No. 208’s closure of gold mines during World War II was a major impact on production until the end of the war.
Alabama
Around 1830 in Alabama, gold was discovered shortly after the Georgia Gold Rush. The main districts were Cleburne County’s Arbacochee district, mostly from placer deposits, and Tallapoosa County’s Hog Mountain district, which produced 24,000 troy ounces (750 kg) of schist veins.
Alaska
In 1848, Russian explorers discovered gold placer in the Kenai River, but gold was not produced. Gold mining began from placers southeast of Juneau in 1870.[7] From 1880 to the end of 2007, Alaska produced a total of 40,300,000 troy ounces (1,250,000 kg) of gold. In 2015, 873,984 troy ounces (27,183.9 kg) of gold were produced by Alaskan mines, 12.7 percent of US production.
Fort Knox mine, a large open pit and cyanide leaching operation in the mining district of Fairbanks, is the largest gold producer. Fort Knox produced gold in 2015 at 401,553 troy ounces (12,489.7 kg). The gold mines of Pogo (283,000 ounces) and Kensington (128,865 ounces) and the polymetallic mine of Greens Creek (60,566 ounces) accounted for the rest of the gold production in 2015.
Arizona
More than 16 million troy ounces (498 tons) of gold were produced by Arizona. It is reported that gold mining in Arizona began in 1774 when Spanish priest Manuel Lopez ordered the Indians of Papago to wash gravel gold on the flanks of the Quijotoa Mountains, Pima County.
Gold mining continued until 1849, when the California Gold Rush lured the Mexican miners away. Other gold mining under Spanish and Mexican rule was carried out in the Santa Cruz County district of Oro Blanco and the Pima County district of Arivaca.
California
Spanish prospectors found gold about ten miles north-east of Yuma, Arizona, in the Potholes district between 1775 and 1780, along the Colorado River, in present-day Imperial County, California. The gold from dry placers has been recovered. Other placer deposits were quickly found on the west bank of the Colorado River, including the districts of Picacho and Cargo Muchacho.
Placer gold deposits were found in 1828 in San Ysidro County, 1835 and 1842 in Los Angeles County, San Francisquito Canyon and Placerita Canyon.
California’s gold production peaked at 3.9 million troy ounces (121 tonnes) that year in 1852. But in the early years, the placer deposits worked were quickly exhausted, and production collapsed. Hardrock mining (called quartz mining in California) began in 1849 and hydraulic mining of placer started in 1852.
Colorado
During the Peak Gold Rush in the vicinity of present-day Denver in 1858, gold was discovered, but the deposits were small. In January 1859, the first major gold discoveries in Colorado were in the district of Central City-Idaho Springs.
Only one Colorado mine is still producing gold, the Cripple Creek & Victor Gold Mine in Victor near Colorado Springs, a Newmont Mining Corporation-owned open-pit heap leach operation that produced 360,000 troy ounces (11,000 kg) of gold in 2018.
Florida
During the late 19th century, at the site where Mike Roess Gold Head State Park is today, small amounts of gold were mined commercially in North Eastern Florida. There are no records of the amount of gold produced, but the finding was insufficient to keep the operation running commercially, and within a matter of months the small amount of pay dirt has been depleted.
Georgia
Georgia has a total historical production of gold from 1830 to 1959 of 871,000 troy ounces (27,100 kg). Although the state is not a gold producer at the moment, historically important.
Idaho
In 1860, at the juncture where Canal Creek meets Orofino Creek, Gold was first discovered in Idaho, in Pierce.
The leading historic gold-producing district is Boise Basin in Boise County, discovered in 1862, producing 2,9 million troy ounces (90,2 tonnes), mostly from placers.
The French district of Idaho County Creek-Florence began in the 1860s, producing about 1 million troy ounces (31 tonnes) from placers. The district of Silver City in Owyhee County started producing in 1863 and produced over 1 million troy ounces (31 tons), mostly from lode deposits.
The district of Coeur d’Alene in Shoshone County produced 44,000 troy ounces (1,400 kg) of gold as a by-product of silver mining.
The Silver Strand mine and the Bond mine were active gold mines in Idaho in 2006.
Maryland
Gold was reported as early as 1830 in Maryland, but the result was no production. Placer gold was discovered by California Union soldiers at Great Falls near Washington, DC in 1861 during the American Civil War. A number of mines were opened in Montgomery County on gold-bearing quartz veins after the war. Since 1951, there has been no gold production reported. There were about 6,000 troy ounces (190 kg) of total production.
Michigan
From the Ropes gold mine northeast of Ishpeming in Marquette County, Michigan, about 29,000 troy ounces (900 kg) of gold were produced. Originally operating from 1880 to 1897 and reopened from 1983–1989, the underground mine extracted gold in peridotite from quartz veins.
Montana
Gold was first discovered in 1852 in Montana, but mining did not start until 1862, when gold placers were found in 1862 in Bannack, Montana. The resulting gold rush resulted in more placer discoveries, including in 1863 in Virginia City, and in 1864 in Helena and Butte.[28 ] The Atlantic Cable Quartz Lode was located in 1867.
The Montana Tunnels mine and the Golden Sunlight mine are currently active hardrock gold mines. The Browns Gulch placer and the Confederate Gulch placer are active gold placers. The Stillwater igneous complex also produces gold from three platinum mines: the Stillwater mine, the Lodestar mine, and the East Boulder Project.
Nevada
Nevada is the nation’s leading gold producing state, producing 5,467,646 troy ounces (170,06 tons) in 2016, accounting for 81% of US gold and 5.5% of world production. Much of Nevada’s gold comes from large open pit mining and recovery from heap leaching.
Some of the major mining companies in the world, including Newmont Mining, Barrick Gold, and Kinross Gold, operate state-owned gold mines. Cortez, Twin Creeks, Betz-Post, Meikle, Marigold, Round Mountain, Jerritt Canyon and Getchell are active major mines.
New Mexico
Gold was first discovered in the “Old Placers” district of the Ortiz Mountains, Santa Fe County, New Mexico, in New Mexico in 1828. Following the discovery of placer gold, a nearby lode deposit was discovered.
Two prospectors collected float in 1877 near Hillsboro, New Mexico in the area of the future Opportunity Mine, which was tested at $160 per ton in gold and silver. In the nearby Rattlesnake vein, ore was soon discovered and a placer deposit of gold was found in the Rattlesnake and Wicks gulches in November. Before 1904, total production was about $6,750,000.
All gold production in New Mexico in 2007 (13,000 troy ounces (400 kg)) came from two large open pit mines in Grant County as a by-product of copper mining. Two primary gold mines are being prepared for production, however: the Rio Arriba County Northstar mine and the San Lorenzo Claims mine in Socorro County.
North Carolina
After the discovery of a 17-pound (7.7 kg) gold nugget by 12-year-old Conrad Reed in a stream at his father’s farm in 1799, North Carolina was the site of the first gold rush in the United States. The Reed Gold Mine in Cabarrus County, North Carolina, southwest of Georgeville, produced about 50,000 troy ounces (1,600 kg) of gold from deposits of lode and placer.
Gold was produced in 15 districts, nearly all of them in the state’s Piedmont region. The total production of gold is estimated at 1.2 million ounces of troy (37.3 tonnes).
Oregon
Although gold mines are spread across much of Oregon, nearly all the gold produced comes from two main areas: the Klamath Mountains in southwestern Oregon, including Coos, Curry, Douglas, Jackson and Josephine counties ; and the Blue Mountains in northeastern Oregon, mostly in Baker and Grant counties.
Illinois prospectors discovered placer gold in southwest Oregon’s Klamath Mountains in 1850, beginning a rush to the area. Deposits of Lode gold have also been discovered. Travelers bound for the Willamette Valley along the Oregon Trail are said to have discovered gold in northeastern Oregon in 1845, but earnest mining did not begin until 1861.
Pennsylvania
Approximately 37,000 troy ounces (1,200 kg) of gold were produced five miles south of Lebanon, Lebanon County, Pennsylvania from the Cornwall Iron Mine. Although since 1742 the deposit produced iron, no gold from the mine was reported until 1878.
South Carolina
There were lode gold mines along the Carolina Slate Belt in South Carolina. The Haile deposit was discovered in Lancaster County in 1827, and between that time and 1942, at least 257,000 troy ounces (8,000 kg) of gold were intermittently extracted when the gold mine was ordered to be closed as non-essential to the war effort.
The deposit was mined for associated sericite at the beginning of 1951, which was used as a white filler. Gold is associated with silicon, kaolinite, and pyritic alteration of felsic metavolcanics of greenschist grade. The mine reopened in the 1980s as an open pit, operating until 1992.
OceanGold Corp. restarted mining at the Haile deposit 2016. The company expects to produce an average of 126,700 ounces of gold per year for 13.25 years.
From 1828 to 1995, the Brewer mine was operating and is now a federal Superfund site.
From 1988 to 1999, Kennecott Minerals operated the Ridgeway open-pit gold mine, and Kennecott is now reclaiming the land.
Between 1990 and 1994, the Barite Hill mine operated.
South Dakota
South Dakota’s only operating gold mine is the Wharf mine at Lead, a Coeur Mining open pit heap leach operation that produced 109,000 ounces of gold in 2016.
Tennessee
In 1827, on Coker Creek in Monroe County, Tennessee, Placer gold was discovered. Some 9,000 troy ounces (280 kg) were produced by the district. Approximately 15,000 troy ounces (470 kg) of gold were recovered from Ducktown, Tennessee’s massive sulfide copper ores.
Texas
Some prospects were excavated on the central Texas Llano Uplift for gold. Gold prospects include the Heath mine and the Babyhead district in both Llano County and Gillespie County’s Central Texas mine. There is no known production of gold, if any. Historically, Texas may have been home to the Lost Nigger Gold Mine.
Utah
Most gold produced today in Utah is a by-product of Salt Lake City’s huge Bingham Canyon copper mine. In 2013, 192,300 troy ounces (5,980 kg) of gold were produced by the Bingham Canyon mine. Bingham Canyon has produced over 23 million ounces (715 tons) of gold over its lifetime, making it one of the largest gold producers in the United States.
The Salt Lake County Barneys Canyon mine, the last primary gold mine operating in Utah, stopped mining in 2001, but is still recovering gold from its heap leaching pads. The production of Utah gold in 2006 was 460,000 troy ounces (14,000 kg).
Virginia
Most of Virginia’s gold mining was concentrated in the Virginia Gold-Pyrite belt in a line running north-east to south-west through Fairfax, Prince William, Stafford, Fauquier, Culpeper, Spotsylvania, Orange, Louisa, Fluvanna, Goochland, Cumberland, and Buckingham counties. There was also some gold mining in counties like Halifax, Floyd, and Patrick.
Washington
Gold was first discovered as a placer deposit in the Yakima Valley in Washington in 1853. State production never exceeded 50,000 troy ounces per year until the mid-1930s, when large hard rock deposits were built near the deposits of Chelan Lake and Wenatchee in Chelan County, and the Republic deposit in Ferry County. Production is estimated at 2,3 million ounces through 1965.
Wyoming
Gold was found in the present Fremont County in 1842 in the South Pass-Atlantic City-Sweetwater district. The placers were intermittently worked until 1867 when the first important gold vein was discovered and the area was rushed by prospectors and miners.
The miners were served by the cities of South Pass City, Atlantic City, and Miner’s Delight. By 1875, the district was almost deserted and only intermittently subsequently worked. The total production of gold was approximately 300,000 troy ounces (9,300 kg). The district became a major iron mine site in 1962.
Gold mining is the mining resource that extracts gold.
How Is Gold Mined?
Gold is mined using four different methods. Placer mining, hard rock mining, byproduct mining and by processing gold ore.
Placer mining
Placer mining is the technique of extracting gold accumulated in a placer deposit. Placer deposits are composed of relatively loose material that makes tunneling difficult, so most extraction methods involve water or dredging.
Panning
Gold panning is mainly a manual gold separation technique from other materials. Large, shallow pans are filled with gold-containing sand and gravel. The pan is submerged and shaken in water, sorting the gravel gold and other material. It quickly settles down to the bottom of the pan as gold is much denser than rock.
Usually the panning material is removed from stream beds, often at the inside turn in the stream, or from the stream’s bedrock shelf, where gold density allows it to concentrate, a type called placer deposits.
Sluicing
It has long been a very common practice for prospecting and small-scale mining to use a sluice box to extract gold from placer deposits. Essentially, a sluice box is a man-made channel with riffles at the bottom. In order to allow gold to drop out of suspension, the riffles are designed to create dead zones.
In order to channel water flow, the box is placed in the stream. At the top of the box is placed gold-bearing material. The material is transported by the current through the volt where behind the riffles settles gold and other dense material. Less dense material flows like tailings out of the box.
Dredging
While this method has been largely replaced by modern methods, small-scale miners use suction dredges to make some dredging. Small machines that float on the water are typically operated by one or two people. A suction dredge consists of a pontoon-supported sluice box attached to a suction hose controlled by an underwater miner.
State dredging permits specify a seasonal time period and area closures in many of the U.S. gold dredging areas to avoid conflicts between dredgers and fish populations spawning time. Some states, like Montana, need a comprehensive licensing procedure, including U.S. permits. Engineering corps, Montana Environmental Quality Department and local county water quality boards.
Rocker box
Also called a cradle, it uses riffles to trap gold similarly to the sluice box in a high-walled box. A rocker box uses less water than a sluice box and is suitable for areas with limited water. A rocking motion provides the movement of water needed to separate gold in placer material from gravity.
Hard rock mining
Hard rock gold mining extracts gold in rock instead of fragments in loose sediment, producing most of the gold in the world. Open-pit mining is sometimes used, for example in central Alaska’s Fort Knox Mine. Barrick Gold Corporation has one of the largest open-pit gold mines in North America located on its Goldstrike mine property in north eastern Nevada.
Other gold mines use underground mining where tunnels or shafts extract the ore. South Africa has up to 3,900 meters (12,800 ft) underground deepest hard rock gold mine in the world. The heat is unbearable for humans at such depths, and air conditioning is necessary for workers ‘ safety.
By-product gold mining
Gold is also produced through mining, where it is not the main product. Large copper mines, such as the Bingham Canyon mine in Utah, often recover together with copper considerable amounts of gold and other metals. Some sand and gravel pits, such as those around Denver, Colorado, in their washing operations may recover small amounts of gold.
The largest producing gold mine in the world, the Grasberg mine in Papua, Indonesia, is primarily a copper mine.
Gold ore processing
Cyanide process
Cyanide extraction of gold may be used in areas where fine gold-bearing rocks are found. Sodium cyanide solution is mixed with finely ground rock that has been proven to contain gold or silver and is then separated as a gold cyanide or silver cyanide solution from ground rock. To precipitate residual zinc and silver and gold metals, zinc is added. Zinc is removed with sulfuric acid, leaving a silver or gold sludge that is generally smelted into an ingot and then shipped to a metal refinery for final processing into pure metals of 99,9999 percent.
In recent years, the technique of alkaline cyanide dissolution has been highly developed. It is especially suitable for processing low-grade gold and silver ore (e.g. less than 5 ppm gold), but its use is not limited to such ores. This extraction method involves many environmental hazards, largely due to the high acute toxicity of the involved cyanide compounds.
Mercury process
Historically, mercury has been widely used in placer gold mining to form mercury-gold amalgam with smaller gold particles, thereby increasing the rate of gold recovery. In the 1960s, large-scale mercury use stopped. In artisanal and small-scale gold mining (ASGM), however, mercury is still used, often clandestine, gold prospecting. It is estimated that 45,000 metric tons of mercury used in California for placer mining have not been recovered.
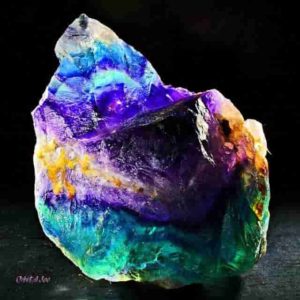
Fluorite is the mineral form of calcium fluoride. It belongs to the minerals of halides. It crystallizes in isometric cubic habit, although octahedral and more complex isometric forms are not rare.
Fluorite is a colorful mineral in both visible and ultraviolet light, with ornamental and lapidary uses in the stone. Fluorite is used industrially as a smelting flux and in the manufacture of certain glasses and enamels.
Fluorite’s purest grades are a source of fluoride for the production of hydrofluoric acid, the intermediate source of most fine chemicals containing fluorine. Optically clear transparent fluorite lenses have low dispersion, making them valuable in microscopes and telescopes, so lenses made from them exhibit less chromatic aberration. Fluorite optics are also usable in the far-ultraviolet and mid-infrared ranges, where conventional glasses are too absorbent for use.
The Mohs scale of mineral hardness, based on scratch hardness comparison, defines value 4 as Fluorite.
What Are Fluorite Colores?
Fluorite comes in a wide range of colors and has consequently been dubbed “the most colorful mineral in the world”. Every color of the rainbow in various shades are represented by fluorite samples, along with white, black, and clear crystals. The most common colors are purple, blue, green, yellow, or colorless.
Why Is Fluorites Streak White?
Fluorite streak is white because this is the true color of the mineral’s powdered form. Impurities in a mineral specimen that cause color or tint are so insignificant in relation to the actual mineral content that they are not visible when powdered.
What is Fluorite Fluorescence?
The’ fluorescence’ phenomenon was named after fluorite in 1852, being one of the first fluorescent minerals to be studied. The fluorine element was named after fluorite as well. Fluorine is an essential component in the fluoride chemical ion. Under ultraviolet UV light, fluorite is often fluorescent.
The fluorescence is thought to be due to impurities of yttrium or other types of organic matter within the crystal lattice. The color of visible light emitted when a sample of fluorite is fluorescing appears to be highly dependent on where the specimen was collected.
Fluorescent fluorite colors are extremely variable, but blue is the typical color; yellow, green, red, white and purple are other fluorescent colors. Some specimens exhibit different colors under long and short wave UV light at the same time.
What is Fluorite used for?
Fluorite is used industrially as a smelting flux and in the manufacture of certain glasses and enamels. Fluorite’s purest grades are a source of fluoride for the production of hydrofluoric acid, the intermediate source of most fine chemicals containing fluorine.
What is the rarest color of fluorite?
Purple or violet is the classic color of fluorite, often competing for richness with amethyst. Blue fluorite is quite rare and collectors are looking for it. The brilliant yellow is very rare as well. Pink, black and colorless are the rarest fluorite colors.
Where fluorite can be found ?
In many places around the world, fluorite deposits are found. In Argentina, Austria, Canada, China, England, France, Germany, Mexico, Morocco, Myanmar (Burma), Namibia, Russia, Spain, Switzerland and the United States, some of the most significant finds are found.
Where can you find fluorite in North America?
One of the largest deposits of fluorspar in North America is located in the Burin Peninsula, Newfoundland, Canada. The first official recognition of fluorspar in the area was recorded by geologist J.B. Jukes in 1843. He noted an occurrence of “galena” or lead ore and fluoride of lime on the west side of St. Lawrence harbour.
It is recorded that interest in the commercial mining of fluorspar began in 1928 with the first ore being extracted in 1933. Eventually at Iron Springs Mine, the shafts reached depths of 970 feet (300 m). In the St. Lawrence area, the veins are persistent for great lengths and several of them have wide lenses. The area with veins of known workable size comprises about 60 square miles (160 km2).
Moonstone is a sodium potassium aluminium silicate of the feldspar group that displays a pearly and opalescent schiller. An alternative name is hecatolite.
The most common moonstone is of the orthoclase feldspar mineral adularia, named for an early mining site near Mt. Adular in Switzerland, now the town of St. Gotthard. Solid solution of the plagioclase feldspar oligoclase +/- the potassium feldspar orthoclase also produces moonstone specimens.
Its name is derived from a visual effect, sheen or schiller (play of color), caused by light diffraction within a micro-structure consisting of regular exsolution layers (lamellae) of different alkali feldspars (orthoclase and sodium-rich plagioclase).
What is the chemical formula for Moonstone?
((Na,K)AlSi3O8)
How Is The Moonstone Formed?
Moonstone is a variety of the feldspar-group mineral orthoclase. It’s composed of two feldspar minerals, orthoclase and albite. At first, the two minerals are intermingled. Then, as the newly formed mineral cools, the intergrown orthoclase and albite separate into stacked, alternating layers.
What Are The Different Types and Colours of Moonstone?
Types of Moonstone
Blue Moonstone
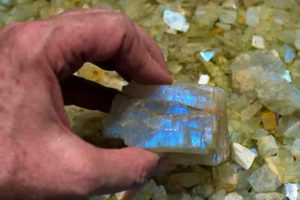
Blue moonstone is transparent and crystal clear with a floating blue tone on the surface.The most desirable stones have the most intense blue colour. The largest and best stones have traditionally come from Myanmar(Burma), however it has become much harder to find good stones and therefore the price has increased.
Rainbow Moonstone
Rainbow moonstone has a milky patchy appearance which comes from the white orthoclase inclusions and layers. When the stone catches the light, the reflection off the layers and inclusions produces a rainbow effect. The colour play has made this a very popular stone and it is often used in silver jewellery.
The scientific name for rainbow moonstone is labradorite, and despite the name it is different from true moonstone, which is called orthoclase.
Green Moonstone
Green moonstone is not as well known as rainbow or blue moonstone as it does not have the colour play, however it is still a beautiful stone. It usually has a slightly hazy or clear appearance an a pale green-yellow colour. When you look down at the stone you will see a light emanating from within, like a full moon. It is commonly cut with a high dome to accentuate this optical effect and frequently a star of light will be visible on the top of the dome.
Pink Moonstone
The term pink covers colours from honey to beige to peach, ranging from translucent to opaque. The stone should have a white sheen and is often found with a cat’s eye or star effect. This type of stone is often used in rows of coloured beads.
Orthoclase
Orthoclase is a relatively inexpensive transparent stone that is colourless or pale yellow, and can have a blue white tone or sheen. The colourless variety is called adularia, as it was found at Mount Adular in Switzerland. Orthoclase is commonly faceted as a step cut due to its fragile nature, and becasue of this it is not widely used or produced.
Amazonite
Amazonite is an attractive opaque stone. Due to the presence of lead it is either a blue-green, or blue and white striped color. The color pattern tends to be irregular even with the solid colour material. Amazonite can occur in different colours such as yellow, pink, red, and grey, however it is the blue green that is most popular and widely used.
Colors of Moonstone
Moonstones come in a variety of colors. The body color can range from colorless to gray, brown, yellow, green, or pink. The clarity ranges from transparent to translucent. The best moonstone has a blue sheen, perfect clarity, and a colorless body color. Another related feldspar variety is known as rainbow moonstone. In this variety, the sheen is a variety of rainbow hues, from pink to yellow, to peach, purple, and blue.
Moonstone Quality Factors
Color
The most highly favored moonstones should display: a colorless, semitransparent to nearly transparent appearance without visible inclusions, and a vivid blue adularescence, known in the trade as blue sheen. The finest moonstone is a gem of glassy purity with a mobile, electric blue shimmer.
Clarity
A good moonstone should be almost transparent and as free of inclusions as possible. Inclusions can potentially interfere with the adularescence.
Characteristic inclusions in moonstone include tiny tension cracks called centipedes. They are called this because they resemble those long, thin creatures with many legs.
Cut
Moonstone might be shaped into beads for strands, but by far the most common cutting style is the cabochon, a form that displays its phenomenal color or colors to best advantage. Moonstone cabochons are usually oval, but cutters sometimes offer cabochons in interesting shapes, such as the tapered sugarloaf—an angular cabochon with a square base.
Carat Weight
Moonstone comes in a wide range of sizes and carat weights. Fine-quality material is becoming scarcer in larger sizes.
Where is Moonstone found in the world?
Moonstone is found in Sri Lanka, Myanmar, Madagascar, Brazil, Australia and India. The various colors only come from India and the other sources yield white moonstone. In India, rainbow moonstone is mined in the southwest and blue is mined at Bihar in the center of the country.
What is Moonstone Value and it’s Price?
Moonstones are prized for their adularescence, an optical phenomenon that creates the appearance of billowy clouds of blue to white light with a moonlight sheen.
The more transparent and colorless the body and more blue the adularescence, the higher the moonstone value. Large quantities of near opaque material with various body colors, carved into simple “moon faces” and other figures, are available for pennies. Cabochons of translucent material, either white or with pleasing body color and adularescence, are fairly common on the market and command relatively modest prices.
Moonstone Price
It goes without saying that the clearer the stone, the more valuable it is. Prices for moonstones range from $10 to $1000, with clear moonstones free of inclusions such as centipedes or unappealing greenish tints commanding the highest prices.
A gold nugget is a naturally occurring piece of native gold. Watercourses often concentrate nuggets and finer gold in placers. Nuggets are recovered by placer mining, but they are also found in residual deposits where the gold-bearing veins or lodes are weathered. Nuggets are also found in the tailings piles of previous mining operations, especially those left by gold mining dredges.
How Do Gold Nuggets Form?
Many Nuggets Gold formed as clusters of gold crystals from very hot water in cracks and fissures in hard-rocks, often with quartz. Later, weathering released the gold nuggets that end up in a stream due to gravity.
Nuggets are gold fragments weathered out of an original lode. They often show signs of abrasive polishing by stream action, and sometimes still contain inclusions of quartz or other lode matrix material. A 2007 study on Australian nuggets ruled out speculative theories of supergene formation via in-situ precipitation, cold welding of smaller particles, or bacterial concentration, since crystal structures of all of the nuggets examined proved they were originally formed at high temperature deep underground (i.e., they were of hypogene origin).
Other precious metals such as platinum form nuggets in the same way. A later study of native gold from Arizona, US, based on lead isotopes indicates that a significant part of the mass in alluvial gold nuggets in this area formed within the placer environment.
What Is The Composition Of Gold Nuggets?
Nuggets are usually 20.5K to 22K purity (83% to 92% by mass). Gold nuggets in Australia often are 23K or slightly higher, while Alaskan nuggets are usually at the lower end of the spectrum. Purity can be roughly assessed by the nugget color, the richer and deeper the orange-yellow the higher the gold content.
Are Gold Nuggets Pure Gold?
Most nuggets are between 85 percent and 95 percent pure gold, but the remainder can be one of several kinds of minerals. Nuggets in laterite can be either reddish or black; nuggets in quartz appear cloaked with white. Any nuggets not deemed to be “jewelry-grade” get melted down and sold as pure gold.
What Is A Nugget Of Gold Worth?
A specimen gold nugget is a matrix of gold and other rock, usually quartz or ironstone (in Australia). If the gold to rock ratio is high, and the shape shows off a lot of the gold at the surface, your nugget can hold a higher value. The largest specimen gold nugget in the world to this date is the Holterman Nugget found in Australia at Hill End, NSW in 1872 weighing in at 285 kg.
Where Are Gold Nuggets Found?
It found in residual deposits where the gold-bearing veins or lodes are weathered. Nuggets are also found in the tailings piles of previous mining operations, especially those left by gold mining dredges.
The best areas for finding gold nuggets are those which are known for producing coarse gold. The term “coarse” is used to describe gold pieces which range in size from a wheat grain to many grams. Scanning with a metal detector is the most common, practical method for finding gold nuggets and other forms of gold.
Coarse gold did not occur in all gold fields, even when some were considered especially rich. In some areas of Australia the gold is fine and concentrated in crevices in bedrock and any gravel wash overlying this. A metal detector cannot pick up this fine gold sprinkled through sand and gravel, nor can it detect minute traces of gold still enclosed in quartz reef material.
Two gold nuggets are claimed as the largest in the world: the Welcome Stranger and the Canaã nugget, the latter being the largest surviving natural nugget.
Welcome Stranger Nugget
The Welcome Stranger was found at Moliagul, Victoria, Australia in 1869 by John Deason and Richard Oates. It weighed gross, over 2,520 troy ounces (78 kg; 173 lb) and returned over 2,284 troy ounces (71.0 kg; 156.6 lb) net.[6] The Welcome Stranger is sometimes confused with the similarly named Welcome Nugget, which was found in June 1858 at Bakery Hill, Ballarat, Australia by the Red Hill Mining Company. The Welcome weighed 2,218 troy ounces (69.0 kg; 152.1 lb). It was melted down in London in November 1859.
Canaã Nugget
The Canaã nugget, also known as the Pepita Canaa, was found on September 13, 1983 by miners at the Serra Pelada Mine in the State of Para, Brazil. Weighing 1,955 troy ounces (60.8 kg; 134.1 lb) gross, and containing 1,682.5 troy ounces (52.33 kg; 115.37 lb) of gold, it is among the largest gold nuggets ever found, and is, today, the largest in existence.
The main controversy regarding this nugget is that the excavation reports suggest that the existing nugget was originally part of a nugget weighing 5,291.09 troy ounces (165 kg; 363 lb) that broke during excavations. The Canaã nugget is displayed at the Banco Central Museum in Brazil along with the second and third largest nuggets remaining in existence, weighing respectively 1,506.2 troy ounces (46.85 kg; 103.28 lb) and 1,393.3 troy ounces (43.34 kg; 95.54 lb), which were also found at the Serra Pelada region.
The largest gold nugget found using a metal detector is the Hand of Faith, weighing 875 troy ounces (27.2 kg; 60.0 lb), found in Kingower, Victoria, Australia in 1980.
Gold is a chemical element with symbol Au and atomic number 79, making it one of the higher atomic number elements that occur naturally. In its purest form, it is a bright, slightly reddish yellow, dense, soft, malleable, and ductile metal. Chemically, gold is a transition metal and a group 11 element.
States With Gold
Colorado, Georgia, Idaho, Michigan, Montana, Nevada, New Mexico, North Carolina, Oregon, South Carolina, South Dakota, Tennessee, Texas, Utah, Virginia, Washington, Wisconsin, and Wyoming are the “States With Gold” in which major amounts of gold have been found.
Gold mining by state
Alabama
Gold was discovered in Alabama about 1830, shortly following the Georgia Gold Rush. The principal districts were the Arbacoochee district in Cleburne County, mostly from placer deposits, and the Hog Mountain district in Tallapoosa County, which produced 24,000 troy ounces (750 kg) from veins in schist.
Alaska
Russian explorers discovered placer gold in the Kenai River in 1848, but no gold was produced. Gold mining started in 1870 from placers southeast of Juneau. Alaska produced a total of 40,300,000 troy ounces (1,250,000 kg) of gold from 1880 through the end of 2007. In 2015 Alaskan mines produced 873,984 troy ounces (27,183.9 kg) of gold, 12.7% of US production. The largest gold producer is the Fort Knox mine, a large open pit and cyanide leaching operation in the Fairbanks mining district.
Arizona
Arizona has produced more than 16 million troy ounces (498 tonnes) of gold.
Gold mining in Arizona reportedly began in 1774 when Spanish priest Manuel Lopez directed Papago Indians to wash gold from gravel on the flanks of the Quijotoa Mountains, Pima County. Gold mining continued there until 1849, when the Mexican miners were lured away by the California Gold Rush. Other gold mining under Spanish and Mexican rule took place in the Oro Blanco district of Santa Cruz County, and the Arivaca district, Pima County.
Mountain man Pauline Weaver discovered placer gold on the east side of the Colorado River in 1862. Weaver’s discovery started the Colorado River Gold Rush to the now ghost town of La Paz, Arizona and other locations along the river in the ensuing years.
California
Spanish prospectors found gold in the Potholes district between 1775 and 1780, along the Colorado River, in present Imperial County, California, about ten miles northeast from Yuma, Arizona. The gold was recovered from dry placers. Other placer deposits on the west bank of the Colorado River were quickly found, including the Picacho and Cargo Muchacho districts.
Placer gold deposits were found at San Ysidro in San Diego County in 1828, San Francisquito Canyon and Placerita Canyon in Los Angeles County in 1835 and 1842, respectively
Major gold mining in California began during the California Gold Rush. Gold was found by James Marshall at Sutters Mill, property of John Sutter, in present-day Coloma. In 1849, people started hearing about the gold and after just a few years San Francisco’s population increased to thousands.
Colorado
Gold was discovered in 1858 during the Pike’s Peak Gold Rush in the vicinity of present-day Denver in 1858, but the deposits were small. The first important gold discoveries in Colorado were in the Central City-Idaho Springs district in January 1859. Only one Colorado mine continues to produce gold, the Cripple Creek & Victor Gold Mine at Victor near Colorado Springs, an open-pit heap leach operation owned by Newmont Mining Corporation, which produced 360,000 troy ounces (11,000 kg) of gold in 2018.
Florida
Small amounts of gold were mined commercially in North Eastern Florida during the late 19th Century, at the site where Mike Roess Gold Head Branch State Park is located today. No records are extant on the amount of gold produced, but the find was insufficient to keep the operation running commercially, and the small amount of pay dirt was depleted within a matter of months.
Georgia
Georgia is credited with a total historical production of 871,000 troy ounces (27,100 kg) of gold from 1830 through 1959. Although historically important, the state is not currently a gold producer.
Idaho
Gold was first discovered in Idaho in 1860, in Pierce at the juncture where Canal Creek meets Orofino Creek.
The leading historical gold-producing district is the Boise Basin in Boise County, which was discovered in 1862 and produced 2.9 million troy ounces (90.2 tonnes), mostly from placers.
The French Creek-Florence district in Idaho County began in the 1860s, and has produced about 1 million troy ounces (31 tonnes) from placers.
The Silver City district in Owyhee County began producing in 1863, and made over 1 million troy ounces (31 tonnes), mostly from lode deposits.
The Coeur d’Alene district in Shoshone County has made 44,000 troy ounces (1,400 kg) of gold as byproduct to silver mining.
In 2006, active gold mines in Idaho included the Silver Strand mine and the Bond mine.
Maryland
Gold was reported in Maryland as early as 1830, but no production resulted. Placer gold was discovered at Great Falls near Washington, DC in 1861 during the American Civil War by Union soldiers from California. After the war a number of mines were opened on gold-bearing quartz veins in Montgomery County. No gold production has been reported since 1951. Total production was about 6,000 troy ounces (190 kg).
Michigan
Approximately 29,000 troy ounces (900 kg) of gold were produced from the Ropes gold mine northeast of Ishpeming in Marquette County, Michigan. The underground mine, originally operated from 1880 to 1897, and reopened from 1983–1989, extracted gold from quartz veins in peridotite.
Montana
Gold was first discovered in Montana in 1852, but mining did not begin until 1862, when gold placers were discovered at Bannack, Montana in 1862. The resulting gold rush resulted in more placer discoveries, including those at Virginia City in 1863, and at Helena and Butte in 1864. In 1867, the Atlantic Cable Quartz Lode was located.
The Butte district, although mined primarily for copper, produced 2.9 million ounces (91 tones) of gold through 1990, almost all as a byproduct of copper production.
Current active hardrock gold mines include the Montana Tunnels mine, and the Golden Sunlight mine. Active gold placers include the Browns Gulch placer and the Confederate Gulch placer. Gold is also produced from three platinum mines in the Stillwater igneous complex: the Stillwater mine, the Lodestar mine, and the East Boulder Project.
Nevada
Nevada is the leading gold-producing state in the nation, in 2016 producing 5,467,646 troy ounces (170.06 tonnes), representing 81% of US gold and 5.5% of the world’s production. Much of the gold in Nevada comes from large open pit mining and with heap leaching recovery. Some of the world’s major mining companies, including Newmont Mining, Barrick Gold and Kinross Gold, operate gold mines in the state. Active major mines include Cortez, Twin Creeks, Betz-Post, Meikle, Marigold, Round Mountain, Jerritt Canyon and Getchell.
Newmont and Barrick operate the largest mining operations, on the prolific Carlin Trend, one of the world’s richest mining districts.
New Mexico
Gold was first discovered in New Mexico in 1828 in the “Old Placers” district in the Ortiz Mountains, Santa Fe County, New Mexico. The placer gold discovery was followed by discovery of a nearby lode deposit.
In 1877, two prospectors collected float in the area of the future Opportunity Mine near Hillsboro, New Mexico, which was assayed at $160 per ton in gold and silver. Soon, ore was discovered at the nearby Rattlesnake vein and a placer deposit of gold was found in November at the Rattlesnake and Wicks gulches. Total production prior to 1904 was about $6,750,000.
In 2007 all gold production in New Mexico (13,000 troy ounces (400 kg)) came as a byproduct of copper mining from two large open pit mines in Grant County. However, two primary gold mines are being readied for production: the Northstar mine in Rio Arriba County, and the San Lorenzo Claims mine in Socorro County.
North Carolina
North Carolina was the site of the first gold rush in the United States, following the discovery of a 17-pound (7.7 kg) gold nugget by 12-year-old Conrad Reed in a creek at his father’s farm in 1799. The Reed Gold Mine, southwest of Georgeville in Cabarrus County, North Carolina produced about 50,000 troy ounces (1,600 kg) of gold from lode and placer deposits.
Gold was produced from 15 districts, almost all in the Piedmont region of the state. Total gold production is estimated at 1.2 million troy ounces (37.3 tonnes).
Oregon
Although gold mines are spread over much of Oregon, almost all of the gold produced has come from two principal areas: the Klamath Mountains in southwest Oregon, including Coos, Curry, Douglas, Jackson and Josephine counties; and the Blue Mountains in northeast Oregon, mostly in Baker and Grant counties.
Prospectors from Illinois discovered placer gold in the Klamath Mountains of southwest Oregon in 1850, starting a rush to the area. Lode gold deposits were also discovered.
Travellers along the Oregon Trail bound for the Willamette Valley are said to have discovered gold in northeastern Oregon in 1845, but mining in earnest did not begin until 1861.
Pennsylvania
About 37,000 troy ounces (1,200 kg) of gold was produced from the Cornwall iron mine five miles south of Lebanon, Lebanon County, Pennsylvania. Although the deposit produced iron since 1742, no gold was reported from the mine until 1878.
South Carolina
South Carolina had a number of lode gold mines along the Carolina Slate Belt.[38]
The Haile deposit was discovered in Lancaster County in 1827, and at least 257,000 troy ounces (8,000 kg) of gold were extracted intermittently between then and 1942, when the gold mine was ordered closed as nonessential to the war effort. Beginning in 1951, the deposit was mined for associated sericite, which was used as a white filler.
South Dakota
The only operating gold mine in South Dakota is the Wharf mine, at Lead, an open pit heap leach operation operated by Coeur Mining that produced 109,000 ounces of gold in 2016.
Tennessee
Placer gold was discovered on Coker Creek in Monroe County, Tennessee in 1827. The district produced about 9,000 troy ounces (280 kg).
About 15,000 troy ounces (470 kg) of gold was recovered from the massive sulfide copper ores at Ducktown, Tennessee.
Texas
Some prospects have been excavated for gold on the Llano Uplift of central Texas. Gold prospects include the Heath mine and the Babyhead district, both in Llano County, and the Central Texas mine in Gillespie County. Gold production, if any, is not known. Historically, the Lost Nigger Gold Mine may be in Texas.
Utah
Most gold produced in Utah today is a byproduct of the huge Bingham Canyon copper mine, southwest of Salt Lake City. In 2013, the Bingham Canyon mine produced 192,300 troy ounces (5,980 kg) of gold. Over its life, Bingham Canyon has produced more than 23 million ounces (715 tonnes) of gold, making it one of the largest gold producers in the US.
The Barneys Canyon mine in Salt Lake County, the last primary gold mine to operate in Utah, stopped mining in 2001, but is still recovering gold from its heap leaching pads. Utah gold production was 460,000 troy ounces (14,000 kg) in 2006.
Virginia
Most gold mining in Virginia was concentrated in the Virginia Gold-Pyrite belt in a line that runs northeast to southwest through the counties of Fairfax, Prince William, Stafford, Fauquier, Culpeper, Spotsylvania, Orange, Louisa, Fluvanna, Goochland, Cumberland, and Buckingham. Some gold was also mined in Halifax, Floyd, and Patrick counties.
Washington
Gold was first discovered in Washington in 1853, as placer deposits in the Yakima Valley. Production from the state never exceeded 50,000 troy ounces per year until the mid-1930s, when large hard rock deposits were developed near the Chelan Lake and Wenatchee deposits in Chelan County, and the Republic deposit in Ferry County. Production through 1965 is estimated to be 2.3 million ounces.
Wyoming
Gold was discovered at the South Pass-Atlantic City-Sweetwater district in present Fremont County in 1842. The placers were worked intermittently until 1867, when the first important gold vein was discovered, and prospectors and miners rushed to the area.. The towns of South Pass City, Atlantic City, and Miner’s Delight catered to the miners. The district was nearly deserted by 1875, and was worked only intermittently afterward. Total gold production was about 300,000 troy ounces (9,300 kg). In 1962, the district became the site of a major iron mine.
What States had a gold rush?
North America
The first significant gold rush in the United States was in Cabarrus County, North Carolina (east of Charlotte), in 1799 at today’s Reed’s Gold Mine. Thirty years later, in 1829, the Georgia Gold Rush in the southern Appalachians occurred. It was followed by the California Gold Rush of 1848–55 in the Sierra Nevada, which captured the popular imagination.
The California gold rush led directly to the settlement of California by Americans and the rapid entry of that state into the union in 1850. The gold rush in 1849 stimulated worldwide interest in prospecting for gold, and led to new rushes in Australia, South Africa, Wales and Scotland.
Successive gold rushes occurred in western North America: Fraser Canyon, the Cariboo district and other parts of British Columbia, in Nevada, in the Rocky Mountains in Colorado, Idaho, Montana, eastern Oregon, and western New Mexico Territory and along the lower Colorado River. Resurrection Creek, near Hope, Alaska was the site of Alaska’s first gold rush in the mid–1890s. Other notable Alaska Gold Rushes were Nome, Fairbanks, and the Fortymile River.
One of the last “great gold rushes” was the Klondike Gold Rush in Canada’s Yukon Territory (1896–99). This gold rush is immortalised in the novels of Jack London, and Charlie Chaplin’s film The Gold Rush. Robert William Service depicted with talent in his poetries the dramatic event of the Gold Rush, especially in the book The Trail of ’98. The main goldfield was along the south flank of the Klondike River near its confluence with the Yukon River near what was to become Dawson City in Canada’s Yukon Territory, but it also helped open up the relatively new US possession of Alaska to exploration and settlement, and promoted the discovery of other gold finds.
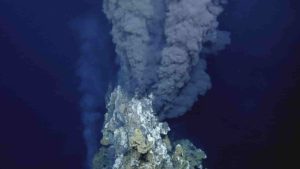
Eggs of deep-sea skates have been discovered near the hottest type of hydrothermal vents, where super-heated water emerges out of the sea floor. These vents, called black smokers, emit dark, sulphurous plumes. Credit: Ocean Exploration Trust
What Is a Hydrothermal Vent?
A hydrothermal vent is a fissure on the seafloor from which geothermally heated water issues. Hydrothermal vents are commonly found near volcanically active places, areas where tectonic plates are moving apart at spreading centers, ocean basins, and hotspots. Hydrothermal deposits are rocks and mineral ore deposits formed by the action of hydrothermal vents.
Hydrothermal vents exist because the earth is both geologically active and has large amounts of water on its surface and within its crust. Under the sea, hydrothermal vents may form features called black smokers or white smokers. Relative to the majority of the deep sea, the areas around submarine hydrothermal vents are biologically more productive, often hosting complex communities fueled by the chemicals dissolved in the vent fluids.
Chemosynthetic bacteria and archaea form the base of the food chain, supporting diverse organisms, including giant tube worms, clams, limpets and shrimp. Active hydrothermal vents are believed to exist on Jupiter’s moon Europa, and Saturn’s moon Enceladus, and it is speculated that ancient hydrothermal vents once existed on Mars.
How Do Hydrothermal Vents Occur?
Hydrothermal vents are the result of seawater percolating down through fissures in the ocean crust in the vicinity of spreading centers or subduction zones (places on Earth where two tectonic plates move away or towards one another). The cold seawater is heated by hot magma and reemerges to form the vents.
Why Are Hydrothermal Vents Black?
A venting black smoker emits jets of particle-laden fluids. The particles are predominantly very fine-grained sulfide minerals formed when the hot hydrothermal fluids mix with near-freezing seawater. These minerals solidify as they cool, forming chimney-like structures. “Black smokers” are chimneys formed from deposits of iron sulfide, which is black. “White smokers” are chimneys formed from deposits of barium, calcium, and silicon, which are white.
Underwater volcanoes at spreading ridges and convergent plate boundaries produce hot springs known as hydrothermal vents.
What Are Black smokers and white smokers?
Black smokers Vent
A black smoker or deep sea vent is a type of hydrothermal vent found on the seabed, typically in the bathyal zone (with largest frequency in depths from 2500 m to 3000 m), but also in lesser depths as well as deeper in abyssal zone. They appear as black, chimney-like structures that emit a cloud of black material. Black smokers typically emit particles with high levels of sulfur-bearing minerals, or sulfides. Black smokers are formed in fields hundreds of meters wide when superheated water from below Earth’s crust comes through the ocean floor (water may attain temperatures above 400 °C).
Black smokers were first discovered in 1979 on the East Pacific Rise by scientists from Scripps Institution of Oceanography. They were observed using the deep submergence vehicle ALVIN from the Woods Hole Oceanographic Institution. Now, black smokers are known to exist in the Atlantic and Pacific Oceans, at an average depth of 2100 metres.
The most northerly black smokers are a cluster of five named Loki’s Castle, discovered in 2008 by scientists from the University of Bergen at 73°N, on the Mid-Atlantic Ridge between Greenland and Norway. These black smokers are of interest as they are in a more stable area of the Earth’s crust, where tectonic forces are less and consequently fields of hydrothermal vents are less common. The world’s deepest known black smokers are located in the Cayman Trough, 5,000 m (3.1 miles) below the ocean’s surface.
White smoker vents
White smoker vents emit lighter-hued minerals, such as those containing barium, calcium and silicon. These vents also tend to have lower-temperature plumes probably because they are generally distant from their heat source.
Black and white smokers may coexist in the same hydrothermal field, but they generally represent proximal and distal vents to the main upflow zone, respectively. However, white smokers correspond mostly to waning stages of such hydrothermal fields, as magmatic heat sources become progressively more distant from the source (due to magma crystallization) and hydrothermal fluids become dominated by seawater instead of magmatic water. Mineralizing fluids from this type of vents are rich in calcium and they form dominantly sulfate-rich (i.e., barite and anhydrite) and carbonate deposits.
Where Are Hydrothermal Vents Located?
Like hot springs and geysers on land, hydrothermal vents form in volcanically active areas—often on mid-ocean ridges, where Earth’s tectonic plates are spreading apart and where magma wells up to the surface or close beneath the seafloor.
False colour electron microscope image of an internally zoned magnetite crystal in massive iron-oxide ore from El Laco in the Chilean Andes. Credit: Troll et al.
The origin of giant apatite-iron oxide ores of the so-called ‘Kiruna-type’ has been the topic of a long standing debate that has lasted for over 100 years. In a new article, published in Nature Communications, a team of scientists presents new and unambiguous data in favour of a magmatic origin for these important iron ores. The study was led by researchers from Uppsala University in Sweden.
Despite globally increasing demand for rare metals, iron is the overall most important metal for modern industry. Over 90 % of Europe´s total iron production comes from apatite-iron oxide ores, also referred to as Kiruna-type ores, named after the extremely large and iconic Kiruna iron ore deposit in northern Sweden. Today the Swedish deposits at Kiruna and Malmberget are the largest and most important iron producers in Europe, and Kiruna-type deposits represent an iron source of global importance. These deposits also have a large future potential for production of sought-after and critical rare earth elements (REE) as well as phosphorus, another element deemed critical for Europe’s future development.
The origin and actual process of formation of Kiruna-type ores has remained highly controversial for over 100 years, with suggestions ranging from a purely low-temperature hydrothermal origin to sea floor precipitation to a high-temperature volcanic origin from magma or high-temperature magmatic fluids. To remedy this problem, a team of scientists from Uppsala University, the Geological Survey of Sweden, the Geological Survey of Iran, the Indian Institute of Technology in Bombay, and the Universities of Cardiff and Cape Town, led by Uppsala researcher Prof. Valentin Troll, employed Fe and O isotopes, the main elements in magnetite (Fe3O4), from Sweden, Chile and Iran to chemically fingerprint the processes that led to formation of these ores.
By comparing their data from Kiruna-type iron ores with an extensive set of magnetite samples from volcanic rocks as well as from known low-temperature hydrothermal iron ore deposits, the researchers were able to show that more than 80 % of their magnetite samples from Kiruna-type apatite-iron oxide ores were formed by high-temperature magmatic processes in what must represent volcanic to shallow sub-volcanic settings. The new results constitute an important advance in our understanding of Kiruna-type ores and will be of help for the interpretation of, and future exploration for, apatite-iron oxide deposits worldwide.
Reference:
Valentin R. Troll, Franz A. Weis, Erik Jonsson, Ulf B. Andersson, Seyed Afshin Majidi, Karin Högdahl, Chris Harris, Marc-Alban Millet, Sakthi Saravanan Chinnasamy, Ellen Kooijman, Katarina P. Nilsson. Global Fe–O isotope correlation reveals magmatic origin of Kiruna-type apatite-iron-oxide ores. Nature Communications, 2019; 10 (1) DOI: 10.1038/s41467-019-09244-4
Fossilized skull parts from ancient elephant relatives in the collections of the Jackson School Museum of Earth History. The skull of a shovel-jawed gomphothere (pictured on bottom) collected by Great Depression-era fossil hunters is still wrapped in its field jacket. Credit: The University of Texas at Austin Jackson School of Geosciences
During the Great Depression, some unemployed Texans were put to work as fossil hunters. The workers retrieved tens of thousands of specimens that have been studied in small bits and pieces while stored in the state collections of The University of Texas at Austin for the past 80 years.
Now, decades after they were first collected, a UT researcher has studied and identified an extensive collection of fossils from dig sites near Beeville, Texas, and found that the fauna make up a veritable “Texas Serengeti” — with specimens including elephant-like animals, rhinos, alligators, antelopes, camels, 12 types of horses and several species of carnivores. In total, the fossil trove contains nearly 4,000 specimens representing 50 animal species, all of which roamed the Texas Gulf Coast 11 million to 12 million years ago.
A paper describing these fossils, their collection history and geologic setting was published April 11 in the journal Palaeontologia Electronica.
“It’s the most representative collection of life from this time period of Earth history along the Texas Coastal Plain,” said Steven May, the research associate at the UT Jackson School of Geosciences who studied the fossils and authored the paper.
In addition to shedding light on the inhabitants of an ancient Texas ecosystem, the collection is also valuable because of its fossil firsts. They include a new genus of gomphothere, an extinct relative of elephants with a shovel-like lower jaw, and the oldest fossils of the American alligator and an extinct relative of modern dogs.
The fossils came into the university’s collection as part of the State-Wide Paleontologic-Mineralogic Survey that was funded by the Works Progress Administration (WPA), a federal agency that provided work to millions of Americans during the Great Depression. From 1939 to 1941, the agency partnered with the UT Bureau of Economic Geology, which supervised the work and organized field units for collecting fossils and minerals across the state.
Despite lasting only three years, the survey found and excavated thousands of fossils from across Texas including four dig sites in Bee and Live Oak counties, with the majority of their finds housed in what is now the Texas Vertebrate Paleontology Collections at the Jackson School Museum of Earth History. Over the years, a number of scientific papers have been published on select groups of WPA specimens. But May’s paper is the first to study the entire fauna.
This extensive collection of fossils is helping to fill in gaps about the state’s ancient environment, said Matthew Brown, the director of the museum’s vertebrate paleontology collections.
The emphasis on big mammals is due in large part to the collection practices of the fossil hunters, most of whom were not formally trained in paleontology. Large tusks, teeth and skulls were easier to spot — and more exciting to find — than bones left by small species.
“They collected the big, obvious stuff,” May said. “But that doesn’t fully represent the incredible diversity of the Miocene environment along the Texas Coastal Plain.”
In order to account for gaps in the collection, May tracked down the original dig sites so he could screen for tiny fossils such as rodent teeth. One of the sites was on a ranch near Beeville owned by John Blackburn. Using aerial photography and notes from the WPA program stored in the university’s archives, May and the research team were able to track down the exact spot of an original dig site.
“We’re thrilled to be a part of something that was started in 1939,” Blackburn said. “It’s been a privilege to work with UT and the team involved, and we hope that the project can help bring additional research opportunities.”
Scores of WPA-era fossils in the UT collections are still secured in plaster field jackets, waiting to be unpacked for future research projects. Lab managers Deborah Wagner and Kenneth Bader are supervising their preparation, which includes teaching UT students fossil prep skills so they can pick up where the WPA workers left off.
Wagner said that the advantage of unpacking fossils decades later is that they are able to apply modern research techniques that scientists from past eras wouldn’t have dreamed possible.
“We are able to preserve more detailed anatomy and answer questions that require higher resolution data,” she said.
May said that he plans to continue to study the fossils as more are prepared.
Reference:
Steven R. May. The Lapara Creek Fauna: Early Clarendonian of south Texas, USA. Palaeontologia Electronica, 2019 DOI: 10.26879/929
Research that reveals what lies at the bottom of the deepest part of the ocean — the Mariana Trench. Until now, scientists knew more about Mars than the deepest part of the ocean. But an expedition to collect samples of the microbial population at the deepest part of the Mariana Trench (some 11,000 meters down) has revealed a new ‘oil-eating’ bacteria. Credit: University of East Anglia
Scientists from the University of East Anglia have discovered a unique oil eating bacteria in the deepest part of the Earth’s oceans — the Mariana Trench.
Together with researchers from the China and Russia, they undertook the most comprehensive analysis of microbial populations in the trench.
The Mariana Trench is located in the Western Pacific Ocean and reaches a depth of approximately 11,000 metres. By comparison, Mount Everest is 8,848 metres high.
“We know more about Mars than the deepest part of the ocean,” said Prof Xiao-Hua Zhang of the Ocean University in China, who led the study.
To date, only a few expeditions have investigated the organisms inhabiting this ecosystem.
One of these expeditions was organized and led by noted marine explorer and Academy Award-winning film director James Cameron, who built a specialised submersible to collect samples in the trench.
Dr Jonathan Todd, from UEA’s School of Biological Sciences, said: “Our research team went down to collect samples of the microbial population at the deepest part of the Mariana Trench — some 11,000 metres down. We studied the samples that were brought back and identified a new group of hydrocarbon degrading bacteria.
“Hydrocarbons are organic compounds that are made of only hydrogen and carbon atoms, and they are found in many places, including crude oil and natural gas.
“So these types of microorganisms essentially eat compounds similar to those in oil and then use it for fuel. Similar microorganisms play a role in degrading oil spills in natural disasters such as BP’s 2010 oil spill in the Gulf of Mexico.”
“We also found that this bacteria is really abundant at the bottom of the Mariana Trench.”
In fact, the team found that the proportion of hydrocarbon degrading bacteria in the Trench is the highest on Earth.
The scientists isolated some of these microbes and demonstrated that they consume hydrocarbons in the laboratory under environmental conditions that simulate those in the Mariana Trench.
In order to understand the source of the hydrocarbons ‘feeding’ this bacteria, the team analysed samples of sea water taken at the surface, and all the way down a column of water to the sediment at the bottom of the trench.
Dr Nikolai Pedentchouk, from UEA’s School of Environmental Sciences, said: “We found that hydrocarbons exist as deep as 6,000 meters below the surface of the ocean and probably even deeper. A significant proportion of them probably derived from ocean surface pollution.
“To our surprise, we also identified biologically produced hydrocarbons in the ocean sediment at the bottom of the trench. This suggests that a unique microbial population is producing hydrocarbons in this environment.”
“These hydrocarbons, similar to the compounds that constitute diesel fuel, have been found in algae at the ocean surface but never in microbes at these depths.”
Dr David Lea-Smith, from UEA’s School of Biological Sciences, said: “These hydrocarbons may help microbes survive the crushing pressure at the bottom of the Mariana Trench, which is equal to 1,091 kilograms pressed against a fingernail.
“They may also be acting as a food source for other microbes, which may also consume any pollutant hydrocarbons that happen to sink to the ocean floor. But more research is needed to fully understand this unique environment.”
“Identifying the microbes that produce these hydrocarbons is one of our top priorities, as is understanding the quantity of hydrocarbons released by human activity into this isolated environment,” added Prof Xiao-Hua Zhang.
Reference:
Jiwen Liu, Yanfen Zheng, Heyu Lin, Xuchen Wang, Meng Li, Yang Liu, Meng Yu, Meixun Zhao, Nikolai Pedentchouk, David J. Lea-Smith, Jonathan D. Todd, Clayton R. Magill, Wei-Jia Zhang, Shun Zhou, Delei Song, Haohui Zhong, Yu Xin, Min Yu, Jiwei Tian, Xiao-Hua Zhang. Proliferation of hydrocarbon-degrading microbes at the bottom of the Mariana Trench. Microbiome, 2019; 7 (1) DOI: 10.1186/s40168-019-0652-3
Don Juan Pond in Antarctica. Credit: Flickr, Pierre Roudier
Primitive ponds may have provided a suitable environment for brewing up Earth’s first life forms, more so than oceans, a new MIT study finds.
Researchers report that shallow bodies of water, on the order of 10 centimeters deep, could have held high concentrations of what many scientists believe to be a key ingredient for jump-starting life on Earth: nitrogen.
In shallow ponds, nitrogen, in the form of nitrogenous oxides, would have had a good chance of accumulating enough to react with other compounds and give rise to the first living organisms. In much deeper oceans, nitrogen would have had a harder time establishing a significant, life-catalyzing presence, the researchers say.
“Our overall message is, if you think the origin of life required fixed nitrogen, as many people do, then it’s tough to have the origin of life happen in the ocean,” says lead author Sukrit Ranjan, a postdoc in MIT’s Department of Earth, Atmospheric and Planetary Sciences (EAPS). “It’s much easier to have that happen in a pond.”
Ranjan and his colleagues have published their results today in the journal Geochemistry, Geophysics, Geosystems. The paper’s co-authors are Andrew Babbin, the Doherty Assistant Professor in Ocean Utilization in EAPS, along with Zoe Todd and Dimitar Sasselov of Harvard University, and Paul Rimmer at Cambridge University.
Breaking a bond
If primitive life indeed sprang from a key reaction involving nitrogen, there are two ways in which scientists believe this could have happened. The first hypothesis involves the deep ocean, where nitrogen, in the form of nitrogenous oxides, could have reacted with carbon dioxide bubbling forth from hydrothermal vents, to form life’s first molecular building blocks.
The second nitrogen-based hypothesis for the origin of life involves RNA—ribonucleic acid, a molecule that today helps encode our genetic information. In its primitive form, RNA was likely a free-floating molecule. When in contact with nitrogenous oxides, some scientists believe, RNA could have been chemically induced to form the first molecular chains of life. This process of RNA formation could have occurred in either the oceans or in shallow lakes and ponds.
Nitrogenous oxides were likely deposited in bodies of water, including oceans and ponds, as remnants of the breakdown of nitrogen in Earth’s atmosphere. Atmospheric nitrogen consists of two nitrogen molecules, linked via a strong triple bond, that can only be broken by an extremely energetic event—namely, lightning.
“Lightning is like a really intense bomb going off,” Ranjan says. “It produces enough energy that it breaks that triple bond in our atmospheric nitrogen gas, to produce nitrogenous oxides that can then rain down into water bodies.”
Scientists believe that there could have been enough lightning crackling through the early atmosphere to produce an abundance of nitrogenous oxides to fuel the origin of life in the ocean. Ranjan says scientists have assumed that this supply of lightning-generated nitrogenous oxides was relatively stable once the compounds entered the oceans.
However, in this new study, he identifies two significant “sinks,” or effects that could have destroyed a significant portion of nitrogenous oxides, particularly in the oceans. He and his colleagues looked through the scientific literature and found that nitrogenous oxides in water can be broken down via interactions with the sun’s ultraviolet light, and also with dissolved iron sloughed off from primitive oceanic rocks.
Ranjan says both ultraviolet light and dissolved iron could have destroyed a significant portion of nitrogenous oxides in the ocean, sending the compounds back into the atmosphere as gaseous nitrogen.
“We showed that if you include these two new sinks that people hadn’t thought about before, that suppresses the concentrations of nitrogenous oxides in the ocean by a factor of 1,000, relative to what people calculated before,” Ranjan says.
“Building a cathedral”
In the ocean, ultraviolet light and dissolved iron would have made nitrogenous oxides far less available for synthesizing living organisms. In shallow ponds, however, life would have had a better chance to take hold. That’s mainly because ponds have much less volume over which compounds can be diluted. As a result, nitrogenous oxides would have built up to much higher concentrations in ponds. Any “sinks,” such as UV light and dissolved iron, would have had less of an effect on the compound’s overall concentrations.
Ranjan says the more shallow the pond, the greater the chance nitrogenous oxides would have had to interact with other molecules, and particularly RNA, to catalyze the first living organisms.
“These ponds could have been from 10 to 100 centimeters deep, with a surface area of tens of square meters or larger,” Ranjan says. “They would have been similar to Don Juan Pond in Antarctica today, which has a summer seasonal depth of about 10 centimeters.”
That may not seem like a significant body of water, but he says that’s precisely the point: In environments any deeper or larger, nitrogenous oxides would simply have been too diluted, precluding any participation in origin-of-life chemistry. Other groups have estimated that, around 3.9 billion years ago, just before the first signs of life appeared on Earth, there may have been about 500 square kilometers of shallow ponds and lakes worldwide.
“That’s utterly tiny, compared to the amount of lake area we have today,” Ranjan says. “However, relative to the amount of surface area prebiotic chemists postulate is required to get life started, it’s quite adequate.”
The debate over whether life originated in ponds versus oceans is not quite resolved, but Ranjan says the new study provides one convincing piece of evidence for the former.
“This discipline is less like knocking over a row of dominos, and more like building a cathedral,” Ranjan says. “There’s no real ‘aha’ moment. It’s more like building up patiently one observation after another, and the picture that’s emerging is that overall, many prebiotic synthesis pathways seem to be chemically easier in ponds than oceans.”
The Event Horizon Telescope (EHT) — a planet-scale array of eight ground-based radio telescopes forged through international collaboration — was designed to capture images of a black hole. In coordinated press conferences across the globe, EHT researchers revealed that they succeeded, unveiling the first direct visual evidence of the supermassive black hole in the centre of Messier 87 and its shadow. Credit: EHT Collaboration
An international team of over 200 astronomers, including scientists from MIT’s Haystack Observatory, has captured the first direct images of a black hole. They accomplished this remarkable feat by coordinating the power of eight major radio observatories on four continents, to work together as a virtual, Earth-sized telescope.
In a series of papers published today in a special issue of Astrophysical Journal Letters (https://iopscience.iop.org/issue/2041-8205/875/1), the team has revealed four images of the supermassive black hole at the heart of Messier 87, or M87, a galaxy within the Virgo galaxy cluster, 55 million light years from Earth.
All four images show a central dark region surrounded by a ring of light that appears lopsided — brighter on one side than the other.
Albert Einstein, in his theory of general relativity, predicted the existence of black holes, in the form of infinitely dense, compact regions in space, where gravity is so extreme that nothing, not even light, can escape from within. By definition, black holes are invisible. But if a black hole is surrounded by light-emitting material such as plasma, Einstein’s equations predict that some of this material should create a “shadow,” or an outline of the black hole and its boundary, also known as its event horizon.
Based on the new images of M87, the scientists believe they are seeing a black hole’s shadow for the first time, in the form of the dark region at the center of each image.
Relativity predicts that the immense gravitational field will cause light to bend around the black hole, forming a bright ring around its silhouette, and will also cause the surrounding material to orbit around the object at close to light speed. The bright, lopsided ring in the new images offers visual confirmation of these effects: The material headed toward our vantage point as it rotates around appears brighter than the other side.
From these images, theorists and modelers on the team have determined that the black hole is about 6.5 billion times as massive as our sun. Slight differences between each of the four images suggest that material is zipping around the black hole at lightning speed.
“This black hole is much bigger than the orbit of Neptune, and Neptune takes 200 years to go around the sun,” says Geoffrey Crew, a research scientist at Haystack Observatory. “With the M87 black hole being so massive, an orbiting planet would go around it within a week and be traveling at close to the speed of light.”
“People tend to view the sky as something static, that things don’t change in the heavens, or if they do, it’s on timescales that are longer than a human lifetime,” says Vincent Fish, a research scientist at Haystack Observatory. “But what we find for M87 is, at the very fine detail we have, objects change on the timescale of days. In the future, we can perhaps produce movies of these sources. Today we’re seeing the starting frames.”
“These remarkable new images of the M87 black hole prove that Einstein was right yet again,” says Maria Zuber, MIT’s vice president for research and the E.A. Griswold Professor of Geophysics in the Department of Earth, Atmospheric and Planetary Sciences. “The discovery was enabled by advances in digital systems at which Haystack engineers have long excelled.”
“Nature was kind”
The images were taken by the Event Horizon Telescope, or EHT, a planet-scale array comprising eight radio telescopes, each in a remote, high-altitude environment, including the mountaintops of Hawaii, Spain’s Sierra Nevada, the Chilean desert, and the Antarctic ice sheet.
On any given day, each telescope operates independently, observing astrophysical objects that emit faint radio waves. However, a black hole is infinitely smaller and darker than any other radio source in the sky. To see it clearly, astronomers need to use very short wavelengths — in this case, 1.3 millimeters — that can cut through the clouds of material between a black hole and the Earth.
Making a picture of a black hole also requires a magnification, or “angular resolution,” equivalent to reading a text on a phone in New York from a sidewalk café in Paris. A telescope’s angular resolution increases with the size of its receiving dish. However, even the largest radio telescopes on Earth are nowhere near big enough to see a black hole.
But when multiple radio telescopes, separated by very large distances, are synchronized and focused on a single source in the sky, they can operate as one very large radio dish, through a technique known as very long baseline interferometry, or VLBI. Their combined angular resolution as a result can be vastly improved.
For EHT, the eight participating telescopes summed up to a virtual radio dish as big as the Earth, with the ability to resolve an object down to 20 micro-arcseconds — about 3 million times sharper than 20/20 vision. By a happy coincidence, that’s about the precision required to view a black hole, according to Einstein’s equations.
“Nature was kind to us, and gave us something just big enough to see by using state-of-the-art equipment and techniques,” says Crew, co-leader of the EHT correlation working group and the ALMA Observatory VLBI team.
“Gobs of data”
On April 5, 2017, the EHT began observing M87. After consulting numerous weather forecasts, astronomers identified four nights that would produce clear conditions for all eight observatories — a rare opportunity, during which they could work as one collective dish to observe the black hole.
In radio astronomy, telescopes detect radio waves, at frequencies that register incoming photons as a wave, with an amplitude and phase that’s measured as a voltage. As they observed M87, every telescope took in streams of data in the form of voltages, represented as digital numbers.
“We’re recording gobs of data — petabytes of data for each station,” Crew says.
In total, each telescope took in about one petabyte of data, equal to 1 million gigabytes. Each station recorded this enormous influx that onto several Mark6 units — ultrafast data recorders that were originally developed at Haystack Observatory.
After the observing run ended, researchers at each station packed up the stack of hard drives and flew them via FedEx to Haystack Observatory, in Massachusetts, and Max Planck Institute for Radio Astronomy, in Germany. (Air transport was much faster than transmitting the data electronically.) At both locations, the data were played back into a highly specialized supercomputer called a correlator, which processed the data two streams at a time.
As each telescope occupies a different location on the EHT’s virtual radio dish, it has a slightly different view of the object of interest — in this case, M87. The data received by two separate telescopes may encode a similar signal of the black hole but also contain noise that’s specific to the respective telescopes.
The correlator lines up data from every possible pair of the EHT’s eight telescopes. From these comparisons, it mathematically weeds out the noise and picks out the black hole’s signal. High-precision atomic clocks installed at every telescope time-stamp incoming data, enabling analysts to match up data streams after the fact.
“Precisely lining up the data streams and accounting for all kinds of subtle perturbations to the timing is one of the things that Haystack specializes in,” says Colin Lonsdale, Haystack director and vice chair of the EHT directing board.
Teams at both Haystack and Max Planck then began the painstaking process of “correlating” the data, identifying a range of problems at the different telescopes, fixing them, and rerunning the correlation, until the data could be rigorously verified. Only then were the data released to four separate teams around the world, each tasked with generating an image from the data using independent techniques.
“It was the second week of June, and I remember I didn’t sleep the night before the data was released, to be sure I was prepared,” says Kazunori Akiyama, co-leader of the EHT imaging group and a postdoc working at Haystack.
All four imaging teams previously tested their algorithms on other astrophysical objects, making sure that their techniques would produce an accurate visual representation of the radio data. When the files were released, Akiyama and his colleagues immediately ran the data through their respective algorithms. Importantly, each team did so independently of the others, to avoid any group bias in the results.
“The first image our group produced was slightly messy, but we saw this ring-like emission, and I was so excited at that moment,” Akiyama remembers. “But simultaneously I was worried that maybe I was the only person getting that black hole image.”
His concern was short-lived. Soon afterward all four teams met at the Black Hole Initiative at Harvard University to compare images, and found, with some relief, and much cheering and applause, that they all produced the same, lopsided, ring-like structure — the first direct images of a black hole.
“There have been ways to find signatures of black holes in astronomy, but this is the first time anyone’s ever taken a picture of one,” Crew says. “This is a watershed moment.”
“A new era”
The idea for the EHT was conceived in the early 2000s by Sheperd Doeleman, who was leading a pioneering VLBI program at Haystack Observatory and now directs the EHT project as an astronomer at the Harvard-Smithsonian Center for Astrophysics. At the time, Haystack engineers were developing the digital back-ends, recorders, and correlator that could process the enormous datastreams that an array of disparate telescopes would receive.
“The concept of imaging a black hole has been around for decades,” Lonsdale says. “But it was really the development of modern digital systems that got people thinking about radio astronomy as a way of actually doing it. More telescopes on mountaintops were being built, and the realization gradually came along that, hey, [imaging a black hole] isn’t absolutely crazy.”
In 2007, Doeleman’s team put the EHT concept to the test, installing Haystack’s recorders on three widely scattered radio telescopes and aiming them together at Sagittarius A*, the black hole at the center of our own galaxy.
“We didn’t have enough dishes to make an image,” recalls Fish, co-leader of the EHT science operations working group. “But we could see there was something there that’s about the right size.”
Today, the EHT has grown to an array of 11 observatories: ALMA, APEX, the Greenland Telescope, the IRAM 30-meter Telescope, the IRAM NOEMA Observatory, the Kitt Peak Telescope, the James Clerk Maxwell Telescope, the Large Millimeter Telescope Alfonso Serrano, the Submillimeter Array, the Submillimeter Telescope, and the South Pole Telescope.
Coordinating observations and analysis has involved over 200 scientists from around the world who make up the EHT collaboration, with 13 main institutions, including Haystack Observatory. Key funding was provided by the National Science Foundation, the European Research Council, and funding agencies in East Asia, including the Japan Society for the Promotion of Science. The telescopes contributing to this result were ALMA, APEX, the IRAM 30-meter telescope, the James Clerk Maxwell Telescope, the Large Millimeter Telescope Alfonso Serrano, the Submillimeter Array, the Submillimeter Telescope, and the South Pole Telescope.
More observatories are scheduled to join the EHT array, to sharpen the image of M87 as well as attempt to see through the dense material that lies between Earth and the center of our own galaxy, to the heart of Sagittarius A*.
“We’ve demonstrated that the EHT is the observatory to see a black hole on an event horizon scale,” Akiyama says. “This is the dawn of a new era of black hole astrophysics.”
The Haystack EHT team includes John Barrett, Roger Cappallo, Joseph Crowley, Mark Derome, Kevin Dudevoir, Michael Hecht, Lynn Matthews, Kotaro Moriyama, Michael Poirier, Alan Rogers, Chester Ruszczyk, Jason SooHoo, Don Sousa, Michael Titus, and Alan Whitney. Additional contributors were MIT alumni Daniel Palumbo, Katie Bouman, Lindy Blackburn, and Bill Freeman, a professor in MIT’s Department of Electrical Engineering and Computer Science.
Representative Image: Bronze dinosaur skeleton. Credit: University of Colorado Denver
Paleontologists are used to finding dinosaur bones and tracks. But remnants of soft tissue, like muscles or skin, are rare and often not well preserved. A very small percentage of tracks – much less than 1% – show skin traces.
Kyung-Soo Kim, PhD, of Chinju National University of Education recently found a set of very small tracks with perfect skin traces near Jinju City, Korea. CU Denver Professor Emeritus of Geology Martin Lockley, PhD, – with Kim, Jong Deock Lim of Korea and Lida Xing of Beijing – wrote a paper about the skin traces for the journal Scientific Reports. They described the skin as “exquisitely-preserved.”
First dinosaur tracks ever found with perfect skin impressions
“These are the first tracks ever found where perfect skin impressions cover the entire surface of every track,” Lockley said. The skin patterns of different groups of dinosaurs varied and, like fingerprints, were signatures of differences in anatomy.
The skin traces come from tracks of the smallest known theropod, the Minisauripus. The footprints are only an inch long, and the scientists were able to find perfectly preserved skin traces on them. This was the 10th discovery of a site with Minisauripus tracks and the first to show skin traces.
The tracks, found during large-scale excavations, were nearly lost. Kim, who is in charge of predevelopment paleontological survey and rescue, was able to stop the excavation when he spotted the first track on a broken slab. With the help of his team, he found four more tracks with perfect skin traces.
How to perfectly preserve dinosaur skin
“The tracks were made on a very thin layer of fine mud,” Lockley said, “rather like a coat of fresh paint only a millimeter thick.” When the blackbird-sized dinosaur stepped on this firm, sticky surface, the skin texture of the foot was reproduced perfectly, without slipping or sliding.
Evidence shows that, just before the tracks were made, there had been a rain shower leaving water-drop impressions. In one place, the dinosaur had stepped on a fresh rain drop mark, proving rain came first, and the dinosaur step came second. All this delicate evidence was preserved by being gently covered with more fine mud.
The ultimate secret of skin care
The texture of the dinosaur skin is the grade of a medium sandpaper, but with the tiny scale traces in perfect arrays, like a well-woven fabric. Each little scale trace is only a third- or a half-millimeter in diameter and very similar to rare examples of mummified skin seen on the feet of a couple of feathered birds from China. But the team noted that, although the skin texture is the same, the shape of the feet of the Chinese birds and the Korean dinosaur were quite different.
The paper reports the skin pattern as similar to examples from much larger, carnivorous theropod dinosaur tracks, in which scales are much larger but never preserved across the whole footprint.
The more distantly-related giant brontosaurs had scales that left traces 2-3 centimeters in diameter, the size of a quarter. So the delicate, perfectly-preserved Minisauripus skin texture is like a shrunken version of the skin of a much larger relative, with no shrinkage of the skin traces.
“This is the ultimate secret of skin care,” Lockley said.
Reference:
Kyung Soo Kim et al. Exquisitely-preserved, high-definition skin traces in diminutive theropod tracks from the Cretaceous of Korea, Scientific Reports (2019). DOI: 10.1038/s41598-019-38633-4
Massey volcanologists have discovered the driving force behind superheated gas-and-ash clouds from volcanic eruptions, which may help save lives and infrastructure around the globe.
Endangering 500 million people worldwide, pyroclastic density currents (or pyroclastic flows) are the most common and lethal volcanic threat, causing 50 per cent of fatalities caused by volcanic activity. During volcanic events, these currents transport hot mixtures of volcanic particles and gas over tens of kilometres, causing damage to infrastructure and loss of life.
One of the issues to studying these phenomena is that they are impossible to measure in real life. Using Massey’s Pyroclastic flow Eruption Large-scale Experiment (PELE) eruption simulator facility, the team were able to synthesize the natural behaviour of volcanic super-hazards and generate these flows as they occur in nature, but on a smaller scale.
Until now, scientists could not find the mechanism responsible for the super-mobility of these flows, and previous models were unable to accurately predict their velocity, runout and spread through hazard models, which put lives and infrastructure at risk.
Massey University’s Associate Professor Gert Lube says that through their unique experiments, the enigmatic friction-cheating mechanism was found.
“With several tonnes of pumice and gas in motion, our large-scale eruption simulations uncovered the flow enigma that has been baffling researchers for decades. We measured a low-friction air cushion that is self-generated in these flows and perpetuates their motion. We were able to mathematically describe the resulting flow behavior. There is an internal process that counters granular friction, where air lubrication develops under high basal shear when air is locally forced downwards by reversed pressure gradients and displaces particles upward.
“This explains how the currents are able to propagate over slopes, bypass tortuous flow paths, and ignore rough substrates and flat and upsloping terrain, without slowing down.”
“The discovery necessitates a re-evaluation of global hazard mitigation strategies and models that aim to predict the velocity, runout and spreading of these flows. Discovery of this air-lubrication mechanism opens a new path towards reliable predictions of pyroclastic flow motion and the extreme runout potential of these lethal currents, thereby reducing future casualties. It will be used by hazard scientists, as well as decision makers, and is envisaged to lead to major revisions of volcanic hazard forecasts.”
The article, Generation of air lubrication within pyroclastic density currents, was published in Nature Geoscience.
Reference:
Gert Lube et al. Generation of air lubrication within pyroclastic density currents, Nature Geoscience (2019). DOI: 10.1038/s41561-019-0338-2
A new Tel Aviv University study suggests that the genetic profiles of two extinct mammals with African ancestry — woolly mammoths, elephant-like animals that evolved in the arctic peninsula of Eurasia around 600,000 years ago, and Neanderthals, highly skilled early humans who evolved in Europe around 400,000 years ago — shared molecular characteristics of adaptation to cold environments.
The research attributes the human-elephant relationship during the Pleistocene epoch to their mutual ecology and shared living environments, in addition to other possible interactions between the two species. The study was led by Prof. Ran Barkai and Meidad Kislev of TAU’s Department of Archaeology and Ancient Near Eastern Cultures and published on April 8 in Human Biology.
“Neanderthals and mammoths lived together in Europe during the Ice Age. The evidence suggests that Neanderthals hunted and ate mammoths for tens of thousands of years and were actually physically dependent on calories extracted from mammoths for their successful adaptation,” says Prof. Barkai. “Neanderthals depended on mammoths for their very existence.
“They say you are what you eat. This was especially true of Neanderthals; they ate mammoths but were apparently also genetically similar to mammoths.”
To assess the degree of resemblance between mammoth and Neanderthal genetic components, the archaeologists reviewed three case studies of relevant gene variants and alleles — alternative forms of a gene that arise by mutation and are found at the same place on a chromosome — associated with cold-climate adaptation found in the genomes of both woolly mammoths and Neanderthals.
The first case study outlined the mutual appearance of the LEPR gene, related to thermogenesis and the regulation of adipose tissue and fat storage throughout the body. The second case study engaged genes related to keratin protein activity in both species. The third case study focused on skin and hair pigmentation variants in the genes MC1R and SLC7A11.
“Our observations present the likelihood of resemblance between numerous molecular variants that resulted in similar cold-adapted epigenetic traits of two species, both of which evolved in Eurasia from an African ancestor,” Kislev explains. “These remarkable findings offer supporting evidence for the contention regarding the nature of convergent evolution through molecular resemblance, in which similarities in genetic variants between adapted species are present.
“We believe these types of connections can be valuable for future evolutionary research. They’re especially interesting when they involve other large-brained mammals, with long life spans, complex social behavior and their interactions in shared habitats with early humans.”
According to the study, both species likely hailed from ancestors that came to Europe from Africa and adapted to living conditions in Ice Age Europe. The species also both became extinct more or less at the same time.
“It is now possible to try to answer a question no one has asked before: Are there genetic similarities between evolutionary adaptation paths in Neanderthals and mammoths?” Prof. Barkai says. “The answer seems to be yes. This idea alone opens endless avenues for new research in evolution, archaeology and other disciplines.
“At a time when proboscideans are under threat of disappearance from the world due to the ugly human greed for ivory, highlighting our shared history and similarities with elephants and mammoths might be a point worth taking into consideration.”
Reference:
Kislev, Barkai. Neanderthal and Woolly Mammoth Molecular Resemblance: Genetic Similarities May Underlie Cold Adaptation Suite. Human Biology, 2018; 90 (2): 1 DOI: 10.13110/humanbiology.90.2.03