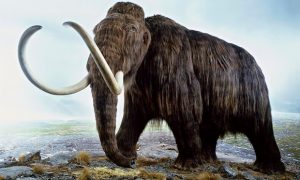
A new Tel Aviv University study suggests that the genetic profiles of two extinct mammals with African ancestry — woolly mammoths, elephant-like animals that evolved in the arctic peninsula of Eurasia around 600,000 years ago, and Neanderthals, highly skilled early humans who evolved in Europe around 400,000 years ago — shared molecular characteristics of adaptation to cold environments.
The research attributes the human-elephant relationship during the Pleistocene epoch to their mutual ecology and shared living environments, in addition to other possible interactions between the two species. The study was led by Prof. Ran Barkai and Meidad Kislev of TAU’s Department of Archaeology and Ancient Near Eastern Cultures and published on April 8 in Human Biology.
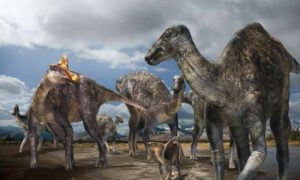
“Neanderthals and mammoths lived together in Europe during the Ice Age. The evidence suggests that Neanderthals hunted and ate mammoths for tens of thousands of years and were actually physically dependent on calories extracted from mammoths for their successful adaptation,” says Prof. Barkai. “Neanderthals depended on mammoths for their very existence.
“They say you are what you eat. This was especially true of Neanderthals; they ate mammoths but were apparently also genetically similar to mammoths.”
To assess the degree of resemblance between mammoth and Neanderthal genetic components, the archaeologists reviewed three case studies of relevant gene variants and alleles — alternative forms of a gene that arise by mutation and are found at the same place on a chromosome — associated with cold-climate adaptation found in the genomes of both woolly mammoths and Neanderthals.
The first case study outlined the mutual appearance of the LEPR gene, related to thermogenesis and the regulation of adipose tissue and fat storage throughout the body. The second case study engaged genes related to keratin protein activity in both species. The third case study focused on skin and hair pigmentation variants in the genes MC1R and SLC7A11.
“Our observations present the likelihood of resemblance between numerous molecular variants that resulted in similar cold-adapted epigenetic traits of two species, both of which evolved in Eurasia from an African ancestor,” Kislev explains. “These remarkable findings offer supporting evidence for the contention regarding the nature of convergent evolution through molecular resemblance, in which similarities in genetic variants between adapted species are present.
“We believe these types of connections can be valuable for future evolutionary research. They’re especially interesting when they involve other large-brained mammals, with long life spans, complex social behavior and their interactions in shared habitats with early humans.”
According to the study, both species likely hailed from ancestors that came to Europe from Africa and adapted to living conditions in Ice Age Europe. The species also both became extinct more or less at the same time.
“It is now possible to try to answer a question no one has asked before: Are there genetic similarities between evolutionary adaptation paths in Neanderthals and mammoths?” Prof. Barkai says. “The answer seems to be yes. This idea alone opens endless avenues for new research in evolution, archaeology and other disciplines.
“At a time when proboscideans are under threat of disappearance from the world due to the ugly human greed for ivory, highlighting our shared history and similarities with elephants and mammoths might be a point worth taking into consideration.”
Reference:
Kislev, Barkai. Neanderthal and Woolly Mammoth Molecular Resemblance: Genetic Similarities May Underlie Cold Adaptation Suite. Human Biology, 2018; 90 (2): 1 DOI: 10.13110/humanbiology.90.2.03
Note: The above post is reprinted from materials provided by American Friends of Tel Aviv University.