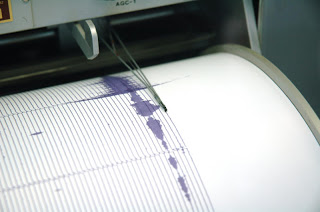
The best forecasts for earthquakes are about 10 times more accurate than a random prediction, a new study by scientists in California finds. (Credit: iStockphoto/Michal Bryc)
Earthquake prediction remains an imperfect science, but the best forecasts are about 10 times more accurate than a random prediction, according to a study published Sept. 26 in the Proceedings of the National Academy of Sciences.
In the study, UC Davis researchers compare seven different earthquake forecasts (including their own) that were submitted to a competition organized by the Southern California Earthquake Center.
The findings should help researchers both develop better earthquake forecasts and improve their tools for assessing those forecasts, said Donald Turcotte, a distinguished professor of geology at UC Davis and co-author of the paper.
The center launched the competition in 2005 based on a previous forecast published by the UC Davis group in 2001. Teams were invited to forecast the probability of an earthquake of magnitude 4.95 or greater, from Jan. 1, 2006, to Dec. 31, 2010, in almost 8,000 grid squares covering California and bordering areas.
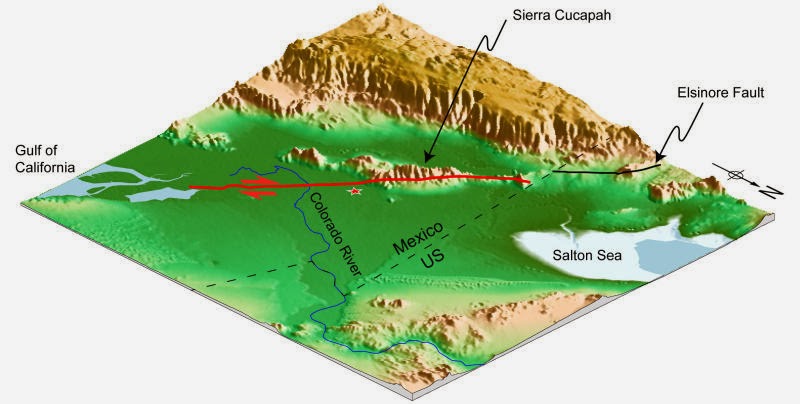
During this time, 31 earthquakes struck in 22 grid squares, with the largest being the magnitude 7.2 earthquake just south of the U.S.-Mexican border in April 2010. All seven forecasts showed some utility in forecasting the locations of likely earthquakes: The best forecasts were about 10 times better than a random forecast.
The forecast submitted by the UC Davis group was the most accurate in picking the locations of the earthquakes, correctly labeling 17 of 22 grids and giving the highest probability of an earthquake in eight of these 17. Using a different forecasting method, Agnes Helmstetter of UCLA and colleagues gave the highest average probability of an earthquake for all 22 affected grids, although it did less well at assigning a higher probability to grid squares where an earthquake occurred.
“Just as there are alternative ways to forecast earthquakes, there are also alternative ways to evaluate the success of the forecasts,” Turcotte said, noting that other publications evaluating the forecasts are expected.
The UC Davis group includes professors John Rundle and Turcotte, postdoctoral researcher James Holliday, and graduate students Ya Ting Lee and Michael Sachs. Also contributing were Chien-Chih Chen, National Central University, Taiwan; Kristy Tiampo, University of Western Ontario; and Andrea Donnellan of the Jet Propulsion Laboratory, Pasadena.
Note: This story has been adapted from a news release issued by the University of California – Davis
An international team of scientists has provided new insights into the processes behind the evolution of the planet by demonstrating how salty water and gases transfer from the atmosphere into Earth’s interior.
The paper was published in Nature Geoscience on September 26.
Scientists have long argued about how Earth evolved from a primitive state in which it was covered by an ocean of molten rock, into the planet we live on today with a solid crust made of moving tectonic plates, oceans and an atmosphere.
Lead author Dr Mark Kendrick from the University of Melbourne’s School of Earth Sciences said inert gases trapped inside Earth’s interior provide important clues into the processes responsible for the birth of our planet and the subsequent evolution of its oceans and atmosphere.
“Our findings throw into uncertainty a recent conclusion that gases throughout the Earth were solely delivered by meteorites crashing into the planet,” he said.
The study shows atmospheric gases are mixed into the mantle, inside Earth’s interior, during the process called ‘subduction’, when tectonic plates collide and submerge beneath volcanoes in subduction zones.
“This finding is important because it was previously believed that inert gases inside the Earth had primordial origins and were trapped during the formation of the solar system,” Dr Kendrick said.
Because the composition of neon in Earth’s mantle is very similar to that in meteorites, it was recently suggested by scientists that most of Earth’s gases were delivered by meteorites during a late meteorite bombardment that also generated visible craters on Earth’s moon.
“Our study suggests a more complex history in which gases were also dissolved into the Earth while it was still covered by a molten layer, during the birth of the solar system,” he said.
It was previously assumed that gases could not sink with plates in tectonic subduction zones but escaped during eruption of overlying volcanoes.
“The new study shows this is not entirely true and the gases released from Earth’s interior have not faithfully preserved the fingerprint of solar system formation.”
To undergo the study researchers collected serpentinite rocks from mountain belts in Italy and Spain. These rocks originally formed on the seafloor and were partially subducted into Earth’s interior before they were uplifted into their present positions by collision of the European and African plates.
“The serpentinite rocks are special because they trap large amounts of seawater in their crystal structure and can be transported to great depths in the Earth’s mantle by subduction,” he said.
By analysing the inert gases and halogens trapped in these rocks, the team was able to show gases are incompletely removed by the mineral transformations that affect serpentinites during the subduction process and hence provide new insights into the role of these trapped gases in the evolution of the planet.
The study was done in collaboration with researchers from the Australian National University, Canberra and The University of Genoa, Italy.
Note : The above story is reprinted from materials provided by University of Melbourne.
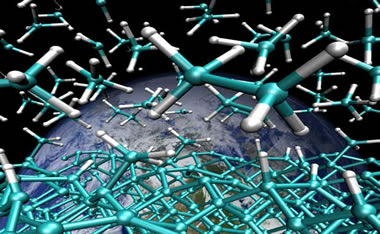
A snapshot taken from a first-principles molecular dynamics simulation of liquid m thane in contact with a hydrogen-terminated diamond surface at high temperature and pressure. The spontaneous formation of longer hydrocarbons are readily found during the simulations. Lawrence Livermore National Laboratory image. Hydrocarbon Forming Environmentse
Geologists and geochemists believe that nearly all (more than 99 percent) of the hydrocarbons in commercially produced crude oil and natural gas are formed by the decomposition of the remains of living organisms, which were buried under layers of sediments in the Earth’s crust, a region approximately 5-10 miles below the Earth’s surface.
But hydrocarbons of purely chemical deep crustal or mantle origin (abiogenic) could occur in some geologic settings, such as rifts or subduction zones said Galli, a senior author on the study.
Formation Under Extreme Conditions
A new computational study published in the Proceedings of the National Academy of Sciences reveals how hydrocarbons may be formed from methane in deep Earth at extreme pressures and temperatures.
The thermodynamic and kinetic properties of hydrocarbons at high pressures and temperatures are important for understanding carbon reservoirs and fluxes in Earth.
The work provides a basis for understanding experiments that demonstrated polymerization of methane to form high hydrocarbons and earlier methane forming reactions under pressure.
What Are Hydrocarbons?
Hydrocarbons (molecules composed of the elements hydrogen and carbon) are the main building block of crude oil and natural gas. Hydrocarbons contribute to the global carbon cycle (one of the most important cycles of the Earth that allows for carbon to be recycled and reused throughout the biosphere and all of its organisms).
The team includes colleagues at UC Davis, Lawrence Livermore National Laboratory and Shell Projects & Technology. One of the researchers, UC Davis Professor Giulia Galli, is the co-chair of the Deep Carbon Observatory’s Physics and Chemistry of Deep Carbon Directorate and former LLNL researcher.
Fusing Methane into Larger Hydrocarbons
“Our simulation study shows that methane molecules fuse to form larger hydrocarbon molecules when exposed to the very high temperatures and pressures of the Earth’s upper mantle,” Galli said. “We don’t say that higher hydrocarbons actually occur under the realistic ‘dirty’ Earth mantle conditions, but we say that the pressures and temperatures alone are right for it to happen.
Galli and colleagues used the Mako computer cluster in Berkeley and computers at Lawrence Livermore to simulate the behavior of carbon and hydrogen atoms at the enormous pressures and temperatures found 40 to 95 miles deep inside the Earth. They used sophisticated techniques based on first principles and the computer software system Qbox, developed at UC Davis.
Extreme Temperature & Pressure of Formation
They found that hydrocarbons with multiple carbon atoms can form from methane, (a molecule with only one carbon and four hydrogen atoms) at temperatures greater than 1,500 K (2,240 degrees Fahrenheit) and pressures 50,000 times those at the Earth’s surface (conditions found about 70 miles below the surface).
“In the simulation, interactions with metal or carbon surfaces allowed the process to occur faster — they act as ‘catalysts,’ ” said UC Davis’ Leonardo Spanu, the first author of the paper. The research does not address whether hydrocarbons formed deep in the Earth could migrate closer to the surface and contribute to oil or gas deposits. However, the study points to possible microscopic mechanisms of hydrocarbon formation under very high temperatures and pressures. Galli’s co-authors on the paper are Spanu; Davide Donadio at the Max Planck Institute in Meinz, Germany; Detlef Hohl at Shell Global Solutions, Houston; and Eric Schwegler of Lawrence Livermore National Laboratory.
Note : release by the Lawrence Livermore National Laboratory.
Republished from an initial assessment of 14 regions outside of the United States by the Energy Information Administration
What Triggered the U.S. Shale Gas Revolution?
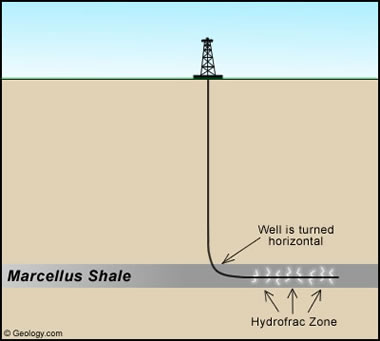
The use of horizontal drilling in conjunction with hydraulic fracturing has greatly expanded the ability of producers to profitably produce natural gas from low permeability geologic formations, particularly shale formations. Application of fracturing techniques to stimulate oil and gas production began to grow rapidly in the 1950s, although experimentation dates back to the 19th century.
Starting in the mid- 1970s, a partnership of private operators, the U.S. Department of Energy and the Gas Research Institute endeavored to develop technologies for the commercial production of natural gas from the relatively shallow Devonian (Huron) shale in the Eastern United States. This partnership helped foster technologies that eventually became crucial to producing natural gas from shale rock, including horizontal wells, multi-stage fracturing, and slick-water fracturing. [1]
The use of horizontal drilling
Horizontal Drilling Technology
Practical application of horizontal drilling to oil production began in the early 1980s, by which time the advent of improved downhole drilling motors and the invention of other necessary supporting equipment, materials, and technologies, particularly downhole telemetry equipment, had brought some applications within the realm of commercial viability. [2]
The Work of Mitchell Energy and Development
The advent of large-scale shale gas production did not occur until Mitchell Energy and Development Corporation experimented during the 1980s and 1990s to make deep shale gas production a commercial reality in the Barnett Shale in North-Central Texas. As the success of Mitchell Energy and Development became apparent, other companies aggressively entered this play so that by 2005, the Barnett Shale alone was producing almost half a trillion cubic feet per year of natural gas. As natural gas producers gained confidence in the ability to profitably produce natural gas in the Barnett Shale and confirmation of this ability was provided by the results from the Fayetteville Shale in North Arkansas, they began pursuing other shale formations, including the Haynesville, Marcellus, Woodford, Eagle Ford and other shales.
The Natural Gas “Game Changer”
The development of shale gas plays has become a “game changer” for the U.S. natural gas market. The proliferation of activity into new shale plays has increased shale gas production in the United States from 0.39 trillion cubic feet in 2000 to 4.87 trillion cubic feet in 2010, or 23 percent of U.S. dry gas production. Shale gas reserves have increased to about 60.6 trillion cubic feet by year-end 2009, when they comprised about 21 percent of overall U.S. natural gas reserves, now at the highest level since 1971. [3]
The growing importance of U.S. shale gas resources is also reflected in EIA’s Annual Energy Outlook 2011 (AEO2011) energy projections, with technically recoverable U.S. shale gas resources now estimated at 862 trillion cubic feet. Given a total natural gas resource base of 2,543 trillion cubic feet in the AEO2011 Reference case, shale gas resources constitute 34 percent of the domestic natural gas resource base represented in the AEO2011 projections and 50 percent of lower 48 onshore resources. As a result, shale gas is the largest contributor to the projected growth in production, and by 2035 shale gas production accounts for 46 percent of U.S. natural gas production.
Diffusion of Shale Gas Technologies
The successful investment of capital and diffusion of shale gas technologies has continued into Canadian shales as well. In response, several other countries have expressed interest in developing their own nascent shale gas resource base, which has lead to questions regarding the broader implications of shale gas for international natural gas markets. The U.S. Energy Information Administration (EIA) has received and responded to numerous requests over the past three years for information and analysis regarding domestic and international shale gas. EIA’s previous work on the topic has begun to identify the importance of shale gas on the outlook for natural gas. [4] It appears evident from the significant investments in preliminary leasing activity in many parts of the world that there is significant international potential for shale gas that could play an increasingly important role in global natural gas markets.
To gain a better understanding of the potential of international shale gas resources, EIA commissioned an external consultant, Advanced Resources International, Inc. (ARI), to develop an initial set of shale gas resource assessments. This paper briefly describes key results, the report scope and methodology and discusses the key assumptions that underlie the results. The full consultant report prepared for EIA is in Attachment A. EIA anticipates using this work to inform other analysis and projections, and to provide a starting point for additional work on this and related topics.
Shale Gas in Worldwide Basins
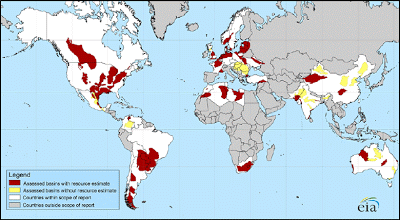
In total, the report assessed 48 shale gas basins in 32 countries, containing almost 70 shale gas formations. These assessments cover the most prospective shale gas resources in a select group of countries that demonstrate some level of relatively near-term promise and for basins that have a sufficient amount of geologic data for resource analysis. The map at the top of this page shows the location of these basins and the regions analyzed. The map legend indicates four different colors on the world map that correspond to the geographic scope of this initial assessment:
Red colored areas represent the location of assessed shale gas basins for which estimates of the ‘risked’ gas-in-place and technically recoverable resources were provided.
Yellow colored area represents the location of shale gas basins that were reviewed, but for which estimates were not provided, mainly due to the lack of data necessary to conduct the assessment.
White colored countries are those for which at least one shale gas basin was considered for this report.
Gray colored countries are those for which no shale gas basins were considered for this report.
The International Shale Gas Resource Base
Although the shale gas resource estimates will likely change over time as additional information becomes available, the report shows that the international shale gas resource base is vast. The initial estimate of technically recoverable shale gas resources in the 32 countries examined is 5,760 trillion cubic feet, as shown in Table 1. Adding the U.S. estimate of the shale gas technically recoverable resources of 862 trillion cubic feet results in a total shale resource base estimate of 6,622 trillion cubic feet for the United States and the other 32 countries assessed.
To put this shale gas resource estimate in some perspective, world proven reserves [5] of natural gas as of January 1, 2010 are about 6,609 trillion cubic feet, [6] and world technically recoverable gas resources are roughly 16,000 trillion cubic feet, [7] largely excluding shale gas. Thus, adding the identified shale gas resources to other gas resources increases total world technically recoverable gas resources by over 40 percent to 22,600 trillion cubic feet.
Conservative Basin Estimates
The estimates of technically recoverable shale gas resources for the 32 countries outside of the United States represents a moderately conservative ‘risked’ resource for the basins reviewed. These estimates are uncertain given the relatively sparse data that currently exist and the approach the consultant has employed would likely result in a higher estimate once better information is available. The methodology is outlined below and described in more detail within the attached report, and is not directly comparable to more detailed resource assessments that result in a probabilistic range of the technically recoverable resource. At the current time, there are efforts underway to develop more detailed shale gas resource assessments by the countries themselves, with many of these assessments being assisted by a number of U.S. federal agencies under the auspices of the Global Shale Gas Initiative (GSGI) which was launched in April 2010. [8]
Highly Dependent Countries
Delving deeper into the results at a country level, there are two country groupings that emerge where shale gas development may appear most attractive. The first group consists of countries that are currently highly dependent upon natural gas imports, have at least some gas production infrastructure, and their estimated shale gas resources are substantial relative to their current gas consumption. For these countries, shale gas development could significantly alter their future gas balance, which may motivate development. Examples of countries in this group include France, Poland, Turkey, Ukraine, South Africa, Morocco, and Chile. In addition, South Africa’s shale gas resource endowment is interesting as it may be attractive for use of that natural gas as a feedstock to their existing gas-to-liquids (GTL) and coal-to-liquids (CTL) plants.
Countries with a Natural Gas Infrastructure
The second group consists of those countries where the shale gas resource estimate is large (e.g., above 200 trillion cubic feet) and there already exists a significant natural gas production infrastructure for internal use or for export. In addition to the United States, notable examples of this group include Canada, Mexico, China, Australia, Libya, Algeria, Argentina, and Brazil. Existing infrastructure would aide in the timely conversion of the resource into production, but could also lead to competition with other natural gas supply sources. For an individual country the situation could be more complex.
References for World Shale Ga
[1] G.E. King, Apache Corporation, “Thirty Years of Gas Shale Fracturing: What Have We Learned?”, prepared for the SPE Annual Technical Conference and Exhibition (SPE 133456), Florence, Italy, (September 2010); and U.S. Department of Energy, DOE’s Early Investment in Shale Gas Technology Producing Results Today, (February 2011), web site.
[2] See: U.S. Energy Information Administration, “Drilling Sideways: A Review of Horizontal Well Technology and Its Domestic Application”, DOE/EIA-TR-0565 (April 1993).
[3] U.S. Crude Oil, Natural Gas, and Natural Gas Liquids Proved Reserves, 2009, web site.
[4] Examples of EIA work that has spurred or resulted from interest in this topic includes: U.S. Energy Information Administration, AEO2011 Early Release Overview (Dec 2010); R. Newell, U.S. Energy Information Administration, “Shale Gas, A Game Changer for U.S. and Global Gas Markets?”, presented at the Flame – European Gas Conference, Amsterdam, Netherlands (March 2, 2010); H. Gruenspecht, U.S. Energy Information Administration, “International Energy Outlook 2010 With Projections to 2035”, presented at Center for Strategic and International Studies, Washington, D.C. (May 25, 2010); and R. Newell, U.S. Energy Information Administration, “The Long-term Outlook for Natural Gas”, presented to the Saudi Arabia – United States Energy Consultations, Washington, D.C. (February 2, 2011).
[5] Reserves refer to gas that is known to exist and is readily producible, which is a subset of the technically recoverable resource base estimate for that source of supply. Those estimates encompass both reserves and that natural gas which is inferred to exist, as well as undiscovered, and can technically be produced using existing technology. For example, EIA’s estimate of all forms of technically recoverable natural gas resources in the U.S. for the Annual Energy Outlook 2011 is 2,552 trillion cubic feet, of which 827 trillion cubic feet consists of unproved shale gas resources and 245 trillion cubic feet are proved reserves which consist of all forms of readily producible natural gas including 34 trillion cubic feet of shale gas.
[6] “Total reserves, production climb on mixed results,” Oil and Gas Journal (December 6, 2010), pp. 46-49.
[7] Includes 6,609 trillion cubic feet of world proven gas reserves (Oil and Gas Journal 2010); 3,305 trillion cubic feet of world mean estimates of inferred gas reserves, excluding the Unites States (USGS, World Petroleum Assessment 2000); 4,669 trillion cubic feet of world mean estimates of undiscovered natural gas, excluding the United States (USGS, World Petroleum Assessment 2000); and U.S. inferred reserves and undiscovered gas resources of 2,307 trillion cubic feet in the United States, including 827 trillion cubic feet of unproved shale gas (EIA, AEO2011).
[8] The Department of State is the lead agency for the GSGI, and the other U.S. government agencies that also participate include: the U.S. Agency for International Development (USAID); the Department of Interior’s U.S. Geological Survey (USGS); Department of Interior’s Bureau of Ocean Energy Management, Regulation, and Enforcement (BOEMRE); the Department of Commerce’s Commercial Law Development Program (CLDP); the Environmental Protection Agency (EPA), and the Department of Energy’s Office of Fossil
Energy (DOE/FE). Web site. Note : This note copied form geology site
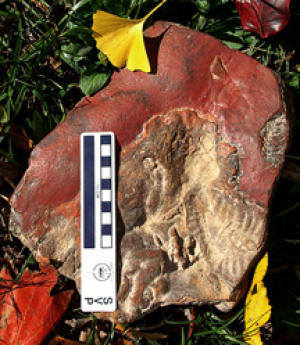
Fossil of the baby nodosaur. (Credit: Ray Stanford)
Researchers at the Johns Hopkins University School of Medicine with help from an amateur fossil hunter in College Park, Md., have described the fossil of an armored dinosaur hatchling. It is the youngest nodosaur ever discovered, and a founder of a new genus and species that lived approximately 110 million years ago during the Early Cretaceous Era. Nodosaurs have been found in diverse locations worldwide, but they’ve rarely been found in the United States. The findings are published in the September 9 issue of the Journal of Paleontology.
“Now we can learn about the development of limbs and the development of skulls early on in a dinosaur’s life,” says David Weishampel, Ph.D., a professor of anatomy at the Johns Hopkins University School of Medicine. “The very small size also reveals that there was a nearby nesting area or rookery, since it couldn’t have wandered far from where it hatched. We have the opportunity to find out about dinosaur parenting and reproductive biology, as well as more about the lives of Maryland dinosaurs in general.”
The fossil was discovered in 1997 by Ray Stanford, a dinosaur tracker who often spent time looking for fossils close to his home; this time he was searching a creek bed after an extensive flood.
Stanford identified it as a nodosaur and called Weishampel, a paleontologist and expert in dinosaur systematics. Weishampel and his colleagues established the fossil’s identity as a nodosaur by identifying a distinctive pattern of bumps and grooves on the skull.
They then did a computer analysis of the skull shape, comparing its proportions to those of ten skulls from different species of ankylosaurs, the group that contains nodosaurs. They found that this dinosaur was closely related to some of the nodosaur species, although it had a shorter snout overall than the others. Comparative measurements enabled them to designate a new species, Propanoplosaurus marylandicus. In addition to being the youngest nodosaur ever found, it is the first hatchling of any dinosaur species ever recovered in the eastern United States, says Weishampel.
The area had originally been a flood plain, where Weishampel says that the dinosaur originally drowned. Cleaning the fossil revealed a hatchling nodosaur on its back, much of its body imprinted along with the top of its skull. Weishampel determined the dinosaur’s age at time of death by analyzing the degree of development and articulation capability of the ends of the bones, as well as deducing whether the bones themselves were porous, as young bones would not be fully solid.
Size was also a clue: the body in the tiny fossil was only 13 cm long, just shorter than the length of a dollar bill. Adult nodosaurs are estimated to have been 20 to 30 feet long. Weishampel also used the position and quality of the fossil to deduce the dinosaur’s method of death and preservation: drowning, and getting buried by sediment in the stream. Egg shells have never been found preserved in the vicinity, and by the layout of the bones and the size of some very small nodosaur footprints found nearby, led Weishampel to believe that the dinosaur was a hatchling, rather than an embryo, because it was able to walk independently.
“We didn’t know much about hatchling nodosaurs at all prior to this discovery,” says Weishampel. “And this is certainly enough to motivate more searches for dinosaurs in Maryland, along with more analysis of Maryland dinosaurs.”
Stanford has donated the hatchling nodosaur to the Smithsonian’s National Museum of Natural History, where it is now on display to the public and also available for research.
This study was funded by the Johns Hopkins Center of Functional Anatomy and Evolution.
Valerie DeLeon, also of the Center of Functional Anatomy and Evolution, was an additional author.
Note : The above story is reprinted from materials provided by Johns Hopkins Medical Institutions.
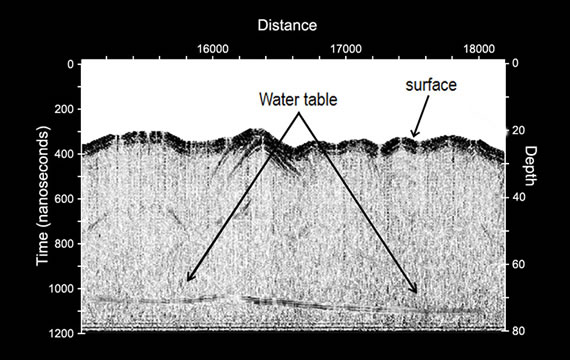
The NASA-led team used the 40-megahertz airborne sounding radar prototype to probe the desert subsurface above the Umm-El-Aish aquifer in northern Kuwait, creating this high-resolution cross section of the aquifer. The radargram shows variations in the depth of the water table from 161 to 171 feet (49 to 52 meters). Image credit: NASA/JPL-Caltech Mars Technology Used to Find Water on Earth
A NASA-led team has used radar sounding technology developed to explore the subsurface of Mars to create high-resolution maps of freshwater aquifers buried deep beneath an Earth desert, in the first use of airborne sounding radar for aquifer mapping.
The research may help scientists better locate and map Earth’s desert aquifers, understand current and past hydrological conditions in Earth’s deserts and assess how climate change is impacting them. Deserts cover roughly 20 percent of Earth’s land surface, including highly populated regions in the Arabian Peninsula, North Africa, west and central Asia and the southwestern United States.
An international team led by research scientist Essam Heggy of NASA’s Jet Propulsion Laboratory, Pasadena, California, recently traveled to northern Kuwait to map the depth and extent of aquifers in arid environments using an airborne sounding radar prototype. The 40-megahertz, low-frequency sounding radar was provided by the California Institute of Technology in Pasadena; and the Institut de Physique du Globe de Paris, France. Heggy’s team was joined by personnel from the Kuwait Institute for Scientific Research (KISR), Kuwait City.
Mapping Subsurface Aquifers by Helicopter
For two weeks, the team flew a helicopter equipped with the radar on 12 low-altitude passes (1,000 feet, or 305 meters) over two well-known freshwater aquifers, probing the desert subsurface down to the water table at depths ranging from 66 to 213 feet (20 to 65 meters). The researchers successfully demonstrated that the radar could locate subsurface aquifers, probe variations in the depth of the water table, and identify locations where water flowed into and out of the aquifers.
“This demonstration is a critical first step that will hopefully lead to large-scale mapping of aquifers, not only improving our ability to quantify groundwater processes, but also helping water managers drill more accurately,” said Muhammad Al-Rashed, director of KISR’s Division of Water Resources.
How Radar Sounding Works
The radar is sensitive to changes in electrical characteristics of subsurface rock, sediments and water- saturated soils. Water-saturated zones are highly reflective and mirror the low-frequency radar signal. The returned radar echoes explored the thick mixture of gravel, sand and silt that covers most of Kuwait’s northern desert and lies above its water table.
The team created high-resolution cross sections of the subsurface, showing variations in the fresh groundwater table in the two aquifers studied. The radar results were validated with ground measurements performed by KISR.
“This research will help scientists better understand Earth’s fossil aquifer systems, the approximate number, occurrence and distribution of which remain largely unknown,” said Heggy. “Much of the evidence for climate change in Earth’s deserts lies beneath the surface and is reflected in its groundwater. By mapping desert aquifers with this technology, we can detect layers deposited by ancient geological processes and trace back paleoclimatic conditions that existed thousands of years ago, when many of today’s deserts were wet.”
Climate Change Data from Desert Regions
Heggy said most recent observations, scientific interest and data analyses of global warming have concentrated on Earth’s polar regions and forests, which provide direct measurable evidence of large-scale environmental changes. Arid and semi-arid environments, which represent a substantial portion of Earth’s surface, have remained poorly studied. Yet water scarcity and salt content, changes in rainfall, flash floods, high rates of aquifer exploitation and growth of desert regions are all signs that suggest climate change and human activities are also affecting these arid and semi-arid zones.
Mars Water-Mapping Technology
The radar sounding prototype shares similar characteristics with two instruments flying on Mars-orbiting spacecraft: Mars Advanced Radar for Subsurface and Ionospheric Sounding (MARSIS), on the European Space Agency’s Mars Express, and Shallow Radar (SHARAD), on NASA’s Mars Reconnaissance Orbiter. MARSIS, jointly developed by JPL and the Italian Space Agency, probes the Martian subsurface sediments and polar ice caps to a maximum depth of about 1.9 miles (3 kilometers). SHARAD, also built by the Italian Space Agency, looks for liquid or frozen water in the first few hundred feet of Mars’ crust and probes Mars’ polar caps. Both instruments have found evidence of ice in the Martian subsurface, but have not yet detected liquid water. The Kuwait results may lead to revised interpretations of data from these two instruments.
The research follows earlier work by JPL scientists to probe the subsurface of the Sahara desert using higher-frequency Synthetic Aperture Radar instruments flown onboard three space shuttle missions in 1981, 1984 and 1994. That work located shallow drainage networks and large dry basins, suggesting the Sahara has had extensive surface water activity in its recent geological past.
Conditions in Kuwait Support Mapping
Kuwait’s well-mapped shallow aquifers and flat surface provided the team with an ideal test location. Extreme dryness, such as that present in this region of Kuwait, is necessary to allow the radar’s waves to penetrate deep into the surface and reflect on water-saturated layers beneath. Kuwait’s flat topography and low radio noise also reduced clutter and improved the radar signal’s return.
Mapping Aquifers in Hyper-Arid Regions
“Results of this study pave the way for potential airborne mapping of aquifers in hyper-arid regions such as the Sahara and Arabian Peninsula, and can be applied to design concepts for a possible future satellite mission to map Earth’s desert aquifers,” said Craig Dobson, program officer for Geodetic Imaging and Airborne Instrument Technology Transition programs at NASA Headquarters, Washington. The work is a pathfinder for the Orbiting Arid Subsurface and Ice Sheet Sounder (OASIS), a NASA spacecraft mission concept designed to map shallow aquifers in Earth’s most arid desert regions and measure ice sheet volume, thickness, basal topography and discharge rates.
Research Support
The study was co-funded by the California Institute of Technology’s Keck Institute for Space Studies and KISR. The Kuwaiti Police Air Force provided technical support for the flight tests.
JPL is managed for NASA by the California Institute of Technology in Pasadena.
Republished from a September, 2011 press release Alan Buis of NASA/JPL.
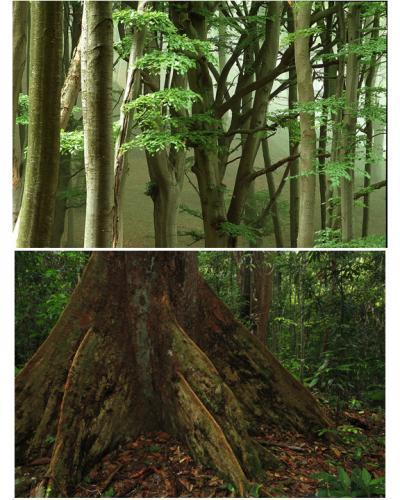
This is a split image showing highly diverse tropical forest in Borneo (Lambir) on the bottom and a lower diversity temperate beech forest in Jasmund National Park (Germany) on the top. (Credit: Christian Ziegler)
History and geology, not current ecology, are likely what has made tropical forests so variable from site to site, according to a new study published in the journal Science, co-authored by Liza Comita, research associate at the Smithsonian Tropical Research Institute in Panama.
“The same ecological processes seem to be working worldwide. The difference is that tropical organisms have been accumulating for vast periods of time,” said Nathan J.B. Kraft, post-doctoral fellow at the University of British Colombia, who led the research team.
“This study shows how collecting data using the same methods at sites around the world, similar to what we do at the Center for Tropical Forest Science-Smithsonian Institution Global Earth Observatories Network, offers new insights into the processes that shape ecological communities,” said Comita, formerly a post-doctoral fellow at the National Center for Ecological Analysis and Synthesis, now an assistant professor at The Ohio State University. “We found that measurements of variation in biodiversity from place to place, called beta diversity, are actually very similar as you move from the tropics to the poles when you account for the number of species present in the first place.”
Forests in Canada and Europe may have much more in common with tropical rainforests than previously believed. “We see that biodiversity patterns can be explained not by current ecological processes, unfolding over one or two generations, but by much longer-term historical and geological events,” said Kraft, who will join the faculty at the University of Maryland next year.
“Fossils tell a similar story,” said STRI scientist, Aaron O’Dea, co-author, with Willem Renema and others, of a 2008 article in Science showing that marine biodiversity hotspots could be traced back to ancient areas of tectonic activity. “Geological history reveals that glaciations and mass extinctions have lasting effects on the structure of biological communities. It bears witness to the devastation that occurs when accumulated biodiversity is lost: a threat we are facing today.”
The team, which also included researchers from institutions in the U.S., Canada and New Zealand, was supported by the U.S. National Center for Ecological Analysis and Synthesis and the U.S. National Science Foundation.
Note : The above story is reprinted from materials provided by Smithsonian Tropical Research Institute, via EurekAlert!, a service of AAAS.
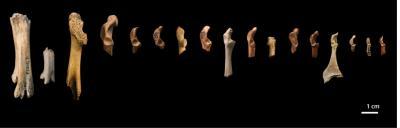
The bones are from the 17 species of Cretaceous birds which went extinct around the time of the dinosaurs. The two on the far left are foot bones and the rest are shoulder bones. (Credit: Courtesy Yale University)
A new study puts an end to the longstanding debate about how archaic birds went extinct, suggesting they were virtually wiped out by the same meteorite impact that put an end to dinosaurs 65 million years ago
For decades, scientists have debated whether birds from the Cretaceous period — which are very different from today’s modern bird species — died out slowly or were killed suddenly by the Chicxulub meteorite. The uncertainty was due in part to the fact that very few fossil birds from the end of this era have been discovered.
Now a team of paleontologists led by Yale researcher Nicholas Longrich has provided clear evidence that many primitive bird species survived right up until the time of the meteorite impact. They identified and dated a large collection of bird fossils representing a range of different species, many of which were alive within 300,000 years of the impact.
“This proves that these species went extinct very abruptly, in terms of geological time scales,” said Longrich. The study appears the week of Sept. 19 in the journal Proceedings of the National Academy of Sciences.
The team examined a large collection of about two dozen bird fossils discovered in North America — representing a wide range of the species that existed during the Cretaceous — from the collections of Yale’s Peabody Museum of Natural History, the American Museum of Natural History, the University of California Museum of Paleontology, and the Royal Saskatchewan Museum. Fossil birds from the Cretaceous are extremely rare, Longrich said, because bird bones are so light and fragile that they are easily damaged or swept away in streams.
“The birds that had been discovered hadn’t really been studied in a rigorous way,” Longrich said. “We took a much more detailed look at the relationships between these bones and these birds than anyone had done before.”
Longrich believes a small fraction of the Cretaceous bird species survived the impact, giving rise to today’s birds. The birds he examined showed much more diversity than had yet been seen in birds from the late Cretaceous, ranging in size from that of a starling up to a small goose. Some had long beaks full of teeth.
Yet modern birds are very different from those that existed during the late Cretaceous, Longrich said. For instance, today’s birds have developed a much wider range of specialized features and behaviors, from penguins to hummingbirds to flamingoes, while the primitive birds would have occupied a narrower range of ecological niches.
“The basic bird design was in place, but all of the specialized features developed after the mass extinction, when birds sort of re-evolved with all the diversity they display today,” Longrich said. “It’s similar to what happened with mammals after the age of the dinosaurs.”
Longrich adds that this study is not the first to suggest that archaic birds went extinct abruptly. “There’s been growing evidence that these birds were wiped out at the same time as the dinosaurs,” Longrich said. “But this new evidence effectively closes the book on the debate.”
Other authors of the paper include Tim Tokaryk (Royal Saskatchewan Museum) and Daniel Field (Yale University).
Skeletal elements of Talos and Troodon illustrating select diagnostic characters of Talos sampsoni (UMNH VP 19479). (Credit: Zanno LE, Varricchio DJ, O’Connor PM, Titus AL, Knell MJ (2011) A New Troodontid Theropod, Talos sampsoni gen. et sp. nov., from the Upper Cretaceous Western Interior Basin of North America. PLoS ONE 6(9): e24487. doi:10.1371/journal.pone.0024487)
Raptor dinosaurs like the iconic Velociraptor from the movie franchise Jurassic Park are renowned for their “fear-factor.” Their terrifying image has been popularized in part because members of this group possess a greatly enlarged talon on their foot — analogous to a butcher’s hook. Yet the function of the highly recurved claw on the foot of raptor dinosaurs has largely remained a mystery to paleontologists. This week a collaboration of scientists unveil a new species of raptor dinosaur discovered in southern Utah that sheds new light on this and several other long-standing questions in paleontology, including how dinosaurs evolved on the “lost continent” of Laramidia (western North America) during the Late Cretaceous — a period known as the zenith of dinosaur diversity.
Their findings will be published in the journal PLoS ONE.
The new dinosaur — dubbed Talos sampsoni — is a member of a rare group of feathered, bird-like theropod dinosaurs whose evolution in North America has been a longstanding source of scientific debate, largely for lack of decent fossil material. Indeed, Talos represents the first definitive troodontid theropod to be named from the Late Cretaceous of North America in over 75 years. “Finding a decent specimen of this type of dinosaur in North America is like a lighting strike… it’s a random event of thrilling proportions,” said Lindsay Zanno, lead author of the study naming the new dinosaur. Zanno is an assistant professor of anatomy at the University of Wisconsin-Parkside and a research associate at the Field Museum of Natural History in Chicago, Illinois. Other members of the research team include Mike Knell (a graduate student at Montana State University) who discovered the new specimen in 2008 in the Kaiparowits Formation of Grand Staircase-Escalante National Monument (GSENM), southern Utah; Bureau of Land Management (BLM) paleontologist Alan Titus, leader of a decade-long paleontology reconnaissance effort in the monument; David Varricchio, Associate Professor of Paleontology, Montana State University; and Patrick O’Connor, Associate Professor of Anatomy, Ohio University Heritage College of Osteopathic Medicine.
Funding for the research was provided in part by the National Science Foundation, the Field Museum of Natural History, the Ohio University Heritage College of Osteopathic Medicine, and the Bureau of Land Management. Zanno’s research was supported by a John Caldwell-Meeker Fellowship and by a Bucksbaum Fellowship for young scientists. The bones of Talos sampsoni will be on exhibit for the first time in the Past Worlds Observatory at the new Utah Museum of Natural History, Salt Lake City, Utah.
The Nature of the Beast Troodontid theropods are a group of feathered dinosaurs closely related to birds. Members of this group are among the smallest non-avian dinosaurs known (as small as 100 grams) and are considered among the most intelligent. The group is known almost exclusively from Asia and prior to the discovery of Talos sampsoni, only two species were recognized in the Late Cretaceous of North America — one of which, the infamous Troodon, was one of the first dinosaurs ever named from North America.
As a result of their distinctive teeth and the possible presence of seeds preserved as gut contents in one species, several scientists have proposed an omnivorous or herbivorous diet for at least some troodontids. Other species possess relatively blade-like teeth indicative of a carnivorous diet. Zanno’s own work on theropod diet suggests that extensive plant eating was confined to more primitive members of the group, with more advanced members of the clade like Troodon and Talos likely consuming at least some prey.
Several troodontid specimens have recently been discovered that not only support a close relationship with birds but also preserve remarkable evidence of bird-like behavior. These include extraordinary specimens such as eggs and embryos within nests that document transitional phases in the evolution of bird-like reproductive physiology and egg-laying behavior, as well as specimens preserved in distinctive avian-like sleeping postures with their heads rotated back and tucked under their “wings.” Other troodontids provide evidence of “four-winged” locomotor capabilities, and perhaps most extraordinary, plumage coloration.
With an estimated body mass of 38 kilograms, the newly discovered Talos sampsoni is neither the smallest nor largest troodontid known. Its skeleton indicates that the new species was much smaller and more slender than its famous cousin Troodon, which is known from sediments of the same age in the northern part of Laramidia (Alberta, Canada and Montana, USA). “Talos was fleet-footed and lightly built,” Zanno says. “This little guy was a scrapper.”
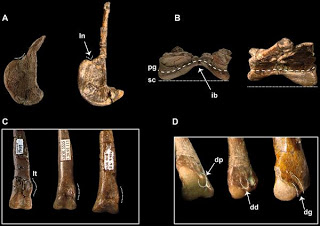
Interestingly, the holotype specimen of Talos also tells us something about theropod behavior, particularly raptor behavior. This is because the second toe — that is, the one with the enlarged talon — of the left foot of the new specimen is deformed, indicating that the animal suffered a fracture or bite during its life.
This Little Talos Takes a Beating
When the team first began studying the Talos specimen, they noticed some unusual features on the second digit of the left foot, but initially assumed they were related to the fact that it belonged to a new species. “When we realized we had evidence of an injury, the excitement was palpable,” Zanno commented. “An injured specimen has a story to tell.” That’s because evidence of injury relates to function. The manner in which an animal is hurt can tell you something about what it was doing during life. An injury to the foot of a raptor dinosaur, for example, provides new evidence about the potential function of that toe and claw. In order to learn about the injury to the animal’s foot, the team scanned the individual bones using a high-resolution Computed Tomography (CT) scanner, similar to those used by physicians to examine bones and other organs inside the human body.
“Although we could see damage on the exterior of the bone, our microCT approach was essential for characterizing the extent of the injury, and importantly, for allowing us to better constrain how long it had been between the time of injury and the time that this particular animal died,” noted Patrick O’Connor, associate professor of anatomy at Ohio University. After additional CT scanning of other parts of the foot, Zanno and her team realized that the injury was restricted to the toe with the enlarged claw, and the rest of the foot was not impacted. More detailed study suggested that the injured toe was either bitten or fractured and then suffered from a localized infection.
“People have speculated that the talon on the foot of raptor dinosaurs was used to capture prey, fight with other members of the same species, or defend the animal against attack. Our interpretation supports the idea that these animals regularly put this toe in harm’s way,” says Zanno.
Perhaps even more interesting is the fact that the injured toe exhibits evidence of bone remodeling thought to have taken place over a period of many weeks to months, suggesting that Talos lived with a serious injury to the foot for quite a long time. “It is clear from the bone remodeling that this animal lived for quite some time after the initial injury and subsequent infection, and that whatever it typically did with the enlarged talon on the left foot, whether that be acquire prey or interact with other members of the species, it must have been capable of doing so fairly well with the one on the right foot,” added O’Connor.
Trackways made by animals closely related to Talos suggest that they held the enlarged talon off the ground when walking. “Our data support the idea that the talon of raptor dinosaurs was not used for purposes as mundane as walking,” Zanno commented. “It was an instrument meant for inflicting damage.”
What’s in a Name?
The name Talos pays homage to a mythological Greek figure of the same name, believed to have protected the island of Crete by throwing stones at invading ships. It is said that the Greek Talos, who was often depicted as a winged bronze figure, could run at lightening speed and circled the ancient island three times a day. The dinosaur Talos belongs to a group of theropods known to have feathery integument (and in some cases “wings”), lived on the small island continent of Laramidia or west North America during the Late Cretaceous, and was also a fast runner. The team chose the name Talos because of these similarities but also because the Greek Talos was said to have died from a wound to the ankle and it was clear that Talos had also suffered a serious wound to the foot. The species name “sampsoni” honors another famous figure — Dr. Scott Sampson of the PBS series Dinosaur Train.
Sampson, a research curator at the Utah Museum of Natural History and research faculty at the University of Utah, helped to spearhead a collaborative research effort known as the Kaiparowits Basin Project, a long-term research project that has been surveying and documenting the Late Cretaceous dinosaur fauna of the Kaiparowits Basin in southern Utah, with a focus on the Kaiparowits and Wahweap formations exposed in Grand Staircase-Escalante National Monument (GSENM). Thus far this effort has resulted in the discovery of up to a dozen new dinosaurs from GSENM that are challenging previous ideas regarding Late Cretaceous dinosaur evolution and diversity within Laramidia and spurring new ideas regarding dinosaur biogeography in the region.
A Tale of Two Continents
Dinosaurs of the Late Cretaceous were living in a greenhouse world. A warm and equitable global climate that was devoid of polar ice caps and above average spreading at mid-oceanic ridges caused massive flooding of low-lying continental areas and created expansive epicontinental seaways. In North America, a shallow seaway running from the Gulf of Mexico through to the Arctic Ocean divided the continent into two landmasses, East America (Appalachia) and West America (Laramidia) for several million years during the Late Cretaceous. It was during this time that the dinosaurs achieved their greatest diversity, and scientists have been working overtime to understand why. Take for example the dinosaurs of Laramidia. The natural assumption is that being large bodied, those dinosaurs that lived on the small island continent would have roamed the whole area.
However, recent fossil discoveries, particularly new dinosaurs from the Kaiparowits Formation, tell us that the true pattern is exactly the opposite. Thus far the dinosaurs from the Kaiparowits Formation in southern Utah are entirely unique, even from those dinosaurs living just a few hundred miles to the north in what is now Montana and Alberta.
Monument Paleontologist Alan Titus observed, “When we began looking in the remote Kaiparowits badlands we expected to see at least a few familiar faces. As it turns out, they are all new to science.
” And while recent discoveries from the Kaiparowits have substantiated this pattern for large-bodied herbivores like duck-bill and horned dinosaurs (for example Utahceratops), the pattern among small-bodied theropods was not clear.
“We already knew that some of dinosaurs inhabiting southern Utah during the Late Cretaceous were unique,” Zanno said, “but Talos tells us that the singularity of this ecosystem was not just restricted to one or two species. Rather, the whole area was like a lost world in and of itself.”
A Monumental Discovery
Talos sampsoni is the newest member of a growing list of new dinosaur species that have been discovered in Grand Staircase Escalante National Monument (GSENM) in southern Utah. Former President Clinton founded the monument in 1996, in part to protect the world class paleontological resources entombed within its 1.9 million acres of unexplored territory.
GSENM is one of the largest recently designated national monuments managed by the BLM, and one of the last pristine dinosaur graveyards in the US. The area has turned out to be a treasure trove of new dinosaur species, with at least 15 collected in just the past decade. Titus admits, “We had very few large fossils to substantiate the claim of ‘World Class’ paleontology when I started in 2000.
Now, I feel GSENM could easily qualify as a world heritage site on the basis of its dinosaurs alone, dozens of which have been found preserving soft tissue.” He also adds, “BLM support has been critical to the long term viability of the region’s paleontology research and is paying off in countless ways both to the public and scientists.”
Zanno, along with colleague Scott Sampson, named the first dinosaur from the monument — Hagryphus giganteus — in 2005. Hagryphus (widely touted in the press as the “turkey” dinosaur) is also a theropod dinosaur, but one that belongs to a different subgroup known as oviraptorosaurs (or egg thief reptiles). Other GSENM dinosaurs include five new horned dinosaurs including the recently described and bizarrely ornate Kosmoceratops and Utahceratops, three new duck-bill dinosaurs including the “toothy” Gryposaurus monumentensis, two new tyrannosaurs, as well as undescribed ankylosaurs (armored dinosaurs), marine reptiles, giant crocodyliforms, turtles, plants, and a host of other organisms.
The discovery of a new troodontid from the monument is the latest in a long string of incredible fossil discoveries from the area. “I was surprised when I learned that I had found a new dinosaur,” Knell said. “It is a rare discovery and I feel very lucky to be part of the exciting research happening here in the monument.” Knell stumbled across the remains of Talos sampsoni while scouring the badlands of the Kaiparowits Formation for fossil turtles as part of his dissertation research.
Work continues every year in GSENM and new, significant fossil finds are made every field season. Considering there are hundreds of thousands of acres of outcrop that have yet to be surveyed, it is no exaggeration to claim the region will remain an exciting research frontier for decades to come.
Note : The above story is reprinted from materials provided by Public Library of Science,
The carbon cycle, upon which most living things depend, reaches much deeper into the Earth than generally supposed-all the way to the lower mantle, researchers report.
The findings, which are based on the chemistry of an unusual set of Brazilian diamonds, will be published online by the journal Science, at the Science Express Web site, on 15 September. Science is published by AAAS, the non-profit, international science society.
“This study shows the extent of Earth’s carbon cycle on the scale of the entire planet, connecting the chemical and biological processes that occur on the surface and in the oceans to the far depths of Earth’s interior,” said Nick Wigginton, associate editor at Science.
“Results of this kind offer a broader perspective of planet Earth as an integrated, dynamic system,” he said.
The carbon cycle generally refers to the movement of carbon through the atmosphere, oceans, and the crust. Previous observations suggested that the carbon cycle may even extend to the upper mantle, which extends roughly 400 kilometers into the Earth. In this region, plates of ocean crust-bearing a carbon-rich sediment layer-sink beneath other tectonic plates and mix with the molten rock of the mantle.
Seismological and geochemical studies have suggested that oceanic crust can sink all the way to the lower mantle, more than 660 kilometers down. But actual rock samples with this history have been hard to come by.
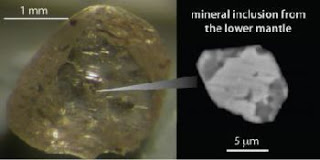
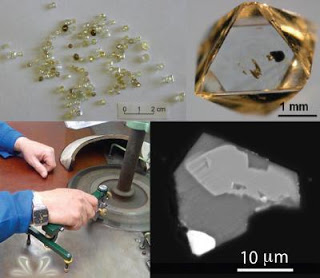
Michael Walter of the University of Bristol and colleagues in Brazil and the United States analyzed a set of “superdeep” diamonds from the Juina kimberlite field in Brazil. Most diamonds excavated at Earth’s surface originated at depths of less than 200 kilometers. Some parts of the world, however, have produced rare, superdeep diamonds, containing tiny inclusions of other material whose chemistry indicates that the diamonds formed at far greater depths.
The Juina-5 diamonds studied by Walter and colleagues contain inclusions whose bulk compositions span the range of minerals expected to form when basalt melts and crystallizes under the extreme high pressures and temperatures of the lower mantle.
Thus, these inclusions probably originated when diamond-forming fluids incorporated basaltic components from oceanic lithosphere that had descended into the lower mantle, the researchers have concluded.
If this hypothesis is correct, then the carbon from which the diamonds formed may have been deposited originally within ocean crust at the seafloor. A relative abundance of light carbon isotopes in the Juina-5 diamonds supports this idea, since this lighter form of carbon is found at the surface but not generally in the mantle, the authors say.
The diamond inclusions also include separate phases that appear to have “unmixed” from the homogenous pool of material. This unmixing likely happened as the diamonds traveled upward hundreds of kilometers into the upper mantle, the researchers say.
After the diamonds formed in the lower mantle, they may have been launched back near the surface by a rising mantle plume, Walter and colleagues propose.
Note: This story has been adapted from a news release issued by the American Association for the Advancement of Science
Scientists have speculated for some time that Earth’s carbon cycle extends deep into the planet’s interior, but until now there has been no direct evidence. The mantle-Earth’s thickest layer -is largely inaccessible. A team of researchers analyzed diamonds that originated from the lower mantle at depths of 435 miles (700 kilometers) or more, and erupted to the surface in volcanic rocks called kimberlites. The diamonds contain what are impurities to the gemologist, but are known as mineral inclusions to the geologist. Analysis shows compositions consistent with the mineralogy of oceanic crust. This finding is the first direct evidence that slabs of oceanic crust sank or subducted into the lower mantle and that material, including carbon, is cycled between Earth’s surface and depths of hundreds of miles.
The research is published online in Science Express.
The mantle extends from as little as 5 to 1,800 miles (10-2,900 kilometers) beneath Earth’s surface. Most diamonds are free from inclusions and come from depths less than 120 miles (200 km). But in a few localities researchers have found super-deep diamonds from the depths of the convecting upper and lower mantle, as well as the transition zone in between. Whereas inclusions in diamonds from the depths of the upper mantle and transition zone have been consistent with a surface-rock origin, none from the lower mantle have borne this signature until now.
The team, which included Carnegie scientists, was led by former Carnegie postdoctoral fellow Michael Walter, now a professor at the University of Bristol, UK. The scientists analyzed minute (one to two hundredths of a millimeter) mineral grains from six diamonds from the Juina region in Brazil. The analysis showed that diamond inclusions initially crystallized as a single mineral that could form only at depths greater than 435 miles (700 km). But the inclusions recrystallized into multiple minerals as they were carried up to the surface — first probably from a mantle upwelling known as a plume, then as they erupted to the surface in kimberlites
The diamonds were analyzed for carbon at Carnegie. Four of the diamonds contained low amounts of carbon-13, a signature not found in the lower mantle and consistent with an ocean-crust origin at Earth’s surface. “The carbon identified in other super-deep, lower mantle diamonds is chiefly mantle-like in composition,” remarked co-author Steven Shirey at Carnegie. “We looked at the variations in the isotopes of the carbon atoms in the diamonds. Carbon originating in a rock called basalt, which forms from lava at the surface, is often different from that which originates in the mantle, in containing relatively less carbon-13. These super-deep diamonds contained much less carbon-13, which is most consistent with an origin in the organic component found in altered oceanic crust.”
“I find it astonishing that we can use the tiniest of mineral grains to show some of the motions of the Earth’s mantle at the largest scales,” concluded Shirey.
The researchers on the paper are M.J. Walter, S. Kohn, G. Bulanova, and C. Smith of University of Bristol, UK; D. Araujo of Universidade de Brasilia-DF Brazil; A. Steele of Carnegie’s Geophysical Laboratory, and S. Shirey, E. Gaillou, and J. Wang of Carnegie’s Department of Terrestrial Magnetism. Funding was provided by the NSF in the US, the National Environmental Research Council (NERC) in the UK, and the Carnegie Institution for Science.
Note: This story has been adapted from a news release issued by the Carnegie Institution
The eruption of giant masses of magma in Siberia 250 million years ago led to the Permo-Triassic mass extinction when more than 90 % of all species became extinct. Scientists* report on a new idea with respect to the origin of the Siberian eruptions and their relation to the mass extinction in the recent issue of Nature.
Large Igneous Provinces (LIPs) are huge accumulations of volcanic rock at Earth’s surface. Within short geological time spans of often less than one million years their eruptions cover areas of several hundred thousand square kilometres with up to 4 kilometers thick lava flows. The Siberian Traps are considered the largest continental LIP.
A widely accepted idea is that LIPs originate through melting within thermal mantle plumes, a term applied to giant mushroom-shaped volumes of plastic mantle material that rise from the base of the mantle to the lithosphere, Earth’s rigid outer shell. The high buoyancy of purely thermal mantle plumes, however, should cause kilometer-scale uplift of the lithosphere above the plume head, but such uplift is not always present. Moreover, estimates of magmatic degassing from many LIPs are considered insufficient to trigger climatic crises. The team of scientists presents a numerical model and new geochemical data with which unresolved questions can now be answered.
They suggest that the Siberian mantle plume contained a large fraction of about 15 percent of recycled oceanic crust; i.e. the crust that had long before been subducted into the deep mantle and then, through the hot mantle plume, brought back to Earth’s lithosphere. This recycled oceanic crust was present in the plume as eclogite, a very dense rock which made the hot mantle plume less buoyant. For this reason the impingement of the plume caused negligible uplift of the lithosphere. The recycled crustal material melts at much lower temperatures than the normal mantle material peridotite, and therefore the plume generated exceptionally large amounts of magmas and was able to destroy the thick Siberian lithosphere thermally, chemically and mechanically during a very short period of only a few hundred thousand years. During this process, the recycled crust, being exceptionally rich in volatiles such as CO2
and halogens, degassed and liberated gases that passed through Earth crust into the atmosphere to trigger the mass extinction.
The model predicts that the mass extinction should have occurred before the main magmatic eruptions. Though based on sparse available data, this prediction seems to be valid for many LIPs.
*The international team of scientists included geodynamic modelers from the GFZ German Research Centre for Geosciences together with geochemists from the J. Fourier University of Grenoble, the Max Plank Institute in Mainz, and Vernadsky-, Schmidt- and Sobolev-Institutes of the Russian Academy of Sciences.
Note : The above story is reprinted from materials provided by Helmholtz Association of German Research Centres.
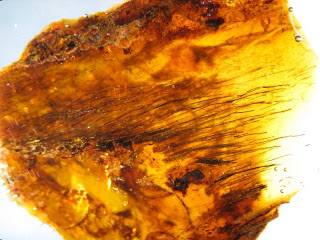
Numerous individual filaments in Late Cretaceous Canadian amber (specimen UALVP 52821). These filaments are morphologically similar to the protofeathers that have been found as compression fossils associated with some dinosaur skeletons. Pigment distributions within these filaments range from translucent (unpigmented) to near-black (heavily pigmented). (Credit: Image courtesy of University of Alberta)
Secrets from the age of the dinosaurs are usually revealed by fossilized bones, but a University of Alberta research team has turned up a treasure trove of Cretaceous feathers trapped in tree resin. The resin turned to resilient amber, preserving some 80 million-year-old protofeathers, possibly from non-avian dinosaurs, as well as plumage that is very similar to modern birds, including those that can swim under water.
U of A paleontology graduate student Ryan McKellar discovered a wide range of feathers among the vast amber collections at the Royal Tyrrell Museum in southern Alberta. This material stems from Canada’s most famous amber deposit, near Grassy Lake in southwestern Alberta.
The discovery of the 11 feather specimens is described as the richest amber feather find from the late Cretaceous period. The amber preserves microscopic detail of the feathers and even their pigment or colour. McKellar describes the colours as typically ranging from brown to black.
No dinosaur or avian fossils were found in direct association with the amber feather specimens, but McKellar says comparison between the amber and fossilized feathers found in rock strongly suggest that some of the Grassy Lake specimens are from dinosaurs. The non-avian dinosaur evidence points to small theropods as the source of the feathers
Some of the feather specimens with modern features are very similar to those of modern birds like the Grebe, which are able to swim underwater. The feathers can take on water giving the bird the ballast required to dive more effectively..
McKellar says the Grassy Lake find demonstrates that numerous evolutionary stages of feathers were present in the late Cretaceous period and that plumage served a range of functions in both dinosaurs and birds.
The U of A team’s research was published September 15, in the journal Science.
Note : The above story is reprinted from materials provided by University of Alberta,
Shell and the University of Texas at Austin (UT) today signed a five-year agreement to invest $7.5 million to address short- and long-term challenges facing the growing worldwide unconventional oil and gas industry.
“This agreement marks an important milestone in Shell’s commitment to continually research and develop innovative technology that will help to meet global demands by bringing more energy resources to market,” said Marvin Odum, president, Shell Oil Company. “We chose to collaborate with UT because it brings together an extraordinary amount of talent from both organizations that will push the technological envelope in the field of developing even the most challenging hydrocarbons safely and responsibly.”
Shale gas is abundant, widely used, and a growing source of energy in the United States. According to the U.S. Energy Information Administration, shale gas, tight gas, and coalbed methane accounted for 50 percent of U.S. production in 2009 and are expected to account for 75 percent of production by 2035.
The new Shell-UT Program on Unconventional Resources will be managed by the university’s Bureau of Economic Geology with participation across the campus, including geoscience, engineering, economics, business, environmental and regulatory affairs. In addition to top-ranking geology and petroleum engineering programs, the university has dedicated centers working in energy law, economics, finance and energy and environmental policy.
“The pursuit of unconventional energy resources is a complex, integrated problem that requires uniting the scientific and engineering efforts below ground with above-ground efforts in water, regulation, and public awareness,” said William Powers, president of The University of Texas at Austin. “As a major research university and leader in energy, we’ve got the integrated expertise to help solve it.”
Scott Tinker, director of the Bureau of Economic Geology and an expert on global energy, notes that unconventional resources such as shale gas could extend natural gas production in the U.S. and globally from 50 to 100 years beyond recent estimates.
“Increased production of shale gas and other unconventional hydrocarbons could significantly enhance U.S. energy security,” said Tinker, “since these are largely available, affordable, and reliable domestic energy sources that contribute directly to the U.S. and global economy.”
The agreement will also support students at The University of Texas at Austin, significantly enhancing the employability of students working on Shell-UT projects in the Jackson School of Geosciences, Department of Petroleum & Geosystems Engineering, and other departments at the university.
Note: This story has been adapted from a news release issued by the University of Texas at Austin
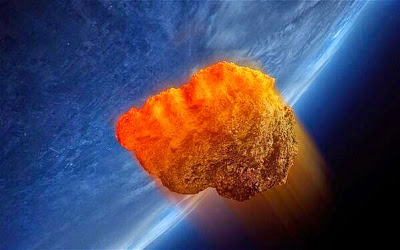
Ultra high precision analyses of some of the oldest rock samples on Earth by researchers at the University of Bristol provides clear evidence that the planet’s accessible reserves of precious metals are the result of a bombardment of meteorites more than 200 million years
The research is published in Nature.
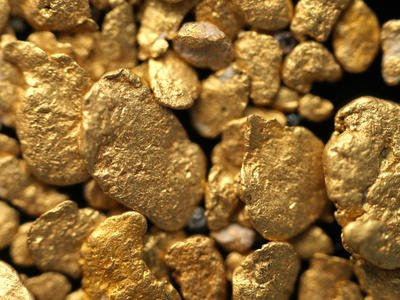
During the formation of Earth, molten iron sank to its centre to make the core. This took with it the vast majority of the planet’s precious metals — such as gold and platinum. In fact, there are enough precious metals in the core to cover the entire surface of Earth with a four-metre thick layer.
The removal of gold to the core should leave the outer portion of Earth bereft of bling. However, precious metals are tens to thousands of times more abundant in Earth’s silicate mantle than anticipated. It has previously been argued that this serendipitous over-abundance results from a cataclysmic meteorite shower that hit Earth after the core formed. The full load of meteorite gold was thus added to the mantle alone and not lost to the deep interior.
To test this theory, Dr Matthias Willbold and Professor Tim Elliott of the Bristol Isotope Group in the School of Earth Sciences analysed rocks from Greenland that are nearly four billion years old, collected by Professor Stephen Moorbath of the University of Oxford. These ancient rocks provide a unique window into the composition of our planet shortly after the formation of the core but before the proposed meteorite bombardment.
The researchers determined the tungsten isotopic composition of these rocks. Tungsten (W) is a very rare element (one gram of rock contains only about one ten-millionth of a gram of tungsten) and, like gold and other precious elements, it should have entered the core when it formed. Like most elements, tungsten is composed of several isotopes, atoms with the same chemical characteristics but slightly different masses. Isotopes provide robust fingerprints of the origin of material and the addition of meteorites to Earth would leave a diagnostic mark on its W isotope composition.
Dr Willbold observed a 15 parts per million decrease in the relative abundance of the isotope 182W between the Greenland and modern day rocks. This small but significant change is in excellent agreement with that required to explain the excess of accessible gold on Earth as the fortunate by-product of meteorite bombardment.
Dr Willbold said: “Extracting tungsten from the rock samples and analysing its isotopic composition to the precision required was extremely demanding given the small amount of tungsten available in rocks. In fact, we are the first laboratory world-wide that has successfully made such high-quality measurements.”
The impacting meteorites were stirred into Earth’s mantle by gigantic convection processes. A tantalising target for future work is to study how long this process took. Subsequently, geological processes formed the continents and concentrated the precious metals (and tungsten) in ore deposits which are mined today.
Dr Willbold continued: “Our work shows that most of the precious metals on which our economies and many key industrial processes are based have been added to our planet by lucky coincidence when the Earth was hit by about 20 billion billion tonnes of asteroidal material.”
This research was funded by the Natural Environment Research Council (NERC), the Science and Technology Facilities Council (STFC) and the Deutsche Forschungsgemeinschaft (DFG).
Reference:
Matthias Willbold, Tim Elliott, Stephen Moorbath. The tungsten isotopic composition of the Earth’s mantle before the terminal bombardment. Nature, 2011; 477 (7363): 195 DOI: 10.1038/nature10399
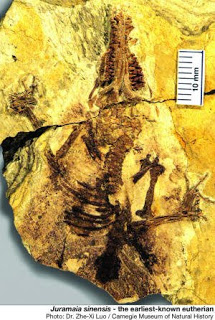
New Jurassic eutherian mammal Juramaia sinensis: The original fossil (type specimen) is preserved on a shale slab from the Jurassic Tiaojishan Formation. The fossil belongs to the Beijing Museum of Natural History (BMNH PM1143) and is being jointly studied by Chinese and American scientists. Etymology: “Jura” represents the Jurassic Period of the geological time scale; “-maia” means “mother;” sinensis means “from China.” The full name means “Jurassic mother from China.” (Credit: Zhe-Xi Luo/Carnegie Museum of Natural History)
A remarkably well-preserved fossil discovered in northeast China provides new information about the earliest ancestors of most of today’s mammal species — the placental mammals. According to a paper published August 25 in the journal Nature, this fossil represents a new milestone in mammal evolution that was reached 35 million years earlier than previously thought, filling an important gap in the fossil record and helping to calibrate modern, DNA-based methods of dating the evolution.
The paper by a team of scientists led by Carnegie Museum of Natural History paleontologist Zhe-Xi Luo describes Juramaia sinensis, a small shrew-like mammal that lived in China 160 million years ago during the Jurassic period. Juramaia is the earliest known fossil of eutherians — the group that evolved to include all placental mammals, which provide nourishment to unborn young via a placenta. As the earliest known fossil ancestral to placental mammals, Juramaia provides fossil evidence of the date when eutherian mammals diverged from other mammals: metatherians (whose descendants include marsupials such as kangaroos) and monotremes (such as the platypus). As Luo explains, “Juramaia, from 160 million years ago, is either a great-grand-aunt, or a ‘great-grandmother’ of all placental mammals that are thriving today.”
The “Jurassic mother from China”
The fossil of Juramaia sinensis was discovered in the Liaoning Province in northeast China and examined in Beijing by Zhe-Xi Luo and his collaborators: Chong-Xi Yuan and Qiang Ji from the Chinese Academy of Geological Sciences, and Qing-Jin Meng from the Beijing Museum of Natural History, where the fossil is stored. The name Juramaia sinensis means “Jurassic mother from China.” The fossil has an incomplete skull, part of the skeleton, and, remarkably, impressions of residual soft tissues such as hair. Most importantly, Juramaia‘s complete teeth and forepaw bones enable paleontologists to pin-point that it is closer to living placentals on the mammalian family tree than to the pouched marsupials, such as kangaroos.
Resetting the evolutionary clock
“Understanding the beginning point of placentals is a crucial issue in the study of all mammalian evolution,” says Luo. The date of an evolutionary divergence — when an ancestor species splits into two descendant lineages — is among the most important pieces of information an evolutionary scientist can have. Modern molecular studies, such as DNA-based methods, can calculate the timing of evolution by a “molecular clock.” But the molecular clock needs to be cross-checked and tested by the fossil record. Prior to the discovery of Juramaia, the divergence point of eutherians from metatherians posed a quandary for evolutionary historians: DNA evidence suggested that eutherians should have shown up earlier in the fossil record — around 160 million years ago. Yet, the oldest known eutherian, was Eomaia*, dated to 125 million years ago. The discovery of Juramaia gives much earlier fossil evidence to corroborate the DNA findings, filling an important gap in the fossil record of early mammal evolution and helping to establish a new milestone of evolutionary history.
Juramaia also reveals adaptive features that may have helped the eutherian newcomers to survive in a tough Jurassic environment. Juramaia‘s forelimbs are adapted for climbing; since the majority of the Jurassic mammals lived exclusively on the ground, the ability to escape to the trees and explore the canopy might have allowed eutherian mammals to exploit an untapped niche.
Luo supports this perspective: “The divergence of eutherian mammals from marsupials eventually led to placental birth and reproduction that are so crucial for the evolutionary success of placentals. But it is their early adaptation to exploit niches on the tree that paved their way toward this success.”
*Eomaia was originally described in 2002 by a team of scientists led by Zhe-Xi Luo and Carnegie mammalogist John Wible.
Note : The above story is reprinted from materials provided by Carnegie Museum of Natural History, via EurekAlert!, a service of AAAS.
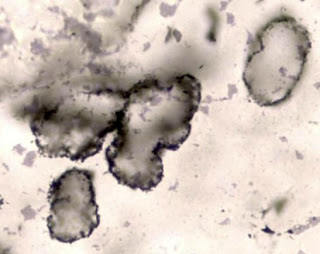
Fossilized cells from 3.4 billion years ago. (Credit: David Wacey)
Earth’s oldest fossils have been found in Australia by a team from the University of Western Australia and Oxford University. The microscopic fossils show convincing evidence for cells and bacteria living in an oxygen-free world over 3.4 billion years ago.
The team, led by Dr David Wacey of the University of Western Australia and including Professor Martin Brasier of Oxford University, report the finding in the journal Nature Geoscience.
‘At last we have good solid evidence for life over 3.4 billion years ago. It confirms there were bacteria at this time, living without oxygen,’ says Professor Brasier of the Department of Earth Sciences at Oxford.
Earth was still a hot, violent place at this time, with volcanic activity dominating the early Earth. The sky was cloudy and grey, keeping the heat in despite the sun being weaker than today. The water temperature of the oceans was much higher at 40-50 degrees — the temperature of a hot bath — and circulating currents were very strong. Any land masses were small, or about the size of Caribbean islands, and the tidal range was huge.
Significantly, there was very little oxygen present as there were no plants or algae yet to photosynthesise and produce oxygen. The new evidence points to early life being sulfur-based, living off and metabolizing compounds containing sulfur rather than oxygen for energy and growth.
‘Such bacteria are still common today. sulfur bacteria are found in smelly ditches, soil, hot springs, hydrothermal vents — anywhere where there’s little free oxygen and they can live off organic matter,’ explains Professor Brasier.
The microfossils were found in a remote part of Western Australia called Strelley Pool. They are very well preserved between the quartz sand grains of the oldest beach or shoreline known on Earth, in some of the oldest sedimentary rocks that can be found anywhere.
‘We can be very sure about the age as the rocks were formed between two volcanic successions that narrow the possible age down to a few tens of millions of years,’ says Professor Brasier. ‘That’s very accurate indeed when the rocks are 3.4 billion years old.’
The microfossils satisfy three crucial tests that the forms seen in the rocks are biological and have not occurred through some mineralization process.
The fossils are very clearly preserved showing precise cell-like structures all of a similar size. They look like well known but much newer microfossils from 2 billion years ago, and are not odd or strained in shape.
The fossils suggest biological-like behavior. The cells are clustered in groups, are only present in appropriate habitats and are found attached to sand grains.
And crucially, they show biological metabolisms. The chemical make-up of the tiny fossilized structures is right, and crystals of pyrite (fool’s gold) associated with the microfossils are very likely to be by-products of the sulfur metabolism of these ancient cells and bacteria.
Early fossils of life on Earth has been a controversial area. In the past decade, the barriers that need to be overcome before claiming such evidence have been raised significantly, aided by new techniques for mapping the chemistry of rocks at fine scales.
In 2002, the same Oxford group suggested well-known microfossils from the Apex chert in Australia were not the preserved forms of ancient bacteria after all. They argued that the context, shape and mineralogy of the forms were all wrong for them to be of biological origin.
They believe the current fossils, found just 20 miles away, satisfy all criteria for judging such finds.
The researchers are now using the techniques and approaches they used in this study to re-examine other fossil finds that have been proposed to contain evidence for life on Earth at these extremely early times.
‘We’re now making detailed comparisons with all other early microfossils, and we’re very optimistic for future finds,’ says Professor Brasier.
The work also has implications for looking for life on other planets, giving an indication of what evidence for such life might look like.
Should there be life elsewhere in our solar system — on Mars or on the moons of Titan or Europa — it is likely to be similar sorts of bacteria and cells living in similar environments. So any fossils in rocks from these planets and moons ought to look like these Australian microfossils and pass the same evidence tests.
‘Could these sorts of things exist on Mars? It’s just about conceivable,’ says Professor Brasier. ‘But it would need these approaches — mapping the chemistry of any microfossils in fine detail and convincing three-dimensional images — to support any evidence for life on Mars.’
Note : The above story is reprinted from materials provided by University of Oxford.
A 3-D view of the surface rupture of the April 4, 2010
El Mayor-Cucapah Earthquake (red line) reveals a new fault line connecting the Gulf of California with the Elsinore fault, which is likely to become the main fault at the boundary between the Pacific and the North America plates. – Caltech’s Tectonics Observatory
Like scars that remain on the skin long after a wound has healed, earthquake fault lines can be traced on Earth’s surface long after their initial rupture. Typically, this line of intersection between the area where the fault slips and the ground is more complicated at the surface than at depth. But a new study of the April 4, 2010, El Mayor-Cucapah earthquake in Mexico reveals a reversal of this trend. While the fault involved in the event appeared to be superficially straight, the fault zone is warped and complicated at depth.
The study-led by researchers at the California Institute of Technology (Caltech) and documenting findings from the magnitude 7.2 event, which was centered in the Baja California state of Mexico-is available online in the journal Nature Geoscience.
The El Mayor-Cucapah earthquake happened along a system of faults that run from Southern California into Mexico, cutting through the Cucapah mountain range and across the Colorado River delta. This system of faults forms a portion of the plate boundary between the Pacific Plate and the North American Plate. Two main segments of the fault tilt downward steeply from the surface at opposing angles: the northwestern half angles downward beneath the Mexicali Valley, whereas the southeastern half angles away from the valley.
In a standard model, transform plate boundary structures-where two plates slide past one another-tend to be vertically oriented, which allows for lateral side-by-side shear fault motion. In the case of this quake, however, lead author Shengji Wei, a postdoctoral scholar in geophysics, and colleagues showed that the 120-kilometer-long rupture involved angled, non-vertical faults and that the event was initiated on a connecting extension fault between the two segments.
“Although the surface trace is nearly linear, we found that the event, which started with a smaller quake, happened mainly on two faults with opposite dipping directions,” says Wei.
In fact, the seismic rupture traveled through a relatively complicated set of preexisting faults that are dipping in various directions. “It was really surprising to see a straight fault trace that cuts through the Colorado delta and the rugged topography of the Sierra Cucapah as a result of this event,” says Jean-Philippe Avouac, director of Caltech’s Tectonics Observatory and principal investigator on the study.
The team used interferometric synthetic aperture radar (InSAR) and optical images gathered from satellites, global positioning system (GPS) data, and seismological data to study the rupture process. By combining the GPS data and remote sensing techniques-which provide measurements of surface displacement-and seismological techniques to study the ground vibrations generated by the temblor, the researchers were able to produce an extremely well-resolved model of the earthquake.
The model describes the geometry of the faults that broke during the quake and the time evolution of the rupture. It shows that once the earthquake began with an extensional deep break that pulled the two segments apart, it spread bilaterally to the northwest and the southeast. As the rupture spread northwestward, it continued to break erratically through the faults below the Cucapah mountain range. Simultaneously, the rupture spread towards the southeast, breaking a fault that had been covered over by a blanket of sediments that forms the Colorado River delta.
“High-resolution satellite radar images allowed us to locate a previously unmapped fault-the Indiviso Fault-beneath the Colorado River Delta that had been buried by river sediments since its last earthquake,” says NASA’s Jet Propulsion Laboratory (JPL) geophysicist Eric Fielding, who was a coauthor of the study. “This fault moved up to 16 feet, or 5 meters, in the April 4, 2010, earthquake.”
Wei says that since the new analysis indicates the responsible fault is more segmented deep down than its straight surface trace suggests, the evolution and extent of this earthquake’s rupture could not have been accurately anticipated from the surface geology alone. Anticipating the characteristics of an earthquake that would likely happen on a young fault system (like the event in the study) is a challenge, since the geologic structures involved in the new fault system are not clear enough.
According to Avouac, the data can also be used to illustrate the process by which the plate boundary-which separates the Pacific Plate from North America- evolves and starts connecting the Gulf of California to the Elsinore fault in Southern California.
“We may have to wait for a couple of million years to clearly see the active fault zone in the topography, as we can now see further north in Central California, for example,” Avouac says. “Earthquakes with magnitude 7.5 and lower are probably typical of this kind of younger fault zone, while fault zones with a longer geological history and simpler fault geometries are more prone to produce larger ruptures.”
This is important information, since damage estimates from the earthquake, which mostly affected agribusinesses, topped $440 million in the Mexicali Valley of Baja California and $90 million in the Imperial Valley of California.
Note: This story has been adapted from a news release issued by the California Institute of Technology
Before (left) and after (right) photos of the Sulzberger Ice Shelf illustrate the calving event associated with the Japan earthquake and resulting tsunami that occurred on March 11, 2011. The icebergs have just begun to separate in the left image. – European Space Agency/Envisat
A NASA scientist and her colleagues were able to observe for the first time the power of an earthquake and tsunami to break off large icebergs a hemisphere away.
Kelly Brunt, a cryosphere specialist at Goddard Space Flight Center, Greenbelt, Md., and colleagues were able to link the calving of icebergs from the Sulzberger Ice Shelf in Antarctica following the Tohoku Tsunami, which originated with an earthquake off the coast of Japan in March 2011. The finding, detailed in a paper published online today in the Journal of Glaciology, marks the first direct observation of such a connection between tsunamis and icebergs.
The birth of an iceberg can come about in any number of ways. Often, scientists will see the towering, frozen monoliths break into the polar seas and work backwards to figure out the cause.
So when the Tohoku Tsunami was triggered in the Pacific Ocean on March 11 this spring, Brunt and colleagues immediately looked south. All the way south. Using multiple satellite images, Brunt, Emile Okal at Northwestern University and Douglas MacAyeal at University of Chicago were able to observe new icebergs floating off to sea shortly after the sea swell of the tsunami reached Antarctica.
To put the dynamics of this event in perspective: An earthquake off the coast of Japan caused massive waves to explode out from its epicenter. Swells of water swarmed toward an ice shelf in Antarctica, 8,000 miles (13,600 km) away, and about 18 hours after the earthquake occurred, those waves broke off several chunks of ice that together equaled about two times the surface area of Manhattan. .According to historical records, this particular piece of ice hadn’t budged in at least 46 years before the tsunami came along.
And as all that was happening, scientists were able to watch the Antarctic ice shelves in as close to real-time as satellite imagery allows, and catch a glimpse of a new iceberg floating off into the Ross Sea.
“In the past we’ve had calving events where we’ve looked for the source. It’s a reverse scenario – we see a calving and we go looking for a source,” Brunt said. “We knew right away this was one of the biggest events in recent history – we knew there would be enough swell. And this time we had a source.”
Scientists first speculated in the 1970s that repeated flexing of an ice shelf – a floating extension of a glacier or ice sheet that sits on land – by waves could cause icebergs to break off. Scientific papers in more recent years have used models and tide gauge measurements in an attempt to quantify the impact of sea swell on ice shelf fronts.
The swell was likely only about a foot high (30 cm) when it reached the Sulzberger shelf. But the consistency of the waves created enough stress to cause the calving. This particular stretch of floating ice shelf is about 260 feet (80 meters) thick, from its exposed surface to its submerged base.
When the earthquake happened, Okal immediately honed in on the vulnerable faces of the Antarctic continent. Using knowledge of iceberg calving and what a NOAA model showed of the tsunami’s projected path across the unobstructed Pacific and Southern oceans, Okal, Brunt and MacAyeal began looking at what is called the Sulzberger Ice Shelf. The Sulzberger shelf faces Sulzberger Bay and New Zealand.
Through a fortuitous break in heavy cloud cover, Brunt spotted what appeared to be a new iceberg in MODerate Imaging Spectroradiometer (MODIS) data.
“I didn’t have strong expectations either way whether we’d be able to see something,” Brunt said. “The fastest imagery I could get to was from MODIS Rapid Response, but it was pretty cloudy. So I was more pessimistic that it would be too cloudy and we couldn’t see anything. Then, there was literally one image where the clouds cleared, and you could see a calving event.”
A closer look with synthetic aperture radar data from the European Space Agency satellite, Envisat, which can penetrate clouds, found images of two moderate-sized icebergs – with more, smaller bergs in their wake. The largest iceberg was about four by six miles in surface area – itself about equal to the surface area of one Manhattan. All of the ice surface together about equaled two Manhattans. After looking at historical satellite imagery, the group determined the small outcropping of ice had been there since at least 1965, when it was captured by USGS aerial photography.
The proof that seismic activity can cause Antarctic iceberg calving might shed some light on our knowledge of past events, Okal said.
“In September 1868, Chilean naval officers reported an unseasonal presence of large icebergs in the southernmost Pacific Ocean, and it was later speculated that they may have calved during the great Arica earthquake and tsunami a month earlier,” Okal said. “We know now that this is a most probable scenario.”
MacAyeal said the event is more proof of the interconnectedness of Earth systems.
“This is an example not only of the way in which events are connected across great ranges of oceanic distance, but also how events in one kind of Earth system, i.e., the plate tectonic system, can connect with another kind of seemingly unrelated event: the calving of icebergs from Antarctica’s ice sheet,” MacAyeal said.
In what could be one of the more lasting observations from this whole event, the bay in front of the Sulzberger shelf was largely lacking sea ice at the time of the tsunami. Sea ice is thought to help dampen swells that might cause this kind of calving. At the time of the Sumatra tsunami in 2004, the potentially vulnerable Antarctic fronts were buffered by a lot of sea ice, Brunt said, and scientists observed no calving events that they could tie to that tsunami.
“There are theories that sea ice can protect from calving. There was no sea ice in this case,” Brunt said. “It’s a big chunk of ice that calved because of an earthquake 13,000 kilometers away. I think it’s pretty cool.”
Note: This story has been adapted from a news release issued by the NASA/Goddard Space Flight Center
Anders Carlson, a UW–Madison geologist, surveys an outlet glacier in southwest Greenland. Carlson and colleagues from UW–Madison and Oregon State University have shown that melting ice from Greenland may have raised ocean levels less than expected during the most-recent prolonged warm spell on Earth. The surprising patterns of ice melt found by new research suggest that Greenland’s ice sheet may be more stable — and Antarctica’s less stable — than previously thought. Credit: Photo courtesy Robert Hatfield, Oregon State University
During the last prolonged warm spell on Earth, the oceans were at least four meters – and possibly as much as 6.5 meters, or about 20 feet – higher than they are now.
Where did all that extra water come from? Mainly from melting ice sheets on Greenland and Antarctica, and many scientists, including University of Wisconsin-Madison geoscience assistant professor Anders Carlson, have expected that Greenland was the main culprit.
But Carlson’s new results, published July 29 in Science, are challenging that assertion, revealing surprising patterns of melting during the last interglacial period that suggest that Greenland’s ice may be more stable – and Antarctica’s less stable – than many thought.
“The Greenland Ice Sheet is melting faster and faster,” says Carlson, who is also a member of the Center for Climatic Research in the Nelson Institute for Environmental Studies. But despite clear observations of that fact, estimates of just how much the ice will melt and contribute to sea level rise by the end of this century are highly varied, ranging from a few centimeters to meters. “There’s a clear need to understand how it has behaved in the past, and how it has responded to warmer-than-present summers in the past.”
The ice-estimation business is rife with unknown variables and has few known physical constraints, Carlson explains, making ice sheet behavior – where they melt, how much, how quickly – the largest source of uncertainty in predicting sea level rises due to climate change.
His research team sought a way to constrain where ice remained on Greenland during the last interglacial period, around 125,000 years ago, to better define past ice sheet behavior and improve future projections.
The researchers analyzed silt from an ocean-floor core taken from a region off the southern tip of Greenland that receives sediments carried by meltwater streams off the ice sheet. They used different patterns of radiogenic isotopes to identify sources of the sediment, tracing the silt back to one of three “terranes” or regions, each with a distinct geochemical signature. The patterns of sedimentation show which terranes were still glaciated at that time.
“If the land deglaciates, you lose that sediment,” Carlson explains. But to their surprise, they found that all the terranes were still supplying sediment throughout the last interglacial period and thus still had some ice cover.
“The ice definitely retreated to smaller than present extent and definitely raised sea level to higher than present” and continued to melt throughout the warm period, he adds, but the sediment analysis indicates that “the ice sheet seems to be more stable than some of the greater retreat values that people have presented.”
The team used their results to evaluate several existing models of Greenland ice sheet melting during the last interglacial period. The models consistent with the new findings indicate that melting Greenland ice was responsible for a sea level rise of 1.6 to 2.2 meters – at most, roughly half of the minimum four-meter total increase.
Even after accounting for other Arctic ice and the thermal expansion of warmer water, most of the difference must have come from a melting Antarctic ice sheet, Carlson says.
“The implication of our results is that West Antarctica likely was much smaller than it is today,” and responsible for much more of the sea level rise than many scientists have thought, he says. “If West Antarctica collapsed, that means it’s more unstable than we expected, which is quite scary.”
Ultimately, Carlson says he hopes this line of research will improve the representation of ice sheet responses to a warming planet in future Intergovernmental Panel on Climate Change (IPCC) reports. Temperatures during the last interglacial period were similar to those expected by the end of this century, and present-day temps have already reached a point that Greenland’s glaciers are melting.
Note: This story has been adapted from a news release issued by the University of Wisconsin-Madison