Home Blog Page 340

Chinese Fossils Shed Light On Evolutionary Origin of Animals from Single-Cell Ancestors

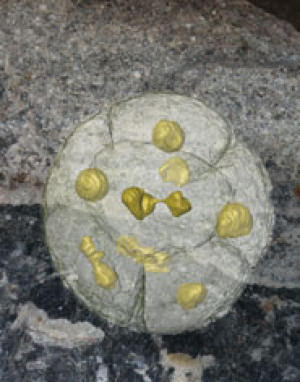
570 million year old multicellular spore body undergoing vegetative nuclear and cell division (foreground) based on synchrotron x-ray tomographic microscopy of fossils recovered from rocks in South China. The background shows a cut surface through the rock – every grain (about 1 mm diameter) is an exceptionally preserved gooey ball of dividing cells turned to stone. (Credit: Image courtesy of University of Bristol)
Evidence of the single-celled ancestors of animals, dating from the interval in Earth’s history just before multicellular animals appeared, has been discovered in 570 million-year-old rocks from South China by researchers from the University of Bristol, the Swedish Museum of Natural History, the Paul Scherrer Institut and the Chinese Academy of Geological Sciences.
All life evolved from a single-celled universal common ancestor, and at various times in Earth history, single-celled organisms threw their lot in with each other to become larger and multicellular, resulting, for instance, in the riotous diversity of animals. However, fossil evidence of these major evolutionary transitions is extremely rare.
The fossils, reported this week in Science, preserve stages in the life cycle of an amoeba-like organism dividing in asexual cycles, first to produce two cells, then four, eight, 16, 32 and so on, ultimately resulting in hundreds of thousands of spore-like cells that were then released to start the cycle over again. The pattern of cell division is so similar to the early stages of animal (including human) embryology that until now they were thought to represent the embryos of the earliest animals.
The researchers studied the microscopic fossils using high energy X-rays at the Swiss Light Source in Switzerland, revealing the organisation of the cells within their protective cyst walls. The organisms should not have been fossilized — they were just gooey clusters of cells — but they were buried in sediments rich in phosphate that impregnated the cell walls and turned them to stone.
Lead author Therese Huldtgren said: “The fossils are so amazing that even their nuclei have been preserved.”
Co-author Dr John Cunningham said: “We used a particle accelerator called a synchrotron as our X-ray source. It allowed us to make a perfect computer model of the fossil that we could cut up in any way that we wanted, but without damaging the fossil in any way. We would never have been able to study the fossils otherwise!”
This X-ray microscopy revealed that the fossils had features that multicellular embryos do not, and this led the researchers to the conclusion that the fossils were neither animals nor embryos but rather the reproductive spore bodies of single-celled ancestors of animals.
Professor Philip Donoghue said: “We were very surprised by our results — we’ve been convinced for so long that these fossils represented the embryos of the earliest animals — much of what has been written about the fossils for the last ten years is flat wrong. Our colleagues are not going to like the result.”
Professor Stefan Bengtson said: “These fossils force us to rethink our ideas of how animals learned to make large bodies out of cells.”

The research was funded by the Natural Environment Research Council, the Swedish Research Council, the Paul Scherrer Institut, Ministry of Science and Technology of China, National Natural Science Foundation of China, and EU FP7.

Note : The above story is reprinted from materials provided by University of Bristol.

New Kind of Metal in the Deep Earth

The crushing pressures and intense temperatures in Earth’s deep interior squeeze atoms and electrons so closely together that they interact very differently. With depth materials change. New experiments and supercomputer computations have revealed that iron oxide undergoes a new kind of transition under deep Earth conditions. Iron oxide, FeO, is a component of the second most abundant mineral at Earth’s lower mantle, ferropericlase.
The finding, published in an upcoming issue of Physical Review Letters, could alter our understanding of deep Earth dynamics and the behavior of the protective magnetic field, which shields our planet from harmful cosmic rays.
Ferropericlase contains both magnesium and iron oxide. To imitate the extreme conditions in the lab, the team including coauthor Ronald Cohen of Carnegie’s Geophysical Laboratory, studied the electrical conductivity of iron oxide to pressures and temperatures up to 1.4 million times atmospheric pressure and 4000°F — on par with conditions at the core-mantle boundary. They also used a new computational method that uses only fundamental physics to model the complex many-body interactions among electrons. The theory and experiments both predict a new kind of metallization in FeO.
Compounds typically undergo structural, chemical, electronic, and other changes under these extremes. Contrary to previous thought, the iron oxide went from an insulating (non-electrical conducting) state to become a highly conducting metal at 690,000 atmospheres and 3000°F, but without a change to its structure. Previous studies had assumed that metallization in FeO was associated with a change in its crystal structure. This result means that iron oxide can be both an insulator and a metal depending on temperature and pressure conditions.
“At high temperatures, the atoms in iron oxide crystals are arranged with the same structure as common table salt, NaCl,” explained Cohen. “Just like table salt, FeO at ambient conditions is a good insulator — it does not conduct electricity. Older measurements showed metallization in FeO at high pressures and temperatures, but it was thought that a new crystal structure formed. Our new results show, instead, that FeO metallizes without any change in structure and that combined temperature and pressure are required. Furthermore, our theory shows that the way the electrons behave to make it metallic is different from other materials that become metallic.”
“The results imply that iron oxide is conducting in the whole range of its stability in Earth’s lower mantle.” Cohen continues, “The metallic phase will enhance the electromagnetic interaction between the liquid core and lower mantle. This has implications for Earth’s magnetic field, which is generated in the outer core.
It will change the way the magnetic field is propagated to Earth’s surface, because it provides magnetomechanical coupling between the Earth’s mantle and core.”
“The fact that one mineral has properties that differ so completely — depending on its composition and where it is within the Earth — is a major discovery,” concluded Geophysical Laboratory director Russell Hemley.

Note : The above story is reprinted from materials provided by Carnegie Institution. 

Earthquakes May Be Linked to Tropical Cyclones

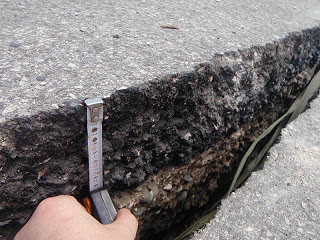
Roadway in Leogane, Haiti. (Credit: Estelle Chaussard)
A groundbreaking study led by University of Miami (UM) scientist Shimon Wdowinski shows that earthquakes, including the recent 2010 temblors in Haiti and Taiwan, may be triggered by tropical cyclones (hurricanes and typhoons). Wdowinski will discuss his findings during a presentation at the 2011 AGU Fall Meeting in San Francisco.
“Very wet rain events are the trigger,” said Wdowinski, associate research professor of marine geology and geophysics at the UM Rosenstiel School of Marine and Atmospheric Science. “The heavy rain induces thousands of landslides and severe erosion, which removes ground material from the Earth’s surface, releasing the stress load and encouraging movement along faults.”
Wdowinski and a colleague from Florida International University analyzed data from quakes magnitude-6 and above in Taiwan and Haiti and found a strong temporal relationship between the two natural hazards, where large earthquakes occurred within four years after a very wet tropical cyclone season.
During the last 50 years three very wet tropical cyclone events — Typhoons Morakot, Herb and Flossie — were followed within four years by major earthquakes in Taiwan’s mountainous regions. The 2009 Morakot typhoon was followed by a M-6.2 in 2009 and M-6.4 in 2010. The 1996 Typhoon Herb was followed by M-6.2 in 1998 and M-7.6 in 1999 and the 1969 Typhoon Flossie was followed by a M-6.2 in 1972.
The 2010 M-7 earthquake in Haiti occurred in the mountainous region one-and-a-half years after two hurricanes and two tropical storms drenched the island nation within 25 days.
The researchers suggest that rain-induced landslides and excess rain carries eroded material downstream. As a result the surface load above the fault is lessened.
“The reduced load unclamp the faults, which can promote an earthquake,” said Wdowinski.
Fractures in Earth’s bedrock from the movement of tectonic plates, known as faults, build up stress as they attempt to slide past each other, periodically releasing the stress in the form of an earthquake.
According to the scientists, this earthquake-triggering mechanism is only viable on inclined faults, where the rupture by these faults has a significant vertical movement.
Wdowinski also shows a trend in the tropical cyclone-earthquake pattern exists in M-5 and above earthquakes. The researchers plan to analyze patterns in other seismically active mountainous regions — such as the Philippines and Japan — that are subjected to tropical cyclones activity.
 
Note : The above story is reprinted from materials provided by University of Miami Rosenstiel School of Marine & Atmospheric Science.

Earthquakes: Water as a Lubricant

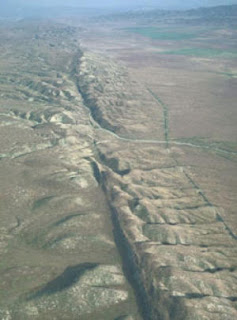
San Andreas fault zone, Carrizo Plains, central California. (Credit: Photo by R.E. Wallace, USGS)
Geophysicists from Potsdam have established a mode of action that can explain the irregular distribution of strong earthquakes at the San Andreas Fault in California. Reporting in the latest issue of the journal Nature, the scientists examined the electrical conductivity of the rocks at great depths, which is closely related to the water content within the rocks. From the pattern of electrical conductivity and seismic activity they were able to deduce that rock water acts as a lubricant.
Los Angeles moves toward San Francisco at a pace of about six centimeters per year, because the Pacific plate with Los Angeles is moving northward, parallel to the North American plate which hosts San Francisco. But this is only the average value.
In some areas, movement along the fault is almost continuous, while other segments are locked until they shift abruptly several meters against each other releasing energy in strong earthquakes. After the San Francisco earthquake of 1906, the plates had moved by six meters.
The San Andreas Fault acts like a seam in Earth, ranging through the entire crust and reaching into the mantle. Geophysicists from the GFZ German Research Centre for Geosciences have succeeded in imaging this interface to great depths and to establish a connection between processes at depth and events at surface.
“When examining the image of the electrical conductivity, it becomes clear that rock water from depths of the upper mantle, i.e. between 20 to 40 km, can penetrate the shallow areas of the creeping section of the fault, while these fluids are detained in other areas beneath an impermeable layer,” says Dr. Oliver Ritter of the GFZ. “A sliding of the plates is supported, where fluids can rise.”
These results suggest that significant differences exist in the mechanical and material properties along the fault at depth. The so-called tremor signals, for instance, appear to be linked to areas underneath the San Andreas Fault, where fluids are trapped. Tremors are low-frequency vibrations that are not associated with rupture processes as they are typical of normal earthquakes. These observations support the idea that fluids play an important role in the onset of earthquakes.
 
Note : The above story is reprinted from materials provided by Helmholtz Centre Potsdam – GFZ German Research Centre for Geosciences.

Earth’s Core Deprived of Oxygen

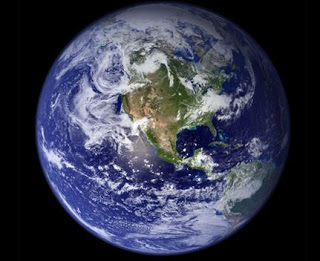
Planet Earth. The composition of Earth’s core remains a mystery. (Credit: NASA)
The composition of Earth’s core remains a mystery. Scientists know that the liquid outer core consists mainly of iron, but it is believed that small amounts of some other elements are present as well. Oxygen is the most abundant element in the planet, so it is not unreasonable to expect oxygen might be one of the dominant “light elements” in the core. However, new research from a team including Carnegie’s Yingwei Fei shows that oxygen does not have a major presence in the outer core. This has major implications for our understanding of the period when Earth formed through the accretion of dust and clumps of matter.

Their work is published Nov. 24 in Nature.

According to current models, in addition to large amounts of iron, Earth’s liquid outer core contains small amounts of so-called light elements, possibly sulfur, oxygen, silicon, carbon, or hydrogen. In this research, Fei, from Carnegie’s Geophysical Laboratory, worked with Chinese colleagues, including lead author Haijun Huang from China’s Wuhan University of Technology, now a visiting scientist at Carnegie. The team provides new experimental data that narrow down the identity of the light elements present in Earth’s outer core.
With increasing depth inside Earth, the pressure and heat also increase. As a result, materials act differently than they do on the surface. At Earth’s center are a liquid outer core and a solid inner core. The light elements are thought to play an important role in driving the convection of the liquid outer core, which generates Earth’s magnetic field.
Scientists know the variations in density and speed of sound as a function of depth in the core from seismic observations, but to date it has been difficult to measure these properties in proposed iron alloys at core pressures and temperatures in the laboratory.
“We can’t sample the core directly, so we have to learn about it through improved laboratory experiments combined with modeling and seismic data,” Fei said.
High-speed impacts can generate shock waves that raise the temperature and pressure of materials simultaneously, leading to melting of materials at pressures corresponding to those in the outer core. The team carried out shock-wave experiments on core materials, mixtures of iron, sulfur, and oxygen. They shocked these materials to the liquid state and measured their density and speed of sound traveling through them under conditions directly comparable to those of the liquid outer core.
By comparing their data with observations, they conclude that oxygen cannot be a major light element component of Earth’s outer core, because experiments on oxygen-rich materials do not align with geophysical observations. This supports recent models of core differentiation in early Earth under more ‘reduced’ (less oxidized) environments, leading to a core that is poor in oxygen.
“The research revealed a powerful way to decipher the identity of the light elements in the core. Further research should focus on the potential presence of elements such as silicon in the outer core,” Fei said.
Portions of this work were supported by grants from the National Natural Science Foundation of China, the Fundamental Research Funds for the Central Universities, and the National Basic Research of China, as well as the National Science Foundation and the Carnegie Institution for Science.

Note : The above story is reprinted from materials provided by Carnegie Institution. 

Date and Rate of Earth’s Most Extreme Extinction Pinpointed

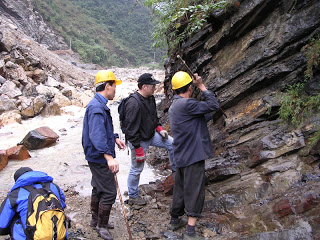
Charles Henderson (middle) of the University of Calgary collects material from a sedimentary layer in Shangsi, Sichuan Province, China. This was one of more important sections studied for ash layers and marine fossils used to pinpoint the dates and rate of Earth’s massive extinction. (Credit: Charles Henderson)
It’s well known that Earth’s most severe mass extinction occurred about 250 million years ago. What’s not well known is the specific time when the extinctions occurred. A team of researchers from North America and China have published a paper in Science which explicitly provides the date and rate of extinction.
This is the first paper to provide rates of such massive extinction,” says Dr. Charles Henderson, professor in the Department of Geoscience at the University of Calgary and co-author of the paper: Calibrating the end-Permian mass extinction. “Our information narrows down the possibilities of what triggered the massive extinction and any potential kill mechanism must coincide with this time.”

About 95 percent of marine life and 70 percent of terrestrial life became extinct during what is known as the end-Permian, a time when continents were all one land mass called Pangea. The environment ranged from desert to lush forest. Four-limbed vertebrates were becoming diverse and among them were primitive amphibians, reptiles and a group that would, one day, include mammals.

Through the analysis of various types of dating techniques on well-preserved sedimentary sections from South China to Tibet, researchers determined that the mass extinction peaked about 252.28 million years ago and lasted less than 200,000 years, with most of the extinction lasting about 20,000 years.
“These dates are important as it will allow us to understand the physical and biological changes that took place,” says Henderson. “We do not discuss modern climate change, but obviously global warming is a biodiversity concern today. The geologic record tells us that ‘change’ happens all the time, and from this great extinction life did recover.
” There is ongoing debate over whether the death of both marine and terrestrial life coincided, as well as over kill mechanisms, which may include rapid global warming, hypercapnia (a condition where there is too much CO2 in the blood stream), continental aridity and massive wildfires.
The conclusion of this study says extinctions of most marine and terrestrial life took place at the same time. And the trigger, as suggested by these researchers and others, was the massive release of CO2 from volcanic flows known as the Siberian traps, now found in northern Russia.
Henderson’s conodont research was integrated with other data to establish the study’s findings. Conodonts are extinct, soft-bodied eel-like creatures with numerous tiny teeth that provide critical information on hydrocarbon deposits to global extinctions.

Note : The above story is reprinted from materials provided by University of Calgary. The original article was written by Leanne Yohemas.

Origins of Antarctica’s Ice-Covered Mountains Unraveled

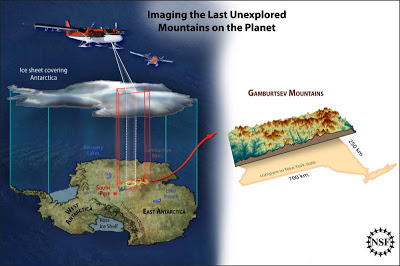
An artist’s rendering of the Antarctica Gamburstev Province (AGAP) project. (Credit: Zina Deretsky / NSF)
Buried below more than a mile of ice, Antarctica’s Gamburtsev Mountains have baffled scientists since their discovery in 1958. How did the mountains get there, and what role did they play in the spread of glaciers over the continent 30 million years ago? In the latest study on the mountains, scientists in the journal Nature say they have pieced together the puzzle of the origins and evolution of this mysterious mountain chain.
An international team of scientists flew over Antarctica’s deep interior in 2008-2009 with ice-penetrating radar, gravity meters and magnetometers to reveal the peaks and valleys hidden below the ice. The data they gathered has provided insight into how the mountains arose. One billion years ago, before animals or plants appeared on land, several continents collided and the oldest rocks that make up the Gamburtsevs smashed together. From the collision, a thick crustal root formed deep beneath the mountain range.
Over time, these ancient mountains were eroded but the cold dense root remained.
Between 250 and 100 million years ago — when dinosaurs walked Earth — the supercontinent Gondwana, which included Antarctica, ripped apart, causing the old crustal root to warm. Reactivated, the crustal root and the East Antarctic Rift pushed land upwards again, reforming the mountains. Rivers and glaciers carved deep valleys and raised peaks to create a spectacular landscape that resembled the European Alps.
The East Antarctic Ice Sheet, which formed 34 million years ago and at 10 million square kilometers covers an area the size of Canada, protected the mountains from erosion.
“It has been almost a billion years since the Gamburtsev first formed,” said study co-author Robin Bell, a geophysicist at Columbia University’s Lamont-Doherty Earth Observatory. “This work shows that very old mountains can rise again, like a Phoenix from the ashes. The Gamburtsevs rose from the long eroded East Antarctic craton.”
The study also resolves an apparent contradiction: how could such ancient mountains have retained their tall, jagged, and youthful peaks, said study co-author Carol Finn, a scientist at the U.S. Geological Survey. “We are accustomed to thinking that mountain building relates to a single tectonic event, rather than sequences of events,” she said.
“The lesson we learned about multiple events forming the Gamburtsevs may inform studies of the history of other mountain belts.”
“It was fascinating to find that the East Antarctic rift system resembles one of the geological wonders of the world — the East African rift system — and that it provides the missing piece of the puzzle that helps explain the Gamburtsev Subglacial Mountains,” said study lead author Fausto Ferraccioli, a scientist at British Antarctic Survey.
“The rift system was also found to contain the largest subglacial lakes in Antarctica.”
The team’s next goal is to drill through the ice and collect the first Gamburtsev rock samples. “Amazingly, we have samples of the moon but none of the Gamburtsevs,” said Bell. “With these rock samples we will be able to constrain when this ancient piece of crust was rejuvenated and grew to a magnificent mountain range.”

The work was funded by grants from the U.S. National Science Foundation (NSF) and was launched in conjunction with the International Polar Year, an effort to study the Arctic and Antarctic spanning 2007-2009 and involving research by thousands of scientists from more than 60 nations. “It is very fitting that the initial results of Antarctica’s Gamburtsev Province project are coming out 100 years after the great explorers raced to the South Pole,” said Alexandra Isern, program director at NSF.

“The scientific explorers of the AGAP project worked in harsh conditions to collect the data and detailed images of this major mountain range under the East Antarctic Ice Sheet. The results of their work will guide research in this region for many years to come.”

Support also came from the Natural Environment Research Council of Britain and the British Antarctic Survey, the Federal Institute for Geosciences and Resources in Germany and the Polar Research Institute of China.
Note : The above story is reprinted from materials provided by Columbia University’s Lamont-Doherty Earth Observatory. 

Methane May Be Answer to 56-Million-Year Question

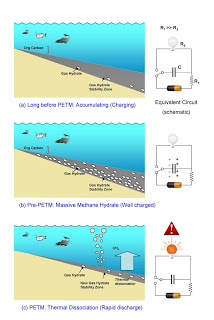
Research at Rice University bolstered a long-controversial theory that massive amounts of carbon from methane hydrate caused the Earth to warm 56 million years ago and drastically change the ecosystem. Rice scientists proposed in a new Nature Geoscience paper that hydrates collected in a narrower stability zone than today under the seafloor over millions of years were discharged rapidly as the planet warmed, much as an electrical capacitor gathers charge and releases it quickly. (Credit: Guangsheng Gu/Rice University)
The release of massive amounts of carbon from methane hydrate frozen under the seafloor 56 million years ago has been linked to the greatest change in global climate since a dinosaur-killing asteroid presumably hit Earth 9 million years earlier. New calculations by researchers at Rice University show that this long-controversial scenario is quite possible.
Nobody knows for sure what started the incident, but there’s no doubt Earth’s temperature rose by as much as 6 degrees Celsius. That affected the planet for up to 150,000 years, until excess carbon in the oceans and atmosphere was reabsorbed into sediment.
Earth’s ecosystem changed and many species went extinct during the Paleocene-Eocene Thermal Maximum (PETM) 56 million years ago, when at least 2,500 gigatonnes of carbon, eventually in the form of carbon dioxide, were released into the ocean and atmosphere. (The era is described in great detail in a recent National Geographic feature.)
A new report by Rice scientists in Nature Geoscience suggests that at the time, even though methane-containing gas hydrates — the “ice that burns” — occupied only a small zone of sediment under the seabed before the PETM, there could have been as much stored then as there is now.
This is a concern to those who believe the continued burning of fossil fuels by humans could someday trigger another feedback loop that disturbs the stability of methane hydrate under the ocean and in permafrost; this change could warm the atmosphere and prompt the release of large amounts of methane, a more powerful greenhouse gas than carbon dioxide.
Some who study the PETM blame the worldwide burning of peat, volcanic activity or a massive asteroid strike as the source of the carbon, “but there’s no crater, or any soot or evidence of the burning of peat,” said Gerald Dickens, a Rice professor of Earth science and an author of the study, who thinks the new paper bolsters the argument for hydrates.
The lead author is graduate student Guangsheng Gu; co-authors are Walter Chapman, the William W. Akers Professor in Chemical Engineering; George Hirasaki, the A.J. Hartsook Professor in Chemical Engineering; and alumnus Gaurav Bhatnagar, all of Rice; and Frederick Colwell, a professor of ocean ecology and biogeochemistry at Oregon State University.
In the ocean, organisms die, sink into the sediment and decompose into methane. Under high pressure and low temperatures, methane molecules are trapped by water, which freezes into a slushy substance known as gas hydrate that stabilizes in a narrow band under the seafloor.
Warmer oceans before the PETM would have made the stability zone for gas hydrate thinner than today, and some scientists have argued this would allow for much less hydrate than exists under the seafloor now. “If the volume — the size of the box — was less than today, how could it have released so much carbon?” Dickens asked. “Gu’s solution is that the box contains a greater fraction of hydrate.”
“The critics said, ‘No, this can’t be. It’s warmer; there couldn’t have been more methane hydrate,'” Hirasaki said. “But we applied the numerical model and found that if the oceans were warmer, they would contain less dissolved oxygen and the kinetics for methane formation would have been faster.”
With less oxygen to consume organic matter on the way down, more sank to the ocean floor, Gu said, and there, with seafloor temperatures higher than they are today, microbes that turn organic matter into methane work faster. “Heat speeds things up,” Dickens said. “It’s true for almost all microbial reactions. That’s why we have refrigerators.”
The result is that a stability zone smaller than what exists now may have held a similar amount of methane hydrate. “You’re increasing the feedstock, processing it faster and packing it in over what could have been millions of years,” Dickens said.
While the event that began the carbon-discharge cycle remains a mystery, the implications are clear, Dickens said. “I’ve always thought of (the hydrate layer) as being like a capacitor in a circuit. It charges slowly and can release fast — and warming is the trigger. It’s possible that’s happening right now.”
That makes it important to understand what occurred in the PETM, he said. “The amount of carbon released then is on the magnitude of what humans will add to the cycle by the end of, say, 2500. Compared to the geological timescale, that’s almost instant.”
“We run the risk of reproducing that big carbon-discharge event, but faster, by burning fossil fuel, and it may be severe if hydrate dissociation is triggered again,” Gu said, adding that methane hydrate also offers the potential to become a valuable source of clean energy, as burning methane emits much less carbon dioxide than other fossil fuels.
The calculations should encourage geologists who discounted hydrates’ impact during the PETM to keep an open mind, Dickens said. “Instead of saying, ‘No, this cannot be,’ we’re saying, ‘Yes, it’s certainly possible.'”
The United States Department of Energy supported the research.
Note : The above story is reprinted from materials provided by Rice University. 

Earthquakes Generate Big Heat in Super-Small Areas

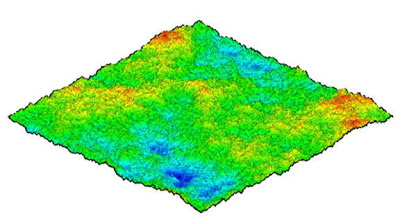
Hitting the high pointsComputer-simulated topography shows high points — asperities (in red) — on the rock surface. When in contact with asperties on the adjacent surface, these asperities may undergo intense flash heating in an earthquake.Credit: Mark Robbins and Sangil Hyun, Johns Hopkins UniversityHitting the high points Computer-simulated topography shows high points — asperities (in red) — on the rock surface. When in contact with asperties on the adjacent surface, these asperities may undergo intense flash heating in an earthquake. (Credit: Mark Robbins and Sangil Hyun, Johns Hopkins University)
In experiments mimicking the speed of earthquakes, geophysicists at Brown University detail a phenomenon known as flash heating. They report in a paper published in Science that because fault surfaces touch only at microscopic, scattered spots, these contacts are subject to intense stress and extreme heating during earthquakes, lowering their friction and thus the friction of the fault. The localized, intense heating can occur even while the temperature of the rest of the fault remains largely unaffected.

Most earthquakes that are seen, heard, and felt around the world are caused by fast slip on faults. While the earthquake rupture itself can travel on a fault as fast as the speed of sound or better, the fault surfaces behind the rupture are sliding against each other at about a meter per second.

But the mechanics that underlie fast slip during earthquakes have eluded scientists, because it’s difficult to replicate those conditions in the laboratory. “We still largely don’t understand what is going at earthquake slip speeds,” said David Goldsby, a geophysicist at Brown, “because it’s difficult to do experiments at these speeds.”
Now, in experiments mimicking earthquake slip rates, Goldsby and Brown geophysicist Terry Tullis show that fault surfaces in earthquake zones come into contact only at microscopic points between scattered bumps, called asperities, on the fault. These tiny contacts support all the force across the fault. The experiments show that when two fault surfaces slide against other at fast slip rates, the asperities may reach temperatures in excess of 2,700 degrees Fahrenheit, lowering their friction, the scientists write in a paper published in Science. The localized, intense heating can occur even while the temperature of the rest of the fault remains largely unaffected, a phenomenon known as flash heating.
“This study could explain a lot of the questions about the mechanics of the San Andreas Fault and other earthquakes,” said Tullis, professor emeritus of geological sciences, who has studied earthquakes for more than three decades.
The experiments simulated earthquake speeds of close to half a meter per second. The rock surfaces touched only at the asperities, each with a surface area of less than 10 microns — a tiny fraction of the total surface area. When the surfaces move against each other at high slip rates, the experiments revealed, heat is generated so quickly at the contacts that temperatures can spike enough to melt most rock types associated with earthquakes. Yet the intense heat is confined to the contact flashpoints; the temperature of the surrounding rock remained largely unaffected by these microscopic hot spots, maintaining a “room temperature” of around 77 degrees Fahrenheit, the researchers write.
“You’re dumping in heat extremely quickly into the contacts at high slip rates, and there’s simply no time for the heat to get away, which causes the dramatic spike in temperature and decrease in friction,” Goldsby said.
“The friction stays low so long as the slip rate remains fast,” said Goldsby, associate professor of geological sciences (research). “As slip slows, the friction immediately increases. It doesn’t take a long time for the fault to restrengthen after you weaken it. The reason is the population of asperities is short-lived and continually being renewed, and therefore at any given slip rate, the asperities have a temperature and therefore friction appropriate for that slip rate. As the slip rate decreases, there is more time for heat to diffuse away from the asperities, and they therefore have lower temperature and higher friction.”
Flash heating and other weakening processes that lead to low friction during earthquakes may explain the lack of significant measured heat flows along some active faults like the San Andreas Fault, which might be expected if friction was high on faults during earthquakes. Flash heating in particular may also explain how faults rupture as “slip pulses,” wrinkle-like zones of slip on faults, which would also decrease the amount of heat generated.
If that is the case, then many earthquakes have been misunderstood as high-friction events. “It’s a new view with low dynamic friction. How can it be compatible with what we know?” asked Tullis, who chairs the National Earthquake Prediction Evaluation Council, an advisory body for the U.S. Geological Survey.
“Flash heating may explain it,” Goldsby replied.
The U.S. Geological Survey funded the research.
Note : The above story is reprinted from materials provided by Brown University. 

CSI-Style Investigation of Meteorite Hits On Earth

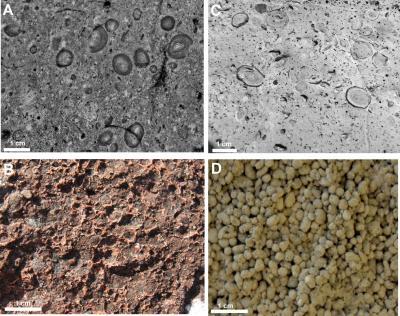
Meteorite impact ejecta (left) compared with volcanic deposits (right) showing closely similar structures made of dust particles. The top two photos show accretionary lapilli in density current deposits, whereas bottom two photos show pellets that formed when dust in the atmosphere clumped together and simply fell onto the land surface. (Credit: From Branney and Brown 2011 (Journal of Geology 199, 275-292))
Volcanologists from the Universities of Leicester and Durham have forensically reconstructed the impact of a meteorite on Earth and how debris was hurled from the crater to devastate the surrounding region.
New research by Mike Branney, of the University of Leicester’s Department of Geology, and Richard Brown, University of Durham, shows that some aspects of giant meteorite impacts onto Earth may mimic the behaviour of large volcanic eruptions.
Meteorite impacts are more common than is popularly appreciated — but what happens when the meteorite hits? Direct observation is understandably difficult, but researchers pick through impact debris that has been spared the ravages of erosion, to forensically reconstruct the catastrophic events.
Mike Branney and Richard Brown analysed an ejecta layer derived from the impact of a huge meteorite and discovered that much of the ejected debris moved across the ground as rapid, dense, ground-hugging currents of gas and debris, remarkably similar to the awesome pyroclastic density currents that flow radially outwards from explosive volcanoes.
Dr Branney said: “In particular, the way that ash and dust stick together seems identical. Moist ash from explosive volcanoes sticks together in the atmosphere to fall out as mm-sized pellets. Where these drop back into a hot pyroclastic density current, they grow into larger layered structures, known as accretionary lapilli.”

The researchers studied a finely preserved deposit in northwest Scotland from a huge impact that occurred a billion years ago. It shows both types of these ‘volcanic’ particles — pellets and lapilli — are produced.

Dr Brown added: “This reveals that that the 10 meter-thick layer, which has been traced for over 50 km along the Scottish coast, was almost entirely emplaced as a devastating density current that sped outwards from the point of impact — just like a density current from a volcano. Only the uppermost few centimetres actually fell out through the atmosphere. “

The Leicester and Durham scientists say that an improved understanding of what happens when large objects hits Earth will help us understand how these catastrophic events may have affected life on the planet in the past …and possibly in the future.

Note : The above story is reprinted from materials provided by University of Leicester.

Mapping the Formation of an Underwater Volcano

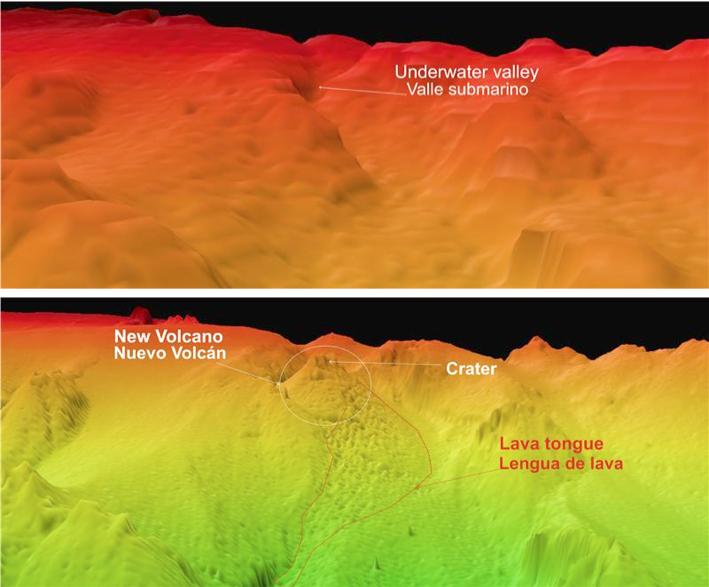
Top: The first image was taken in 1998 from within the Spanish Exclusive Economic Zone in the area of El Hierro Island. Bottom: The second has been taken now and shows the new volcano and its lava tongue that descends in the path of the old underwater valley. (Credit: IEO/MICINN)
On Oct. 9, 2011, an underwater volcano started to emerge in waters off El Hierro Island in the Canaries, Spain. Researchers of the Spanish Institute of Oceanography (IEO, Ministry of Science and Innovation) only needed 15 days to map its formation in high resolution. The volcanic cone has reached a height of 100 m and the lava tongue flows down its side, even though its activity has slowed down in the past few days.

“This is probably the first time that such a young underwater volcano has been mapped in such high resolution,” explains Juan Acosta, head of the IEO campaign set to study the volcanic cone that emerged this month near El Hierro island in the Canaries.

On the 9th October, scientists of Spain’s National Geographic Institute (Spanish Ministry of Development) detected the initial seismic movements that gave way to the birth of the underwater volcano. Then, by the 24th of this month, scientists on board the IEO’s ship Ramón Margalef had already completed the bathymetry (mapping of the sea bed) with unprecedented precision.
The boat has a cutting-edge sensor system which means that details of less than 10 metres can be observed on the sea bed. The bathymetry was obtained in two days by tracing parallel scans.
In 1998, within the framework in Spanish Exclusive Economic Zone, researchers of the IEO and Spain’s Marine Hydrographic Institute (Spanish Ministry of Defence) also mapped the same area from within the oceanographic ship Hespérides. Using a geographic information system, these images have now been superimposed onto those just taken and thus the birth of the volcano has been confirmed.
Acosta says that “it is spectacular to see how what was once an underwater valley is now a volcanic cone with its descending lava tongue.”
The base of the volcano lies at a depth of 300 m. It is conical and 100 m high with a base diameter of 700 m and a crater width of 120 m. The volume of the volcano is around 0.012 km3, 0.07 km3 of which is made up of its lava tongue that is slowly filling the adjacent valley.
Scientists have also created graphs of the gas plumes that are consistently coming out of the main crater and the surrounding cracks. However, at present the possible development and risks of the volcano have not been officially declared. Their mission is to provide data to those in charge of the Special Civil Protection Plan for Emergency Volcanic Risk in the Canary Islands (PEVOLCA) as a way of aiding them in the decision making process.
Named Bimbache after the first settlers of El Hierro Island, this scientific campaign is currently entering its second phase under the orders of the researcher Francisco Sánchez who is also from the IEO.
Until the 31st October, photographs and videos will be taken of the volcanic cone with an array of high resolution cameras which will be pulled by the remote observation submarine Liropus. From there, a third stage is predicted to get underway. This will involve the analysis of the currents and the physicochemical properties of the columns of water that surround the new volcano.
Note : The above story is reprinted from materials provided by Plataforma SINC, via AlphaGalileo.

Birthplace for Primitive Life On Earth? Researchers Identify Mud Volcanoes in Greenland as Niche for Early Life

The mud volcanoes at Isua, in south-west Greenland, have been identified as a possible birthplace for life on Earth by an international team headed by researchers from the Laboratoire de Géologie de Lyon: Terre, Planètes et Environnement (CNRS/Université Claude Bernard Lyon 1/ENS de Lyon). Almost four billion years ago, these volcanoes released chemical elements indispensable to the formation of the first biomolecules, under conditions favorable to life. It is the first time that such an environment, meeting all the requirements for the emergence of life, has been identified by scientists in 3.8 billion year- old formations.

This work is published this week in the Proceedings of the National Academy of Sciences.

Serpentinite is a dark green mineral used in decoration and jewelry. In nature, it is formed when sea water infiltrates into Earth’s upper mantle, at depths that can reach 200 km in subduction zones. According to the scientists, this mineral, often found in the walls of hydrothermal sources, could play a major role in the appearance of the first biomolecules.
It has often been presumed that life developed near to hydrothermal sources known as black smokers(1), such as those found at the bottom of the oceans along mid-ocean ridges. The abundance of hydrogen, methane and ammonia produced by these underwater geysers seemed favorable to the emergence of primitive life. Unfortunately, these black smokers are very acid, which prevents amino-acid stabilization, and thus the formation of organic molecules.
The team of scientists publishing this article focused their studies on serpentinites from Isua, in south-west Greenland, which date from the start of the Archean(2). Dating back some 3.8 billion years, the rocks of Isua are some of the oldest in the world. Using isotopes of zinc as indicators of the basic or acid nature of an environment, the researchers highlighted the basic character of the thermal fluids that permeated the Isua serpentinites, thus demonstrating that these minerals formed a favorable environment for amino-acid stabilization.
The researchers also compared these serpentinites with recent equivalents from the mid-oceanic ridge of the Artic Ocean, the Alps and Mexico: the Isua rocks are markedly depleted in heavy isotopes of zinc compared to the latter. On the other hand, their zinc is isotopically similar to that from mud volcanoes of the Marianas Trench. Nearly four billion years ago, at a time when the continents only occupied a very small part of the surface area of the globe, the oceanic crust of Isua was permeated by basic hydrothermal fluids, rich in carbonates, and at temperatures ranging from 100 to 300°C. Phosphorus, another indispensable element to life, is abundant in environments where serpentinization takes place(3).
As this process generates mud volcanoes, all the necessary conditions were gathered at Isua for organic molecules to form and be stable. The mud volcanoes at Isua thus represent a particularly favorable setting for the emergence of primitive terrestrial life.
  1. Black smokers are located on oceanic ridges. The black appearance of the water stems from the color of the iron and manganese salts that it contains.
  2. The Archaen eon stretches between 4 and 2.5 billion years ago.
  3. Hydration process which enables the formation of serpentinite.
Note : The above story is reprinted from materials provided by CNRS (Délégation Paris Michel-Ange), via AlphaGalileo. 

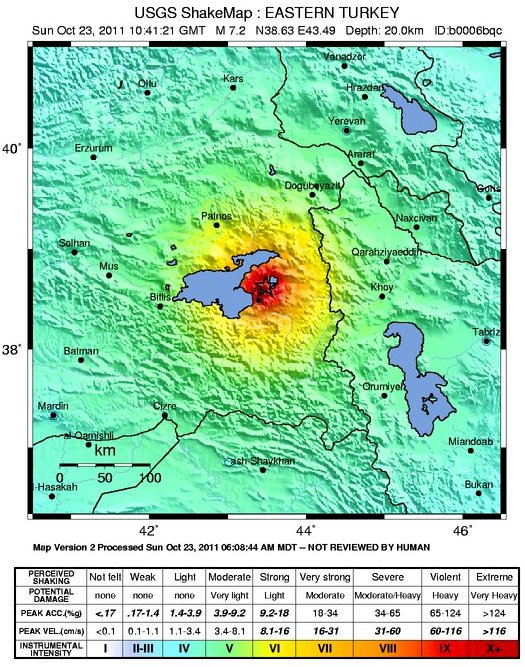
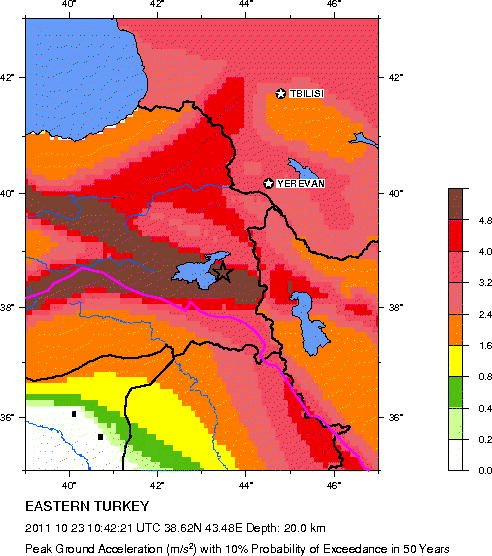
Understanding the 7.2 magnitude earthquake in East Turkey (October 23, 2011)

 Tectonic explanation of what happened
Turkey is a tectonically active country that experiences frequent destructive earthquakes. On a broad scale, the seismtectonics of the region near the October 23, 2011 earthquake are controlled by the collision of the Arabian Plate and Eurasian plates; at the latitude of this event, the Arabian plate converges with Eurasia in a northerly direction at a rate of approximately 24 mm/yr. West of the October 23, 2011, earthquake tectonics are dominated by strike-slip faulting on the East (in southern Turkey) and North (in northern Turkey) Anatolian fault zones. These large, translational fault systems extend across much of central and western Turkey and accommodate the western motion of the Anatolian block as it is being squeezed by the converging Arabian and Eurasian plates.

 In the area of Lake Van and further east, tectonics are dominated by the Bitlis Suture Zone (in eastern Turkey) and Zagros fold and thrust belt (toward Iran). The October 23, 2011 earthquake occurred in a broad region of convergence beyond the eastern extent of Anatolian strike-slip tectonics. The focal mechanism of today’s earthquake is consistent with oblique-thrust faulting similar to mapped faults in the region.
 This earthquake is a reminder of the many deadly seismic events that Turkey has suffered in the recent past. The devastating Izmit earthquake of 1999 (M = 7.6) broke a section of the North Anatolian Fault 1000 km to the west of the October 23 event and killed 17,000 people, injured 50,000, and left 500,000 homeless. Approximately 70 km from this earthquake a M7.3 earthquake occurred on November 11, 1976 destroying several villages near the Turkey and Iran border and killing several thousand people.
A M7.8 earthquake struck Erzincan in 1939, killing an estimated 33,000 people.
Text and images courtesy USGS
copied from earthquake Reports 

Fiery volcano offers geologic glimpse into land that time forgot

The first scientists to witness exploding rock and molten lava from a deep sea volcano, seen during a 2009 expedition, report that the eruption was near a tear in the Earth’s crust that is mimicking the birth of a subduction zone.
Scientists on the expedition collected boninite, a rare, chemically distinct lava that accompanies the formation of Earth’s subduction zones.
 
Nobody has ever collected fresh boninite and scientists never had the opportunity to monitor its eruption before, said Joseph Resing, University of Washington oceanographer and lead author of an online article on the findings in Nature Geoscience. Earth’s current subduction zones are continually evolving but most formed 5 million to 200 million years ago. Scientists have only been able to study boninite collected from long-dead, relic volcanos millions of years old.
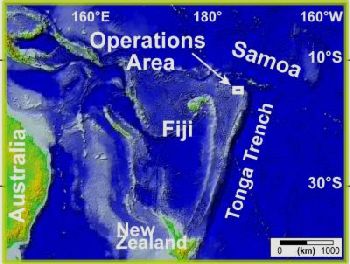
Resing was chief scientist on the expedition, funded by the National Oceanic and Atmospheric Administration and the National Science Foundation, that pinpointed the location of the West Mata volcano, erupting 4,000 feet (1,200 meters) below the surface in the Southwest Pacific Ocean.
“Everything about the eruption itself – how fast, how intense, the ratio of lava to explosive fragments, the amount and composition of gas released – is new to us,” said co-author Kenneth Rubin, University of Hawaii geologist. “Plus, having a young, fresh occurrence of this very rare rock type to study gives us the opportunity to examine subtle chemical and mineralogical variations in a pristine specimen.”
At subduction zones the oceanic crust on one tectonic plate slides beneath another, producing abundant volcanism and contributing heat, gases and mineral-laden fluids to ocean waters. Scientists have long studied the impact of subduction zones on geological and geochemical cycles. To puzzle out how subduction zones form and evolve they study inactive contemporary marine volcanos that do not produce boninite and they collect and study boninite lavas collected on land and examine cores collected from the deep sea.
“West Mata lies above the subducting Pacific plate and is part of the rapidly expanding Lau Basin, which is bounded by Samoa, Tonga and Fiji,” Resing said. “The large bend at the northern end of the Tonga trench produces a tear in the Pacific plate and creates unusual lavas that usually only form at very young subduction zones.”
Conditions are right for boninite to form, there’s lots of seawater released from subducting rock that mixes into relatively shallow mantle that has previously melted, causing the mantle to remelt at high temperatures. Boninite lavas are believed to be among the hottest from volcanoes that erupt on Earth.
“What makes this exciting is how uncommon these eruptions of boninite are, both now and in the past,” Rubin said. “Locked within the boninite is critical information about the rates and magnitudes of subduction-zone magmatism and global geochemical cycles.”
The scientists writing in Nature Geoscience think the release of gaseous water, carbon dioxide and sulfur dioxide from the slab is the reason the eruption was so explosive. No one realized such energetic eruptions happened so deep, Resing says.
Streams of red and gold lava 35 feet long shot through the water and lava-skinned bubbles some three feet across emerged.
West Mata, which the scientists estimate has been erupting for at least three years, and eight other elongated volcanoes that overlap each other in the northeast Lau Basin sit within one of the most magmatically active areas on Earth, Resing says.
“The basin may prove an important place to study submarine volcanic eruptions in relation to early stages of subduction,” he said.
Rubin and Robert Embley, with NOAA’s Pacific Marine Environmental Laboratory, Newport, Ore., and co-author on the paper, will return to the area in November for further study and to try to determine if the volcano is still actively erupting.
“Observing the eruption in real time was a rare and special opportunity because we know so little about how submarine volcanic activity behaves,” Embley said. “This is one of only a handful of ‘glimpses’ of the process we’ve had to date and is the first time we’ve actually observed natural submarine light from the glowing magma.
Note: This story has been adapted from a news release issued by the University of Washington

Earthquakes generate big heat in super-small areas

Geophysicists Terry Tullis, left, and David Goldsby have shown that rock surfaces sliding past each other in an earthquake can create intense heat but only at the pinpoint places where their surfaces actually touch. – Mike Cohea, Brown University

Most earthquakes that are seen, heard, and felt around the world are caused by fast slip on faults. While the earthquake rupture itself can travel on a fault as fast as the speed of sound or better, the fault surfaces behind the rupture are sliding against each other at about a meter per second.

But the mechanics that underlie fast slip during earthquakes have eluded scientists, because it’s difficult to replicate those conditions in the laboratory. “We still largely don’t understand what is going at earthquake slip speeds,” said David Goldsby, a geophysicist at Brown, “because it’s difficult to do experiments at these speeds.”

Now, in experiments mimicking earthquake slip rates, Goldsby and Brown geophysicist Terry Tullis show that fault surfaces in earthquake zones come into contact only at microscopic points between scattered bumps, called asperities, on the fault. These tiny contacts support all the force across the fault. The experiments show that when two fault surfaces slide against other at fast slip rates, the asperities may reach temperatures in excess of 2,700 degrees Fahrenheit, lowering their friction, the scientists write in a paper published in Science. The localized, intense heating can occur even while the temperature of the rest of the fault remains largely unaffected, a phenomenon known as flash heating.
 
“This study could explain a lot of the questions about the mechanics of the San Andreas Fault and other earthquakes,” said Tullis, professor emeritus of geological sciences, who has studied earthquakes for more than three decades.
 The experiments simulated earthquake speeds of close to half a meter per second. The rock surfaces touched only at the asperities, each with a surface area of less than 10 microns – a tiny fraction of the total surface area. When the surfaces move against each other at high slip rates, the experiments revealed, heat is generated so quickly at the contacts that temperatures can spike enough to melt most rock types associated with earthquakes. Yet the intense heat is confined to the contact flashpoints; the temperature of the surrounding rock remained largely unaffected by these microscopic hot spots, maintaining a “room temperature” of around 77 degrees Fahrenheit, the researchers write.

“You’re dumping in heat extremely quickly into the contacts at high slip rates, and there’s simply no time for the heat to get away, which causes the dramatic spike in temperature and decrease in friction,” Goldsby said.

“The friction stays low so long as the slip rate remains fast,” said Goldsby, associate professor of geological sciences (research). “As slip slows, the friction immediately increases. It doesn’t take a long time for the fault to restrengthen after you weaken it.
The reason is the population of asperities is short-lived and continually being renewed, and therefore at any given slip rate, the asperities have a temperature and therefore friction appropriate for that slip rate. As the slip rate decreases, there is more time for heat to diffuse away from the asperities, and they therefore have lower temperature and higher friction.”

Flash heating and other weakening processes that lead to low friction during earthquakes may explain the lack of significant measured heat flows along some active faults like the San Andreas Fault, which might be expected if friction was high on faults during earthquakes. Flash heating in particular may also explain how faults rupture as “slip pulses,” wrinkle-like zones of slip on faults, which would also decrease the amount of heat generated.

If that is the case, then many earthquakes have been misunderstood as high-friction events. “It’s a new view with low dynamic friction. How can it be compatible with what we know?” asked Tullis, who chairs the National Earthquake Prediction Evaluation Council, an advisory body for the U.S. Geological Survey.

“Flash heating may explain it,” Goldsby replied.

Note: This story has been adapted from a news release issued by the Brown University

Possible Trigger for Volcanic ‘Super-Eruptions’ Discovered

Volcano. (Credit: © Beboy / Fotolia)
The “super-eruption” of a major volcanic system occurs about every 100,000 years and is considered one of the most catastrophic natural events on Earth, yet scientists have long been unsure about what triggers these violent explosions.

However, a new model presented this week by researchers at Oregon State University points to a combination of temperature influence and the geometrical configuration of the magma chamber as a potential cause for these super-eruptions.

Results of the research, which was funded by the National Science Foundation, were presented at the annual meeting of the Geological Society of America in Minneapolis, Minn.
Patricia “Trish” Gregg, a post-doctoral researcher at OSU and lead author on the modeling study, says the creation of a ductile halo of rock around the magma chamber allows the pressure to build over tens of thousands of years, resulting in extensive uplifting in the roof above the magma chamber. Eventually, faults from above trigger a collapse of the caldera and subsequent eruption.
“You can compare it to cracks forming on the top of baking bread as it expands,” said Gregg, a researcher in OSU’s College of Oceanic and Atmospheric Sciences. “As the magma chamber pressurizes at depth, cracks form at the surface to accommodate the doming and expansion. Eventually, the cracks grow in size and propagate downward toward the magma chamber.
“In the case of very large volcanoes, when the cracks penetrate deep enough, they can rupture the magma chamber wall and trigger roof collapse and eruption,” Gregg added.
The eruption of super-volcanoes dwarfs the eruptions of recent volcanoes and can trigger planetary climate change by inducing Ice Ages and other impacts. One such event was the Huckleberry Ridge eruption of present-day Yellowstone Park about two million years ago, which was more than 2,000 times larger than the 1980 eruption of Mount St. Helens in Washington.
“Short of a meteor impact, these super-eruptions are the worst environmental hazards our planet can face,” Gregg said. “Huge amounts of material are expelled, devastating the environment and creating a gas cloud that covers the globe for years.”
Previous modeling efforts have focused on an eruption trigger from within the magma chamber, which scientists thought would leave a visible trace in the form of a precursor eruption deposits, according to Shanaka “Shan” de Silva, an OSU geologist and co-author on the study. Yet there has been a distinct lack of physical evidence for a pre-cursor eruption at the site of these super-volcanoes.
The model suggests the reason there may be no precursor eruption is that the trigger comes from above, not from within, de Silva pointed out.
“Instead of taking the evidence in these eruptions at face value, most models have simply taken small historic eruptions and tried to scale the process up to super-volcanic proportions,” de Silva said. “Those of us who actually study these phenomena have known for a long time that these eruptions are not simply scaled-up Mt. Mazamas or Krakataus — the scaling is non-linear. The evidence is clear.”
It takes a “perfect storm” of conditions to grow an eruptible magma chamber of this size, Gregg says, which is one reason super-volcano eruptions have occurred infrequently throughout history. The magma reservoirs feeding the eruptions could be as large as 10,000- to 15,000-square cubic kilometers, and the chamber requires repeated intrusions of magma from below to heat the surrounding rock and make it malleable. It is that increase in ductility that allows the chamber to grow without magma evacuation in a more conventional manner.
When magma chambers are smaller, they may expel magma before maximum pressure is reached through frequent small eruptions.
The Yellowstone eruption is one of the largest super-volcano events in history and it has happened several times. Other super-volcano sites include Lake Toba in Sumatra, the central Andes Mountains, New Zealand and Japan.
Gregg said that despite its explosive history, it doesn’t appear that Yellowstone is primed for another super-eruption anytime soon, though the slow process of volcanic uplift is taking place every day.
“The uplift of the surface at Yellowstone right now is on the order of millimeters,” she explained. “When the Huckleberry Ridge eruption took place, the uplift of the whole Yellowstone region would have been hundreds of meters high, and perhaps as much as a kilometer.”
Other authors on the investigation include Erik Grosfils, of Pomona College, and John Parmigiani, an OSU engineer.
Note : The above story is reprinted from materials provided by Oregon State University. 

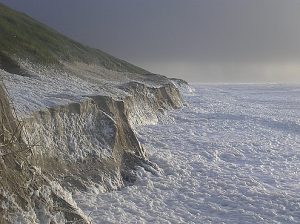
Luminous grains of sand determine year of historic storm flood

©Marcel A.J. Bakker, TNO Geological Survey of the Netherlands
Scientists at Delft University of Technology (TU Delft, The Netherlands) have successfully matched a layer of sediment from the dunes near Heemskerk to a severe storm flood that occurred in either 1775 or 1776. This type of information helps us gain more insight into past storm floods and predict future surges more accurately.
The scientists’ findings have been be published in the online edition of the scientific magazine Geology, and will be cover story of the November paper edition.
Historic knowledge
Our historic knowledge about storm floods (and water levels) on the Dutch coast is relatively limited. Records were not kept consistently until the late nineteenth century. This is unfortunate, because the limited historical archive makes it difficult to formulate statistical conclusions and predictions about future storm floods. It is also harder for us to establish whether storm floods are becoming more severe over the years.
Heemskerk
With the support of Technology Foundation STW and in cooperation with scientists from the Geological Survey of the Netherlands (TNO) and Deltares, scientists at TU Delft have now shown that historic storm-flood data can be augmented using luminescence dating. The team, led by Dr Jakob Wallinga, published their findings in the scientific magazine Geology.
The method was applied to a layer of sediment in the dunes near Heemskerk, created during a storm flood centuries ago and exposed by a storm in 2007. The level to which the storms and waves pushed the water can be deduced from the height of this layer. During the storm-surge in question, the water was higher than the catastrophic flood of 1953.
In order to put these data on a historical timeline, however, it is essential to know when the storm occurred. The scientists have now been able to show that in all probability the layer of sediment was deposited in 1775 or 1776. Historical sources indicate that severe storm floods took place in both years.
Grains of sand
Optical stimulated luminescence was used for the dating procedure. It simply requires a sample of sand from the sediment layer. The technique is based on the phenomenon that grains of sand can emit a faint light signal when they are illuminated with a certain frequency of light. The strength of the luminescence signal grows stronger over time as a result of natural radioactivity (background radiation) from the surroundings. However, the signal is reset to zero when the grains of sand are exposed to sunlight.
The strength of the luminescence signal (and the local strength of the background radiation) indicates the length of time since the grains were last exposed to light; in other words, the moment when they were ‘buried’. Using luminescence dating, a precision of 5% is achievable.
C-14
Luminescence dating requires nothing more than grains of sand, which means it can be used instead of the popular C-14 method at different sites and in different situations. After all, C-14 dating requires organic material. Luminescence dating can be used to date sediment from anywhere between just a few years to over 150,000 years old. It is also used in other disciplines, such as archaeology and art history.
 Note : The above story is reprinted from materials provided by Delft University of Technology.

Southern California’s tectonic plates revealed in detail

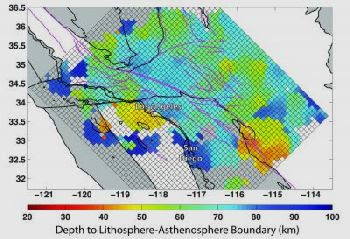
The geologic forces that shape the Earth’s surface do their work in the lithosphere, often out of sight and far below the surface. Researchers have now measured the lithosphere’s thickness in southern California. It varies widely, from less than 25 miles to nearly 60 miles. – Fischer Lab, Brown University
Rifting is one of the fundamental geological forces that have shaped our planet. Were it not for the stretching of continents and the oceans that filled those newly created basins, Earth would be a far different place. Yet because rifting involves areas deep below the Earth’s surface, scientists have been unable to understand fully how it occurs.

What is known is that with rifting, the center of the action lies in the lithosphere, which makes up the tectonic plates and includes the crust and part of the upper mantle. In a paper in Science, researchers at Brown University produce the highest-resolution picture of the bottom of the lithosphere in southern California, one of the most complex, captivating geologic regions in the world. The team found the lithosphere’s thickness differs markedly throughout the region, yielding new insights into how rifting shaped the southern California terrain.

“What we’re getting at is how (continental) plates break apart,” said Vedran Lekic, a postdoctoral researcher at Brown University and first author on the paper. “What happens below the surface is just not known.”
 
The team measured the boundary separating the lithosphere from the more ductile layer just below it known as the asthenosphere in a 400-by-300-mile grid, an area that includes Santa Barbara, Los Angeles, San Diego and the Salton Trough. The lithosphere’s thickness varies surprisingly from less than 25 miles to nearly 60 miles, the researchers write.
“We see these really dramatic changes in lithosphere thickness, and these occur over very small horizontal distances,” said Karen Fischer, professor of geological sciences at Brown and a paper author. “That means that the deep part of the lithosphere, the mantle part, has to be strong enough to maintain relatively steep sides.”
“This approach provides a new way to put observational constraints on how strong the rocks are at these depths,” she added.
Specifically, the researchers found two areas of particular interest. One is the Western Transverse Range Block. The plate lies below Santa Barbara, yet some 18 million years ago, it was located some 125 miles to the south and hugged the coastline. At some point, this plate swung clockwise, rotating more than 90 degrees and journeyed northward, like a mobile, swinging door. Interestingly, the lithosphere remained intact, while the area left behind the swinging plate, called the Inner Continental Borderland and which lies off the coast of Los Angeles, was stretched, the Brown geophysicists believe. Indeed, the lithosphere is nearly 30 percent thinner in the area left behind than the range block.
“The fact that the Western Tranverse Range Block retained its lithosphere along its journey tells us the mantle-lithosphere (of the block) must be very strong,” Lekic said.
Another interesting feature noted by the researchers is the Salton Trough, which encompasses the Salton Sea and the city of Palm Springs, and “is a classic example of rifting,” according to Fischer. Some 6 million years ago, the continental plate at this location was stretched, but the question remains whether it simply thinned or whether it actually broke apart, creating new lithosphere in between. In the paper, the researchers confirm that the lithosphere is thin, but “we can’t tell which of these scenarios happened,” Fischer said. However, the thickness of the mantle part of the lithosphere and the fact that deformation at the surface runs all the way to the base of the lithosphere in roughly the same geographical location are new constraints against which modelers can test their predictions, she added.
The team made use of permanent seismic recording stations set up by the Southern California Seismic Network and other networks, as well as seismometers from the EarthScope USarray Transportable Array, a grid of National Science Foundation-funded stations that is gathering earthquake information as it moves west to east across the nation. To measure the lithosphere’s depth, the authors looked at how waves generated by earthquakes – called S waves and P waves – convert from type S to type P across the boundary between the lithosphere and the asthenosphere.
The team will compare its results with those of another famous rift system in East Africa, from a study at the University of Bristol led by Kate Rychert, who earned her doctorate at Brown in 2007.
Scott French, who earned his baccalaureate at Brown and is now a doctoral student at Berkeley Seismological Laboratory in California, is an author on the paper. The National Science Foundation funded the study, through its Earthscope program and an Earth Sciences postdoctoral fellowship to Lekic.
Note: This story has been adapted from a news release issued by the Brown University

Multibeam sonar can map undersea gas seeps

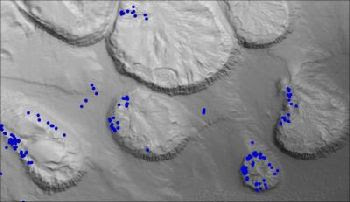
This is a perspective of the seafloor showing preliminary results of gas seeps detected by multibeam sonar in vicinity of Biloxi Dome in Northern Gulf of Mexico. Gas seep locations are shown as blue dots and are overlaid on the seafloor bathymetry that was collected – Image produced by the University of New Hampshire Center for Coastal and Ocean Mapping/Joint Hydrographic Center using IVS Fledermaus software.
A technology commonly used to map the bottom of the deep ocean can also detect gas seeps in the water column with remarkably high fidelity, according to scientists from the University of New Hampshire and the National Oceanic and Atmospheric Administration (NOAA). This finding, made onboard the NOAA ship Okeanos Explorer in the Gulf of Mexico, will lead to more effective mapping of these gas seeps and, ultimately, enhanced understanding of our ocean environments.
The mapping technology, multibeam sonar, is an echo-sounding technology that surveys a wide, fan-shaped swath of the seafloor, providing much greater coverage than the single-beam sonar systems previously used to map seeps. “We wanted to see whether we could map a large area of gaseous seeps effectively using this technology, and how well the multibeam sonar compared to our very sensitive single-beam sonars,” says Tom Weber of UNH’s Center for Coastal Mapping, who was lead scientist of this mission.
“It turns out it works wonderfully.” The multibeam sonar on the Okeanos Explorer produced data to make high-resolution maps of gas in the water column in depths ranging from 3,000 to 7,000 feet.
Working jointly with scientists and technicians from NOAA’s Office of Ocean Exploration and Research (OER) and the Bureau of Ocean Energy Management (BOEM), Weber and colleagues mapped more than 17,000 square kilometers of the Gulf of Mexico from Aug. 22 through Sept. 10, 2011.
Sonar finds features on the ocean floor much the way a bat tracks its dinner: “It’s an acoustic wave hitting the target and reflecting back,” says Weber. Multibeam sonar sends those sound waves in many directions at the same time, enabling it to “see” a swath of targets that is much wider than what would be observed with a single-beam sonar. While it’s known to be an effective tool for mapping large, stable items like the bottom of the ocean, it wasn’t designed to detect targets within the water column.
Gas seeps – primarily but not exclusively methane – are numerous in the Gulf of Mexico, emanating from natural fissures in the seafloor. They can be associated with oil, but oil was not the focus for Weber and his collaborators. Finding and mapping gaseous seeps, says Weber, helps scientists better understand the ocean: its methane fluxes, carbon cycle, and deep-water marine environments.
Further, the Gulf of Mexico is home to many active oil-drilling sites, and mapping the gaseous seeps in the water column will inform scientific as well as regulatory decisions. “In the deep ocean, there are life forms like tubeworms and clams associated with gas seeps, and they’re treated as protected resources,” Weber says.
Further, mapping these seeps will give researchers baseline data on what exists in the water column, helping them determine whether future seeps are natural or unwanted byproducts of drilling.
“Mapping the seafloor and the water column are essential first steps in exploring our largely unknown ocean,” says Weber. “This expedition confirms earlier indications that multibeam technology provides a valuable new tool in the inventory to detect plumes of gas in the water column, and especially in deep water.”

Also on the mission from UNH were CCOM research scientist Jonathan Beaudoin and graduate students Kevin Jerram (pursuing an M.S. in ocean engineering) and Maddie Schroth-Miller (pursuing an M.S. in applied mathematics). NOAA’s expedition coordinator and lead NOAA scientist on the mission was Mashkoor Malik, who graduated from UNH in 2005 with a M.S. in ocean mapping.

Note: This story has been adapted from a news release issued by the University of New Hampshire

Tenerife Geology Discovery Is Among ‘World’s Best’

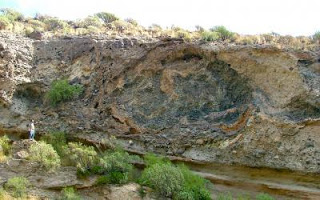
Pablo Dávila-Harris looks at part of the huge landslide deposit discovered on Tenerife, showing the chaotic and shattered rubble from the collapsed volcano. (The central dark debris-block is about 15 meters in diameter and must weigh many tons). (Credit: Pablo Dávila-Harris)
Volcanologists from the University of Leicester have uncovered one of the world’s best-preserved accessible examples of a monstrous landslide that followed a huge volcanic eruption on the Canarian island of Tenerife.

Seven hundred and thirty-three thousand years ago, the southeast slopes of Tenerife collapsed into the sea, during the volcanic eruption. The onshore remains of this landslide have just been discovered amid the canyons and ravines of Tenerife’s desert landscape by volcanologists Pablo Dávila-Harris and Mike Branney of the University of Leicester’s Department of Geology.

The findings have been published in this October’s edition of the international journal Geology. The research was funded by CONACYT, Mexico.
Dr Branney said: “It is one of the world’s best-preserved accessible examples of such an awesome phenomenon, because the debris from such landslides mostly spreads far across the deep ocean floor, inaccessible for close study.
“The beautifully-displayed Tenerife rubble includes blocks of rapidly chilled lava, added as the volcano erupted. Radioactive minerals within them enabled the researchers’ colleague, Michael Storey at Roskilde University, Denmark, to provide such a precise date for this natural catastrophe.
“Climate change is often invoked as a trigger for ocean-island landslides, but in this case it seems that a growing dome of hot lava triggered the landslide by pushing the side of the volcano outwards.
“In the shattered landscape that remained, lakes formed as rivers were dammed by debris, and the change to the shape of the island altered the course of explosive volcanic eruptions for hundreds of thousands of years afterwards.”
The researchers state that such phenomena are common but infrequent, and understanding them is vital, for their effects go far beyond a single ocean island. Tsunamis generated from such events may travel to devastate coastlines thousands of miles away.
“Understanding the Earth’s more violent events will help us be prepared, should repeat performances threaten,” they state.
 
Note : The above story is reprinted from materials provided by University of Leicester, via EurekAlert!, a service of AAAS. 

MOST POPULAR

MORE ARTICLES