About 12,800 years ago when the Earth was warming and emerging from the last ice age, a dramatic and anomalous event occurred that abruptly reversed climatic conditions back to near-glacial state. According to James Kennett, UC Santa Barbara emeritus professor in earth sciences, this climate switch fundamentally –– and remarkably –– occurred in only one year, heralding the onset of the Younger Dryas cool episode.
The cause of this cooling has been much debated, especially because it closely coincided with the abrupt extinction of the majority of the large animals then inhabiting the Americas, as well as the disappearance of the prehistoric Clovis culture, known for its big game hunting.
“What then did cause the extinction of most of these big animals, including mammoths, mastodons, giant ground sloths, American camel and horse, and saber- toothed cats?” asked Kennett, pointing to Charles Darwin’s 1845 assessment of the significance of climate change. “Did these extinctions result from human overkill, climatic change or some catastrophic event?” The long debate that has followed, Kennett noted, has recently been stimulated by a growing body of evidence in support of a theory that a major cosmic impact event was involved, a theory proposed by the scientific team that includes Kennett himself.
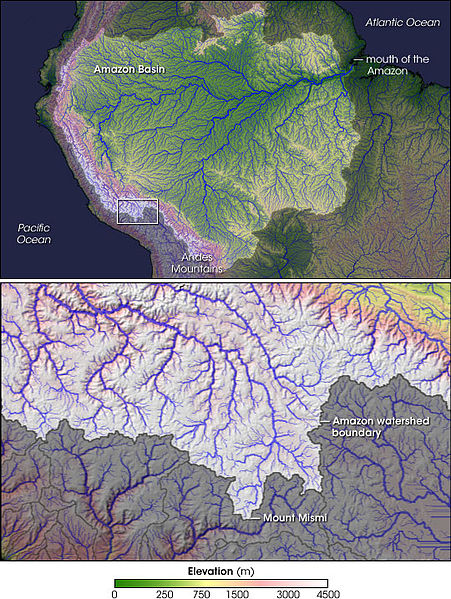
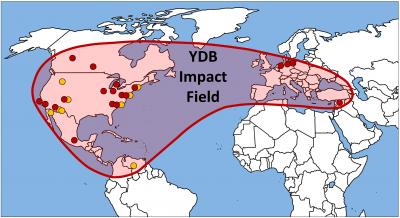
Now, in one of the most comprehensive related investigations ever, the group has documented a wide distribution of microspherules widely distributed in a layer over 50 million square kilometers on four continents, including North America, including Arlington Canyon on Santa Rosa Island in the Channel Islands. This layer –– the Younger Dryas Boundary (YDB) layer –– also contains peak abundances of other exotic materials, including nanodiamonds and other unusual forms of carbon such as fullerenes, as well as melt-glass and iridium. This new evidence in support of the cosmic impact theory appeared recently in a paper in the Proceedings of the National Academy of the Sciences.
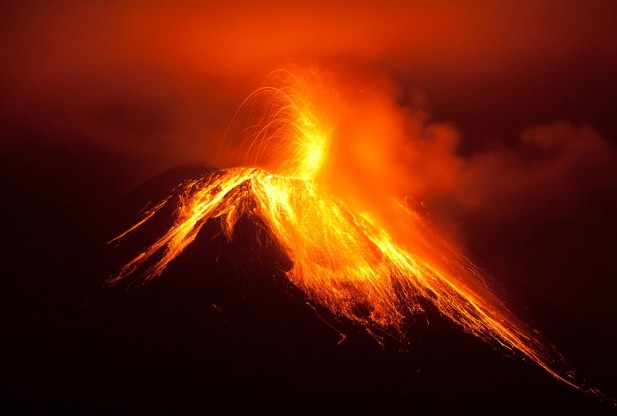
This cosmic impact, said Kennett, caused major environmental degradation over wide areas through numerous processes that include continent-wide wildfires and a major increase in atmospheric dust load that blocked the sun long enough to cause starvation of larger animals.
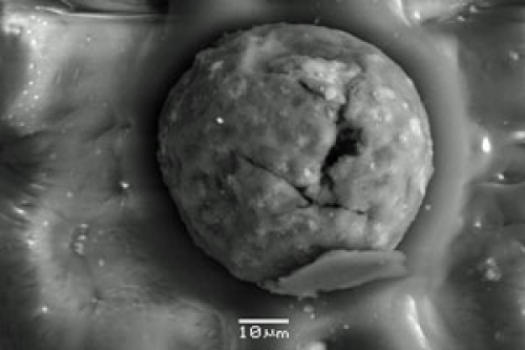
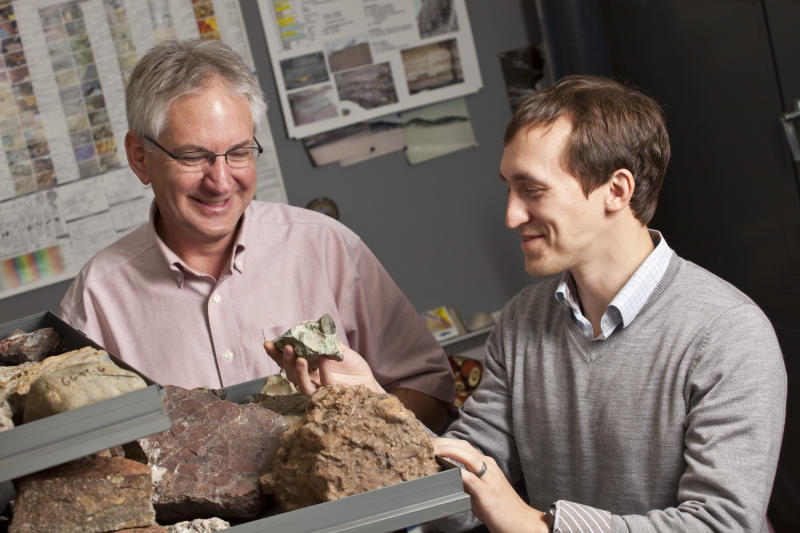
Investigating 18 sites across North America, Europe and the Middle East, Kennett and 28 colleagues from 24 institutions analyzed the spherules, tiny spheres formed by the high temperature melting of rocks and soils that then cooled or quenched rapidly in the atmosphere. The process results from enormous heat and pressures in blasts generated by the cosmic impact, somewhat similar to those produced during atomic explosions, Kennett explained.
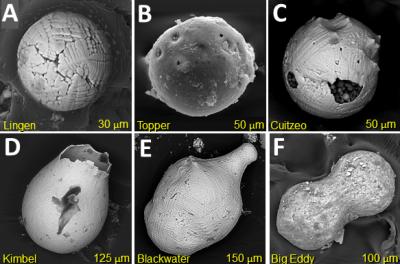
But spherules do not form from cosmic collisions alone. Volcanic activity, lightning strikes, and coal seam
fires all can create the tiny spheres. So to differentiate between impact spherules and those formed by other processes, the research team utilized scanning electron microscopy and energy dispersive spectrometry on nearly 700 spherule samples collected from the YDB layer. The YDB layer also corresponds with the end of the Clovis age, and is commonly associated with other features such as an overlying “black mat” –– a thin, dark carbon-rich sedimentary layer –– as well as the youngest known Clovis archeological material and megafaunal remains, and abundant charcoal that indicates massive biomass burning resulting from impact.
The results, according to Kennett, are compelling. Examinations of the YDB spherules revealed that while they are consistent with the type of sediment found on the surface of the earth in their areas at the time of impact, they are geochemically dissimilar from volcanic materials. Tests on their remanent magnetism –– the remaining magnetism after the removal of an electric or magnetic influence –– also demonstrated that the spherules could not have formed naturally during lightning strikes.
“Because requisite formation temperatures for the impact spherules are greater than 2,200 degrees Celsius, this finding precludes all but a high temperature cosmic impact event as a natural formation mechanism for melted silica and other minerals,” Kennett explained. Experiments by the group have for the first time demonstrated that silica-rich spherules can also form through high temperature incineration of plants, such as oaks, pines, and reeds, because these are known to contain biologically formed silica.
Additionally, according to the study, the surface textures of these spherules are consistent with high temperatures and high-velocity impacts, and they are often fused to other spherules. An estimated 10 million metric tons of impact spherules were deposited across nine countries in the four continents studied. However, the true breadth of the YDB strewnfield is unknown, indicating an impact of major proportions.
“Based on geochemical measurements and morphological observations, this paper offers compelling evidence to reject alternate hypotheses that YDB spherules formed by volcanic or human activity; from the ongoing natural accumulation of space dust; lightning strikes; or by slow geochemical accumulation in sediments,” said Kennett.
Note : The above story is reprinted from materials provided by University of California – Santa Barbara