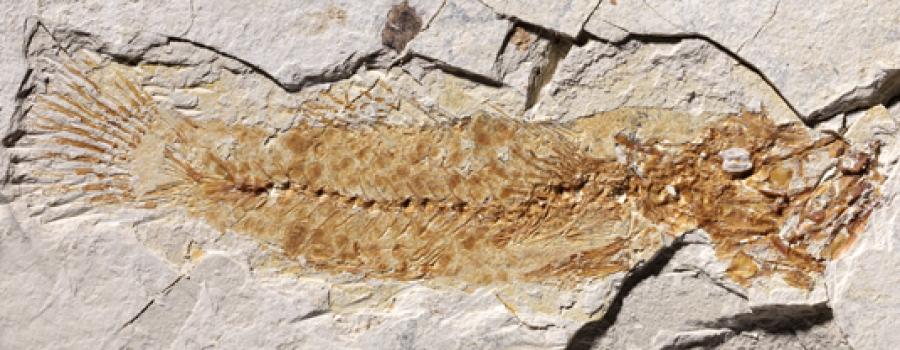
Fish fossils that are about 23 million years old give unprecedented insight into the evolutionary history of the gobioid order, one of the most species-rich groups among the modern bony fishes.
The fossil material examined is unusually well preserved. “This has allowed us to describe a gobioid fossil in greater detail than ever before,” says Reichenbacher. Indeed, the authors of the new study have been able to show that the fossil species concerned does not belong to the true gobies at all, in contrast to what earlier investigators had concluded. It is a member of an enigmatic family now known as the Butidae. Until very recently Butidae had been classified among the sleeper gobies. The family is now recognized as a separate clade, whose members are found in tropical river systems of Africa, Madagascar, Asia and Australia. Furthermore, no fossil specimens that could be attributed to this family have been identified until now. Indeed, datable gobioid fossils are comparatively rare in the fossil record. Since fossils of known age provide chronological markers of phylogeny, this has hampered understanding of the evolutionary history of this highly successful group of fishes.
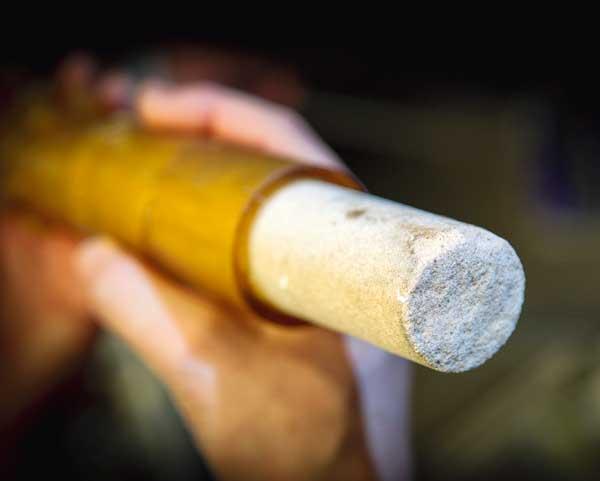
The signature ear-stones
The new description published by the LMU team, in collaboration with a group of French researchers, is based on material that was discovered in the South of France and made available for study by the Cuvier Museum in Montbéliard. The specimens were excavated from sediments that had been laid down in a shallow lagoon near the coast of the Tethys Sea, the precursor of the modern Mediterranean, towards the end of the Oligocene epoch, around 23 million years ago. Among the many unusual features of the find is the fact that the otoliths (also known as ear-stones), which are small calcified particles that form part of the balance organs in the inner ear of bony fish, are perfectly preserved. Reichenbacher, who specializes in the analysis of fossil otoliths, explains the significance of this: “Otoliths are made up of the mineral aragonite, together with a minor fraction of organic material. What makes them of such interest for us is that they can be read like a genetic code. Otoliths allow us to deduce what sort of fish they belonged to, even if nothing else has survived,” she says. This is why the ear-stones play such a crucial role in studies of the paleontology, evolutionary history and biodiversity of the teleosts.
The otoliths revealed to the researchers that the fossils did not actually belong among the true gobies, but should be assigned to either the sleeper gobies or the butids. “Among the skeletal elements of the fossils, we then identified other traits that confirmed this assessment and enabled us to place the species among the butids,” says doctoral student Christoph Gierl, who analyzed the structural anatomy of the skull and the dorsal and pelvic fins.
This is the first butid fossil to be found anywhere. Interestingly, no members of the Butidae are found in European waters today. The new findings show that, back in the Oligocene, butids were distributed in estuaries and lagoons around the Tethys and the Paratethys (the remnant sea to the northeast that was cut off from the rest of the Tethys Sea, today’s Mediterranean, when the Alps were formed), which were then located in subtropical latitudes. The family vanished from these waters during the Early Miocene, about 22 million years ago. “They were probably displaced by true gobies that were more adaptable,” says Reichenbacher.
The researchers expect that their study will lead to a better picture of the evolutionary history of the gobioids as a whole. “Our results also demonstrate that otoliths can play a much greater role in the classification of gobioids than has previously been appreciated,” Bettina Reichenbacher concludes.
Note : The above story is reprinted from materials provided by Ludwig-Maximilians-Universitaet Muenchen (LMU).