A small, bird-like North American dinosaur incubated its eggs in a similar way to brooding birds — bolstering the evolutionary link between birds and dinosaurs, researchers at the University of Calgary and Montana State University study have found.
Among the many mysteries paleontologists have tried to uncover is how dinosaurs hatched their young. Was it in eggs completely buried in nest materials, like crocodiles? Or was it in eggs in open or non-covered nests, like brooding birds?
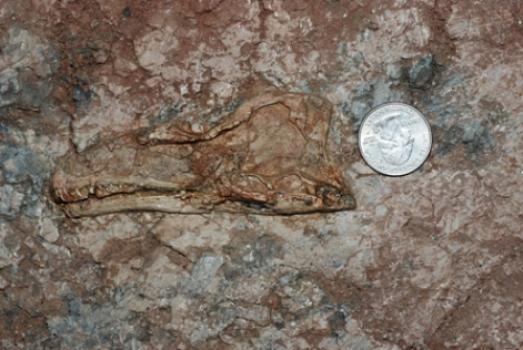
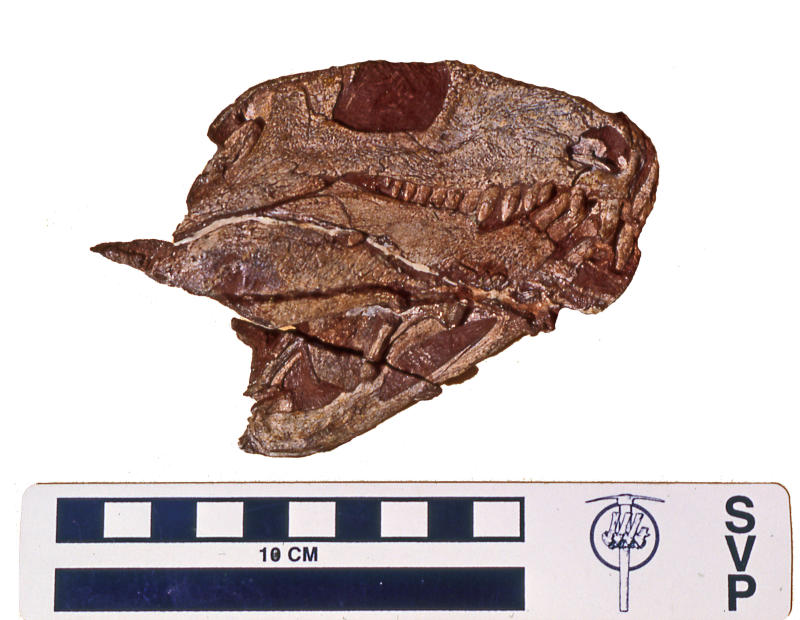
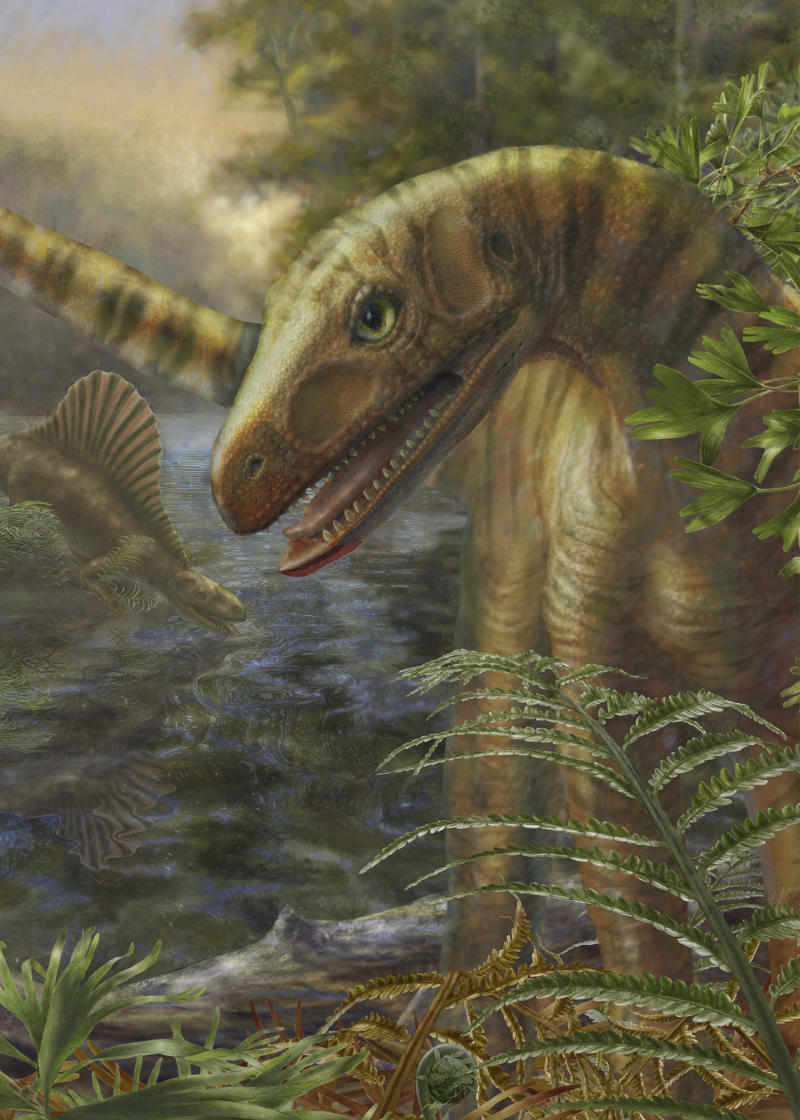
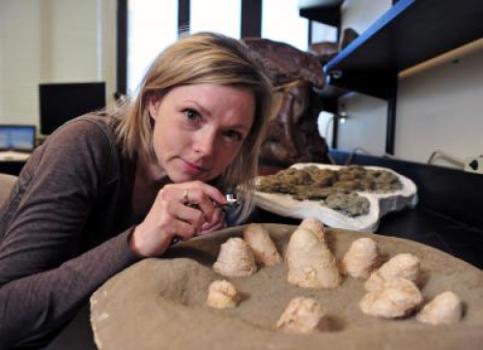
Using egg clutches found in Alberta and Montana, researchers Darla Zelenitsky at the University of Calgary and David Varricchio at Montana State University closely examined the shells of fossil eggs from a small meat-eating dinosaur called Troodon.
In a finding published in the spring issue of Paleobiology, they concluded that this specific dinosaur species, which was known to lay its eggs almost vertically, would have only buried the egg bottoms in mud.
“Based on our calculations, the eggshells of Troodon were very similar to those of brooding birds, which tells us that this dinosaur did not completely bury its eggs in nesting materials like crocodiles do,” says study co-author Zelenitsky, assistant professor of geoscience
“Both the eggs and the surrounding sediments indicate only partial burial; thus an adult would have directly contacted the exposed parts of the eggs during incubation,” says lead author Varricchio, associate professor of paleontology.
Varricchio says while the nesting style for Troodon is unusual, “there are similarities with a peculiar nester among birds called the Egyptian Plover that broods its eggs while they’re partially buried in sandy substrate of the nest.”
Paleontologists have always struggled to answer the question of how dinosaurs incubated their eggs, because of the scarcity of evidence for incubation behaviours.
As dinosaurs’ closest living relatives, crocodiles and birds offer some insights.
Scientists know that crocodiles and birds that completely bury their eggs for hatching have eggs with many pores or holes in the eggshell, to allow for respiration.
This is unlike brooding birds which don’t bury their eggs; consequently, their eggs have far fewer pores.
The researchers counted and measured the pores in the shells of Troodon eggs to assess how water vapour would have been conducted through the shell compared with eggs from contemporary crocodiles, mound-nesting birds and brooding birds.
They are optimistic their methods can be applied to other dinosaur species’ fossil eggs to show how they may have been incubated.
“For now, this particular study helps substantiate that some bird-like nesting behaviors evolved in meat-eating dinosaurs prior to the origin of birds. It also adds to the growing body of evidence that shows a close evolutionary relationship between birds and dinosaurs,” Zelenitsky says.
Note : The above story is reprinted from materials provided by University of Calgary, via EurekAlert!, a service of AAAS.