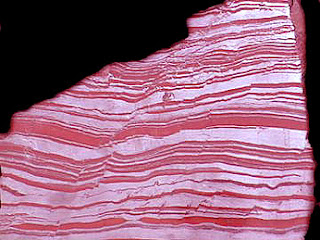
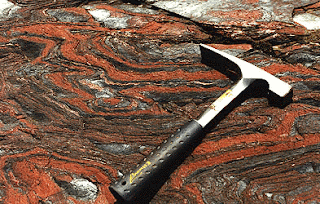
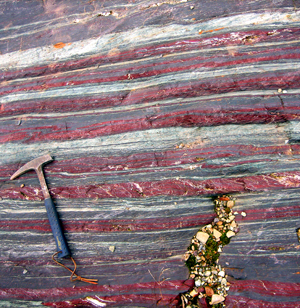
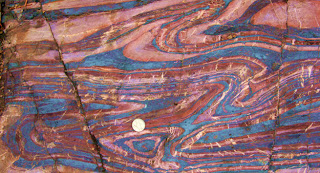
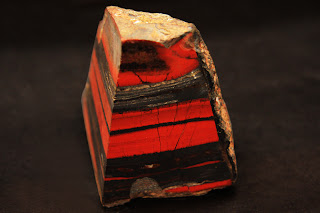
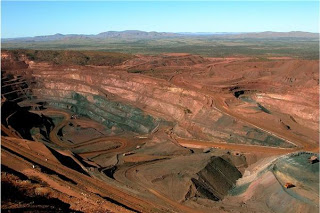
back to top
27.8 C
New York
Sunday, May 11, 2025
Home Blog Page 331

Evidence for a Geologic Trigger of the Cambrian Explosion

Cambrian trilobite, with a shell made of calcium carbonate. (Credit: Shanan Peters)
The oceans teemed with life 600 million years ago, but the simple, soft-bodied creatures would have been hardly recognizable as the ancestors of nearly all animals on Earth today.
Then something happened. Over several tens of millions of years — a relative blink of an eye in geologic terms — a burst of evolution led to a flurry of diversification and increasing complexity, including the expansion of multicellular organisms and the appearance of the first shells and skeletons.
The results of this Cambrian explosion are well documented in the fossil record, but its cause — why and when it happened, and perhaps why nothing similar has happened since — has been a mystery.
New research shows that the answer may lie in a second geological curiosity — a dramatic boundary, known as the Great Unconformity, between ancient igneous and metamorphic rocks and younger sediments.
“The Great Unconformity is a very prominent geomorphic surface and there’s nothing else like it in the entire rock record,” says Shanan Peters, a geoscience professor at the University of Wisconsin-Madison who led the new work. Occurring worldwide, the Great Unconformity juxtaposes old rocks, formed billions of years ago deep within Earth’s crust, with relatively young Cambrian sedimentary rock formed from deposits left by shallow ancient seas that covered the continents just a half billion years ago.
Named in 1869 by explorer and geologist John Wesley Powell during the first documented trip through the Grand Canyon, the Great Unconformity has posed a longstanding puzzle and has been viewed — by Charles Darwin, among others — as a huge gap in the rock record and in our understanding of Earth’s history.
But Peters says the gap itself — the missing time in the geologic record — may hold the key to understanding what happened.
In the April 19 issue of the journal Nature, he and colleague Robert Gaines of Pomona College report that the same geological forces that formed the Great Unconformity may have also provided the impetus for the burst of biodiversity during the early Cambrian.
“The magnitude of the unconformity is without rival in the rock record,” Gaines says. “When we pieced that together, we realized that its formation must have had profound implications for ocean chemistry at the time when complex life was just proliferating.”
“We’re proposing a triggering mechanism for the Cambrian explosion,” says Peters. “Our hypothesis is that biomineralization evolved as a biogeochemical response to an increased influx of continental weathering products during the last stages in the formation of the Great Unconformity.”
Peters and Gaines looked at data from more than 20,000 rock samples from across North America and found multiple clues, such as unusual mineral deposits with distinct geochemistry, that point to a link between the physical, chemical, and biological effects.
During the early Cambrian, shallow seas repeatedly advanced and retreated across the North American continent, gradually eroding away surface rock to uncover fresh basement rock from within the crust. Exposed to the surface environment for the first time, those crustal rocks reacted with air and water in a chemical weathering process that released ions such as calcium, iron, potassium, and silica into the oceans, changing the seawater chemistry.
The basement rocks were later covered with sedimentary deposits from those Cambrian seas, creating the boundary now recognized as the Great Unconformity.
Evidence of changes in the seawater chemistry is captured in the rock record by high rates of carbonate mineral formation early in the Cambrian, as well as the occurrence of extensive beds of glauconite, a potassium-, silica-, and iron-rich mineral that is much rarer today.
The influx of ions to the oceans also likely posed a challenge to the organisms living there. “Your body has to keep a balance of these ions in order to function properly,” Peters explains. “If you have too much of one you have to get rid of it, and one way to get rid of it is to make a mineral.”
The fossil record shows that the three major biominerals — calcium phosphate, now found in bones and teeth; calcium carbonate, in invertebrate shells; and silicon dioxide, in radiolarians — appeared more or less simultaneously around this time and in a diverse array of distantly related organisms.
The time lag between the first appearance of animals and their subsequent acquisition of biominerals in the Cambrian is notable, Peters says. “It’s likely biomineralization didn’t evolve for something, it evolved in response to something — in this case, changing seawater chemistry during the formation of the Great Unconformity. Then once that happened, evolution took it in another direction.” Today those biominerals play essential roles as varied as protection (shells and spines), stability (bones), and predation (teeth and claws).
Together, the results suggest that the formation of the Great Unconformity may have triggered the Cambrian explosion.
“This feature explains a lot of lingering questions in different arenas, including the odd occurrences of many types of sedimentary rocks and a very remarkable style of fossil preservation. And we can’t help but think this was very influential for early developing life at the time,” Gaines says.
Far from being a lack of information, as Darwin thought, the gaps in the rock record may actually record the mechanism as to why the Cambrian explosion occurred in the first place, Peters says.
“The French composer Claude Debussy said, ‘Music is the space between the notes.’ I think that is the case here,” he says. “The gaps can have more information, in some ways, about the processes driving Earth system change, than the rocks do. It’s both together that give the whole picture.”
The work was supported by the National Science Foundation.
Note : The above story is reprinted from materials provided by University of Wisconsin-Madison, via Newswise. The original article was written by Jill Sakai. 

Ice sheet collapse and sea-level rise at the Boelling warming 14,600 years ago

International scientists have shown that a dramatic sea-level rise occurred at the onset of the first warm period of the last deglaciation, known as the Bølling warming, approximately 14,600 years ago. This event, referred to as Melt-Water Pulse 1A (MWP-1A), corresponds to a rapid collapse of massive ice sheets 14,600 years ago and resulted in global sea-level rise of ~14 m. These findings are published in the 29 March 2012 issue of the journal Nature (Volume 483, Issue 7391).

Collaboration between CEREGE (UMR Aix-Marseille Univ. – CNRS – IRD – College de France) and the Universities of Oxford and Tokyo, allowed an international science team to publish on research stemming from the Tahiti Sea-Level Expedition 310 of the Integrated Ocean Drilling Program (IODP). The Tahiti Sea-Level Expedition was carried out in 2005 by the European Consortium for Ocean Research Drilling (ECORD) and the ECORD Science Operator (ESO) on behalf of IODP.
Using U-Th dating of coral samples obtained from cores drilled in the Tahiti coral reefs, the researchers were able to reconstruct sea-level rise over the last deglaciation. Coral is extremely sensitive to sea-level changes and fossilized corals are therefore an excellent indicator for sea-level changes over time.
“Corals are outstanding archives to reconstruct past sea-level changes as they can be dated to within plus or minus 30 years stretching back thousands of years. Moreover, Tahitian reefs are ideally located to reconstruct the deglacial sea-level rise and to constrain short-term events that are thought to have punctuated the period between the Last Glacial Maximum and the present days. Tahiti is located at a sufficiently considerable distance from the major former ice sheets to give us close to the average of sea levels across the globe, as a non-volcanic island it is also subsiding into the ocean at a steady pace that we can easily adjust for.” Pierre Deschamps, first author based at CEREGE said.
The Nature article presents the view that most of the melting water that contributed to MWP-1A was sourced from the Antarctic ice sheet, highlighting dynamical behavior of this ice sheet in the past. The authors note that further research is needed using cored fossilized corals to better understand the sequence of events related to ice sheet collapse during the last deglaciation.
Today, half of world’s population, approximately 3.2 billion people, lives within 200 km of coastline, and a tenth of the population lives less than 10 meters above sea level. Tahiti itself is, of course, at risk from modern sea-level rise. The government of Tahiti cooperated on the IODP Expedition 310 by providing the necessary regulatory clearances to drill on the fossilized coral reefs.
Pierre Deschamps says “Insights into past sea-level changes may help to better constrain future changes. Our work sheds light onto an extreme event of rise in global sea levels in which ice-sheet collapse coincided with a rapid warming. Whether the freshwater pulse was a result of an already warming word or helped to warm the climate is currently unclear. However, our finding will help scientists currently modelling future climate change scenarios to factor in the dynamic behaviour of major ice sheets and finally to provide more reliable predictions of ice sheet responses to a warming climate”.
Much is yet unknown about the dynamics of sea-level change, in response to massive water discharge. However, IODP Expedition 310 has helped international scientists shed light on one of the most important climate event of the last deglaciation, the MWP-1A event, based on fossil corals obtained from off the coast of Tahiti.
Note: This story has been adapted from a news release issued by the Integrated Ocean Drilling Program Management International

Copper Chains: Earth’s Deep-Seated Hold On Copper Revealed

This garnet pyroxenite xenolith from Sierra Nevada, Calif., is an example of the deepest products of crystallization within the magmatic belts of subduction zones. Rice University’s Cin-Ty Lee and colleagues showed that most of the copper in arc magmas eventually end up in these deep-seated rocks. (Credit: Image courtesy of Rice University)
Earth is clingy when it comes to copper. A new Rice University study recently published in the journal Science finds that nature conspires at scales both large and small — from the realms of tectonic plates down to molecular bonds — to keep most of Earth’s copper buried dozens of miles below ground.
“Everything throughout history shows us that Earth does not want to give up its copper to the continental crust,” said Rice geochemist Cin-Ty Lee, the lead author of the study. “Both the building blocks for continents and the continental crust itself, dating back as much as 3 billion years, are highly depleted in copper.”
Finding copper is more than an academic exercise. With global demand for electronics growing rapidly, some studies have estimated the world’s demand for copper could exceed supply in as little as six years. The new study could help, because it suggests where undiscovered caches of copper might lie.
But the copper clues were just a happy accident.
“We didn’t go into this looking for copper,” Lee said. “We were originally interested in how continents form and more specifically in the oxidation state of volcanoes.”
Earth scientists have long debated whether an oxygen-rich atmosphere might be required for continent formation. The idea stems from the fact that Earth may not have had many continents for at least the first billion years of its existence and that Earth’s continents may have begun forming around the time that oxygen became a significant component of the atmosphere.
In their search for answers, Lee and colleagues set out to examine Earth’s arc magmas — the molten building blocks for continents. Arc magmas get their start deep in the planet in areas called subduction zones, where one of Earth’s tectonic plates slides beneath another. When plates subduct, two things happen. First, they bring oxidized crust and sediments from Earth’s surface into the mantle. Second, the subducting plate drives a return flow of hot mantle upwards from Earth’s deep interior. During this return flow, the hot mantle not only melts itself but may also cause melting of the recycled sediments. Arc magmas are thought to form under these conditions, so if oxygen were required for continental crust formation, it would mostly likely come from these recycled segments.
“If oxidized materials are necessary for generating such melts, we should see evidence of it all the way from where the arc magmas form to the point where the new continent-building material is released from arc volcanoes,” Lee said.
Lee and colleagues examined xenoliths, rocks that formed deep inside Earth and were carried up to the surface in volcanic eruptions. Specifically, they studied garnet pyroxenite xenoliths thought to represent the first crystallized products of arc magmas from the deep roots of an arc some 50 kilometers below Earth’s surface. Rather than finding evidence of oxidation, they found sulfides — minerals that contain reduced forms of sulfur bonded to metals like copper, nickel and iron. If conditions were highly oxidizing, Lee said, these sulfide minerals would be destabilized and allow these elements, particularly copper, to bond with oxygen.
Because sulfides are also heavy and dense, they tend to sink and get left behind in the deep parts of arc systems, like a blob of dense material that stays at the bottom of a lava lamp while less dense material rises to the top.
“This explains why copper deposits, in general, are so rare,” Lee said. “The Earth wants to hold it deep and not give it up.”
Lee said deciding where to look for undiscovered copper deposits requires an understanding of the conditions needed to overcome the forces that conspire to keep it deep inside the planet.
“As a continental arc matures, the copper-rich sulfides are trapped deep and accumulate,” he said. “But if the continental arc grows thicker over time, the accumulated copper-bearing sulfides are driven to deeper depths where the higher temperatures can re-melt these copper-rich dregs, releasing them to rejoin arc magmas.”
These conditions were met in the Andes Mountains and in western North America. He said other potential sources of undiscovered copper include Siberia, northern China, Mongolia and parts of Australia.
Lee noted that a high school intern played a role in the research paper. Daphne Jin, now a freshman at the University of Chicago, made her contribution to the research as a high school intern from Clements High School in the Houston suburb of Sugarland.
“The paper really wouldn’t have been as broad without Daphne’s contribution,” Lee said. “I originally struggled with an assignment for her because I didn’t and still don’t have large projects where a student can just fit in. I try to make sure every student has a chance to do something new, but often I just run out of ideas.”
Lee eventually asked Jin to compile information from published studies about the average concentration of all the first-row of transition elements in the periodic table in various samples of continental crust and mantle collected the world over.
“She came back and showed me the results, and we could see that the average continental crust itself, which has been built over 3 billion years of Earth’s history in Africa, Siberia, North America, South America, etc., was all depleted in copper,” Lee said. “Up to that point we’d been looking at the building blocks of continents, but this showed us that the continents themselves followed the same pattern. It was all internally consistent.”
In addition to Jin, Lee’s co-authors on the report include Rajdeep Dasgupta, assistant professor of Earth science at Rice; Rice postdoctoral researchers Peter Luffi and Veronique Roux; Rice graduate student Emily Chin; visiting graduate student Romain Bouchet of the École Normale Supérieure in Lyon, France; Douglas Morton, professor of geology at the University of California, Riverside; and Qing-zhu Yin, professor of geology at the University of California, Davis.
The research was funded by the National Science Foundation.
Note : The above story is reprinted from materials provided by Rice University. 

Volcanic ‘Plumbing Systems’ Exposed

Erta Ale lava lake at the Afar rift. (Credit: James Hammond)
Two new studies into the “plumbing systems” that lie under volcanoes could bring scientists closer to predicting large eruptions.
International teams of researchers, led by the University of Leeds, studied the location and behaviour of magma chambers on Earth’s mid-ocean ridge system — a vast chain of volcanoes along which Earth forms new crust.
They worked in Afar (Ethiopia) and Iceland — the only places where mid-ocean ridges appear above sea level. Volcanic ridges (or “spreading centres”) occur when tectonic plates “rift” or pull apart. Magma (hot molten rock) injects itself into weaknesses in the brittle upper crust, erupting as lava and forming new crust upon cooling.
Magma chambers work like plumbing systems, channelling pressurised magma through networks of underground “pipes.”
The studies, published in Nature Geoscience, reveal new information about where magma is stored and how it moves through the geological plumbing network. Finding out where magma chambers lie and how they behave can help identify early warning signs of impending eruptions.
Scientists used images taken by the European Space Agency satellite Envisat to measure how the ground moved before, during and after eruptions. Using this data, they built and tested computer models to find out how rifting occurs.
Data in one study showed magma chambers that fed an eruption in November 2008 in the Afar rift of Northern Ethiopia were only about 1 km below the ground. The standard model had predicted a depth of more than 3 km.
It is highly unusual for magma chambers to lie in shallow depths on slow spreading centres such as the Afar rift, where tectonic plates pull apart at about the same speed as human fingernails grow.
Dr Carolina Pagli from the University of Leeds’ School of Earth and Environment, who led the study, says: “It was a complete surprise to see that a magma chamber could exist so close to the Earth’s surface in an area where the tectonic plates move apart so slowly. The results have changed the way we think about volcanoes.”
Dr Pagli also noticed that the ground started “uplifting” (elevating) four months before the eruption, due to new magma increasing pressure in one of the underground chambers. Understanding these precursory signals is fundamental to predicting eruptions.
A wider study of eruptions in Afar and Iceland, two vastly different environments, found remarkable similarities. Many events occurred within a short space of time. Researchers identified multiple magma chambers positioned horizontally and vertically, allowing magma to shoot in several directions. Moving magma triggered earthquakes, and separate magma chambers fed single eruptions.
The 2008 eruption is part of an unusual period of recent volcanic unrest in Ethiopia, and is enabling scientists to learn more about volcanoes at spreading centres. Most spreading centres are under 2 km of water at the bottom of the ocean, making detailed observations extremely challenging. The new knowledge derived from Ethiopian volcanoes will help scientists understand volcanoes in Iceland, where eruptions can have a bigger impact on the UK.
Dr Tim Wright from the School of Earth and Environment, who leads the international Afar Rift Consortium, said: “The dramatic events we have been witnessing in Afar in the past six years are transforming our understanding of how the crust grows when tectonic plates pull apart. Our work in one of the hottest place on Earth is having a direct impact on our understanding of eruptions from the frozen volcanoes of Iceland.”
Note : The above story is reprinted from materials provided by University of Leeds. 

Expedition to Undersea Mountain Yields New Information About Sub-Seafloor Structure

Atlantis Massif, showing the fault that borders this Atlantic Ocean seamount. (Credit: NOAA)
Scientists recently concluded an expedition aboard the research vessel JOIDES Resolution to learn more about Atlantis Massif, an undersea mountain, or seamount, that formed in a very different way than the majority of the seafloor in the oceans.
Unlike volcanic seamounts, which are made of the basalt that’s typical of most of the seafloor, Atlantis Massif includes rock types that are usually only found much deeper in the ocean crust, such as gabbro and peridotite.
The expedition, known as Integrated Ocean Drilling Program (IODP) Expedition 340T, marks the first time the geophysical properties of gabbroic rocks have successfully been measured directly in place, rather than via remote techniques such as seismic surveying.
With these measurements in hand, scientists can now infer how these hard-to-reach rocks will “look” on future seismic surveys, making it easier to map out geophysical structures beneath the seafloor.
“This is exciting because it means that we may be able to use seismic survey data to infer the pattern of seawater circulation within the deeper crust,” says Donna Blackman of the Scripps Institution of Oceanography in La Jolla, Calif., co-chief scientist for Expedition 340T.
“This would be a key step for quantifying rates and volumes of chemical, possibly biological, exchange between the oceans and the crust.”
Atlantis Massif sits on the flank of an oceanic spreading center that runs down the middle of the Atlantic Ocean.
As the tectonic plates separate, new crust is formed at the spreading center and a combination of stretching, faulting and the intrusion of magma from below shape the new seafloor.
Periods of reduced magma supplied from the underlying mantle result in the development of long-lived, large faults. Deep portions of the crust shift upward along these faults and may be exposed at the seafloor.
This process results in the formation of an oceanic core complex, or OCC, and is similar to the processes that formed the Basin and Range province of the Southwest United States.
“Recent discoveries from scientific ocean drilling have underlined that the process of creating new oceanic crust at seafloor spreading centers is complex,” says Jamie Allan, IODP program director at the U.S. National Science Foundation (NSF), which co-funds the program.
“This work significantly adds to our ability to infer ocean crust structure and composition, including predicting how ocean crust has ‘aged’ in an area,” says Allan, “thereby giving us new tools for understanding ocean crust creation from Earth’s mantle.”
Atlantis Massif is a classic example of an oceanic core complex.
Because it’s relatively young–formed within the last million years–it’s an ideal place, scientists say, to study how the interplay between faulting, magmatism and seawater circulation influences the evolution of an OCC within the crust.
“Vast ocean basins cover most of the Earth, yet their crust is formed in a narrow zone,” says Blackman. “We’re studying that source zone to understand how rifting and magmatism work together to form a new plate.”
The JOIDES Resolution first visited Atlantis Massif about seven years ago; the science team on that expedition measured properties in gabbro.
But they focused on a shallower section, where pervasive seawater circulation had weathered the rock and changed its physical properties.
For the current expedition, the team did not drill new holes.
Rather, they lowered instruments into a deep existing hole drilled on a previous expedition, and made measurements from inside the hole.
The new measurements, at depths between 800 and 1,400 meters (about 2,600-4,600 feet) below the seafloor, include only a few narrow zones that had been altered by seawater circulation and/or by fault slip deformation.
The rest of the measurements focused on gabbroic rocks that have remained unaltered thus far.
The properties measured in the narrow zones of altered rock differ from the background properties measured in the unaltered gabbroic rocks.
The team found small differences in temperature next to two sub-seafloor faults, which suggests a slow percolation of seawater within those zones.
There were also significant differences in the speed at which seismic waves travel through the altered vs. unaltered zones.
“The expedition was a great opportunity to ground-truth our recent seismic analysis,” says Alistair Harding, also from the Scripps Institution of Oceanography and a co-chief scientist for Expedition 340T.
“It also provides vital baseline data for further seismic work aimed at understanding the formation and alteration of the massif.”
Note : The above story is reprinted from materials provided by National Science Foundation. 

Global Sea Level Likely to Rise as Much as 70 Feet for Future Generations

From The National Oceanography Centre, Southampton (UK).

Even if humankind manages to limit global warming to 2 degrees C (3.6 degrees F), as the Intergovernmental Panel on Climate Change recommends, future generations will have to deal with sea levels 12 to 22 meters (40 to 70 feet) higher than at present, according to research published in the journal Geology.

The researchers, led by Kenneth G. Miller, professor of earth and planetary sciences in the School of Arts and Sciences at Rutgers University, reached their conclusion by studying rock and soil cores in Virginia, Eniwetok Atoll in the Pacific and New Zealand. They looked at the late Pliocene epoch, 2.7 million to 3.2 million years ago, the last time the carbon dioxide level in the atmosphere was at its current level, and atmospheric temperatures were 2 degrees C higher than they are now.
“The difference in water volume released is the equivalent of melting the entire Greenland and West Antarctic Ice Sheets, as well as some of the marine margin of the East Antarctic Ice Sheet,” said H. Richard Lane, program director of the National Science Foundation’s Division of Earth Sciences, which funded the work. “Such a rise of the modern oceans would swamp the world’s coasts and affect as much as 70 percent of the world’s population.”
“You don’t need to sell your beach real estate yet, because melting of these large ice sheets will take from centuries to a few thousand years,” Miller said. “The current trajectory for the 21st century global rise of sea level is 2 to 3 feet (0.8 to1 meter) due to warming of the oceans, partial melting of mountain glaciers, and partial melting of Greenland and Antarctica.”
Miller said, however, that this research highlights the sensitivity of Earth’s great ice sheets to temperature change, suggesting that even a modest rise in temperature results in a large sea-level rise. “The natural state of the Earth with present carbon dioxide levels is one with sea levels about 20 meters higher than at present,” he said.
Miller was joined in the research by Rutgers colleagues James G. Wright, associate professor of earth and planetary sciences; James V. Browning, assistant research professor of earth and planetary sciences; Yair Rosenthal, professor of marine science in the School of Environmental and Biological Sciences; Sindia Sosdian, research scientist in marine science and a postdoctoral scholar at Cardiff University in Wales; and Andrew Kulpecz, a Rutgers doctoral student when the work was done, now with Chevron Corp. Other co-authors were Michelle Kominz, professor of geophysics and basin dynamics at Western Michigan University; Tim R. Naish, director of the Antarctic Research Center at Victoria University of Wellington, in New Zealand; Benjamin S. Cramer of Theiss Research in Eugene, Ore.; and W. Richard Peltier, professor of physics and director of the Center for Global Change Science at the University of Toronto.
Note : The above story is reprinted from materials provided by Rutgers University.

New Theory On Formation of Oldest Continents

Geologists from the Universities of Bonn and Cologne have demonstrated new scientific results in the April issue of the journal Geology, which provide a new theory on the earliest phase of continental formation.
Earth’s structure can be compared to an orange: its crust is the peel supported by Earth’s heavy mantle. That peel is made up of a continental crust 30 to 40 kilometers thick. It is much lighter than the thinner oceanic crust and protrudes from Earth’s mantle because of its lower density, like an iceberg in the sea. “According to the current theory, the first continental crusts were formed when tectonic plates would collide, submerging oceanic crusts into Earth’s mantle, where they would partially melt at a depth of approximately 100 kilometers. That molten rock then ascended to Earth’s surface and formed the first continents,” says adjunct professor Dr. Thorsten Nagel of the Steinmann Institute of Geosciences at the University of Bonn, lead author of the study. The theory has been supported by the oldest known continental rocks — approximately 3.8 billion years old — found in western Greenland.
The results presented by Nagel and colleagues challenge the traditional view of continental crust formation via melting of normal oceanic crust in a down-going slab and support scenarios of melting within tectonically thickened, hot crust.

Following trace elements:

The composition of the continental crust corresponds to a semiliquid version of the oceanic crust melted by 10 to 30 percent of its original state. Unfortunately, the concentrations of the main chemical components in the re-solidified rock do not provide much information about what depth the fusion occurred at. “In order to find that out, you have to know what minerals the remaining 70 to 90 percent of the oceanic crust consisted of,” explains Prof. Dr. Carsten Münker of the Institute of Geology and Mineralogy at the University of Cologne. Researchers from Bonn and Cologne have now analyzed the Greenlandic rocks for different elements occurring at various high concentrations, also know as trace elements. “Trace elements provide geologists with a window to the origin of continental crust,” says Prof. Münker. “With their help, we can identify minerals in the residual rock that were deposited in the depths by the molten rock.”
Before the magma separated from the bedrock, the semifluid rock and the leftover solid minerals actively exchanged trace elements. “Different minerals have characteristic ways of separating when trace elements are smelted. In other words, the concentration of trace elements in the molten rock provide a fingerprint of the residual bedrock,” explains Dr. Elis Hoffmann from Bonn, coauthor of the study. The concentration of trace elements in the oldest continental rock allows geoscientists to reconstruct possible bedrock based on their minerals and thus determine at what depth the continental crust originated.

The oceanic crust did not have to descend:

Using computers, the scientists simulated the composition of bedrock and molten rock that would emerge from partially melting the oceanic crust at various depths and temperatures. They then compared the data calculated for the molten rock with the actual concentration of trace elements in the oldest continental rocks. “Our results paint a surprising picture,” Dr. Nagel reports. “The oceanic crust did not have to descend to a depth of 100 kilometers to create the molten rock that makes up the rocks of the first continents.” According to the calculations, a depth of 30 to 40 kilometers is much more probable.
The primeval oceanic crust could have ‘oozed’ continents…it could definitely have had the power to do so in the Archean eon. Four billion years ago, the gradually cooling earth was still significantly warmer than it is today. The oceanic crust could have simply ‘oozed’ continents at the same time that other geological processes were occurring, like volcanism, orogeny, and the influx of water. “We think it is unlikely that the contents were formed into subduction zones. Whether or not tectonic plates of the primordial earth had such zones of subsidence is still a matter of debate,” says the geologist from Bonn.
Note : The above story is reprinted from materials provided by University of Bonn, via AlphaGalileo.

Flying Through a Geomagnetic Storm

Auroras are beautiful light shows caused by solar activity. Sky watchers say it’s the greatest show on Earth but it is also the greatest show in Earth orbit. (Credit: Science@NASA)
Glowing green and red, shimmering hypnotically across the night sky, the aurora borealis is a wonder to behold. Longtime sky watchers say it is the greatest show on Earth.
It might be the greatest show in Earth orbit, too. High above our planet, astronauts onboard the International Space Station (ISS) have been enjoying an up-close view of auroras outside their windows as the ISS flys through geomagnetic storms.
“We can actually fly into the auroras,” says eye-witness Don Pettit, a Flight Engineer for ISS Expedition 30. “It’s like being shrunk down and put inside of a neon sign.”
Auroras are caused by solar activity. Gusts of solar wind and coronal mass ejections strike Earth’s magnetic field, rattling our planet’s protective shell of magnetism. This causes charged particles to rain down over the poles, lighting up the atmosphere where they hit. The physics is akin to what happens in the picture tube of a color TV.
Incoming particles are guided by Earth’s magnetic field to a pair of doughnut-shaped regions called “auroral ovals.” There’s one around the North Pole and one around the South. Sometimes, when solar activity is high, the ovals expand, and the space station orbits right through them.
That’s exactly what happened in late January 2012, when a sequence of M-class and X-class solar flares sparked a light show that Pettit says he won’t soon forget. “The auroras could be seen [as brightly as] city lights on the Earth below — and even in the day-night terminator of the rising and setting sun. It was simply amazing.”
Pettit is a skilled astrophotographer. He and other members of the crew video-recorded the displays, producing footage that officials say is some of the best-ever taken from Earth orbit.
The videos capture the full range of aurora colors — red, green, and many shades of purple. These hues correspond to different quantum transitions in excited atoms of oxygen and nitrogen. The precise color at any altitude depends on the temperature and density of the local atmosphere.
“Red auroras reach all the way up to our altitude 400 km above Earth,” says Pettit. “Sometimes you feel like you can reach out and touch them.”
“Green emissions, on the other hand, tend to stay below the space station,” he says. They move like a living ‘shag carpet’ of lights. “We fly right over them.”
Surprisingly, Pettit does not find this unsettling. “It is not disorienting to see auroras underfoot,” he says. “Perhaps it is because I have been up here so long.”
What he does find disorienting is the meteors.
“Occasionally we see a meteor burning up in the atmosphere below — and this does look strange. You should be looking up for meteors not down.”
As marvelous as these sights are, Petit has seen better. He was the science officer for ISS expedition 6 back in 2003 when the auroras were even stronger than they were now.
“But this expedition is not over yet,” he points out hopefully.
Indeed, more auroras are in the offing. Following some recent years of deep quiet, the sun is waking up again. Solar activity is now trending upward with a maximum expected in early 2013.
This means the greatest show on Earth — and in Earth orbit — is about to get even better.
Note : The above story is reprinted from materials provided by NASA. The original article was written by Dr. Tony Phillips, Science@NASA. 

Mapping the Moho With GOCE

This map shows the global Mohorovičić discontinuity – known as Moho – based on data from the GOCE satellite. Moho is the boundary between the crust and the mantle, ranging from about 70 km in depth in mountainous areas, like the Himalayas, to 10 km beneath the ocean floor. (Credit: GEMMA project)
The first global high-resolution map of the boundary between Earth’s crust and mantle — the Moho — has been produced based on data from ESA’s GOCE gravity satellite. Understanding the Moho will offer new clues into the dynamics of Earth’s interior.
Earth’s crust is the outermost solid shell of our planet. Even though it makes up less than 1% of the volume of the planet, the crust is exceptionally important not just because we live on it, but because is the place where all our geological resources like natural gas, oil and minerals come from.
The crust and upper mantle is also the place where most geological processes of great importance occur, such as earthquakes, volcanism and orogeny.
Until just a century ago, we didn’t know Earth has a crust. In 1909, Croatian seismologist Andrija Mohorovičić found that at about 50 km underground there is a sudden change in seismic speed.
Ever since, that boundary between Earth’s crust and underlying mantle has been known as the Mohorovičić discontinuity, or Moho.
Even today, almost all we know about Earth’s deep layers comes from two methods: seismic and gravimetric.
Seismic methods are based on observing changes in the propagation velocity of seismic waves between the crust and mantle.
Gravimetry looks at the gravitational effect due to the density difference caused by the changing composition of crust and mantle.
But the Moho models based on seismic or gravity data are usually limited by poor data coverage or data being only available along single profiles.
The GOCE Exploitation for Moho Modelling and Applications project — or GEMMA — has now generated the first global high-resolution map of the boundary between Earth’s crust and mantle based on data from the GOCE satellite.
GOCE measures the gravity field and models the geoid with unprecedented accuracy to advance our knowledge of ocean circulation, which plays a crucial role in energy exchanges around the globe, sea-level change and Earth interior processes.
GEMMA’s Moho map is based on the inversion of homogenous well-distributed gravimetric data.
For the first time, it is possible to estimate the Moho depth worldwide with unprecedented resolution, as well as in areas where ground data are not available. This will offer new clues for understanding the dynamics of Earth’s interior, unmasking the gravitational signal produced by unknown and irregular subsurface density distribution.
GEMMA is being carried out by Italian scientist Daniele Sampietro, and is funded by the Politecnico di Milano and ESA’s Support To Science Element under the Changing Earth Science Network initiative.
This initiative supports young scientists at post-doctoral level in ESA Member States to advance our knowledge in Earth system science by exploiting the observational capacity of ESA missions.
Note : The above story is reprinted from materials provided by European Space Agency (ESA), via AlphaGalileo. 

Internal Structure of the Moon

An artist’s rendering of the lunar core as identified in new findings by a NASA-led research team. (NASA/MSFC/Renee Weber)

Apollo Data Revealed Moon’s Internal Structure:

NASA deployed the frist seismographs on the moon as part of the Apollo Mission in 1969. These seismographs collected data and enabled researchers to determine that the moon’s structure consisted of a thin crust of about 65 kilometers, a mantle about 100 kilometers thick and a core with a radius of about 500 kilometers. At that time seismic data processing was not advanced enough to determine the characteristics of the core.

NASA researchers have recently applied state-of-the-art seismological techniques applied to the Apollo-era data and discovered that the moon probably has a core that is very similar to Earth’s.

Moon’s Formation and Magnetic Field :

Uncovering details about the lunar core is critical for developing accurate models of the moon’s formation. The data sheds light on the evolution of a lunar dynamo — a natural process by which our moon may have generated and maintained its own strong magnetic field.

The team’s findings suggest the moon possesses a solid, iron-rich inner core with a radius of nearly 150 miles and a fluid, primarily liquid-iron outer core with a radius of roughly 205 miles. Where it differs from Earth is a partially molten boundary layer around the core estimated to have a radius of nearly 300 miles. The research indicates the core contains a small percentage of light elements such as sulfur, echoing new seismology research on Earth that suggests the presence of light elements — such as sulfur and oxygen — in a layer around our own core.

Data from Apollo-Era Seismometers :

The researchers used extensive data gathered during the Apollo-era moon missions. The Apollo Passive Seismic Experiment consisted of four seismometers deployed between 1969 and 1972, which recorded continuous lunar seismic activity until late-1977.
“We applied tried and true methodologies from terrestrial seismology to this legacy data set to present the first-ever direct detection of the moon’s core,” said Renee Weber, lead researcher and space scientist at NASA’s Marshall Space Flight Center in Huntsville, Ala.
The team also analyzed Apollo lunar seismograms using array processing, techniques that identify and distinguish signal sources of moonquakes and other seismic activity. The researchers identified how and where seismic waves passed through or were reflected by elements of the moon’s interior, signifying the composition and state of layer interfaces at varying depths.

Comparison with Apollo-Era Results :

Although sophisticated satellite imaging missions to the moon made significant contributions to the study of its history and topography, the deep interior of Earth’s sole natural satellite remained a subject of speculation and conjecture since the Apollo era. Researchers previously had inferred the existence of a core, based on indirect estimates of the moon’s interior properties, but many disagreed about its radius, state and composition.
A primary limitation to past lunar seismic studies was the wash of “noise” caused by overlapping signals bouncing repeatedly off structures in the moon’s fractionated crust. To mitigate this challenge, Weber and the team employed an approach called seismogram stacking, or the digital partitioning of signals. Stacking improved the signal-to-noise ratio and enabled the researchers to more clearly track the path and behavior of each unique signal as it passed through the lunar interior.
“We hope to continue working with the Apollo seismic data to further refine our estimates of core properties and characterize lunar signals as clearly as possible to aid in the interpretation of data returned from future missions,” Weber said.

New Data From the GRAIL Mission : Future NASA missions will help gather more detailed data. The Gravity Recovery and Interior Laboratory, or GRAIL, is a NASA Discovery-class mission set to launch this year. The mission consists of twin spacecraft that will enter tandem orbits around the moon for several months to measure the gravity field in unprecedented detail. The mission also will answer longstanding questions about Earth’s moon and provide scientists a better understanding of the satellite from crust to core, revealing subsurface structures and, indirectly, its thermal history.

The Research Team : 

In addition to Weber, the team consisted of scientists from Marshall; Arizona State University; the University of California at Santa Cruz; and the Institut de Physique du Globe de Paris in France. Their findings are published in the online edition of the journal Science.

NASA and other space agencies have been studying concepts to establish an International Lunar Network — a robotic set of geophysical monitoring stations on the moon — as part of efforts to coordinate international missions during the coming decade

Note : Republished from a January, 2011 press release by NASA.

New Research Supports Theory of Extraterrestrial Impact

The ‘tectonic’ effects of the collision of one spherule with another during the cosmic impact. (Credit: Image courtesy of University of California – Santa Barbara)
A 16-member international team of researchers that includes James Kennett, professor of earth science at UC Santa Barbara, has identified a nearly 13,000-year-old layer of thin, dark sediment buried in the floor of Lake Cuitzeo in central Mexico. The sediment layer contains an exotic assemblage of materials, including nanodiamonds, impact spherules, and more, which, according to the researchers, are the result of a cosmic body impacting Earth.
These new data are the latest to strongly support of a controversial hypothesis proposing that a major cosmic impact with Earth occurred 12,900 years ago at the onset of an unusual cold climatic period called the Younger Dryas. The researchers’ findings appear  in the Proceedings of the National Academy of Sciences.
Conducting a wide range of exhaustive tests, the researchers conclusively identified a family of nanodiamonds, including the impact form of nanodiamonds called lonsdaleite, which is unique to cosmic impact. The researchers also found spherules that had collided at high velocities with other spherules during the chaos of impact. Such features, Kennett noted, could not have formed through anthropogenic, volcanic, or other natural terrestrial processes. “These materials form only through cosmic impact,” he said.
The data suggest that a comet or asteroid — likely a large, previously fragmented body, greater than several hundred meters in diameter — entered the atmosphere at a relatively shallow angle. The heat at impact burned biomass, melted surface rocks, and caused major environmental disruption. “These results are consistent with earlier reported discoveries throughout North America of abrupt ecosystem change, megafaunal extinction, and human cultural change and population reduction,” Kennett explained.
The sediment layer identified by the researchers is of the same age as that previously reported at numerous locations throughout North America, Greenland, and Western Europe. The current discovery extends the known range of the nanodiamond-rich layer into Mexico and the tropics. In addition, it is the first reported for true lake deposits.
In the entire geologic record, there are only two known continent-wide layers with abundance peaks in nanodiamonds, impact spherules, and aciniform soot. These are in the 65-million-year-old Cretaceous-Paleogene boundary layer that coincided with major extinctions, including the dinosaurs and ammonites; and the Younger Dryas boundary event at 12,900 years ago, closely associated with the extinctions of many large North American animals, including mammoths, mastodons, saber-tooth cats, and dire wolves.
“The timing of the impact event coincided with the most extraordinary biotic and environmental changes over Mexico and Central America during the last approximately 20,000 years, as recorded by others in several regional lake deposits,” said Kennett. “These changes were large, abrupt, and unprecedented, and had been recorded and identified by earlier investigators as a ‘time of crisis.’ “
Other scientists contributing to the research include Isabel Israde-Alcántara and Gabriela Dominguez-Vásquez of the Universidad Michoacana de San Nicólas de Hidalgo; James L. Bischoff of the U.S. Geological Survey; Hong-Chun Li of National Taiwan University; Paul S. DeCarli of SRI International; Ted E. Bunch and James H. Wittke of Northern Arizona University; James C. Weaver of Harvard University; Richard B.
Firestone of Lawrence Berkeley National Laboratory; Allen West of GeoScience Consulting; Chris Mercer of the National Institute for Materials Science; Sujing Zie and Eric K. Richman of the University of Oregon, Eugene; and Charles R. Kinzie and Wendy S. Wolbach of DePaul University.
Note : The above story is reprinted from materials provided by University of California – Santa Barbara.  

Contamination of La Selva geothermal system in Girona, Spain

The system works by refilling meteoric waters that penetrate the earth in high areas, move underground and reach an unknown thermal hot spot, where they heat up and acquire CO2, and probably metals as well. Afterwards the water leaches out (dissolve) the host rocks and flows out from the upwellings. – SINC/A. Navarro et al.
Monitoring the construction of wells, avoid over-exploiting cold groundwater close to hot groundwater, and controlling mineral water extraction. These are the recommendations from the Polytechnic University of Catalonia and the University of Barcelona, after analyzing the contamination of La Selva geothermal system, above all by arsenic pollution. In this region, which is known for its spa resorts and bottling plants, as well as in other Catalan coastal mountain ranges, uranium levels higher than what is recommended by the WHO have been detected.

The groundwater in La Selva (Girona, Spain) area show high levels of arsenic, antimony and other polluting elements. The area’s geothermal system, where hot and cold groundwater flow naturally, are the cause of this situation, according to a study that researchers from the Polytechnic University of Catalonia (UPC) and the University of Barcelona (UB) have published in the journal Geothermics.

“The system works by refilling meteoric waters that penetrate the earth in high areas, move underground and reach an unknown thermal hot spot, where they heat up and acquire CO2, and probably metals as well “Andrés Navarro, a lecturer at UPC and co-author of the project explained to SINC. “Afterwards the water leaches out (dissolve) the host rocks and flows out from the upwellings”.
In this process the waters naturally pick up pollutants. Consequently, the researchers have found high volumes of arsenic, silver, lead, antimony, zinc and other metals in the hydrothermal deposits, especially in the area of Caldes de Malavella (Girona), an area famous for its spa resorts and mineral water bottling companies.
The results show that groundwater in some areas has arsenic levels of up to 0.069 mg/l, when the legal limit in Spain and the rest of the European Union was 0.01 mg/l in water for human consumption.
“Fortunately, a few years ago a legislation for this was created, and since then bottled mineral has been controlled, although before then this did not occur” the researcher says. Furthermore, a plant to remove arsenic from public water supplies has been built in Caldes de Malavella.
In any case, the study recommends controlling the extraction of water for bottling plants, as well as over-exploiting cold groundwater close to hot water springs. This way the mixing of waters is avoided and so are the pollutants.
For the same reason it is not advisable to build wells close to geothermal upwellings, especially illegal ones for private supplies or irrigation. Studying geothermal liquid outlets in areas of diffused discharge, such as some humid areas, is also proposed.
“Making a model for managing the whole aquifer to rationalize water extraction and consumption would be the solution” Navarro says. He also highlights the need to take action regarding the natural water pollutants: uranium.
The analysis in La Selva shows “relatively high” levels (37.7 microg/l) of this element, especially in samples from sources and wells not directly linked to thermal activity.
The mobility of uranium is linked to granite rocks and is frequently found in Catalan coastal mountain ranges, where researchers have carried out specific studies on the topic. The samples have been taken from wells and drilling at a depth of up to 100 metres.
The results published in the journal Tecnología del agua and they show “significant concentrations” of uranium in groundwater used for public supply and bottling. Specifically, in some parts of the Montseny-Guilleries mountain range, these levels are more than 140 microg/l.
There are no legal limits for uranium concentrations in water in the European Union, but the analysis carried out in Catalan coastal mountain ranges shows that these levels far exceed the recommendations of the World Health Organisation (WHO), or for example, the standard established by the Environmental Protection Agency (EPA) in the USA.
Both the EPA and the WHO establish a maximum uranium level of 30 microg/l. The European Food Safety Authority (EFSA) is considering establishing a guideline level for this element, but at the moment the legal loophole remains.
The toxicity of uranium is linked to the solubility of the compound: the more soluble it is, the more toxic it is. The experiments carried out on animals and people show the most affected organ is the kidney, and alterations in reproduction and development are seen when this element exists in high concentrations.
Note: This story has been adapted from a news release issued by the FECYT – Spanish Foundation for Science and Technology

Thickest Parts of Arctic Ice Cap Melting Faster

How perennial sea ice has declined from 1980 to 2012. The bright white central mass shows the perennial sea ice while the larger light blue area shows the full extent of the winter sea ice including the average annual sea ice during the months of November, December and January. (Credit: NASA/Goddard Scientific Visualization Studio)
A new NASA study revealed that the oldest and thickest Arctic sea ice is disappearing at a faster rate than the younger and thinner ice at the edges of the Arctic Ocean’s floating ice cap.
The thicker ice, known as multi-year ice, survives through the cyclical summer melt season, when young ice that has formed over winter just as quickly melts again. The rapid disappearance of older ice makes Arctic sea ice even more vulnerable to further decline in the summer, said Joey Comiso, senior scientist at NASA Goddard Space Flight Center, Greenbelt, Md., and author of the study, which was recently published in Journal of Climate.
The new research takes a closer look at how multi-year ice, ice that has made it through at least two summers, has diminished with each passing winter over the last three decades. Multi-year ice “extent” — which includes all areas of the Arctic Ocean where multi-year ice covers at least 15 percent of the ocean surface — is diminishing at a rate of -15.1 percent per decade, the study found.
There’s another measurement that allows researchers to analyze how the ice cap evolves: multi-year ice “area,” which discards areas of open water among ice floes and focuses exclusively on the regions of the Arctic Ocean that are completely covered by multi-year ice. Sea ice area is always smaller than sea ice extent, and it gives scientists the information needed to estimate the total volume of ice in the Arctic Ocean. Comiso found that multi-year ice area is shrinking even faster than multi-year ice extent, by -17.2 percent per decade.
“The average thickness of the Arctic sea ice cover is declining because it is rapidly losing its thick component, the multi-year ice. At the same time, the surface temperature in the Arctic is going up, which results in a shorter ice-forming season,” Comiso said. “It would take a persistent cold spell for most multi-year sea ice and other ice types to grow thick enough in the winter to survive the summer melt season and reverse the trend.”
Scientists differentiate multi-year ice from both seasonal ice, which comes and goes each year, and “perennial” ice, defined as all ice that has survived at least one summer. In other words: all multi-year ice is perennial ice, but not all perennial ice is multi-year ice (it can also be second-year ice).
Comiso found that perennial ice extent is shrinking at a rate of -12.2 percent per decade, while its area is declining at a rate of -13.5 percent per decade. These numbers indicate that the thickest ice, multiyear-ice, is declining faster than the other perennial ice that surrounds it.
As perennial ice retreated in the last three decades, it opened up new areas of the Arctic Ocean that could then be covered by seasonal ice in the winter. A larger volume of younger ice meant that a larger portion of it made it through the summer and was available to form second-year ice. This is likely the reason why the perennial ice cover, which includes second year ice, is not declining as rapidly as the multiyear ice cover, Comiso said.
Multi-year sea ice hit its record minimum extent in the winter of 2008. That is when it was reduced to about 55 percent of its average extent since the late 1970s, when satellite measurements of the ice cap began. Multi-year sea ice then recovered slightly in the three following years, ultimately reaching an extent 34 percent larger than in 2008, but it dipped again in winter of 2012, to its second lowest extent ever.
For this study, Comiso created a time series of multi-year ice using 32 years of passive microwave data from NASA’s Nimbus-7 satellite and the U.S. Department of Defense’s Defense Meteorological Satellite Program, taken during the winter months from 1978 to 2011. This is the most robust and longest satellite dataset of Arctic sea ice extent data to date, Comiso said.
Younger ice, made from recently frozen ocean waters, is saltier than multi-year ice, which has had more time to drain its salts. The salt content in first- and second-year ice gives them different electrical properties than multi-year ice: In winter, when the surface of the sea ice is cold and dry, the microwave emissivity of multiyear ice is distinctly different from that of first- and second-year ice. Microwave radiometers on satellites pick up these differences in emissivity, which are observed as variations in brightness temperature for the different types of ice. The “brightness” data are used in an algorithm to discriminate multiyear ice from other types of ice.
Comiso compared the evolution of the extent and area of multi-year ice over time, and confirmed that its decline has accelerated during the last decade, in part because of the dramatic decreases of 2008 and 2012. He also detected a periodic nine-year cycle, where sea ice extent would first grow for a few years, and then shrink until the cycle started again. This cycle is reminiscent of one occurring on the opposite pole, known as the Antarctic Circumpolar Wave, which has been related to the El Niño-Southern Oscillation atmospheric pattern. If the nine-year Arctic cycle were to be confirmed, it might explain the slight recovery of the sea ice cover in the three years after it hit its historical minimum in 2008, Comiso said.
Note : The above story is reprinted from materials provided by NASA/Goddard Space Flight Center.  

Albite

Albite , Plagioclase Location: Taquaral, Minas Gerais, Brazil. Scale: 7.4 x 5 cm. Copyright: © John Veevaert

Chemical Formula: NaAlSi3O8
Locality: Finnbo, Falun, Dalarna, Sweden. Bourg d’Oisans and Isere, France.
Name Origin: From the Latin, albus, in allusion to the common color.

Albite is a plagioclase feldspar mineral. It is the sodium endmember of the plagioclase solid solution series. As such it represents a plagioclase with less than 10% anorthite content. The pure albite endmember has the formula NaAlSi3O8. It is a tectosilicate. Its color is usually pure white, hence its name from Latin albus. It is a common constituent in felsic rocks.

Albite crystallizes with triclinic pinacoidal forms. Its specific gravity is about 2.62 and it has a Mohs hardness of 6 – 6.5. Albite almost always exhibits crystal twinning often as minute parallel striations on the crystal face. Albite often occurs as fine parallel segregations alternating with pink microcline in perthite as a result of exolution on cooling.

It occurs in granitic and pegmatite masses, in some hydrothermal vein deposits and forms part of the typical greenschist metamorphic facies for rocks of originally basaltic composition.

It was first reported in 1815 for an occurrence in Finnbo, Falun, Dalarna, Sweden.

Physical Properties

Cleavage: {001} Perfect, {010} Good
Color:     White, Gray, Greenish gray, Bluish green, Gray.
Density: 2.61 – 2.63, Average = 2.62
Diaphaneity: Transparent to translucent to subtranslucent
Fracture: Uneven – Flat surfaces (not cleavage) fractured in an uneven pattern.
Hardness: 7 – Quartz
Luminescence: Fluorescent, Short UV=herry-red blue, Long UV=white.
Luster: Vitreous (Glassy)
Streak: white

Photos:

Serandite with Aegirine and Albite Specimen size: 5.4 × 2.7 × 2.6 cm © Fabre Minerals
Serandite, Albite, Aegerine 2.5×1.6×1.9 cm Mont Saint-Hilaire Quebec, Canada Copyright © David K. Joyce Minerals
Albite (var. Pericline), Fiesch, Goms, Wallis, Switzerland Specimen weight:94 gr. Crystal size:28 mm Overall size: 84mm x 68 mm x 50 mm minservice
Serandite, Albite, Aegerine 2.5×1.6×1.9 cm Mont Saint-Hilaire Quebec, Canada Copyright © David K. Joyce Minerals

Salty Soil Can Suck Water out of Atmosphere: Could It Happen On Mars?

McMurdo Dry Valleys. These wet patches in Antarctica’s McMurdo Dry Valleys are created by the salty soils sucking water out of the atmosphere. (Credit: Joseph Levy, Oregon State University)
The frigid McMurdo Dry Valleys in Antarctica are a cold, polar desert, yet the sandy soils there are frequently dotted with moist patches in the spring despite a lack of snowmelt and no possibility of rain.
A new study, led by an Oregon State University geologist, has found that that the salty soils in the region actually suck moisture out of the atmosphere, raising the possibility that such a process could take place on Mars or on other planets.
The study, which was supported by the National Science Foundation, has been published online this week in the journal Geophysical Research Letters, and will appear in a forthcoming printed edition.
Joseph Levy, a post-doctoral researcher in OSU’s College of Earth, Ocean, and Atmospheric Sciences, said it takes a combination of the right kinds of salts and sufficient humidity to make the process work. But those ingredients are present on Mars and, in fact, in many desert areas on Earth, he pointed out.
“The soils in the area have a fair amount of salt from sea spray and from ancient fjords that flooded the region,” said Levy, who earned his doctorate at Brown University. “Salts from snowflakes also settle into the valleys and can form areas of very salty soil. With the right kinds of salts, and enough humidity, those salty soils suck the water right out of the air.
“If you have sodium chloride, or table salt, you may need a day with 75 percent humidity to make it work,” he added. “But if you have calcium chloride, even on a frigid day, you only need a humidity level above 35 percent to trigger the response.”
Once a brine forms by sucking water vapor out of the air, Levy said, the brine will keep collecting water vapor until it equalizes with the atmosphere.
“It’s kind of like a siphon made from salt.”
Levy and his colleagues, from Portland State University and Ohio State University, found that the wet soils created by this phenomenon were 3-5 times more water-rich than surrounding soils — and they were also full of organic matter, including microbes, enhancing the potential for life on Mars. The elevated salt content also depresses the freezing temperature of the groundwater, which continues to draw moisture out of the air when other wet areas in the valleys begin to freeze in the winter.
Though Mars, in general, has lower humidity than most places on Earth, studies have shown that it is sufficient to reach the thresholds that Levy and his colleagues have documented. The salty soils also are present on the Red Planet, which makes the upcoming landing of the Mars Science Laboratory this summer even more tantalizing.
Levy said the science team discovered the process as part of “walking around geology” — a result of observing the mysterious patches of wet soil in Antarctica, and then exploring their causes. Through soil excavations and other studies, they eliminated the possibility of groundwater, snow melt, and glacial runoff. Then they began investigating the salty properties of the soil, and discovered that the McMurdo Dry Valleys weather stations had reported several days of high humidity earlier in the spring, leading them to their discovery of the vapor transfer.
“It seems kind of odd, but it really works,” Levy said. “Before one of our trips, I put a bowl of the dried, salty soil and a jar of water into a sealed Tupperware container and left it on my shelf. When I came back, the water had transferred from the jar to the salt and created brine.
“I knew it would work,” he added with a laugh, “but somehow it still surprised me that it did.”
Evidence of the salty nature of the McMurdo Dry Valleys is everywhere, Levy said. Salts are found in the soils, along seasonal streams, and even under glaciers. Don Juan Pond, the saltiest body of water on Earth, is found in Wright Valley, the valley adjacent to the wet patch study area.
“The conditions for creating this new water source into the permafrost are perfect,” Levy said, “but this isn’t the only place where this could or does happen. It takes an arid region to create the salty soils, and enough humidity to make the transference work, but the rest of it is just physics and chemistry.”
Other authors on the study include Andrew Fountain, Portland State University, and Kathy Welch and W. Berry Lyons, Ohio State University.
Note : The above story is reprinted from materials provided by Oregon State University. 

When Continents Collide: New Twist to 50-Million-Year-Old Tale

The eastern Himalaya Mountains. These mountains formed soon after India collided with Asia 50 million years ago. (Credit: Marin Clark)
Fifty million years ago, India slammed into Eurasia, a collision that gave rise to the tallest landforms on the planet, the Himalaya Mountains and the Tibetan Plateau.
India and Eurasia continue to converge today, though at an ever-slowing pace. University of Michigan geomorphologist and geophysicist Marin Clark wanted to know when this motion will end and why. She conducted a study that led to surprising findings that could add a new wrinkle to the well-established theory of plate tectonics — the dominant, unifying theory of geology.
“The exciting thing here is that it’s not easy to make progress in a field (plate tectonics) that’s 50 years old and is the major tenet that we operate under,” said Clark, an assistant professor in the Department of Earth and Environmental Sciences in the College of Literature, Science, and the Arts.
“The Himalaya and Tibet are the highest mountains today on Earth, and we think they’re probably the highest mountains in the last 500 million years,” she said. “And my paper is about how this is going to end and what’s slowing down the Indian plate.”
Clark’s paper is scheduled for online publication Feb. 29 in the journal Nature.
In it, she suggests that the strength of the underlying mantle, not the height of the mountains, is the critical factor that will determine when the Himalayan-Tibetan mountain-building episode ends. Earth’s mantle is the thick shell of rock that separates the crust above from the core below.
According to the theory of plate tectonics, the outer part of Earth is broken into several large plates, like pieces of cracked shell on a boiled egg. The continents ride on the plates, which move relative to one another and occasionally collide. The tectonic plates move about as fast as your fingernails grow, and intense geological activity — volcanoes, earthquakes and mountain-building, for example — occurs at the plate boundaries.
The rate at which the Indian sub-continent creeps toward Eurasia is slowing exponentially, according to Clark, who reviewed published positions of northern India over the last 67 million years to evaluate convergence rates. The convergence will halt — putting an end to one of the longest periods of mountain-building in recent geological history — in about 20 million years, she estimates.

And what will cause it to stop?

Until now, conventional wisdom among geologists has been that the slowing of convergence at mountainous plate boundaries was related to changes in the height of the mountains. As the mountains grew taller, they exerted an increasing amount of force on the plate boundary, which slowed the convergence.
But in her Nature paper, Clark posits that a different model, one based on the strength of the uppermost mantle directly beneath the mountains, best explains the observed post-collisional motions of the Indian plate.
By “strength” Clark means the uppermost mantle’s ability to withstand deformation, a property called viscous resistance. Clark suggests that the relatively strong mantle directly beneath Tibet and the Himalayas acts as a brake that slows — and will eventually halt — the convergence of the two continents.
“My paper is arguing that it’s not the height of the mountains, it’s the strength of the mantle that’s controlling this slowing,” Clark said. “This is something that hasn’t been considered before and basically grew out of field observations in northern Tibet.”
But viscous resistance doesn’t tell the whole story. Other factors may also contribute to the slowing of the Indian plate, Clark said.
“For me, critical field observations showed that the northern edge of the Tibetan Plateau hasn’t moved since the collision 50 million years ago,” she said. “Therefore, the Tibetan Plateau is getting smaller in width. It’s like squeezing a box and making it narrower while squeezing it up.”
The rate at which the box is being squeezed is the average rate of mountain-building, and it provides important clues about the factors controlling plate motion. Clark analyzed how the convergence is slowing as compared to the shrinking of the plateau.
“If the height of the mountains were important in slowing India’s convergence, then the rate of mountain-building should also slow down as the Himalaya and Tibet grew to high elevation,” Clark said. “But when I analyzed how the mountain-building rate changed over the past 50 million years, I was surprised to find that it didn’t change at all.
“From this I conclude that the strength of the uppermost mantle is keeping this mountain- building constant. But as the box is shrinking, the plate motion must slow down to keep the shrinking rate the same,” she said.
Support for the research was provided by the National Science Foundation’s Continental Dynamics Program.
Note : The above story is reprinted from materials provided by University of Michigan, via Newswise. The original article was written by Jim Erickson. 

Volcanoes Deliver Two Flavors of Water

Volcanic eruption. (Credit: © bierchen / Fotolia)
Seawater circulation pumps hydrogen and boron into the oceanic plates that make up the seafloor, and some of this seawater remains trapped as the plates descend into the mantle at areas called subduction zones. By analyzing samples of submarine volcanic glass near one of these areas, scientists found unexpected changes in isotopes of hydrogen and boron from the deep mantle. They expected to see the isotope “fingerprint” of seawater.
But in volcanoes from the Manus Basin they also discovered evidence of seawater distilled long ago from a more ancient plate descent event, preserved for as long as 1 billion years. The data indicate that these ancient oceanic “slabs” can return to the upper mantle in some areas, and that rates of hydrogen exchange in the deep Earth may not conform to experiments.
The research is published in the February 26, 2012, advanced on line publication of Nature Geoscience.
As Carnegie coauthor Erik Hauri explained, “Hydrogen and boron have both light and heavy isotopes. Isotopes are atoms of the same element with different numbers of neutrons. The volcanoes in the Manus Basin are delivering a mixture of heavy and light isotopes that have been observed nowhere else. The mantle under the Manus Basin appears to contain a highly distilled ancient water that is mixing with modern seawater.”
When seawater-soaked oceanic plates descend into the mantle, heavy isotopes of hydrogen and boron are preferentially distilled away from the slab, leaving behind the light isotopes, but also leaving it dry and depleted of these elements, making the “isotope fingerprint” of the distillation process difficult to identify. But this process appears to have been preserved in at least one area: submarine volcanoes in the Manus Basin of Papua New Guinea, which erupted under more than a mile of seawater (2,000 meters). Those pressures trap water from the deep mantle within the volcanic glass.
Lead author Alison Shaw and coauthor Mark Behn, both former Carnegie postdoctoral researchers, recognized another unique feature of the data. Lab experiments have shown very high diffusion rates for hydrogen isotopes, which move through the mantle as tiny protons. This diffusion should have long-ago erased the hydrogen isotope differences observed in the Manus Basin volcanoes.
“That is what we typically see at mid-ocean ridges,” remarked Hauri. “But that is not what we found at Manus Basin. Instead we found a huge range in isotope abundances that indicates hydrogen diffusion in the deep Earth may not be analogous to what is observed in the lab.”
The team’s * finding means is that surface water can be carried into the deep Earth by oceanic plates and be preserved for as long as 1 billion years.
They also indicate that the hydrogen diffusion rates in the deep Earth appear to be much slower than experiments show. It further suggests that these ancient slabs may not only return to the upper mantle in areas like the Manus Basin, they may also come back up in hotspot volcanoes like Hawaii that are produced by mantle plumes.
The results are important to understanding how water is transferred and preserved in the mantle and how it and other chemicals are recycled to the surface.
*Other researchers on the team include lead author A.M. Shaw and M.D. Behn from Woods Hole Oceanographic Institution, D.R. Hilton Scripps Institution of Oceanography and UC San Diego, C.G. Macpherson Durham University, and J.M. Sinton University of Hawaii.
Note : The above story is reprinted from materials provided by Carnegie Institution. 

Erosional Origin of Linear Dunes On Earth and Saturn’s Moon Titan

Artificially excavated cross sections showing internal structures of linear dunes (Fig. 2 of Zhou et al.). (Credit: Image courtesy of Geological Society of America)
Linear dunes, widespread on Earth and Saturn’s moon, Titan, are generally considered to have been formed by deposits of windblown sand. It has been speculated for some time that some linear dunes may have formed by “wind-rift” erosion, but this model has commonly been rejected due to lack of sufficient evidence. Now, new research supported by China’s NSF and published this week in GSA BULLETIN indicates that erosional origin models should not be ruled out.
The linear dunes in China’s Qaidam Basin have been proposed to have formed as self-extending lee dunes under a unidirectional wind regime owing to a high level of total silt, clay, and salt content or cohesiveness of sediments, and they have undergone southward lateral migration at rates of up to 3 m/yr.
New GSA BULLETIN research examines the sediments, internal structures, and optically stimulated luminescence ages of the linear dunes in the central Qaidam Basin approximately 80 km north of the city Golmud. The study’s findings suggest that the linear dunes are most likely of erosional origin similar to yardangs with orientations controlled by strikes of joints.
According to the study’s lead author, Jianxun Zhou of the China University of Petroleum’s State Key Laboratory of Petroleum Resource & Prospecting, “If the control of tectonic structures on the orientation of wind-eroded ridges is taken into account, morphodynamic interpretations for the wind-rift model may become much simpler.
No one has considered the possibility of erosional origin for the linear dunes on Titan. Nearly all researchers consider the linear dunes on Titan to be of depositional origin, but their morphodynamic interpretations are complicated and their relationships to wind directions are in dispute.
If an erosional origin is considered, the morphodynamic interpretations of the linear dunes on Titan can also be greatly simplified.”
Note:The above story is reprinted from materials provided by Geological Society of America. 

Building Blocks of Early Earth Survived Collision That Created Moon

Unexpected new findings by a University of Maryland team of geochemists show that some portions of Earth’s mantle (the rocky layer between Earth’s metallic core and crust) formed when the planet was much smaller than it is now, and that some of this early-formed mantle survived Earth’s turbulent formation, including a collision with another planet-sized body that many scientists believe led to the creation of the Moon.

“It is believed that Earth grew to its current size by collisions of bodies of increasing size, over what may have been as much as tens of millions of years, yet our results suggest that some portions of the Earth formed within 10 to 20 million years of the creation of the Solar System and that parts of the planet created during this early stage of construction remained distinct within the mantle until at least 2.8 billion years ago.” says UMD Professor of Geology Richard Walker, who led the research team.
Prior to this finding, scientific consensus held that the internal heat of the early Earth, in part generated by a massive impact between the proto-Earth and a planetoid approximately half its size (i.e., the size of Mars), would have led to vigorous mixing and perhaps even complete melting of Earth. This, in turn, would have homogenized the early mantle, making it unlikely that any vestiges of the earliest-period of Earth history could be preserved and identified in volcanic rocks that erupted onto the surface more than one and a half billion years after Earth formed.
fig(1)
However, the Maryland team examined volcanic rocks that flourished in the first half of Earth’s history, called komatiites, and found that these have a different type of composition than what they, or anyone, would have, expected. Their findings were just published in the journal Science.

An Isotopic Signature

“We have discovered 2.8 billion year old volcanic rocks from Russia that have a combination of isotopes of the chemical element tungsten that is different from the combination seen in most rocks — different even from the tungsten filaments in incandescent light bulbs,” says the first author, Touboul, a research associate in the University of Maryland’s Department of Geology. “We believe we have detected the isotopic signature of one of the earliest-formed portions of the Earth, a building block that may have been created when the Earth was half of its current mass.”
As with many other chemical elements, tungsten consists of different isotopes. All isotopes of an element are characterized by having the same number of electrons and protons but different numbers of neutrons. Therefore, isotopes of an element are characterized by identical chemical properties, but different mass and nuclear properties. Through radioactive decay, some unstable (radioactive) isotopes spontaneously transform from one element into another at a specific, but constant, rate. As a result, scientists can use certain radioactive isotopes to determine the age of certain processes that happen within Earth, as well as for dating rocks.
For the Maryland team the tungsten isotope182-tungsten (one of the five isotopes of tungsten) is of special interest because it can be produced by the radioactive decay of an unstable isotope of the element hafnium, 182-hafnium.
According to the UMD team, the radioactive isotope 182-hafnium was present at the time our Solar System formed, but is no longer present on Earth today. Indeed, decay of 182-hafnium into 182-tungsten is so rapid (~9 million year half-life) that variations in the abundance of 182-tungsten relative to other isotopes of tungsten can only be due to processes that occurred very early in the history of our Solar System, they say.
fig(2)
The Maryland geochemists found that the 2.8 billion year old Russian komatiites from Kostomuksha have more of the tungsten isotope 182-W than normal. “This difference in isotopic composition requires that the early Earth formed and separated into its current metallic core, silicate mantle, and perhaps crust, well within the first 60 million years after the beginning of our 4.57-billion-year-old Solar System,” says Touboul.
“In itself this is not new,” he says, “but what is new and surprising is that a portion of the growing Earth developed the unusual chemical characteristics that could lead to the enrichment in 182-tungsten; that this portion survived the cataclysmic impact that created our moon; and that it remained distinct from the rest of the mantle until internal heat melted the mantle and transported some of this material to the surface 2.8 billion years ago, allowing us to sample it today.”

Higher Precision Yields New Findings, Insights

The UMD team explained that they were able to conduct this research because they have developed new techniques that allow the isotopic composition of tungsten to be measured with unprecedented precision. “We do this by chemically separating and purifying the tungsten from the rocks we study. We then use an instrument termed a mass spectrometer to measure the isotopic composition of the tungsten”
According to the researchers their new findings have far reaching implications for understanding how Earth formed; how it differentiated into a metallic core, rocky mantle and crust; and the dynamics of change within the mantle.

“These findings indicate that the Earth’s mantle has never been completely melted and homogenized, and that convective mixing of the mantle, even while Earth was growing, was evidently very sluggish,” says Walker. “Many questions remain. The rocks we studied are 2.8 billion years old. We don’t know whether the portion of the Earth with this unusual isotopic composition or signature can be found in much younger rocks. We plan to analyze some modern volcanic rocks in the near future to assess this.”

fig(3)
Fig(1): Photograph of a complete section of a komatiite lava flow that solidified on an ocean floor 2.82 billion years ago. Komatiites can provide extremely valuable evidence of the distant geological past of our planet. Photo Credit – Igor Puchtel, UMD
Fig(2):Photomicrograph of a small, thin section of komatiite lava. The “spinifex texture” is a hallmark and considered unequivocal evidence of their ancient origin as molten rock extruded from deep in the Earth. (Credit: Igor Puchtel, UMD)
Fig(3):Komatiite drill core obtained via drilling a hole through a sequence of komatiite lava flows. The technology allows us to obtain and document fresh rock material from horizons located as deep as several miles below the Earth’s surface, which otherwise would be inaccessible for scientists.
Photo Credit – Igor Puchtel, UMD
 Note: The above story is reprinted from materials provided by University of Maryland.  

300-Million-Year-Old Forest Discovered Preserved in Volcanic Ash

A reconstruction of the 300-million-year-old peat-forming forest at a site near Wuda, China. (Credit: Image courtesy of University of Pennsylvania)
Pompeii-like, a 300-million-year-old tropical forest was preserved in ash when a volcano erupted in what is today northern China. A new study by University of Pennsylvania paleobotanist Hermann Pfefferkorn and colleagues presents a reconstruction of this fossilized forest, lending insight into the ecology and climate of its time.
Pfefferkorn, a professor in Penn’s Department of Earth and Environmental Science, collaborated on the work with three Chinese colleagues: Jun Wang of the Chinese Academy of Sciences, Yi Zhang of Shenyang Normal University and Zhuo Feng of Yunnan University.
Their paper was published this week in the Early Edition of the Proceedings of the National Academy of Sciences.
The study site, located near Wuda, China, is unique as it gives a snapshot of a moment in time. Because volcanic ash covered a large expanse of forest in the course of only a few days, the plants were preserved as they fell, in many cases in the exact locations where they grew.
“It’s marvelously preserved,” Pfefferkorn said. “We can stand there and find a branch with the leaves attached, and then we find the next branch and the next branch and the next branch. And then we find the stump from the same tree. That’s really exciting.”
The researchers also found some smaller trees with leaves, branches, trunk and cones intact, preserved in their entirety.
Due to nearby coal-mining activities unearthing large tracts of rock, the size of the researchers’ study plots is also unusual. They were able to examine a total of 1,000 m2 of the ash layer in three different sites located near one another, an area considered large enough to meaningfully characterize the local paleoecology.
The fact that the coal beds exist is a legacy of the ancient forests, which were peat-depositing tropical forests. The peat beds, pressurized over time, transformed into the coal deposits.
The scientists were able to date the ash layer to approximately 298 million years ago. That falls at the beginning of a geologic period called the Permian, during which Earth’s continental plates were still moving toward each other to form the supercontinent Pangea. North America and Europe were fused together, and China existed as two smaller continents. All overlapped the equator and thus had tropical climates.
At that time, Earth’s climate was comparable to what it is today, making it of interest to researchers like Pfefferkorn who look at ancient climate patterns to help understand contemporary climate variations.
In each of the three study sites, Pfefferkorn and collaborators counted and mapped the fossilized plants they encountered.In all, they identified six groups of trees. Tree ferns formed a lower canopy while much taller trees — Sigillaria and Cordaites — soared to 80 feet above the ground. The researchers also found nearly complete specimens of a group of trees called Noeggerathiales. These extinct spore-bearing trees, relatives of ferns, had been identified from sites in North America and Europe but appeared to be much more common in these Asian sites.
They also observed that the three sites were somewhat different from one another in plant composition. In one site, for example, Noeggerathiales were fairly uncommon, while they made up the dominant plant type in another site. The researchers worked with painter Ren Yugao to depict accurate reconstructions of all three sites.
“This is now the baseline,” Pfefferkorn said. “Any other finds, which are normally much less complete, have to be evaluated based on what we determined here.”
 The findings are indeed “firsts” on many counts.
“This is the first such forest reconstruction in Asia for any time interval, it’s the first of a peat forest for this time interval and it’s the first with Noeggerathiales as a dominant group,” Pfefferkorn said.
Because the site captures just one moment in Earth’s history, Pfefferkorn noted that it alone cannot explain how climate changes affected life on Earth. But it helps provide valuable context.
“It’s like Pompeii: Pompeii gives us deep insight into Roman culture, but it doesn’t say anything about Roman history in and of itself,” Pfefferkorn said. “But on the other hand, it elucidates the time before and the time after. This finding is similar. It’s a time capsule and therefore it allows us now to interpret what happened before or after much better.”
The study was supported by the Chinese Academy of Science, the National Basic Research Program of China, the National Natural Science Foundation of China and the University of Pennsylvania.
Note : The above story is reprinted from materials provided by University of Pennsylvania.

Related Articles