The mountain ranges of the North American Cordillera are made up of dozens of distinct crustal blocks. A new study clarifies their mode of origin and identifies a previously unknown oceanic plate that contributed to their assembly.
The extensive area of elevated topography that dominates the Western reaches of North America is exceptionally broad, encompassing the coastal ranges, the Rocky Mountains and the high plateaus in between. In fact, this mountain belt consists of dozens of crustal blocks of varying age and origin, which have been welded onto the American continent over the past 200 million years. “How these blocks arrived in North America has long been a puzzle,” says LMU geophysicist Karin Sigloch, who has now taken a closer look at the problem, in collaboration with the Canadian geologist Mitchell Mihalynuk.
Collisions and continental growth
One popular model for the accretion process postulates that a huge oceanic plate – the Farallon Plate – acted as a conveyor belt to sweep crustal fragments eastwards to the margin of American Plate, to which they were attached as the denser Farallon Plate was subducted under it. However, this scenario is at variance with several geological findings, and does not explain why the same phenomenon is not observed on the west coast of South America, the classical case of subduction of oceanic crust beneath a continental plate. The precise source of the crustal blocks themselves has also remained enigmatic, although geological studies suggest that they derive from several groups of volcanic islands. “The geological strata in North America have been highly deformed over the course of time, and are extremely difficult to interpret, so these findings have not been followed up,” says Sigloch.
Sigloch and Mihalynuk have now succeeded in assembling a comprehensive picture of the accretion process by incorporating geophysical findings obtained by seismic tomography. This technique makes it possible to probe the geophysical structure of the Earth’s interior down to the level of the lower mantle by analyzing the propagation velocities of seismic waves. The method can image the remnants of ancient tectonic plates at great depths, ocean floor that subducted, i.e., disappeared from the surface and sank back into the mantle, long time ago.
Intra-oceanic subduction of the Farallon Plate
Most surprisingly, the new data suggest that the Farallon Plate was far smaller than had been assumed, and underwent subduction well to the west of what was then the continental margin of North America. Instead it collided with, and subducted under, an intervening and previously unrecognized oceanic plate. Sigloch and Mihalynuk were able to locate the remnants of several deep-sea trenches that mark subduction sites at which oceanic plates plunge at a steep angle into the mantle and are drawn almost vertically into its depths. “The volcanic activity that accompanies the subduction process will have generated lots of new crustal material, which emerged in the form of island arcs along the line of the trenches, and provided the material for the crustal blocks,” Sigloch explains.
As these events were going on, the American Plate was advancing steadily westwards, as indicated by striped patterns of magnetized seafloor in the North Atlantic. The first to get consumed was the previously unknown oceanic plate, which can be detected seismologically beneath today’s east coast of North America. Only then did the continent begin to encounter the Farallon plate. On its westward journey, North America overrode one intervening island arc after another – annexing ever more of them for the construction of its wide mountains of the West.
Note: This story has been adapted from a news release issued by the Ludwig-Maximilians-Universität München
Book Name : Sedimentology and Stratigraphy , Second Edition By : Gary Nichols
This edition first published 2009, # 2009 by Gary Nichols
First published 1999
Blackwell Publishing was acquired by John Wiley & Sons in February 2007. Blackwell’s publishing program has been merged with Wiley’s global Scientific, Technical and Medical business to form Wiley-Blackwell. Registered office
John Wiley & Sons Ltd, The Atrium, Southern Gate, Chichester, West Sussex, PO19 8SQ, UK Editorial offices
9600 Garsington Road, Oxford, OX4 2DQ, UK
The Atrium, Southern Gate, Chichester, West Sussex, PO19 8SQ, UK
111 River Street, Hoboken, NJ 07030-5774, USA
Nichols, Gary.
Sedimentology and stratigraphy / Gary Nichols. – 2nd ed.
p. cm.
Includes bibliographical references and index.
ISBN 978-1-4051-3592-4 (pbk. : alk. paper) – ISBN 978-1-4051-9379-5 (hardcover : alk. paper) 1. Sedimentation and deposition. 2. Geology, Stratigraphic. I. Title.
QE571.N53 2009
551.3’03–dc22
2008042948
A catalogue record for this book is available from the British Library.
Set in 9/11pt Photina by SPi Publisher Services, Pondicherry, India
Printed and bound in the United Kingdom
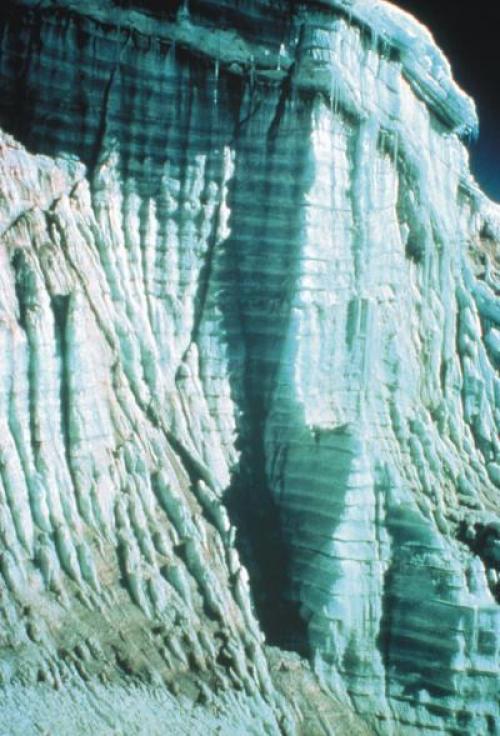
This photo from a 1977 expedition to Quelccaya Ice Cap in Peru shows clearly defined annual layers of ice and dust visible in the ice cap’s margin. Researchers at the Ohio State University are using a set of ice cores taken from Quelccaya as a “Rosetta Stone” for studying other ice cores taken from around the world. (Credit: Photo by Lonnie Thompson, Courtesy of Ohio State University.)
Two annually dated ice cores drawn from the tropical Peruvian Andes reveal Earth’s tropical climate history in unprecedented detail — year by year, for nearly 1,800 years.Researchers at The Ohio State University retrieved the cores from a Peruvian ice cap in 2003, and then noticed some startling similarities to other ice cores that they had retrieved from Tibet and the Himalayas. Patterns in the chemical composition of certain layers matched up, even though the cores were taken from opposite sides of the planet.
In the April 4, 2013 online edition of the journal Science Express, they describe the find, which they call the first annually resolved “Rosetta Stone” with which to compare other climate histories from Earth’s tropical and subtropical regions over the last two millennia.
The cores provide a new tool for researchers to study Earth’s past climate, and better understand the climate changes that are happening today.
“These ice cores provide the longest and highest-resolution tropical ice core record to date,” said Lonnie Thompson, distinguished university professor of earth sciences at Ohio State and lead author of the study.
“In fact, having drilled ice cores throughout the tropics for more than 30 years, we now know that this is the highest-resolution tropical ice core record that is likely to be retrieved.”
The new cores, drilled from Peru’s Quelccaya Ice Cap, are special because most of their 1,800-year history exists as clearly defined layers of light and dark: light from the accumulated snow of the wet season, and dark from the accumulated dust of the dry season.
They are also special because of where they formed, atop the high Andean altiplano in southern Peru. Most of the moisture in the area comes from the east, in snowstorms fueled by moist air rising from the Amazon Basin. But the ice core-derived climate records from the Andes are also impacted from the west — specifically by El Niño, a temporary change in climate, which is driven by sea surface temperatures in the tropical Pacific.
El Niño thus leaves its mark on the Quelccaya ice cap as a chemical signature (especially in oxygen isotopes) indicating sea surface temperatures in the equatorial Pacific Ocean over much of the past 1,800 years.
“We have been able to derive a proxy for sea surface temperatures that reaches back long before humans were able to make such measurements, and long before humans began to affect Earth’s climate,” Thompson said.
Ellen Mosley-Thompson, distinguished university professor of geography at Ohio State and director of the Byrd Polar Research Center, explained that the 2003 expedition to Quelccaya was the culmination of 20 years of work.
The Thompsons have drilled ice cores from glaciers atop the most remote areas of the planet — the Chinese Himalayas, the Tibetan Plateau, Kilimanjaro in Africa, and Papua Indonesia among others — to gauge Earth’s past climate. Each new core has provided a piece of the puzzle, as the researchers measured the concentrations of key chemicals preserved in thousands of years of accumulated ice.
A 1983 trip to Quelccaya yielded cores that earned the research team their first series of papers in Science. The remoteness of the site and the technology available at the time limited the quality of samples they could obtain, however. The nearest road was a two-day walk from the ice cap, so they were forced to melt the cores in the field and carry samples back as bottles of water. This made some chemical measurements impossible, and diminished the time resolution available from the cores.
“Due to the remoteness of the ice cap, we had to develop new tools such as a light-weight drill powered by solar panels to collect the 1983 cores. However, we knew there was much more information the cores could provide” Mosley-Thompson said. “Now the ice cap is just a six-hour walk from a new access road where a freezer truck can be positioned to preserve the cores. So we can now make better dust measurements along with a suite of chemical analyses that we couldn’t make before.”
The cores will provide a permanent record for future use by climate scientists, Thompson added. This is very important, as plants captured by the advancing ice cap 6,000 years ago are now emerging along its retreating margins, which shows that Quelccaya is now smaller than it has been in six thousand years.
“The frozen history from this tropical ice cap — which is melting away as Earth continues to warm — is archived in freezers at -30ºC so that creative people will have access to it 20 years from now, using instruments and techniques that don’t even exist today,” he said.
Coauthors on the study include Mary Davis, Victor Zagorodnov, and Ping-Nan Lin of Byrd Polar Research Center; Ian Howat of the School of Earth Sciences at Ohio State; and Vladimir Mikhalenko of the Russian Academy of Sciences. Funding was provided by the National Science Foundation’s Paleoclimatology Program and Ohio State’s Climate, Water and Carbon Program.
Note : The above story is reprinted from materials provided by Ohio State University, via Newswise.
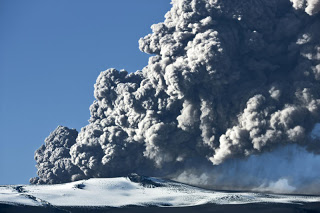
New research by The Open University and Lancaster University discovered another type of Icelandic volcanic eruption that could cause disruption. Published in Geology (February 2013), the team found magma that is twice as ‘fizzy’ as previously believed, which increases the likelihood of disruptive ash clouds from future eruptions.Many of the largest explosive eruptions in Iceland involve a viscous, high-silica magma called rhyolite, and are driven by volcanic gases (mostly water and carbon dioxide). It is these gases that give a volcanic eruption its fizz. At depth these gases are dissolved within the magma, but as the magma rises towards the surface during an eruption, the gases expand dramatically, causing the magma to froth and accelerate upwards as a foam. The viscous rhyolite foam breaks down into tiny ash fragments which form the ash clouds.
Drs Jacqui Owen and Hugh Tuffen (Lancaster University) and Dave McGarvie (The Open University) analysed pumice and lava from an eruption at Iceland’s Torfajökull volcano some seventy thousand years ago. Within these samples they found tiny pockets of magma, called melt inclusions, which trapped the original gas. By measuring how much gas was dissolved within the melt inclusions, they could determine how fizzy the magma was.
Previously scientists had thought that Icelandic magma was less fizzy than those from Pacific Ocean volcanoes and expected much less explosive eruptions by comparison. However, this new research suggests some Icelandic volcanoes could produce eruptions just as explosive as those in the Pacific Rim.
PhD student Jacqui Owen said: “I was amazed by what I found. I measured up to five per cent of water in the inclusions, more than double what was expected for Iceland, and similar in fact to the values for explosive eruptions in the Pacific ‘Ring of Fire’. We knew the Torfajökull volcanic eruption was huge — almost 100 times bigger than recent eruptions in Iceland — but now we also know it was surprisingly gas-rich.”
The finding helps explain why thin blankets of fine ash from older powerful Icelandic eruptions are found in peat bogs and lake beds across the UK and Europe. By accurately measuring the original gas content of Icelandic explosive eruptions for the first time, the research shows how Icelandic volcanoes have the power to generate the fine ash capable of being transported long distances and cause disruption to the UK and Europe.
Dr Dave McGarvie, Senior Lecturer, Volcano Dynamics Group at The Open University, said: “We know that large explosive eruptions have occurred at infamous volcanoes such as Hekla and Katla, but it is important also to appreciate that large explosive eruptions are also produced by less well-known Icelandic volcanoes such as Torfajökull and Öraefajökull.”
Dr Hugh Tuffen, Royal Society University Research Fellow at Lancaster University, said: “The discovery is rather worrying, as it shows that Icelandic volcanoes have the potential to be even more explosive than anticipated. Added to this is the view of several eminent scientists that Iceland is entering a period of increased volcanic activity. Iceland’s position close to mainland Europe and the north Atlantic flight corridors means air travel could be affected again.”
Note : The above story is reprinted from materials provided by Open University.
Apr. 3, 2013 — The mountain ranges of the North American Cordillera are made up of dozens of distinct crustal blocks. A new study clarifies their mode of origin and identifies a previously unknown oceanic plate that contributed to their assembly.The extensive area of elevated topography that dominates the Western reaches of North America is exceptionally broad, encompassing the coastal ranges, the Rocky Mountains and the high plateaus in between. In fact, this mountain belt consists of dozens of crustal blocks of varying age and origin, which have been welded onto the American continent over the past 200 million years. “How these blocks arrived in North America has long been a puzzle,” says LMU geophysicist Karin Sigloch, who has now taken a closer look at the problem, in collaboration with the Canadian geologist Mitchell Mihalynuk.
Collisions and continental growth
One popular model for the accretion process postulates that a huge oceanic plate — the Farallon Plate — acted as a conveyor belt to sweep crustal fragments eastwards to the margin of American Plate, to which they were attached as the denser Farallon Plate was subducted under it. However, this scenario is at variance with several geological findings, and does not explain why the same phenomenon is not observed on the west coast of South America, the classical case of subduction of oceanic crust beneath a continental plate. The precise source of the crustal blocks themselves has also remained enigmatic, although geological studies suggest that they derive from several groups of volcanic islands. “The geological strata in North America have been highly deformed over the course of time, and are extremely difficult to interpret, so these findings have not been followed up,” says Sigloch.
Sigloch and Mihalynuk have now succeeded in assembling a comprehensive picture of the accretion process by incorporating geophysical findings obtained by seismic tomography. This technique makes it possible to probe the geophysical structure of Earth’s interior down to the level of the lower mantle by analyzing the propagation velocities of seismic waves. The method can image the remnants of ancient tectonic plates at great depths, ocean floor that subducted, i.e., disappeared from the surface and sank back into the mantle, long time ago.
Intra-oceanic subduction of the Farallon Plate
Most surprisingly, the new data suggest that the Farallon Plate was far smaller than had been assumed, and underwent subduction well to the west of what was then the continental margin of North America. Instead it collided with, and subducted under, an intervening and previously unrecognized oceanic plate. Sigloch and Mihalynuk were able to locate the remnants of several deep-sea trenches that mark subduction sites at which oceanic plates plunge at a steep angle into the mantle and are drawn almost vertically into its depths. “The volcanic activity that accompanies the subduction process will have generated lots of new crustal material, which emerged in the form of island arcs along the line of the trenches, and provided the material for the crustal blocks,” Sigloch explains.
As these events were going on, the American Plate was advancing steadily westwards, as indicated by striped patterns of magnetized seafloor in the North Atlantic. The first to get consumed was the previously unknown oceanic plate, which can be detected seismologically beneath today’s east coast of North America. Only then did the continent begin to encounter the Farallon plate. On its westward journey, North America overrode one intervening island arc after another — annexing ever more of them for the construction of its wide mountains of the West.
Note : The above story is reprinted from materials provided by Ludwig-Maximilians-Universitaet Muenchen (LMU).
SEDPAK provides a conceptual framework for modeling the sedimentary fill of basins by visualizing stratal geometries as they are produced between sequence boundaries. The simulation is used to substantiate inferences drawn about the potential for hydrocarbon entrapment and accumulation within a basin. It is designed to model and reconstruct clastic and carbonate sediment geometries which are produced as a response to changing rates of tectonic movement, eustasy, and sedimentation The simulation enables the evolution of the sedimentary fill of a basin to be tracked, defines the chronostratigraphic framework for the deposition of these sediments, and illustrates the relationship between sequences and systems tracts seen in cores, outcrop, and well and seismic data.
This Sedpak movie captures a sedimentary section subdivided into geometric packages defined by bounding unconformities and internal surfaces that result from varying positions of relative sea level and rates of sedimentation. These geometries demonstrate why sequence stratigraphic analyses of seismic cross-sections, well logs and outcrop studies of sedimentary rock are used to predict the thickness and extent of sediment lithology from inferences built from this understanding of how sediment geometry changes with relative sea level and rates of sedimentation.
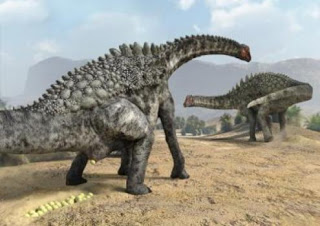
This is an artist’s impression of the egg laying of an Ampelosaurus. (Credit: J.A. Peñas – SINC)
Mar. 12, 2013 — A study headed by the Miquel Crusafont Catalan Palaeontology Institute has for the first time documented detailed records of dinosaur egg fossils in the Coll de Nargó archaeological site in Lleida, Spain. Up until now, only one type of dinosaur egg had been documented in the region.
The archaeological site in Coll de Nargó containing dinosaur eggs lies some 8 kilometres to the west of the town that bears the same name in the province of Lleida. This region is home to different types of geological formations, including the Areniscas de Arén Formation and the Tremp Formation, which have provided a rich and varied yield of dinosaur fossils through the entire Pyrenees region.
“Eggshells, eggs and nests were found in abundance and they all belong to dinosaurs, sauropods in particular. Up until now, only one type of dinosaur egg had been documented in the region: Megaloolithus siruguei. After analysing more than 25 stratus throughout the Tremp Formation, a minimum of four different additional types were identified: Cairanoolithus roussetensis, Megaloolithus aureliensis, Megaloolithus siruguei and Megaloolithus baghensis,” as explained by Albert García Sellés from the Miquel Crusafont Catalan Palaeontology Institute and lead author of the study.
One of the main problems faced by palaeontologists when studying fossil remains is determining the age of the sediments that contain them. There are fossils known as “guide fossils” whose characteristics allow for the age of rocks to be deduced. However, these fossils are frequent in marine sediments but more scarce and difficult to find in land sediments.
“It has come to light that the different types of eggs (oospecies) are located at very specific time intervals. This allows us to create biochronological scales with a precise dating capacity. In short, thanks to the collection of oospecies found in Coll de Nargó we have been able to determine the age of the site at between 71 and 67 million years,” ensures the expert.
The paleontological sites in the south of Europe containing dinosaur remains have a high scientific value since they allow us to understand and thus reconstruct the ecosystems at the end of the Mesozoic Era.
The latest scientific investigations show that the dinosaur fauna of the European Continent living for a short time before the great extinction some 66 million years ago can be found exactly on the southern side of the Pyrenees.
A connection between French and Spanish dinosaurs
The discovery of Cairanoolithus fossils in this area is an important finding. Given that this type of eggs is only known in the south of France, they are the first of their kind found in the Iberian Peninsula.
According to García Sellés, this discovery constitutes a new proof of the connection between dinosaur fauna in France and in the Iberian Peninsula some 70 million years ago.
Furthermore, finding dinosaur eggs and nests in more than 25 stratigraphic levels provides clear evidence that these sauropods used the Coll de Nargó region as a nesting area for millions of years.
“We had never found so many nests in the one area before. In addition, the presence of various oospecies at the same level suggests that different types of dinosaurs shared the same nesting area,” concludes the scientist.
Note : The above story is reprinted from materials provided by FECYT – Spanish Foundation for Science and Technology, via EurekAlert!, a service of AAAS.
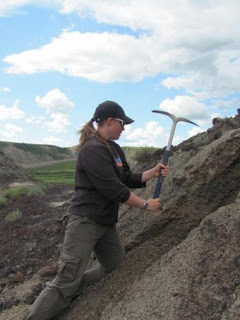
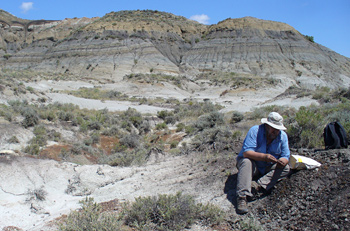
This shows Annie Quinney excavating ancient soils in 70 million-year-old rocks in the Drumheller badlands. (Credit: Credit: Kohei Tanaka, University of Calgary.)
Mar. 14, 2013 — The dry, barren prairie around Alberta’s Drumheller area was once a lush and subtropical forest on the shores of a large inland sea, with loads of wetlands inhabited by dinosaurs, turtles, crocodiles and small mammals.
But that changed about 71-million-years ago, according to a new study by researchers Annie Quinney and Darla Zelenitsky in paleontology at the University of Calgary. The researchers’ calculations show that drastic climate change occurred during a five-million-year period in Alberta’s badlands. At this time, the wetlands dried up and the warm humid climate was interrupted by a sudden cool, drying spell.
The study of ancient climate change is important as it helps researchers understand the impact sudden heating and cooling may have had on plants and animals.
“This was a time of change in Alberta, the wetlands disappeared as the inland sea retreated and the climate cooled,” says Quinney, a former master’s student in the Department of Geoscience. She led the study recently published in the journal Palaeogeography, Palaeoclimatology, Palaeoecology, which was part of her master’s degree in the Department of Geoscience.
Dramatic climate change was previously proposed to be responsible for the disappearance of turtles 71-million-years ago, because they were considered to be “climate-sensitive” animals. Results of this research, however, show that the disappearance of turtles came before the climate cooled and instead closely corresponds to habitat disturbances, which was the disappearance of wetlands.
“The big surprise is that some animals, for example turtles, appeared to be more sensitive to habitat disturbances than to climate changes. Therefore, even if climatic conditions are ‘ideal,’ turtles may disappear or may not recover unless habitats are just right,” says Quinney.
Quinney and supervisors Zelenitsky, assistant professor in the Department of Geoscience, and François Therrien of the Royal Tyrrell Museum in Drumheller studied ancient soils preserved in the rocks in the Red Deer River valley near Drumheller that were deposited 72 to 67 million years ago and record information about the past climate and environments.
Researchers calculated precipitation and temperature levels over a five-million year interval and during that time, temperature and precipitation dropped over a few thousand years, and that cooler interval lasted for 500,000 years.
“By studying the structure and chemistry of ancient soils, we were able to estimate the ancient temperature and rainfall that prevailed when those soils formed millions of years ago,” says Quinney, who is now completing a PhD at Monash University in Australia on a full scholarship.
Note : The above story is reprinted from materials provided by University of Calgary, via EurekAlert!, a service of AAAS.
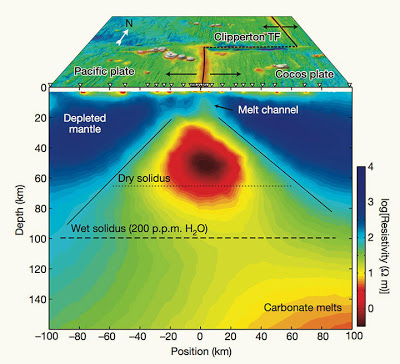
The deep melting region where magma is generated in the mantle beneath the mid-ocean ridge volcano. Green to red colors show regions of partially molten material created by upwelling due to the divergence of the Pacific and Cocos tectonic plates. This image was made by analyzing data collected by an array of seafloor electromagnetic instruments, shown as inverted triangles. Shaded colors in the upper panel show the seafloor topography around the survey region. (Credit: Image courtesy of University of California – San Diego)
Mar. 27, 2013 — Since the plate tectonics revolution of the 1960s, scientists have known that new seafloor is created throughout the major ocean basins at linear chains of volcanoes known as mid-ocean ridges. But where exactly does the erupted magma come from?Researchers at Scripps Institution of Oceanography at UC San Diego now have a better idea after capturing a unique image of a site deep in the Earth where magma is generated.
Using electromagnetic technology developed and advanced at Scripps, the researchers mapped a large area beneath the seafloor off Central America at the northern East Pacific Rise, a seafloor volcano located on a section of the global mid-ocean ridges that together form the largest and most active chain of volcanoes in the solar system. By comparison, the researchers say the cross-section area of the melting region they mapped would rival the size of San Diego County.
Details of the image and the methods used to capture it are published in the March 28 issue of the journal Nature.
“Our data show that mantle upwelling beneath the mid-ocean ridge creates a deeper and broader melting region than previously thought,” said Kerry Key, lead author of the study and an associate research geophysicist at Scripps. “This was the largest project of its kind, enabling us to image the mantle with a level of detail not possible with previous studies.”
The northern East Pacific Rise is an area where two of the planet’s tectonic plates are spreading apart from each another. Mantle rising between the plates melts to generate the magma that forms fresh seafloor when it erupts or freezes in the crust.
Data for the study was obtained during a 2004 field study conducted aboard the research vessel Roger
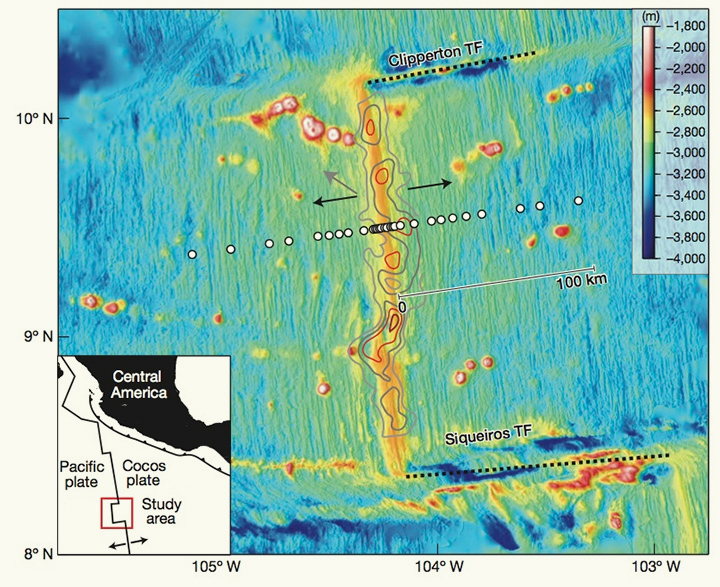
Study site for the 2004 expedition at the northern East Pacific Rise, a mid-ocean ridge volcano where new seafloor is created as the Pacific and Cocos tectonic plates diverge.
Revelle, a ship operated by Scripps and owned by the U.S. Navy.
The marine electromagnetic technology behind the study was originally developed in the 1960s by Charles “Chip” Cox, an emeritus professor of oceanography at Scripps, and his student Jean Filloux. In recent years the technology was further advanced by Steven Constable and Key. Since 1995 Scripps researchers have been working with the energy industry to apply this technology to map offshore geology as an aid to exploring for oil and gas reservoirs.
“We have been working on developing our instruments and interpretation software for decades, and it is really exciting to see it all come together to provide insights into the fundamental processes of plate tectonics,” said Constable, a coauthor of the paper and a professor in the Cecil H. and Ida M. Green Institute of Geophysics and Planetary Physics at Scripps. “It was really a surprise to discover that melting started so deep in the mantle — much deeper than was expected.”
Key believes the insights that electromagnetics provides will continue to grow as the technology matures and data analysis techniques improve (last week Key and his colleagues announced the use of electromagnetics in discovering a magma lubricant for the planet’s tectonic plates).
“Electromagnetics is really coming of age as a tool for imaging the earth,” said Key. “Much of what we know about the crust and mantle is a result of using seismic techniques. Now electromagnetic technology is offering promise for further discoveries.”
Key also has future plans to apply electromagnetic technology to map subglacial lakes and groundwater in the polar regions.
In addition to Key and Constable, coauthors of the paper include Lijun Liu of the University of Illinois and Anne Pommier of Arizona State University.
The study was supported by the National Science Foundation and the Seafloor Electromagnetic Methods Consortium at Scripps.
Note : The study was supported by the National Science Foundation and the Seafloor Electromagnetic Methods Consortium at Scripps.
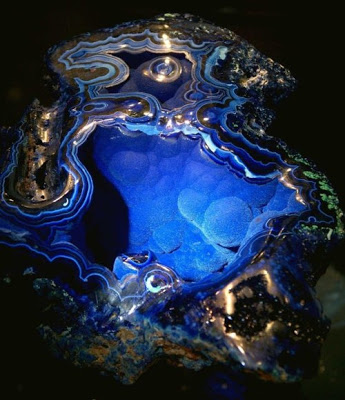
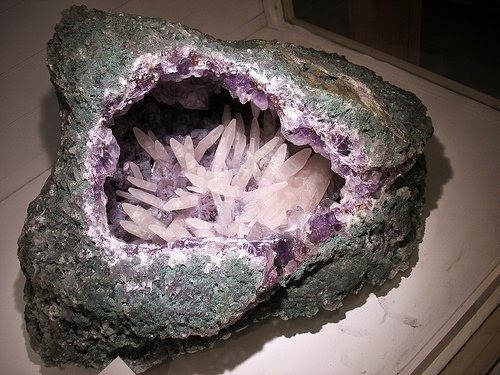
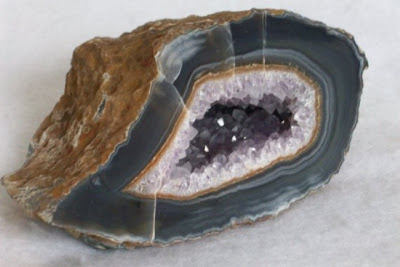
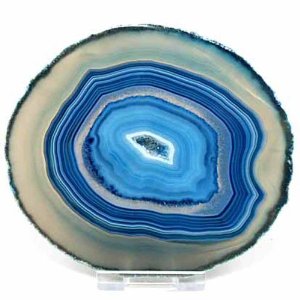
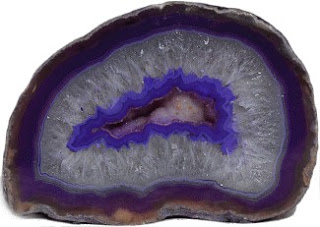
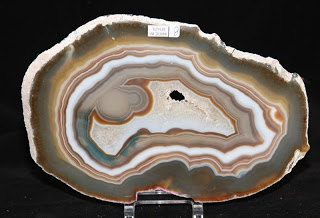
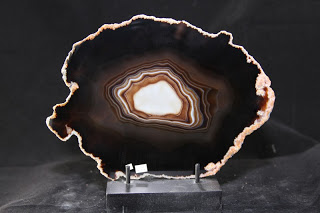
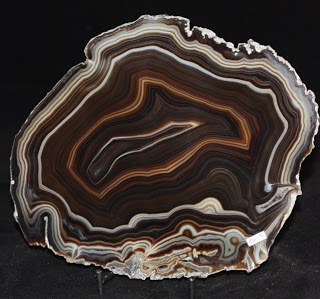
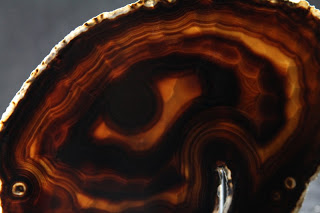
Geodes are geological secondary structures which occur in certain sedimentary and volcanic rocks. Geodes are essentially hollow, spherical to oblate masses of mineral matter that may form from either the filling of vesicles (gas bubbles) in volcanic to sub-volcanic rocks by minerals deposited from hydrothermal fluids, or by the dissolution of sedimentary nodules or concretions (that were deposited syngenetically within the rock formations they are found in) and partial filling by the same or other minerals precipitated from diagenetic or hydrothermal fluids.
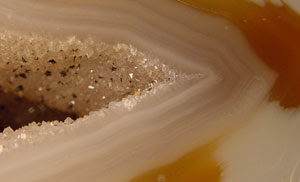
Geodes differ from vugs in that the former were formed as early, rounded, structures within the surrounding rock, whereas vugs are irregular voids or cavities within a cross-cutting formation, usually a vein or breccia. Geodes also differ from “nodules” in that a nodule is a mass of mineral matter that has accreted around the nodule nucleus. Both structures had the minerals contained within, deposited from groundwater or hydrothermal processes. Geodes commonly have a chalcedony (cryptocrystalline quartz) shell lined internally by various minerals, often as crystals, particularly calcite, pyrite, kaolinite, sphalerite, millerite, barite, dolomite, limonite, smithsonite and quartz, which is by far the most common and abundant mineral found in geodes. Geodes are found mostly in basaltic lavas and limestones. The Warsaw Formation in the Keokuk region near the area where Missouri, Iowa, and Illinois join contains abundant geodes.
Formation
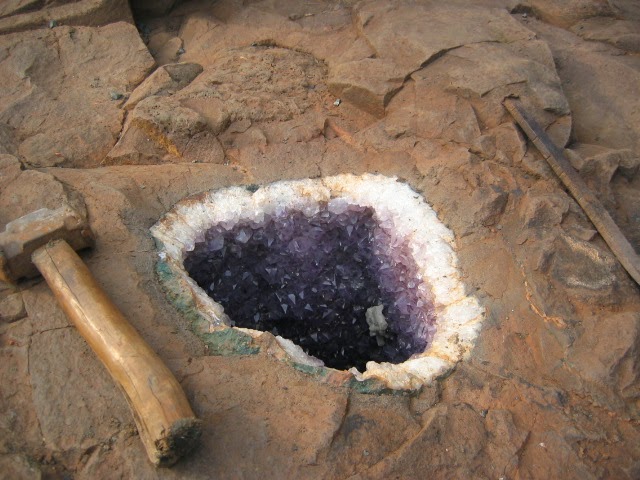
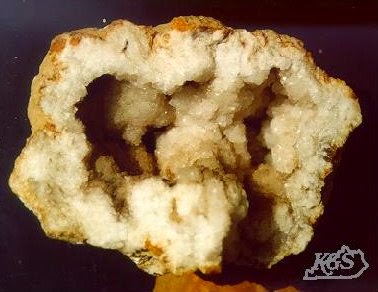
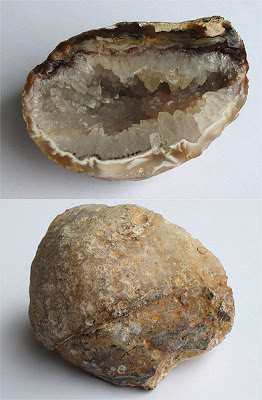
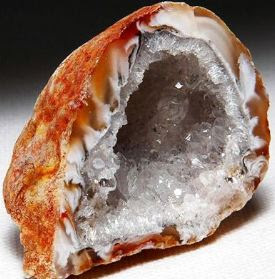
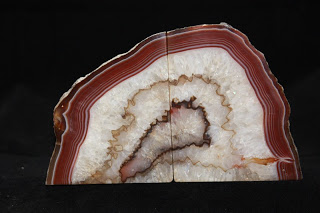
Geodes can form in any cavity, but the term is usually reserved for more or less rounded formations in igneous and sedimentary rocks, while the more general term “vug” is applied to cavities in fissures and veins. They can form in gas bubbles in igneous rocks, such as vesicles in basaltic lavas, or as in the American Midwest, rounded cavities in sedimentary formations. After rock around the cavity hardens, dissolved silicates and/or carbonates are deposited on the inside surface. Over time, this slow feed of mineral constituents from groundwater or hydrothermal solutions allows crystals to form inside the hollow chamber. Bedrock containing geodes eventually weathers and decomposes, leaving them present at the surface if they are composed of resistant material such as quartz.
Coloration
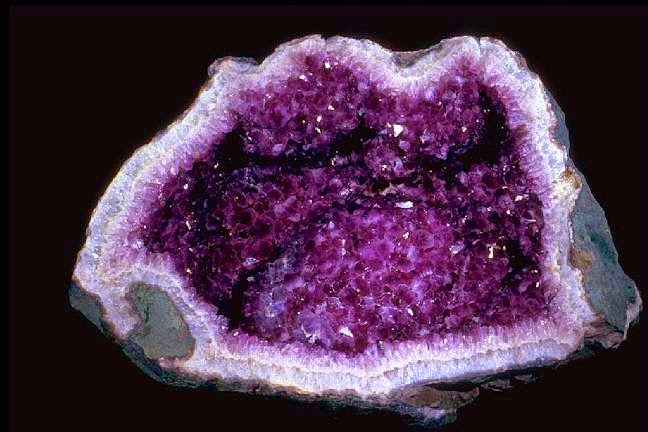
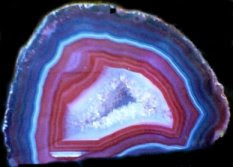
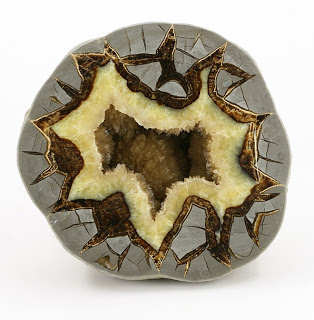
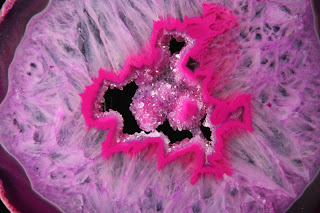
Most geodes contain clear quartz crystals, while others have purple amethyst crystals. Still others can have agate, chalcedony, or jasper banding or crystals such as calcite, dolomite, celestite, etc. There is no easy way of telling what the inside of a geode holds until it is cut open or broken apart. However, geodes from any one locality usually have a more restricted variety of interior mineralization.
Geodes and geode slices are sometimes dyed with artificial colors. Samples of geodes with unusual colors or highly unlikely formations have usually been synthetically altered.
Prevalence
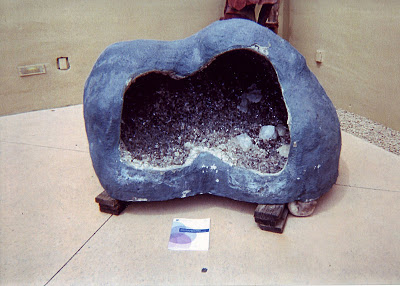
Geodes are common in some formations in the United States (mainly in Indiana, Iowa, Missouri, Kentucky, and Utah). They also are common in Brazil, Namibia, and Mexico. A large geode was discovered in Put-in-Bay, Ohio in the early 20th century. It is known as Crystal Cave, and tours are possible during the summer. In 1967 Iowa designated the geode as the official state rock, and it has a Geode State Park.
In 2000 a team of geologists found a cave filled with giant gypsum crystals in an abandoned silver mine near Almería, Spain. The cavity, which measures 1.8 × 1.7 meters and is 8 meters in length, would be the largest geode ever found.[1] The entrance of the cave has been blocked by five tons of rocks, and is under police protection (to prevent looters from entering). According to geological models, the cave was formed during the Messinian salinity crisis 6 million years ago, when the Mediterranean sea evaporated and left thick layers of salt sediments (evaporites). The cave is currently not accessible to tourists.
The Cave of the Crystals is many meters in size, holding crystals up to 12 m in length. It may be composed of additional chambers that are obstructed by the giant crystals, so its total size is currently unknown to researchers.
Photos :
Amethyst-Geode in the parent rock
Geode, halved and polishedLarge geode in Carefree AZGeode, inside and outside96mm (3.78″) Natural Geode Amethyst Sphere, Carving, Crystal HealingClear Quartz and Agate GEODE Natural Formationagate geodeGeodes from Brazil
Note: The above story is reprinted from materials provided by Wikipedia & Photo from internet
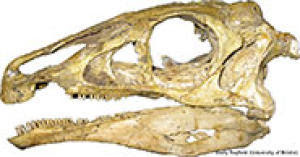
Fossil skull of the Cretaceous therizinosaur Erlikosaurus andrewsi (Credit: Image by Emily Rayfield, University of Bristol)
Research Reveals New Information On the Evolution of Dinosaur SensesDec. 19, 2012 — An international team of scientists, including PhD student Stephan Lautenschlager and Dr Emily Rayfield of the University of Bristol, found that the senses of smell, hearing and balance were well developed in therizinosaurs and might have affected or benefited from an enlarged forebrain. These findings came as a surprise to the researchers as exceptional sensory abilities would be expected from predatory and not necessarily from plant-eating animals.
Therizinosaurs are an unusual group of theropod dinosaurs which lived between 145 and 66 million years ago. Members of this group had evolved into up to 7m (23ft) large animals, with more than 50cm (20in) long, razor-sharp claws on their forelimbs, elongated necks and a coat of primitive, down-like feathers along their bodies. Although closely related to carnivorous dinosaurs such as Tyrannosaurus rex and Velociraptor, and in spite of their bizarre appearance, therizinosaurs were probably peaceful herbivores.
Inspired by this paradox, the international team of palaeontologists decided to take the first close look inside the heads of these enigmatic dinosaurs.
They studied the brain and inner ear anatomy of therizinosaurs using high-resolution CT scanning and 3D computer visualisation to find out more about their sensory and cognitive capabilities and how these had evolved with the transition from meat- to plant-eating.
The focus of the study was the skull of Erlikosaurus andrewsi — a 3-4m (10-13ft) therizinosaur, which lived more than 90 million years ago in what is now Mongolia.
Lead author, Stephan Lautenschlager of Bristol’s School of Earth Sciences said: “Our results suggest that therizinosaurs would have used their well-developed sensory repertoire to their advantage which, for herbivorous animals, must have played an important role in foraging, in the evasion of predators or in social complexity.
“This study sheds a new light on the evolution of dinosaur senses and shows it is more complex than we thought.”
Co-author, Professor Lindsay Zanno of the North Carolina Museum of Natural History and the North Carolina State University agrees: “Once you’ve evolved a good sensory toolkit, it’s probably worth hanging on to, whether you’re hunting or being hunted.”
Fellow author Lawrence Witmer, Chang Professor of Paleontology at the Ohio University Heritage College of Osteopathic Medicine said: “Of course the actual brain tissue is long gone from the fossil skulls but we can use CT scanning to visualize the cavity that the brain once occupied and then generate 3D computer renderings of the olfactory bulbs and other brain parts.”
This study has important ramifications for our understanding of how sensory function evolved in different dinosaur groups and whether it was developed as a response to their environment or simply inherited by their ancestors. In particular, in the light of the transition from dinosaurs to birds, these results should prove to be very interesting.
Note: The above story is reprinted from materials provided by University of Bristol.
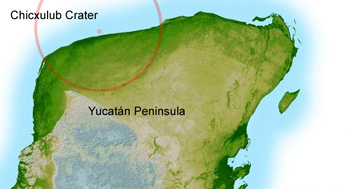
A new CU-Boulder study shows that an asteroid believed to have smacked Earth some 66 million years ago likely caused a global firestorm that led to extensive plant and animal extinctions. (Credit: Illustration courtesy NASA/JPL)
A new look at conditions after a Manhattan-sized asteroid slammed into a region of Mexico in the dinosaur days indicates the event could have triggered a global firestorm that would have burned every twig, bush and tree on Earth and led to the extinction of 80 percent of all Earth’s species, says a new University of Colorado Boulder study.Led by Douglas Robertson of the Cooperative Institute for Research in Environmental Sciences, or CIRES, the team used models that show the collision would have vaporized huge amounts of rock that were then blown high above Earth’s atmosphere. The re-entering ejected material would have heated the upper atmosphere enough to glow red for several hours at roughly 2,700 degrees Fahrenheit — about the temperature of an oven broiler element — killing every living thing not sheltered underground or underwater.
The CU-led team developed an alternate explanation for the fact that there is little charcoal found at the Cretaceous-Paleogene, or K-Pg, boundary some 66 million years ago when the asteroid struck Earth and the cataclysmic fires are believed to have occurred. The CU researchers found that similar studies had corrected their data for changing sedimentation rates. When the charcoal data were corrected for the same changing sedimentation rates they show an excess of charcoal, not a deficiency, Robertson said.
“Our data show the conditions back then are consistent with widespread fires across the planet,” said Robertson, a research scientist at CIRES, which is a joint institute of CU-Boulder and the National Oceanic and Atmospheric Administration. “Those conditions resulted in 100 percent extinction rates for about 80 percent of all life on Earth.”
A paper on the subject was published online this week in the Journal of Geophysical Research-Biogeosciences, a publication of the American Geophysical Union. Co-authors on the study include CIRES Interim Director William Lewis, CU Professor Brian Toon of the atmospheric and oceanic sciences department and the Laboratory for Atmospheric and Space Physics and Peter Sheehan of the Milwaukee Public Museum in Wisconsin.
Geological evidence indicates the asteroid collided with Earth about 66 million years ago and carved the Chicxulub crater in Mexico’s Yucatan Peninsula that is more than 110 miles in diameter. In 2010, experts from 33 institutions worldwide issued a report that concluded the impact at Chicxulub triggered mass extinctions, including dinosaurs, at the K-Pg boundary.
The conditions leading to the global firestorm were set up by the vaporization of rock following the impact, which condensed into sand-grain-sized spheres as they rose above the atmosphere. As the ejected material re-entered Earth’s atmosphere, it dumped enough heat in the upper atmosphere to trigger an infrared “heat pulse” so hot it caused the sky to glow red for several hours, even though part of the radiation was blocked from Earth by the falling material, he said.
But there was enough infrared radiation from the upper atmosphere that reached Earth’s surface to create searing conditions that likely ignited tinder, including dead leaves and pine needles. If a person was on Earth back then, it would have been like sitting in a broiler oven for two or three hours, said Robertson.
The amount of energy created by the infrared radiation the day of the asteroid-Earth collision is mind-boggling, said Robertson. “It’s likely that the total amount of infrared heat was equal to a 1 megaton bomb exploding every four miles over the entire Earth.”
A 1-megaton hydrogen bomb has about the same explosive power as 80 Hiroshima-type nuclear bombs, he said. The asteroid-Earth collision is thought to have generated about 100 million megatons of energy, said Robertson.
Some researchers have suggested that a layer of soot found at the K-Pg boundary layer roughly 66 million years ago was created by the impact itself. But Robertson and his colleagues calculated that the amount of soot was too high to have been created during the massive impact event and was consistent with the amount that would be expected from global fires.
Note: The above story is reprinted from materials provided by University of Colorado at Boulder.
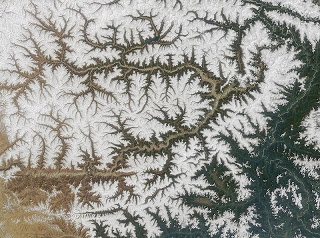
Dendritic drainage: the Yarlung Tsangpo River, Tibet, seen from space: snow cover has melted in the valley system.
Introduction
In geomorphology, a drainage system is the pattern formed by the streams, rivers, and lakes in a particular drainage basin. They are governed by the topography of the land, whether a particular region is dominated by hard or soft rocks, and the gradient of the land. Geomorphologists and hydrologists often view streams as being part of drainage basins. A drainage basin is the topographic region from which a stream receives runoff, through flow, and groundwater flow. Drainage basins are divided from each other by topographic barriers called a watershed. A watershed represents all of the stream tributaries that flow to some location along the stream channel. The number, size, and shape of the drainage basins found in an area varies and the larger the topographic map, the more information on the drainage basin is available.
Drainage patterns
According to the configuration of the channels, drainage systems can fall into one of several categories known as drainage patterns. Drainage patterns depend on the topography and geology of the land.
Accordant drainage pattern
A drainage system is described as accordant if its pattern correlates to the structure and relief of the landscape over which it flows.
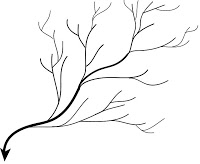
Dendritic drainage pattern
Dendritic drainage pattern
Dendritic drainage systems (from Greek δενδρίτης, dendrites, “of or pertaining to a tree”) are the most common form of drainage system. In a dendritic system, there are many contributing streams (analogous to the twigs of a tree), which are then joined together into the tributaries of the main river (the branches and the trunk of the tree, respectively). They develop where the river channel follows the slope of the terrain. Dendritic systems form in V-shaped valleys; as a result, the rock types must be impervious and non-porous.
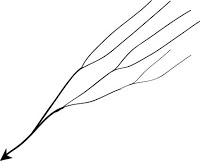
Parallel drainage pattern
Parallel drainage pattern
A parallel drainage system is a pattern of rivers caused by steep slopes with some relief. Because of the steep slopes, the streams are swift and straight, with very few tributaries, and all flow in the same direction. This system forms on uniformly sloping surfaces, for example, rivers flowing southeast from the Aberdare Mountains in Kenya.
Trellis drainage pattern
Trellis drainage pattern
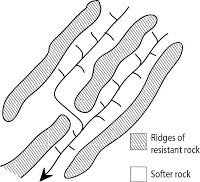
The geometry of a trellis drainage system is similar to that of a common garden trellis used to grow vines. Asthe river flows along a strike valley, smaller tributaries feed into it from the steep slopes on the sides of mountains. These tributaries enter the main river at approximately 90 degree angles, causing a trellis-like appearance of the drainage system. Trellis drainage is characteristic of folded mountains, such as the Appalachian Mountains in North America.
Rectangular drainage pattern
Rectangular drainage patternRectangular drainage develops on rocks that are of approximately uniform resistance to erosion, but which have two directions of jointing at approximately right angles. The joints are usually less resistant to erosion than the bulk rock so erosion tends to preferentially open the joints and streams eventually develop along the joints. The result is a stream system in which streams consist mainly of straight line segments with right angle bends and tributaries join larger streams at right angles.
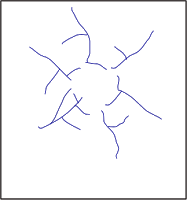
Radial drainage pattern
Radial drainage patterngeological features on which radial drainage commonly develops are domes and laccoliths. On these features the drainage may exhibit a combination of radial and annular patterns.
In a radial drainage system, the streams radiate outwards from a central high point. Volcanos usually display excellent radial drainage. Other
Centripetal drainage pattern
Centripetal drainage systems are similar to radial drainage systems except the rivers flow in the opposite direction. They drain from the sides of hills to a central depression[2] where a lake is formed.[4] This is common in western and south-western US, where centripetal drainage systems form intermittent lakes. These lakes leave behind salt flats when they evaporate during dry seasons.
Deranged drainage pattern
Deranged drainage pattern
A deranged drainage system is a drainage system in drainage basins where there is no coherent pattern to the rivers and lakes. It happens in areas where there has been much geological disruption. The classic example is the Canadian Shield. During the last ice age, the topsoil was scraped off, leaving mostly bare rock. The melting of the glaciers left land with many irregularities of elevation, and a great deal of water to collect in the low points, explaining the large number of lakes which are found in Canada. The watersheds are young and are still sorting themselves out. Eventually the system will stabilize.
Annular drainage pattern
Annular drainage pattern
In an annular drainage pattern streams follow a roughly circular or concentric path along a belt of weak rock, resembling in plan a ringlike pattern. It is best displayed by streams draining a maturely dissected structural dome or basin where erosion has exposed rimming sedimentary strata of greatly varying degrees of hardness, as in the Red Valley, which nearly encircles the domal structure of the Black Hills of South Dakota.
Note : The above story is reprinted from materials provided by Wikipedia
Mar. 20, 2013 — The first red alga genome has just been sequenced by an international team coordinated by CNRS and UPMC at the Station Biologique de Roscoff (Brittany), notably involving researchers from CEA-Genoscope, the universities of Lille 1 and Rennes 1 and the Muséum National d’Histoire Naturelle. The genome of Chondrus crispus, also known by the Breton name ‘pioka’, turns out to be small and compact for a multicellular organism. It has fewer genes than several other species of unicellular algae, which raises a number of questions about the evolution of red algae. This low number of genes could explain why these organisms never colonized dry land, unlike their green counterparts-from which all terrestrial plants are descended. These findings open up new perspectives on the natural history of algae and of terrestrial plants.
They are published online in the journal PNAS on March 11th 2013.
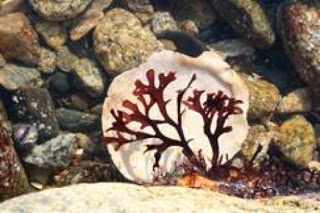
Chondrus crispus is a multicellular red alga of about 20 cm in length. It is very common on the rocky coasts of the North Atlantic where it plays an essential role as a primary producer in these ecosystems. Certain red algae are now used in the agri-food industry for the thickening properties of the carrageenans from their cell walls. These sulfated polysaccharides correspond to the food additive E-407, which goes into many desserts and other dishes. Beyond industrial applications, this first sequencing of a red alga genome sheds new light on plant evolution as a whole.
The Chondrus genome had some surprises in store for the researchers. With only 9,606 genes and 105 million base pairs, it is indeed very small for a multicellular organism. By way of comparison, the unicellular green alga Chlamydomonas reinhardtii has 14,516 genes, while the multicellular terrestrial plant Arabadopsis thaliana has 27,416. The Chondrus genome is also very compact, with each function generally corresponding to a single gene. Gene families are small, and genes closely spaced.
To explain these surprising characteristics, the researchers proposed the hypothesis that, more than a billion years ago, red algae experienced a massive loss of genetic material as a result of extreme environmental conditions. This dramatic event in their evolutionary history would have had many consequences. One result could be the loss of flagellar genes, still present in most other organisms and responsible for the motility of certain cells (such as the gametes during sexual reproduction in most organisms, including humans).
Had this massive gene loss never occurred, red algae might have extensively colonized the terrestrial environment, in the same way as green algae, which are the ancestors of all land plants. Yet this event-a real evolutionary bottleneck-has denied red algae the plasticity and genetic potential necessary to adapt to life on land.
The sequence of the Chondrus genome thus opens the archives of more than 1,500 million years of evolutionary history of terrestrial and marine plants. It provides a new basis for the study of red algae biology and is the first step in a program aiming to improve our understanding of the origin of life on Earth, the adaptation of red algae to their environment and the biosynthesis pathways of biomolecules of interest, such as carrageenans. The scientists of the group are also hoping to discover new enzymes of interest for marine biotechnology.
Note : The above story is reprinted from materials provided by CNRS (Délégation Paris Michel-Ange), via AlphaGalileo.
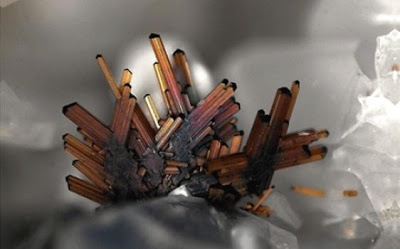
“We can identify the rock from which the rutile originates, even if we only have a tiny grain of rutile,” says researcher Thomas Zack, University of Gothenburg. (Credit: Image courtesy of University of Gothenburg)
Mar. 25, 2013 — Researchers can use the mineral rutile to learn about rock types and their history. Two articles published in the journal Geology now present a new application of a method for more easily tracing the mineral rutile. The co-authors of the articles are researchers at the University of Gothenburg.Rutile is used in ceramics and paints, but is particularly useful for finding out about the history of a rock.
Where mineral deposits are found, rutile is often also present. The new methods therefore bring opportunities for strategies to find other mineral deposits, such as gold.
Until now, rutile has been a relatively unknown mineral, despite not being rare. For example, rutile can be found on most sandy beaches around the world, including in Sweden.
“It’s incredible to see how little attention was paid to rutile until around five years ago,” says geologist and researcher Thomas Zack, from the University of Gothenburg’s Department of Earth Sciences, who has devoted much of his scientific career to studying the mineral.
Now, geologists can identify rock types containing rutile and follow the changes in temperature and pressure that they have been exposed to throughout its history, even if rutile is barely visible to the naked eye. Previously, researchers had to investigate considerably more rutile-bearing samples in order to carry out analyses.
“But now we can identify the rock from which the rutile originates, even if we only have a tiny grain of rutile,” adds Thomas Zack.
The new method is called “Laser Ablation ICP-MS,” and produces results much faster than previous methods.
“In analytical terms, this is one of the most important analytical instruments at the Department of Earth Sciences here in Gothenburg,” concludes Thomas Zack.
Note : The above story is reprinted from materials provided by University of Gothenburg, via AlphaGalileo.
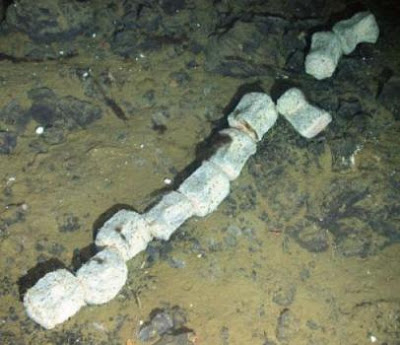
This shows the backbone of a whale skeleton on seafloor. (Credit: UK Natural Environment Research Council ChEsSo Consortium)
Mar. 18, 2013 — Marine biologists have, for the first time, found a whale skeleton on the ocean floor near Antarctica, giving new insights into life in the sea depths. The discovery was made almost a mile below the surface in an undersea crater and includes the find of at least nine new species of deep-sea organisms thriving on the bones.
The research, involving the University of Southampton, Natural History Museum, British Antarctic Survey, National Oceanography Centre (NOC) and Oxford University, is published today in Deep-Sea Research II: Topical Studies in Oceanography.
“The planet’s largest animals are also a part of the ecology of the very deep ocean, providing a rich habitat of food and shelter for deep sea animals for many years after their death,” says Diva Amon, lead author of the paper based at University of Southampton Ocean and Earth Science (which is based at NOC) and the Natural History Museum. “Examining the remains of this southern Minke whale gives insight into how nutrients are recycled in the ocean, which may be a globally important process in our oceans.”
Worldwide, only six natural whale skeletons have ever been found on the seafloor. Scientists have previously studied whale carcasses, known as a ‘whale fall’, by sinking bones and whole carcasses. Despite large populations of whales in the Antarctic, whale falls have not been studied in this region until now.
“At the moment, the only way to find a whale fall is to navigate right over one with an underwater vehicle,” says co-author Dr Jon Copley of University of Southampton Ocean and Earth Science. Exploring an undersea crater near the South Sandwich Islands gave scientists just that chance encounter. “We were just finishing a dive with the UK’s remotely operated vehicle, Isis, when we glimpsed a row of pale-coloured blocks in the distance, which turned out to be whale vertebrae on the seabed,” continues Dr Copley.
When a whale dies and sinks to the ocean floor, scavengers quickly strip its flesh. Over time, other organisms then colonise the skeleton and gradually use up its remaining nutrients. Bacteria break down the fats stored in whale bones, for example, and in turn provide food for other marine life. Other animals commonly known as zombie worms can also digest whale bone.
“One of the great remaining mysteries of deep ocean biology is how these tiny invertebrates can spread between the isolated habitats these whale carcasses provide on the seafloor,” says co-author Dr Adrian Glover at the Natural History Museum. ‘Our discovery fills important gaps in this knowledge.’
The team surveyed the whale skeleton using high-definition cameras to examine the deep-sea animals living on the bones and collected samples to analyse ashore. Researchers think that the skeleton may have been on the seafloor for several decades. Samples also revealed several new species of deep-sea creatures thriving on the whale’s remains, including a ‘bone-eating zombie worm’ known as Osedax burrowing into the bones and a new species of isopod crustacean, similar to woodlice, crawling over the skeleton. There were also limpets identical to those living at nearby deep-sea volcanic vents.
Note :The above story is reprinted from materials provided by National Oceanography Centre.
Feb. 7, 2013 — The demise of the dinosaurs is the world’s ultimate whodunit. Was it a comet or asteroid impact? Volcanic eruptions? Climate change?In an attempt to resolve the issue, scientists at the Berkeley Geochronology Center (BGC), the University of California, Berkeley, and universities in the Netherlands and the United Kingdom have now determined the most precise dates yet for the dinosaur extinction 66 million years ago and for the well-known impact that occurred around the same time.
Team leader Paul Renne in Montana collecting a volcanic ash sample from a coal bed within a few centimeters of the dinosaur extinction horizon. Photo by Courtney Sprain.
The dates are so close, the researchers say, that they now believe the comet or asteroid, if not wholly responsible for the global extinction, at least dealt the dinosaurs their death blow.
“The impact was clearly the final straw that pushed Earth past the tipping point,” said Paul Renne, BGC director and UC Berkeley professor in residence of earth and planetary science. “We have shown that these events are synchronous to within a gnat’s eyebrow, and therefore the impact clearly played a major role in extinctions, but it probably wasn’t just the impact.”
The revised dates clear up lingering confusion over whether the impact actually occurred before or after the extinction, which was characterized by the almost overnight disappearance from the fossil record of land-based dinosaurs and many ocean creatures. The new date for the impact — 66,038,000 years ago — is the same within error limits as the date of the extinction, said Renne, making the events simultaneous.
He and his colleagues will report their findings in the Feb. 8 issue of the journal Science.
The crater of doom
The extinction of the dinosaurs was first linked to a comet or asteroid impact in 1980 by the late UC Berkeley Nobel Laureate Luis Alvarez and his son, Walter, who is a UC Berkeley professor emeritus of earth and planetary science. A 110-mile-wide crater in the Caribbean off the Yucatan coast of Mexico is thought to be the result of that impact. Called Chicxulub (cheek’-she-loob), the crater is thought to have been excavated by an object six miles across that threw into the atmosphere debris still be found around the globe as glassy spheres or tektites, shocked quartz and a layer of iridium-enriched dust.
Renne’s quest for a more accurate dating of the extinction began three years ago when he noticed that the existing date conflicted with other estimates of the timing of the extinction and that the existing dates for the impact and the extinction did not line up within error margins.
Renne and his BGC colleagues first went to work recalibrating and improving the existing dating method,
A comet or asteroid impact 66 million years ago excavated a 110 mile-diameter crater, dubbed Chicxulub, centered off the coast of Mexico’s Yucatan peninsula. Courtesy of Wikipedia.
known as the argon-argon technique. They then collected volcanic ash from the Hell Creek area in Montana and analyzed them with the recalibrated argon-argon technique to determine the date of the extinction. The formation below the extinction horizon is the source of many dinosaur fossils and one of the best sites to study the change in fossils from before and after the extinction.
They also gathered previously dated tektites from Haiti and analyzed them using the same technique to determine how long ago the impact had occurred. The new extinction and impact dates are precise to within 11,000 years, the researchers said.
“When I got started in the field, the error bars on these events were plus or minus a million years,” said paleontologist William Clemens, a UC Berkeley professor emeritus of integrative biology who has led research in the Hell Creek area for more than 30 years, but was not directly involved in the study. “It’s an exciting time right now, a lot of which we can attribute to the work that Paul and his colleagues are doing in refining the precision of the time scale with which we work. This allows us to integrate what we see from the fossil record with data on climate change and changes in flora and fauna that we see around us today.”
Dinosaurs at the tipping point
Despite the synchronous impact and extinction, Renne cautions that this doesn’t mean that the impact was the sole cause. Dramatic climate variation over the previous million years, including long cold snaps amidst a general Cretaceous hothouse environment, probably brought many creatures to the brink of extinction, and the impact kicked them over the edge.
“These precursory phenomena made the global ecosystem much more sensitive to even relatively small triggers, so that what otherwise might have been a fairly minor effect shifted the ecosystem into a new state,” he said. “The impact was the coup de grace.”
One cause of the climate variability could have been a sustained series of volcanic eruptions in India that produced the extensive Deccan Traps. Renne plans to re-date those volcanic rocks to get a more precise measure of their duration and onset relative to the dinosaur extinction.
“This study shows the power of high precision geochronology,” said coauthor Darren F. Mark of the Scottish Universities Environmental Research Center, who conducted independent argon-argon analyses on samples provided by Renne. “Many people think precision is just about adding another decimal place to a number. But it’s far more exciting than that. It’s more like getting a sharper lens on a camera. It allows us to dissect the geological record at greater resolution and piece together the sequence of Earth history.”
Renne’s colleagues, in addition to Mark, are UC Berkeley graduate student William S. Mitchell III; BGC scientists Alan L. Deino and Roland Mundil; Leah E. Morgan of the Scottish Universities Environmental Research Center in Kilbride, Scotland; Frederik J Hilgen of Utrecht University; and Klaudia F. Kuiper and Jan Smit of Vrije University in Amsterdam.
The work was supported by the Ann and Gordon Getty Foundation, UC Berkeley’s Esper S. Larsen Jr. Fund and the National Science Foundation.
Note : The above story is reprinted from materials provided by University of California – Berkeley. The original article was written by Robert Sanders.
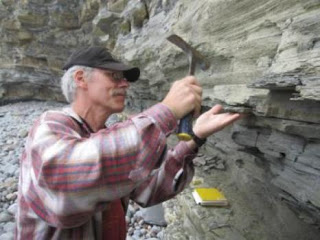
Along sea cliffs in southern England, geologist Paul Olsen of Columbia University’s Lamont-Doherty Earth Observatory samples rocks from near the 201,564,000-year Triassic extinction boundary. (Credit: Kevin Krajick/Earth Institute)
Mar. 21, 2013 — Scientists examining evidence across the world from New Jersey to North Africa say they have linked the abrupt disappearance of half of earth’s species 200 million years ago to a precisely dated set of gigantic volcanic eruptions. The eruptions may have caused climate changes so sudden that many creatures were unable to adapt — possibly on a pace similar to that of human-influenced climate warming today. The extinction opened the way for dinosaurs to evolve and dominate the planet for the next 135 million years, before they, too, were wiped out in a later planetary cataclysm.
In recent years, many scientists have suggested that the so-called End-Triassic Extinction and at least four other known past die-offs were caused at least in part by mega-volcanism and resulting climate change. However, they were unable to tie deposits left by eruptions to biological crashes closely in time. This study
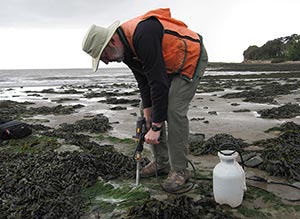
Geologist Dennis Kent of Lamont-Doherty Earth Observatory drills into rocks near a layer where fossils of half the species of life on earth suddenly vanish, at 201,564,000 years ago.
provides the tightest link yet, with a newly precise date for the ETE–201,564,000 years ago, exactly the same time as a massive outpouring of lava. “This may not quench all the questions about the exact mechanism of the extinction itself. However, the coincidence in time with the volcanism is pretty much ironclad,” said coauthor Paul Olsen, a geologist at Columbia University’s Lamont-Doherty Earth Observatory who has been investigating the boundary since the 1970s.
The new study unites several pre-existing lines of evidence by aligning them with new techniques for dating rocks. Lead author Terrence Blackburn (then at Massachusetts Institute of Technology; now at the Carnegie Institution) used the decay of uranium isotopes to pull exact dates from basalt, a rock left by eruptions. The basalts analyzed in the study all came from the Central Atlantic Magmatic Province (CAMP), a series of huge eruptions known to have started around 200 million years ago, when nearly all land was massed into one huge continent. The eruptions spewed some 2.5 million cubic miles of lava in four sudden spurts over a 600,000-year span, and initiated a rift that evolved into the Atlantic Ocean; remnants of CAMP lavas are found now in North and South America, and North Africa. The scientists analyzed samples from what are now Nova Scotia, Morocco and the New York City suburbs. (Olsen hammered one from a road cut in the Hudson River Palisades, about 1,900 feet from the New Jersey side of the George Washington Bridge.)
Previous studies have suggested a link between the CAMP eruptions and the extinction, but other researchers’ dating of the basalts had a margin of error of 1 to 3 million years. The new margin of error is only a few thousand years — in geology, an eye blink. Blackburn and his colleagues showed that the eruption in Morocco was the earliest, with ones in Nova Scotia and New Jersey coming about 3,000 and 13,000 years later, respectively. Sediments below that time contain pollen, spores and other fossils characteristic of the Triassic era; in those above, the fossils disappear. Among the creatures that vanished were eel-like fish called conodonts, early crocodilians, tree lizards and many broad-leaved plants. The dating is further strengthened by a layer of sediment just preceding the extinction containing mineral grains providing evidence of one of earth’s many periodic reversals of magnetic polarity. This particular reversal, labeled E23r, is consistently located just below the boundary, making it a convenient marker, said coauthor Dennis Kent, a paleomagnetism expert who is also at Lamont-Doherty. With the same layers found everywhere the researchers have looked so far, the eruptions “had to be a hell of an event,” said Kent.
The third piece of chronological evidence is the sedimentary layers themselves. Sedimentary rocks cannot be dated directly — one reason why the timing of the extinction has been hard to nail. Olsen and some others have long contended that Earth’s precession — a cyclic change in the orientation of the axis toward the sun and resulting temperature changes — consistently created layers reflecting the alternate filling and drying of large lake basins on a fairly steady 20,000-year schedule. This idea is well accepted for more recent time, but many scientists have had doubts about whether it could be applied much farther back. By correlating the precisely dated basalts with surrounding sedimentary layers, the new study shows that precession operated pretty much the same way then, allowing dates with a give or take of 20,000 years to be assigned to most sediments holding fossils, said Olsen.
Olsen has painstakingly cataloged the layers around the time of the End Triassic, and the initial phase of the
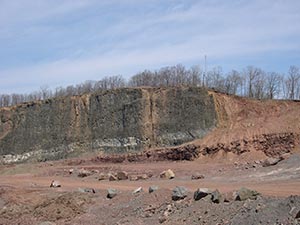
In suburban Clifton, New Jersey, a massive basalt flow (black rock, left) from the time of the End Triassic Extinction lies exposed in a former rock quarry, now behind a retirement home. A thin layer of sedimentary rock mostly covered in debris, at far right, records the sudden disappearance of many creatures.
extinction occurs in just one layer — meaning the event took 20,000 years at most. But, he said, “it could have taken much less. This is the level of resolution we have now, but it’s the ‘less’ part that is the more important, and that’s what we are working on now.”
Many scientists assume that giant eruptions would have sent sulfurous particles into the air that darkened the skies, creating a multi-year winter that would have frozen out many creatures. A previous study by Kent and Rutgers University geochemist Morgan Schaller has also shown that each pulse of volcanism doubled the air’s concentration of carbon dioxide — a major component of volcanic gases. Following the cold pulses, the warming effects of this greenhouse gas would have lasted for millennia, wiping out creatures that could not take too much heat. (It was already quite hot to begin with at that time; even pre-eruption CO2 levels were higher than those of today.) Fossils show that heat-sensitive plants especially suffered; there is also evidence that the increased CO2 caused chemical reactions that made the oceans more acidic, causing populations of shell-building creatures to collapse. As if this were not enough, there is also some evidence that a large meteorite hit Earth at the time of the extinction–but that factor seems far less certain. A much stronger case has been made for the extinction of the dinosaurs by a meteorite some 65 million years ago — an event that opened the way for the evolution and dominance of mammals, including human beings. Volcanism may have been involved in that extinction as well, with the meteorite delivering the final blow.)
The End Triassic was the fourth known global die-off; the extinction of the dinosaurs was the fifth. Today, some scientists have proposed that we are on the cusp of a sixth, humanmade, extinction. Explosive human population growth, industrial activity and exploitation of natural resources are rapidly pushing many species off the map. Burning of fossil fuels in particular has had an effect, raising the air’s CO2 level more than 40 percent in just 200 years — a pace possibly as fast, or faster, than that of the End Triassic. Resulting temperatures increases now appear to be altering ecosystems; and CO2 entering seawater is causing what could be the fastest ongoing acidification of the oceans for at least the last 300 million years, according to a 2012 study. “In some ways, the End Triassic Extinction is analogous to today,” said Blackburn. “It may have operated on a similar time scale. Much insight on the possible future impact of doubling atmospheric CO2 on global temperatures, ocean acidity and life on earth may be gained by studying the geologic record.”
Paul Renne, a researcher at the Berkeley Geochronology Center in California, who studies the End Triassic but was not involved in the Science paper, said the study was “part of a growing pattern in which we see that the major ecosystem crises were triggered” by volcanism. He said the new data “make the case stronger than it was. … The pendulum continues to swing in favor of that idea.” Of the actual mechanism that killed creatures, he said climate change was the most popular suspect. But, he added, “We still don’t have any way yet of knowing exactly how much CO2 was put into the atmosphere at that time, and what it did. If we did, we would then be able to say to people, ‘Look folks, this is what we’re facing now, and here’s what we have to do about it. But we don’t know that yet.”
Note : The above story is reprinted from materials provided by The Earth Institute at Columbia University.
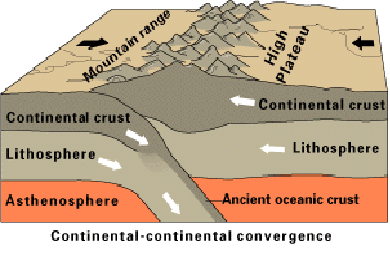
Continental collision is a phenomenon of the plate tectonics of Earth that occurs at convergent boundaries. Continental collision is a variation on the fundamental process of subduction, whereby the subduction zone is destroyed, mountains produced, and two continents sutured together. Continental collision is known only from this planet and is an interesting example of how our different crusts, oceanic and continental, behave during subduction.
Continental collision is not an instantaneous event, but may take several tens of millions of years before the faulting and folding caused by collision stop. Collision between India and Asia has been going on for about 50 million years already and shows no signs of abating. Collision between East and West Gondwana to form the East African Orogen took about 100 million years from beginning (610 Ma) to end (510 Ma). Collision between Gondwana and Laurasia to form Pangea occurred in a relatively brief interval, about 50 million years long.
Subduction zone: the collision site
The process begins as two continents (different bits of continental crust), separated across a tract of ocean (and oceanic crust), approach each other, while the oceanic crust is slowly consumed at a subduction zone.
The subduction zone runs along the edge of one of the continents and dips under it, raising volcanic mountain chains at some distance behind it, such as the Andes of South America today. Subduction involves the whole lithosphere, the density of which is largely controlled by the nature of the crust it carries.
Oceanic crust is thin (~6 km thick) and dense (about 3.3 g/cm³), consisting of basalt, gabbro, and peridotite. Consequently, most oceanic crust is subducted easily at an oceanic trench. In contrast, continental crust is thick (~45 km thick) and buoyant, composed mostly of granitic rocks (average density about 2.5 g/cm³). Continental crust is subducted with difficulty, but is subducted to depths of 90-150 km or more, as evidenced by ultra-high pressure (UHP) metamorphic suites.
Normal subduction continues as long as the ocean exists, but the subduction system is disrupted as the continent carried by the downgoing plate enters the trench. Because it contains thick continental crust, this lithosphere is less dense than the underlying asthenospheric mantle and normal subduction is disrupted.
The volcanic arc on the upper plate is slowly extinguished. Resisting subduction, the crust buckles up and under, raising mountains where a trench used to be. The position of the trench becomes a zone that marks the suture between the two continental terranes. Suture zones are often marked by fragments of the pre-existing oceanic crust and mantle rocks, known as ophiolites.
Deep subduction of continental crust
The continental crust on the downgoing plate is deeply subducted as part of the downgoing plate during collision, defined as buoyant crust entering a subduction zone. An unknown proportion of subducted continental crust returns to the surface as ultra-high pressure (UHP) metamorphic terranes, which contain metamorphic coesite and/or diamond plus or minus unusual silicon-rich garnets and/or potassium-bearing pyroxenes.
The presence of these minerals demonstrate subduction of continental crust to at least 90–140 km deep. Examples of UHP terranes are known from the Dabie–Sulu belt of east-central China, the Western Alps, the Himalaya of India, the Kokchetav Massif of Kazakhstan, the Bohemian Massif of Europe, the Western Gneiss Region of Norway, and Mali. Most UHP terranes consist of an imbricated sheets or nappes.
The fact that most UHP terranes consist of thin sheets suggests that much thicker, volumetrically dominant tracts of continental crust are more deeply subducted.
Orogeny and collapse
An orogeny is underway when mountains begin to grow in the collision zone. There are other modes of mountain formation and orogeny but certainly continental collision is one of the most important. Rainfall and snowfall increase on the mountains as these rise, perhaps at a rate of a few millimeters per year (at a growth rate of 1 mm/year, a 5,000 m tall mountain can form in 5 million years, a time period that is less than 10% of the life of a typical collision zone). River systems form, and glaciers may grow on the highest peaks.
Erosion accelerates as the mountains rise, and great volumes of sediment are shed into the rivers, which carry sediment away from the mountains to be deposited in sedimentary basins in the surrounding lowlands. Crustal rocks are thrust faulted over the sediments and the mountain belt broadens as it rises in height. A crustal root also develops, as required by isostasy; mountains can be high if underlain by thicker crust.
Mountain formation by a reverse fault movement
Crustal thickening may happen as a result of crustal shortening or when one crust overthrusts the other. Thickening is accompanied by heating, so the crust becomes weaker as it thickens. The lower crust begins to flow and collapse under the growing mountain mass, forming rifts near the crest of the mountain range. The lower crust may partially melt, forming anatectic granites which then rise into the overlying units, forming granite intrusions.
Crustal thickening provides one of two negative feedbacks on mountain growth in collision zones, the other being erosion. The popular notion that erosion is responsible for destroying mountains is only half correct – viscous flow of weak lower mantle also reduces relief with time, especially once the collision is complete and the two continents are completely sutured. Convergence between the continents continues because the crust is still being pulled down by oceanic lithosphere sinking in the subduction zone to either side of the collision as well as beneath the impinging continent.
The pace of mountain building associated with the collision is measured by radiometric dating of igneous rocks or units that have been metamorphosed during the collision and by examining the record of sediments shed from the rising mountains into the surrounding basins. The pace of ancient convergence can be determined with paleomagnetic measurements, while the present rate of convergence can be measured with GPS.
Note : The above story is reprinted from materials provided by Wikipedia.
The Schlumberger Oilfield Glossary is now available as a free Apple ; iPhone, iPod touch, and iPad app via iTunes.
The Oilfield Glossary contains definitions for more than 4,600 industry terms refined by technical experts. Respected as a publicly available resource on the Web, the glossary can now be accessed on the Apple iPhone, iPod touch, and iPad devices.
The iTunes application can be installed in two ways
To install iTunes software on your PC or Mac computer, go to the Apple Web site to download. (Please note that iTunes software must be installed on your computer to download the app.)
Search for “Schlumberger Oilfield Glossary” in the iTunes App Store from your iPhone.
Finding a term is quick and easy
The user interface is intuitive and has been optimized for search. You can search for a specific term or browse the entire glossary. To search for a specific term, such as “waveform,” or search for part of a term name, such as “wave,” simply enter the text in the “Search for Term” box on the first page and press the “Search” button. A short list of terms will be displayed.
To browse the entire glossary, leave the Search box blank and press the Search button. All terms in the glossary will display. You can then jump to terms beginning with a specific letter or use discipline and image filters to narrow the results.
Accessing the glossary on the go
Whether you are looking up a term during a conference, at the wellsite, or in the office, the application has been streamlined to take full advantage of the mobile device’s capabilities. Support for other mobile devices is being explored, and users can still access the Oilfield Glossary using mobile Web browsers.
For more information or help installing the application on your device, please send an e-mail to: [email protected]