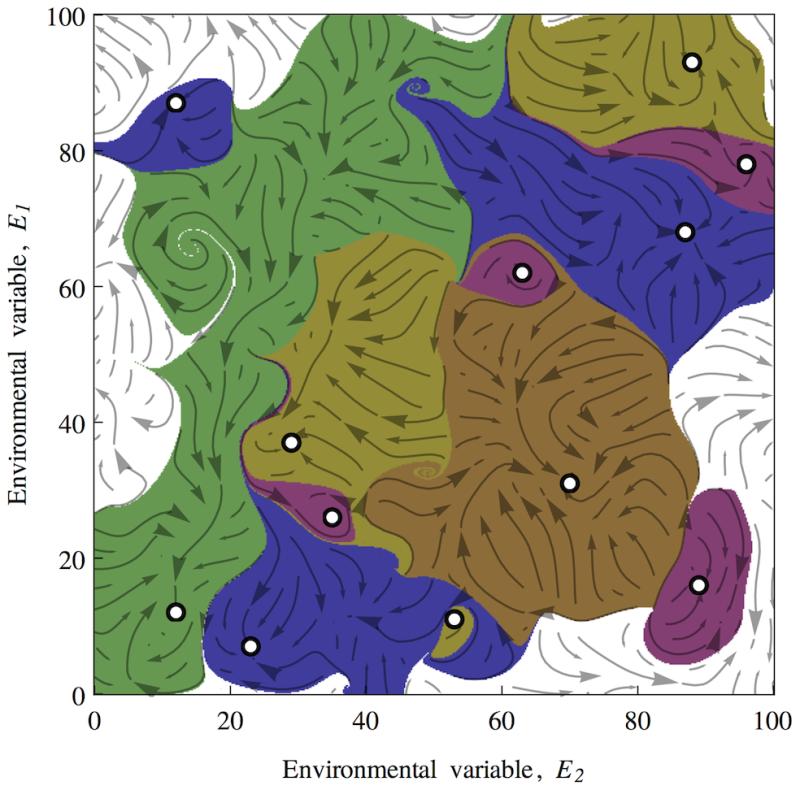
Phase portrait of a two environmental variable system where is in the very large limit, essential range = 100, niche function width = 5. Stable points, are indicated by circles. The basins of attraction which lead to these points are indicated by the different coloured enclosing regions, while initial conditions which would leave the essential range of are coloured white. Environmental variables do not necessarily move immediately towards stable points. doi:10.1371/journal.pcbi.1003050.g007 (Credit: James G. Dyke, Iain S. Weaver. The Emergence of Environmental Homeostasis in Complex Ecosystems. PLoS Computational Biology, 2013; 9 (5): e1003050 DOI: 10.1371/journal.pcbi.1003050)
Researchers at the University of Southampton have proposed an answer to the long-running debate as to how stable the Earth system is.
Earth, with its core-driven magnetic field, oceans of liquid water, dynamic climate and abundant life is arguably the most complex system in the known Universe. Life arose on Earth over three and a half billion years ago and it would appear that despite planetary scale calamities such as the impacts of massive meteorites, runaway climate change and increases in brightness of the Sun, it has continued to grow, reproduce and evolve ever since.
Has life on Earth simply been lucky in withstanding these events or are there any self-stabilising processes operating in the Earth system that would reduce the severity of such perturbations? If such planetary processes exist, to what extent are they the result of the actions of life?
Forty years ago James Lovelock formulated his Gaia Hypothesis in which life controls aspects of the planet and in doing so maintains conditions that are suitable for widespread life despite shocks and perturbations. This hypothesis was and remains controversial in part because there is no understood mechanism by which such a planetary self-stabilising system could emerge.
In research published in PLOS Computational Biology, University of Southampton lecturer Dr James Dyke and PhD student Iain Weaver detail a mechanism that shows how when life is both affected by and alters environmental conditions, then what emerges is a control system that stabilises environmental conditions. This control system was first described around the middle of the 20th Century during the development of the cybernetics movement and has until now been largely neglected. Their findings are in principle applicable to a wide range of real world systems — from microbial mats to aquatic ecosystems up to and including the entire biosphere.
Dr Dyke says: “As well as being a fascinating issue in its own right, we quite desperately need to understand what is currently happening to Earth and in particular the impacts of our own behaviour.
“Pretty much whatever we do, life on Earth will carry on, just as it did for the previous 3.5 billion years or so. It is only by discovering the mechanisms by which our living planet has evolved in the past can we hope to continue to be part of its future.”
Note : The above story is reprinted from materials provided by University of Southampton, via AlphaGalileo.
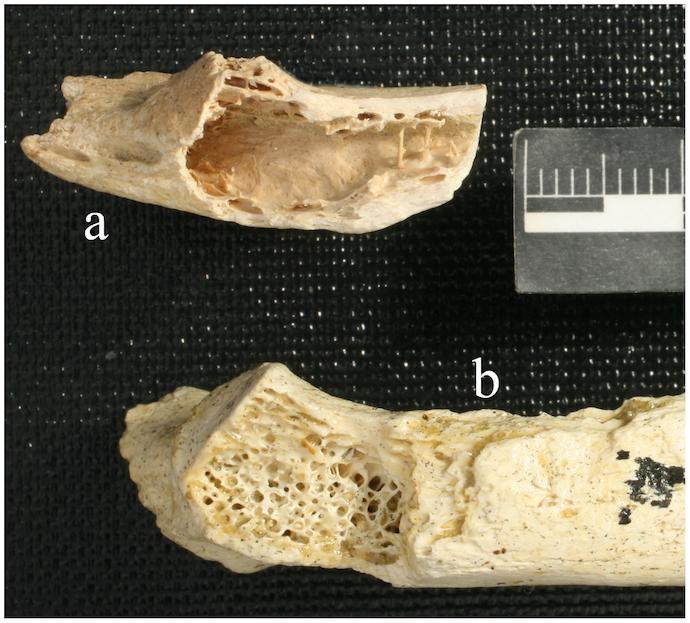
The large lesion is located above the tubercular facet and extends laterally. The trabeculae have been destroyed and the cortex appears expansive. The thin cortical bone forming the superior surface of the cavern was broken away postmortem. (b) Krapina 120.6 shows the normal pattern of bony trabeculae in the medullary space. The surface irregularities are post-mortem. (Credit: Janet Monge et al. Fibrous Dysplasia in a 120,000 Year Old Neandertal from Krapina, Croatia. PLoS ONE, 2013; 8 (6): e64539 DOI: 10.1371/journal.pone.0064539)
The first-known definitive case of a benign bone tumor has been discovered in the rib of a young Neandertal who lived about 120,000 years ago in what is now present-day Croatia. The bone fragment, which comes from the famous archaeological cave site of Krapina, contains by far the earliest bone tumor ever identified in the archaeological record.
Details of the tumor confirmation, announced by an international research team led by Penn Museum Associate Curator and Paleoanthropologist Janet Monge, is available in a research paper, “Fibrous dysplasia in a 120,000+ year old Neandertal from Krapina, Croatia,” in the online scientific journal PLOS ONE.
Joining Dr. Monge on the research team were Morrie Kricun, Department of Radiology, University of Pennsylvania; Jakov Radovcic and Davorka Radovcic, Croatian Natural History Museum; Alan Mann, Department of Anthropology, Princeton University; and David Frayer, Department of Anthropology, University of Kansas.
Bone tumors are exceptionally rare finds in the evolutionary fossil and archaeological records of human prehistory, with the earliest known instances, before now, dating to 1,000 to 4,000 years ago. Primary bone tumors are rare in modern populations, thus, finding a tumor in a fossil so old is a unique discovery.
From a u-CT scan and an X-ray, researchers identified a fibrous dysplastic neoplasm — today, the most common form of benign bone tumor in humans — located on a Neandertal left rib fragment that measured 30 mm (4 ½ inches) long. Judging by the size of the rib fragment, at the end of the rib that joins to the vertebrae, the rib belonged to a young male Neandertal, probably in his teens. Though he died young, and fibrous displasia is a developmental disorder of bone, there are no other known fossils that can be attributed to this individual, and there is not enough evidence to determine if this was or contributed to the cause of his death, according to Dr. Monge.
The confirmation of this tumor, Dr. Monge believes, may have implications for scholars studying the relationship between Neandertals and modern humans. “This tumor may provide another link between Neandertals and modern peoples, links currently being reinforced with genetic and archaeological evidence. Part of our ancestry is indeed with Neandertals — we grow the same way in our bones and teeth and share the same diseases.”
About the Kaprina Archaeological Record and Past Research
Paleoanthropologists continue to debate the exact relationship between homo sapiens, or humans today, and Neandertals — an extinct species who lived throughout Eurasia from as early as 600,000 years to as late as 30,000 years ago. One of the most important early Neandertal sites was discovered in modern-day Croatia in 1899, when Dragutin Gorjanovic-Kramberger, Director of the Geology and Paleontology Department of the National Museum and Professor of Paleontology and Geology at Zagreb University, alerted by a local schoolteacher, first visited the Krapina cave and noted cave deposits, including a chipped stone tool, bits of animal bones, and a single human molar. Beginning that year, and continuing through six years, Gorjanovic-Kramberger and his associates completely, and for that era, carefully, excavated the cave. By 1905, Krapina had yielded more hominid remains than any other site known at the time.
In the 1990s, the Penn Museum was invited to study the radiographic images of the famous Krapina Neandertal fossil bone collection. The team identified 874 human remains, representing more than 75 individuals — the largest such collection of Neandertal remains from one locale. Looking for signs of pathology, disease, and weakness in a group of hominids long thought by many to have “died out” in classic Darwinian survival-of-the-fittest style, the team’s ultimate diagnosis was surprising: these Neandertals were in large part a robust, healthy people. The researchers, Janet Monge among them, shared the results of their studies in a 1999 book, The Krapina Hominids: A Radiographic Atlas of the Skeletal Collection, published by the Republic of Croatia.
Not among the skeletal fossils, however, was the rib now identified as having the bone tumor. At the time of the Krapina excavations, it was mistakenly identified and placed in a faunal collection. In 1986, it was discovered by TD White (University of California, Berkeley) and N Toth (Indiana University, Bloomington) and preliminarily identified as a pathological specimen by M Kricun and J Monge in 1999. It was not until scholars could employ u-CT scans and analysis that the exact nature of the pathology was identified.
Note : The above story is reprinted from materials provided by University of Pennsylvania.
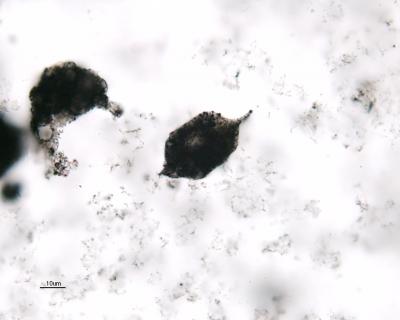
These are spindle-like microstructures from the Farrel Quartzite , Western Australia.Credit: Christopher House, Penn State
Spindle-shaped inclusions in 3 billion-year-old rocks are microfossils of plankton that probably inhabited the oceans around the globe during that time, according to an international team of researchers.
“It is surprising to have large, potentially complex fossils that far back,” said Christopher H. House, professor of geosciences, Penn State, and lead author.
However, the researchers not only showed that these inclusions in the rocks were biological in origin, but also that they were likely planktonic autotrophs — free-floating, tiny ocean organisms that produce energy from their environment.
The researchers looked at marine sediment rocks from the Farrel Quartzite in Western Australia. Isotopic analysis using secondary ion mass spectrometry was carried out at UCLA. “Ken (Kenichiro Sugitani, professor, Graduate School of Environmental Studies, Nagoya University, Japan, and a co-author) discovered these unusually shaped microfossils embedded in really old rock,” said House.
To determine if these inclusions were actually biological in origin, the researchers looked at 15 different samples of Farrel Quartzite and determined their stable carbon isotope ratios. The percentage of carbon 13 in the microfossils was indicative of material produced by biological processes. They found that the carbon 13 percentage in the background organic matter in the surrounding rock was different from that of the microstructures.
“When considered along with published morphological and chemical studies, these results indicate that the Farrel Quartzite microstructures are bona fide microfossils, and support the interpretation that the spindles were planktonic,” the researchers report in the current issue of Geology. The morphological and chemical studies were done by Sugitani and Dorothy Oehler, who is also a co-author and research scientist, Astromaterials Research and Exploration Science Directorate, NASA — Johnson Space Center.
The spindle-shaped microfossils are from 20 to 60 microns in length, about the size of fine sand and within the size range of today’s microplankton.
Stable carbon isotope analysis can determine the biological origin of these microfossils because they used carbon dioxide to create energy and incorporated the carbon into themselves. During this process, the organisms selectively incorporate more carbon 12 than carbon 13 from the available carbon, producing a signature of biological origin.
Oehler notes that the spindles appear to be the same as those found in rocks from the Strelly Pool Formation in Western Australia and the Onverwacht Group in South Africa and Swaziland that are both 3.4 billion years old.
“The existence of these microfossils in diverse locations as far back as 3.4 billion years ago suggests that the oceans probably had life in them for a very extended period of time,” said Oehler. “Moreover, this has implications beyond what we have done here, suggesting the evolution of diverse life proceeded quickly.”
Also working on this project was Koichi Mimura, Graduate School of Environmental Studies, Nagoya University, Japan.
Note : The above story is reprinted from materials provided by Penn State
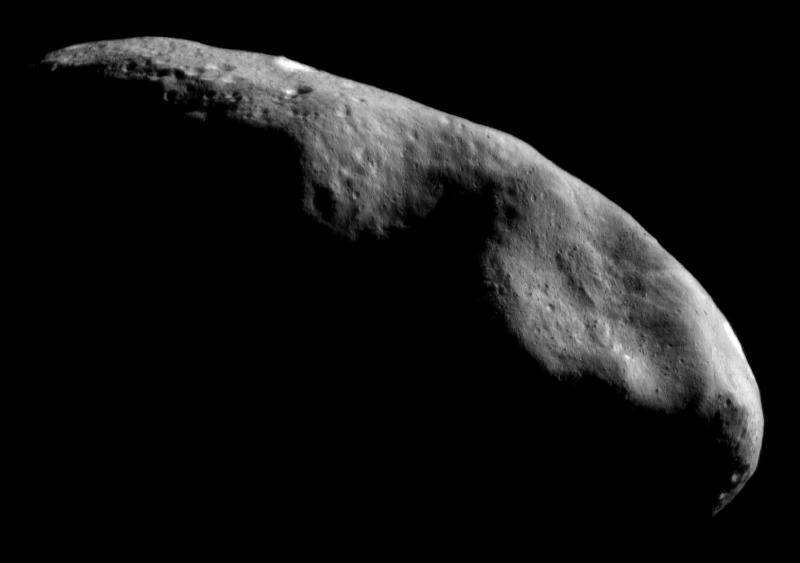
The asteroid Eros was studied by NASA’s NEAR mission in the early 2000s. Researchers want to find out whether asteroids such as this contain minerals and other resources that can be mined and used on Earth or for space-based industries. (Credit: NASA)
The prospects of a robotic manufacturing base operating off Earth is not as far-fetched as it used to be according to a study published by a team of NASA researchers led by a Kennedy Space Center physicist.
Because asteroids are loaded with minerals that are rare on Earth, near-Earth asteroids and the asteroid belt could become the mining centers for remotely operated excavators and processing machinery. In 20 years, an industry barely imagined now could be sending refined materials, rare metals and even free, clean energy to Earth from asteroids and other bodies.
In their paper called “Affordable, Rapid Bootstrapping of the Space Industry and Solar System Civilization,” published in the Journal of Aerospace Engineering, Phil Metzger, Anthony Muscatello, Robert Mueller and James Mantovani detail an intriguing path toward developing a self-sustaining, space-based industry that would use resources from asteroids and other heavenly bodies to meet the needs of humanity.
The result would provide the most profound societal changes since the Industrial Revolution introduced large-scale machinery and manufacturing techniques in the late 18th and early 19th centuries, said Metzger the Kennedy-based physicist who led the evaluation.
“We’re predicting that we are on the verge of the next revolution in human civilization,” Metzger said.
Two fundamental developments make this prospect possible: robotics and the discovery of fundamental elements to make plastic and rubber and metals existing throughout space.
“Now that we know we can get carbon in space, the basic elements that we need for industry are all within reach,” Metzger said. “That was game-changing for us. The asteroid belt has a billion times more platinum than is found on Earth. There is literally a billion times the metal that is on the Earth, and all the water you could ever need.”
Another critical technology also is coming in at just the right time: additive manufacturing in the form of 3D printers that can turn out individual pieces that can be assembled into ever-more-complex machinery and increasingly capable robots.
“The idea is you start with resources out of Earth’s gravity well in the vicinity of the Earth,” Metzger said. “But what we argued is that you can establish industry in space for a surprisingly low cost, much less than anybody previously thought.”
The finished minerals could be returned to Earth or used in space to build new machinery or as supplies for astronauts as they explore the solar system.
So where to start?
The closer to Earth, the better — at least at first.
NASA is searching for an asteroid of about 500 tons that can be moved into a path within the moon’s orbit so astronauts can visit it as early as 2021 to take samples of the space rock.
“When we wrote this paper we were focused on the moon as a source of near-Earth resources, but near Earth asteroids work equally well and offer several additional advantages,” Metzger said. “It takes less fuel to bring resources away from the lower gravity of an asteroid, and since the ultimate goal is to move the industry to the asteroid main belt starting with asteroids first will help develop the correct technologies.”
But all asteroids are not created equal, and each one is likely to offer a unique fingerprint of substances created when the solar system formed billions of years ago.
“There are some types of asteroids that would be fantastic for space resources,” Metzger said. “It’s primordial solar system material. You can make plastics and you can make rubber by combining the carbon and the hydrogen.”
A near-Earth asteroid or other nearby body presumably will contain enough material to allow a robotic system to mine the materials and refine them into usable metal or other substances. Those materials would be formed into pieces and assembled into another robot system that would itself build similar models and advance the design.
“The first generation only makes the simplest materials, it can include metal and therefore you can make structure out of metal and then you can send robots that will attach electronics and wiring onto the metal,” Metzger said. “So by making the easiest thing, you’ve reduced the largest amount of mass that you have to launch.”
The first generation of machinery would be akin to the simple mechanical devices of the 1700s, with each new generation advancing quickly to the modern vanguard of abilities. They would start with gas production and the creation of solar cells, vital for providing a power source.
Each new robot could add improvements to each successive model and quickly advance the mining and manufacturing capabilities. It would not take long for the miners to produce more material than they need for themselves and they could start shipping precious metals back to Earth, riding on heat shields made of the leftover soil that doesn’t contain any precious material.
Kennedy researchers already have tested heat shield samples made from soil.
Bodies near Earth also were recently revealed to contain water ice, which gives planners the chemicals needed to produce fuel and air. With those resources available, the robotic miners would be able to propel themselves farther out into the solar system, mainly to the resource-rich asteroid belt between Mars and Jupiter. There they could set up more manufacturing and refining facilities.
Perhaps the most unusual aspect of the whole endeavor is that it would not take many launches from Earth to achieve. Launch costs, which now run at best $1,000 per pound, would be saved because robots building themselves in space from material gathered there wouldn’t need anything produced by people. Very quickly, only the computer chips, electronics boards and wiring would need to come from Earth.
“We took it through six generations of robotic development and you can achieve full closure and make everything in space,” Metzger said. “We showed you can get it down to launching 12 tons of hardware, which is incredibly small.”
For comparison, that would be less than half the weight of the Apollo command and service modules flown on a moon mission.
This enterprise would take years to establish, but not as long as one might think. And the payoff for Earth would be felt when the first shipments of materials began arriving from space. A sudden influx of rare metals, for instance, would drive down the price of those materials on Earth and allow a similar drastic reduction in manufacturing costs for products made with the materials.
There are numerous examples of such revolutions taking place over and over again on Earth, including the discovery after the Civil War of a process for refining bauxite into aluminum that made the metal go from being as valuable as gold to something soda cans are made of. Does that mean soda cans would be made from platinum? Maybe not, but the changes could be just as dramatic.
“You could grow an industry that is a million times bigger than the United States’ in the main asteroid belt,” Metzger said. “Then you really are capable of terraforming planets and doing all the other great things because it wouldn’t cost you anything” in terms of labor, resources or materials.
Reference:
Philip T. Metzger, Anthony Muscatello, Robert P. Mueller, James Mantovani. Affordable, Rapid Bootstrapping of the Space Industry and Solar System Civilization. Journal of Aerospace Engineering, 2013; 26 (1): 18 DOI: 10.1061/(ASCE)AS.1943-5525.0000236
Note : The above story is reprinted from materials provided by NASA.
Medieval chronicles have given an international group of researchers a glimpse into the past to assess how historical volcanic eruptions affected the weather in Ireland up to 1500 years ago.
By critically assessing over 40,000 written entries in the Irish Annals and comparing them with measurements taken from ice cores, the researchers successfully linked the climatic aftermath of volcanic eruptions to extreme cold weather events in Ireland over a 1200-year period from 431 to 1649.
Their study, which has been published today, 6 June, in IOP Publishing’s journal Environmental Research Letters, showed that over this timescale up to 48 explosive volcanic eruptions could be identified in the Greenland Ice Sheet Project (GISP2) ice-core, which records the deposition of volcanic sulfate in annual layers of ice.
Of these 48 volcanic events, 38 were associated, closely in time, with 37 extreme cold events, which were identified by systematically examining written entries in the Irish Annals and picking out directly observed meteorological phenomena and conditions, such as heavy snowfall and frost, prolonged ice covering lakes and rivers, and contemporary descriptions of abnormally cold weather.
Lead author of the study, Dr Francis Ludlow, from the Harvard University Center for the Environment and Department of History, said: “It’s clear that the scribes of the Irish Annals were diligent reporters of severe cold weather, most probably because of the negative impacts this had on society and the biosphere.
“Our major result is that explosive volcanic eruptions are strongly, and persistently, implicated in the occurrence of cold weather events over this long timescale in Ireland. In their severity, these events are quite rare for the country’s mild maritime climate.”
Through the injection of sulphur dioxide gas into the stratosphere, volcanic eruptions can play a significant role in the regulation of the Earth’s climate. Sulphur dioxide gas is converted into sulphate aerosol particles after eruptions which reflect incoming sunlight and result in an overall temporary cooling of the Earth’s surface.
Whilst the global effects of recent eruptions are quite well-known, such as the Mount Pinatubo eruption almost 22 years ago (15 June 1991), less is known about their effects on climate before the beginning of instrumental weather recording, or their effects on regional scales; the Irish Annals provided an opportunity to explore both of these issues.
The Irish Annals contain over one million written words and around 40,000 distinct written entries, detailing major historical events on an annual basis, and providing both systematic and sustained reporting of meteorological extremes.
The dating and reliability of the Annals can be gauged by comparing reported events to those which are independently known, such as solar and lunar eclipses.
“With a few honourable exceptions, the Irish record of extreme events has only been used anecdotally, rather than systematically surveyed and exploited for the study of the climate history of Ireland and the North Atlantic, and so the richness of the record has been largely unrecognized,” continued Dr Ludlow.
Although the effect of big eruptions on the climate in summer is largely to cause cooling, during the winter, low-latitude eruptions in the tropics have instead been known to warm large parts of the northern hemisphere as they cause a strengthening of the westerly winds that brings, for example, warmer oceanic air to Europe; however, this study identified several instances when low-latitude eruptions appeared to correspond to extreme cold winters in Ireland.
One example is the 1600 eruption in Peru of Huaynaputina, which the researchers found, against expectations, to be associated with extreme cold winter weather in Ireland in the following years.
“The possibility that tropical eruptions may result in severe winter cooling for Ireland highlights the considerable complexity of the volcano-climate system in terms of the regional expression of the response of climate to volcanic disturbances.
“It is on the regional scale that we need to refine our understanding of this relationship as ultimately, it is on this scale that individuals and societies plan for extreme weather,” continued Dr Ludlow.
Note : The above story is reprinted from materials provided by Institute of Physics (IOP), via AlphaGalileo.
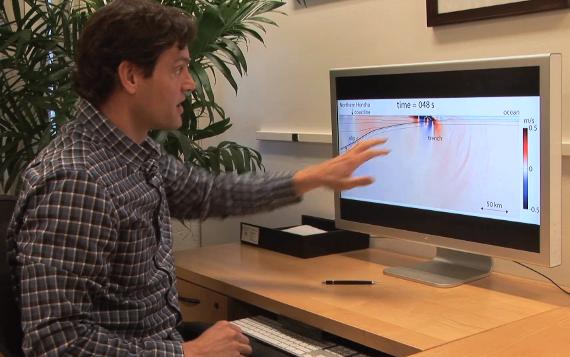
Stanford scientists have identified key acoustic characteristics of the 2011 Japan earthquake that predicted it would cause a large tsunami. The technique could be applied worldwide to create an early warning system for tsunamis. (Credit: Courtesy of Stanford University )
Stanford scientists have identified key acoustic characteristics of the 2011 Japan earthquake that indicated it would cause a large tsunami. The technique could be applied worldwide to create an early warning system for massive tsunamis.
On March 11, 2011, a magnitude 9.0 undersea earthquake occurred 43 miles off the shore of Japan. The earthquake generated an unexpectedly massive tsunami that washed over eastern Japan roughly 30 minutes later, killing more than 15,800 people and injuring more than 6,100. More than 2,600 people are still unaccounted for.
Now, computer simulations by Stanford scientists reveal that sound waves in the ocean produced by the earthquake probably reached land tens of minutes before the tsunami. If correctly interpreted, they could have offered a warning that a large tsunami was on the way.
Although various systems can detect undersea earthquakes, they can’t reliably tell which will form a tsunami, or predict the size of the wave. There are ocean-based devices that can sense an oncoming tsunami, but they typically provide only a few minutes of advance warning.
Because the sound from a seismic event will reach land well before the water itself, the researchers suggest that identifying the specific acoustic signature of tsunami-generating earthquakes could lead to a faster-acting warning system for massive tsunamis.
Discovering the signal
The finding was something of a surprise. The earthquake’s epicenter had been traced to the underwater Japan Trench, a subduction zone about 40 miles east of Tohoku, the northeastern region of Japan’s larger island. Based on existing knowledge of earthquakes in this area, seismologists puzzled over why the earthquake rupture propagated from the underground fault all the way up to the seafloor, creating a massive upward thrust that resulted in the tsunami.
Direct observations of the fault were scarce, so Eric Dunham, an assistant professor of geophysics in the School of Earth Sciences, and Jeremy Kozdon, a postdoctoral researcher working with Dunham, began using the cluster of supercomputers at Stanford’s Center for Computational Earth and Environmental Science (CEES) to simulate how the tremors moved through the crust and ocean.
The researchers built a high-resolution model that incorporated the known geologic features of the Japan Trench and used CEES simulations to identify possible earthquake rupture histories compatible with the available data.
Retroactively, the models accurately predicted the seafloor uplift seen in the earthquake, which is directly related to tsunami wave heights, and also simulated sound waves that propagated within the ocean.
In addition to valuable insight into the seismic events as they likely occurred during the 2011 earthquake, the researchers identified the specific fault conditions necessary for ruptures to reach the seafloor and create large tsunamis.
The model also generated acoustic data; an interesting revelation of the simulation was that tsunamigenic surface-breaking ruptures, like the 2011 earthquake, produce higher amplitude ocean acoustic waves than those that do not.
The model showed how those sound waves would have traveled through the water and indicated that they reached shore 15 to 20 minutes before the tsunami.
“We’ve found that there’s a strong correlation between the amplitude of the sound waves and the tsunami wave heights,” Dunham said. “Sound waves propagate through water 10 times faster than the tsunami waves, so we can have knowledge of what’s happening a hundred miles offshore within minutes of an earthquake occurring. We could know whether a tsunami is coming, how large it will be and when it will arrive.”
Worldwide application
The team’s model could apply to tsunami-forming fault zones around the world, though the characteristics of telltale acoustic signature might vary depending on the geology of the local environment. The crustal composition and orientation of faults off the coasts of Japan, Alaska, the Pacific Northwest and Chile differ greatly.
“The ideal situation would be to analyze lots of measurements from major events and eventually be able to say, ‘this is the signal’,” said Kozdon, who is now an assistant professor of applied mathematics at the Naval Postgraduate School. “Fortunately, these catastrophic earthquakes don’t happen frequently, but we can input these site specific characteristics into computer models — such as those made possible with the CEES cluster — in the hopes of identifying acoustic signatures that indicates whether or not an earthquake has generated a large tsunami.”
Dunham and Kozdon pointed out that identifying a tsunami signature doesn’t complete the warning system. Underwater microphones called hydrophones would need to be deployed on the seafloor or on buoys to detect the signal, which would then need to be analyzed to confirm a threat, both of which could be costly. Policymakers would also need to work with scientists to settle on the degree of certainty needed before pulling the alarm.
If these points can be worked out, though, the technique could help provide precious minutes for an evacuation.
The study is detailed in the current issue of the journal The Bulletin of the Seismological Society of America.
Note : The above story is reprinted from materials provided by Stanford University. The original article was written by Bjorn Carey.
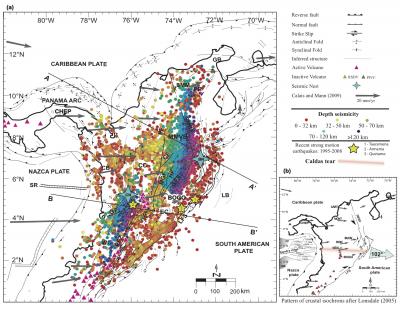
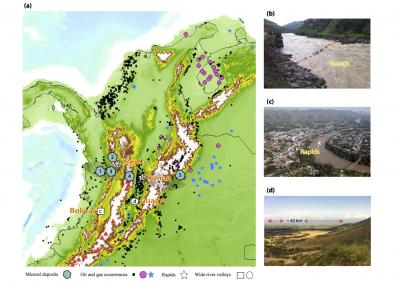
This is a tectonic map of northwestern South America and Panama showing plate boundaries and neotectonic fault systems and selective distribution of hypocentral solutions of ~30,000 earthquakes extracted from the entire catalog of the CNSN. (Credit: BSSA)
Colombia sits atop a complex geological area where three tectonic plates are interacting, producing seismicity patterns that have puzzled seismologists for years. Now seismologists have identified the “Caldas tear,” which is a break in a slab that separates two subducting plates and accounts for curious features, including a “nest” of seismic activity beneath east-central Colombia and high grade mineral deposits on the surface.
In a paper published in the June issue of the Bulletin of the Seismological Society of America (BSSA),
Surficial evidences of the Caldas tear are related to mineral deposits, hydrocarbon occurrences and geomorphological anomalies.Credit: BSSA
researchers Carlos Alberto Vargas of the Universidad Nacional de Colombia and Paul Mann of the University of Houston relied on recorded earthquake data from the Colombian National Seismological Network database and tomographic data to reveal a clearly defined, prominent tear.
“This paper attempts to provide a unifying concept of how the deformation is proceeding on a regional scale in Colombia,” said Mann.
The complex regional tectonic activity includes movement of three plates: the Caribbean plate that is subducting or being forced beneath Colombia in the north; the Panama block or Panama plate that is colliding with Colombia in the central part of the country; and the Nazca plate, which is an oceanic plate that is subducting beneath the southern part of Colombia from the Pacific.
While Colombians have experienced earthquakes in the past 20 years, none has been exceedingly large, despite the complex zone of convergence beneath it.
“Unlike the high seismicity to the south of the Caldas tear, there are few destructive earthquakes north of the tear, which suggests that there is an accumulation of stresses that could trigger strong motion events resulting from the frontal collision of the Panamanian Arc against Colombia,” said Vargas.
The authors used the Colombian Seismic Network’s database of more than 100,000 seismic events to identify the prominent tear, where the slab is broken along a very distinct break, separating the Nazca oceanic plate, which is coming from the Pacific, from the Panama plate, which is an old island arc (Sandra ridge) that pushes into Colombia from the west.
“We think that this Panama block is acting as an indenter. It’s a block of thick crust that doesn’t subduct easily, rather it subducts at a shallow angle,” said Mann. “And because it’s thick crust, it acts like a fist or an indenter that’s pushing into the whole country of Colombia and northwest South America.”
Vargas and Mann suggest the crust that preceded the indenter or colliding Panama block is being ripped apart from the indenter, which is crust that cannot easily subduct. The Caldas tear forms the southern edge of the indenter, separating it from the Nazca plate. The indenter is breaking from the crust that preceded it, forming the Bucamaranga nest, which is a dense area of seismic activity in a small volume of crust at about 140 km depth.
Using tomographic data, the authors inferred that the Caribbean plate crust to the north is subducting at a very shallow angle and producing relatively little deep seismicity. Tomography is a way to map the geometry of a subduction zone on the basis of differences in the seismic attenuation of crusts. Colder subducting crust, for example, will have a lower attenuation than the surrounding mantle. The Caribbean plate in the north is subducting at a slower rate than the Nazca plate in the south, where seismic activity is greater.
“In the center of it all is the indenter — an incredibly important feature for Colombia and for assessing its earthquake hazard,” said Mann.
Colombia features large strike slip faults that form a V-shaped pattern, which is symmetrical about the Panama plate. Vargas and Mann relate the upper crust strike slip faults to the indenter, which they suggest is pushing the crust further east than in areas in the north and south.
The Caldas tear is reflected in the landscape. The Magdalena River, which runs northward, changes from broad valleys to steeper relief gorges as it crosses the tear, suggesting to researchers that the tear may propagate to the surface. There is an alignment of small volcanoes along the tear that have an unusual composition, distinctly different than seen in the volcano arc in the south.
“We have found that this tectonic structure not only controls the distribution of major mineral deposits, but has also come to control the geometry of several sedimentary basins, and the distribution of hydrocarbons retained in them,” said Vargas.
“Tearing and breakoff of the subducted slabs as the result of a collision of the Panama arc-indenter with northwestern South America,” appears in the June 2013 issue of BSSA.
Note : The above story is reprinted from materials provided by Seismological Society of America, via EurekAlert!, a service of AAAS.
Tiny bubbles of water found in quartz grains in Australia may hold the key to understanding what caused Earth’s first ice age, say scientitss.
The Anglo-French study, published in the journal Nature, analysed the amount of ancient atmospheric argon gas (Ar) isotopes dissolved in the bubbles and found levels were very different to those in the air we breathe today.
The researchers say their findings help explain why Earth didn’t suffer its first ice age until 2.5 billion years ago, despite the Sun’s rays being weaker during the early years of our planet’s formation.
“The water samples come from the Pilbara region in north-west Australia and were originally heated during an eruption of pillow basalt lavas, probably in a lake or lagoon environment,” said author Dr Ray Burgess, from the University of Manchester’s School of Earth, Atmospheric and Environmental Sciences.
“Evidence from the geological record indicates that the first major glaciations on Earth occurred about 2.5 billion years ago, and yet the energy of the Sun was 20 per cent weaker prior to, and during, this period, so all water on Earth should already have been frozen.
“This is something that has baffled scientists for years but our findings provide a possible explanation.”
The study, done in collaboration with the CRPG-CNRS, University of Lorraine and the Institut de Physique du Globe de Paris, revealed that the ratio of two argon isotopes — 40Ar, formed by the decay of potassium (40K) with a half-life of 1.25 billion years, and 36Ar — was much lower than present-day levels. This finding can only be explained by the gradual release of 40Ar from rocks and magma into the atmosphere throughout Earth’s history.
The team used the argon isotope ratio to estimate how the continents have grown over geological time and found that the volume of continental crust 3.5 billion years ago was already well-established being roughly half what it is today.
Dr Burgess said: “High levels of the greenhouse gas carbon dioxide in the early atmosphere — in the order of several percent — which would have helped retain the Sun’s heat, has been suggested as the reason why Earth did not freeze over sooner, but just how this level was reduced has been unexplained, until now.
“The continents are a key player in the Earth’s carbon cycle because carbon dioxide in the atmosphere dissolves in water to form acid rain. The carbon dioxide removed from the atmosphere by this process is stabilised in carbonate rocks such as limestone and if a substantial volume of continental crust was established, as revealed by our study, then the acid weathering of this early crust would efficiently reduce the carbon dioxide levels in the atmosphere to lower global temperatures and lead to the first major ice age.
He added: “The signs of the Earth’s evolution in the distant past are extremely tenuous, only fragments of highly weathered and altered rocks exists from this time, and for the most part, the evidence is indirect. To find an actual sample of ancient atmospheric argon is remarkable and represents a breakthrough in understanding environmental conditions on Earth before life existed.”
Note : The above story is reprinted from materials provided by Manchester University, via AlphaGalileo.
The skeleton of the South African reptile Eunotosaurus africanus fills a gap in the early evolution of turtles and their enigmatic shell. (Credit: Tyler Lyson)
Through careful study of an ancient ancestor of modern turtles, researchers now have a clearer picture of how the turtles’ most unusual shell came to be. The findings, reported on May 30 in Current Biology, a Cell Press publication, help to fill a 30- to 55-million-year gap in the turtle fossil record through study of an extinct South African reptile known as Eunotosaurus.
“The turtle shell is a complex structure whose initial transformations started over 260 million years ago in the Permian period,” says Tyler Lyson of Yale University and the Smithsonian. “Like other complex structures, the shell evolved over millions of years and was gradually modified into its present-day shape.”
The turtle shell isn’t really just one thing — it is made up of approximately 50 bones. Turtles are the only animals that form a shell through the fusion of ribs and vertebrae. In all other animals, shells are formed from bony scales on the surface; they don’t stick their bones on the outsides of their bodies.
“The reason, I think, that more animals don’t form a shell via the broadening and eventually suturing together
The skeleton of the 260-million-year-old extinct South African reptile Eunotosaurus africanus fills an important gap in the evolution of the turtle shell.Credit: Tyler Lyson
of the ribs is that the ribs of mammals and lizards are used to help ventilate the lungs,” Lyson says. “If you incorporate your ribs into a protective shell, then you have to find a new way to breathe!” Turtles have done just that, with the help of a muscular sling.
Until recently, the oldest known fossil turtles, dating back about 215 million years, had fully developed shells, making it hard to see the sequence of evolutionary events that produced them. That changed in 2008 with the discovery of Chinese Odontochelys semitestacea, a reptile about 220 million years old, which had a fully developed plastron — the belly side of the shell — but only a partial carapace on its back.
Eunotosaurus takes the turtle and its shell back another 40 million years or so. It had nine broadened ribs found only in turtles. And like turtles, it lacked the intercostal muscles running between its ribs. But Eunotosaurus didn’t have other features common to Odontochelys and turtles, including broad spines on their vertebrae.
Lyson says he and his colleagues now plan to investigate various other aspects of turtles’ respiratory systems, which allow them to manage with their ribs locked up into a protective outer shell. “It is clear that this novel lung ventilation mechanism evolved in tandem with the origin of the turtle shell,” he says.
Note : The above story is reprinted from materials provided by Cell Press, via EurekAlert!, a service of AAAS.
This artist’s conception shows a young, hypothetical planet around a cool star. A soupy mix of potentially life-forming chemicals can be seen pooling around the base of the jagged rocks. (Credit: Photo illustration by NASA)
Scientists may not know for certain whether life exists in outer space, but new research from a team of scientists led by a University of South Florida astrobiologist now shows that one key element that produced life on Earthwas carried here on meteorites.
In an article published in the new edition of the Proceedings of the National Academy of Sciences, USF Assistant Professor of Geology Matthew Pasek and researchers from the University of Washington and the Edinburg Centre for Carbon Innovation, revealed new findings that explain how the reactive phosphorus that was an essential component for creating the earliest life forms came to Earth.
The scientists found that during the Hadean and Archean eons — the first of the four principal eons of Earth’s earliest history — the heavy bombardment of meteorites provided reactive phosphorus that when released in water could be incorporated into prebiotic molecules. The scientists documented the phosphorus in early Archean limestone, showing it was abundant some 3.5 billion years ago.
The scientists concluded that the meteorites delivered phosphorus in minerals that are not seen on the surface of Earth, and these minerals corroded in water to release phosphorus in a form seen only on the early Earth.
The discovery answers one of the key questions for scientist trying to unlock the processes that gave rise to early life forms: Why don’t we see new life forms today?
“Meteorite phosphorus may have been a fuel that provided the energy and phosphorus necessary for the onset of life,” said Pasek, who studies the chemical composition of space and how it might have contributed to the origins of life. “If this meteoritic phosphorus is added to simple organic compounds, it can generate phosphorus biomolecules identical to those seen in life today.”
Pasek said the research provides a plausible answer: The conditions under which life arose on Earth billions of years ago are no longer present today.
“The present research shows that this is indeed the case: Phosphorus chemistry on the early Earth was substantially different billions of years ago than it is today,” he added.
The research team reached their conclusion after examining Earth core samples from Australia, Zimbabwe, West Virginia, Wyoming and in Avon Park, Florida.
Previous research had showed that before the emergence of modern DNA-RNA-protein life that is known today, the earliest biological forms evolved from RNA alone. What has stumped scientists, however, was understanding how those early RNA-based life forms synthesized environmental phosphorus, which in its current form is relatively insoluble and unreactive.
Meteorites would have provided reactive phosphorus in the form of the iron-nickel phosphide mineral schreibersite, which in water released soluble and reactive phosphite. Phosphite is the salt scientists believe could have been incorporated into prebiotic molecules.
Of all of the samples analyzed, only the oldest, the Coonterunah carbonate samples from the early Archean of Australia, showed the presence of phosphite, Other natural sources of phosphite include lightning strikes, geothermal fluidsand possibly microbial activity under extremely anaerobic condition, but no other terrestrial sources of phosphite have been identified and none could have produced the quantities of phosphite needed to be dissolved in early Earth oceans that gave rise to life, the researchers concluded.
The scientists said meteorite phosphite would have been abundant enough to adjust the chemistry of the oceans, with its chemical signature later becoming trapped in marine carbonate where it was preserved.
It is still possible, the researchers noted, that other natural sources of phosphite could be identified, such as in hydrothermal systems. While that might lead to reducing the total meteoric mass necessary to provide enough phosphite, the researchers said more work would need to be done to determine the exact contribution of separate sources to what they are certain was an essential ingredient to early life.
Note : The above story is reprinted from materials provided by University of South Florida (USF Health). The original article was written by Vickie Chachere.
Researchers from the University of Valencia and the Natural History Museum of Berlin have studied the fossilised remains of scales and bones found in Teruel, Spain, and the south of Zaragoza, ascertaining that they belong to a new fish species called Machaeracanthus goujeti that lived in that area of the peninsula during the Devonian period. The fossils are part of the collection housed in the Palaeontology Museum of Zaragoza.
In the journal Geodiversitas, a research team led by the University of Valencia describes a new species of spiny shark (Acanthodii), a primitive type of fish that shared characteristics with sharks and bony fish. Remains of scales, bones and scapular joint bones were found in Devonian (approximately 408 million years ago) in Teruel and the south of Zaragoza.
The paper also includes an analysis of fossils of a fragmented spine and isolated scales from the Lower Devonian found in northern Spain (Palencia and Cantabrian Mountains) and western France (Saint-Céneré commune), originally attributed to the Machaeracanthus sp species.
“The discovery of this new species, which we call Machaeracanthus goujeti and belongs to the Acanthodii group -of which very little is known-, expands our knowledge of the biodiversity that existed on the peninsula 480 million years ago, when the modern-day region of Teruel was covered by the sea,” Héctor Botella, professor in the palaeontology unit in the University of Valencia and the study’s lead author, explained.
The Acanthodii group of fish are also known as ‘spiny sharks’ owing to their appearance and, from what we know to date, they only lived during the Palaeozoic Era and reached their maximum level of diversity in the Devonic period. However, the bones typically found in the Acanthodii group grow differently to the bones found, therefore this type could be even more similar to sharks and would date from the very early stages of the radiation of jawed vertebrates (gnathostomata).
A fish fossil no more than one metre in length
The majority of the samples found by the researchers are juveniles. Based on the fossilised remains, the researchers estimate that the largest fish in this species would not reach one metre in length. “This is just an estimation because there are animals that can have large bones and be small, and vice versa,” Botella stated.
For their part, the fossils found in the sediment layers of the Iberian mountain range must surely have belonged to fish that swam close to the coast. “In other words, they must have lived in an epicontinental sea -an extensive but shallow salt water mass-, and it is therefore possible that this area was used as a breeding ground,” he concludes. Larger fossils were found in sediment layers a little further down.
The fossils form part of the collection housed in the Palaeontology Museum of Zaragoza.
Note : The above story is reprinted from materials provided by Plataforma SINC, via AlphaGalileo.
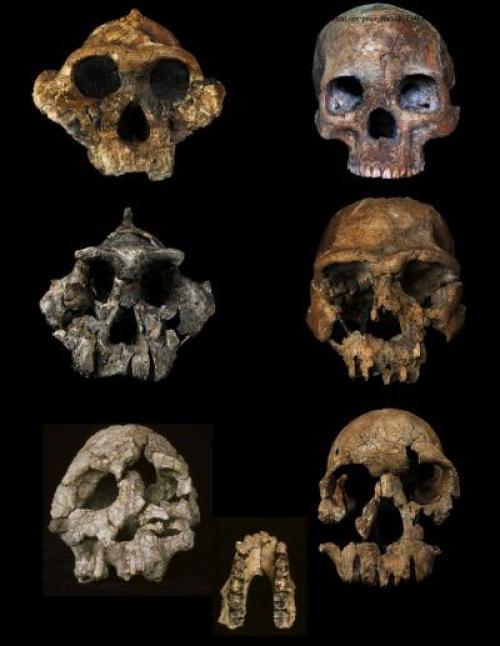
A set of new studies from the University of Utah and elsewhere found that human ancestors and relatives started eating an increasingly grassy diet 3.5 million years ago. The studies included analysis of tooth enamel from fossils of several early African humans, their ancestors and extinct relatives, some of which are shown here. Top left: Paranthropus bosei, 1.7 million years ago. Top right: Homo sapiens, 10,000 years ago. Center left: Paranthropus aethiopicus, 2.3 million years ago. Center right: Homo ergaster, 1.6 million years ago. Bottom left: Kenyanthropus platyops, 3.3 million years ago. Bottom center: lower jaw from Australopithecus anamensis, 4 million years ago. Bottom right: Homo rudolfensis, 1.9 million years ago. (Credit: Copyright National Museums of Kenya. Photos by Mike Hettwer, except Homo sapiens by Yang Deming.)
Most apes eat leaves and fruits from trees and shrubs. New studies spearheaded by the University of Utah show that human ancestors expanded their menu 3.5 million years ago, adding tropical grasses and sedges to an ape-like diet and setting the stage for our modern diet of grains, grasses, and meat and dairy from grazing animals.
In four new studies of carbon isotopes in fossilized tooth enamel from scores of human ancestors and baboons in Africa from 4 million to 10,000 years ago, a team of two dozen researchers found a surprise increase in the consumption of grasses and sedges — plants that resemble grasses and rushes but have stems and triangular cross sections.
“At last, we have a look at 4 million years of the dietary evolution of humans and their ancestors,” says University of Utah geochemist Thure Cerling, principal author of two of the four new studies published online June 3 by the journal Proceedings of the National Academy of Sciences. Most funding was from the National Science Foundation.
“For a long time, primates stuck by the old restaurants — leaves and fruits — and by 3.5 million years ago, they started exploring new diet possibilities — tropical grasses and sedges — that grazing animals discovered a long time before, about 10 million years ago” when African savanna began expanding, Cerling says. “Tropical grasses provided a new set of restaurants. We see an increasing reliance on this new resource by human ancestors that most primates still don’t use today.”
Grassy savannas and grassy woodlands in East Africa were widespread by 6 million to 7 million years ago. It is a major question why human ancestors didn’t seriously start exploiting savanna grasses until less than 4 million years ago.
The isotope method cannot distinguish what parts of grasses and sedges human ancestors ate — leaves, stems, seeds and-or underground storage organs such as roots or rhizomes. The method also can’t determine when human ancestors began getting much of their grass by eating grass-eating insects or meat from grazing animals. Direct evidence of human ancestors scavenging meat doesn’t appear until 2.5 million years ago, and definitive evidence of hunting dates to only about 500,000 years ago.
With the new findings, “we know much better what they were eating, but mystery does remain,” says Cerling, a distinguished professor of geology and geophysics, and biology. “We don’t know exactly what they ate. We don’t know if they were pure herbivores or carnivores, if they were eating fish [which leave a tooth signal that looks like grass-eating], if they were eating insects or if they were eating mixes of all of these.”
Why Our Ancestor’s Diets Matter
The earliest human ancestor to consume substantial amounts of grassy foods from dry, more open savannas “may signal a major and ecological and adaptive divergence from the last common ancestor we shared with African great apes, which occupy closed, wooded habitats,” writes University of South Florida geologist Jonathan Wynn, chief author of one of the new studies and a former University of Utah master’s student.
“Diet has long been implicated as a driving force in human evolution,” says Matt Sponheimer, a University of Colorado, Boulder anthropologist, former University of Utah postdoctoral fellow and lead author of the fourth study.
He notes that changes in diet have been linked to both larger brain size and the advent of upright walking in human ancestors roughly 4 million years ago. Human brains were larger than those of other primates by the time our genus, Homo, evolved 2 million years ago. (Our species, Homo sapiens, arose 200,000 years ago.)
“If diet has anything to do with the evolution of larger brain size and intelligence, then we are considering a diet that is very different than we were thinking about 15 years ago,” when it was believed human ancestors ate mostly leaves and fruits, Cerling says.
How the Studies Were Performed: You Are What You Eat
The new studies analyze carbon isotope results from 173 teeth from 11 species of hominins. Hominins are humans, their ancestors and extinct relatives that split from the other apes roughly 6 million years ago. Some of the analyses were done in previous research, but the new studies include new carbon-isotope results for 104 teeth from 91 individuals of eight hominin species. Those teeth are in African museums and were studied by two groups working at separate early human sites in East Africa.
Wynn wrote the study about teeth from Ethiopia’s Awash Basin-Hadar area, where research is led by Arizona State University’s William Kimbel. Cerling wrote the study about teeth from the Turkana Basin in Kenya, where the research team is led by Turkana Basin Institute paleoanthropologist Meave Leakey, Cerling and geologist Frank Brown, dean of mines and Earth sciences at the University of Utah. Cerling also wrote a study about baboon diets. Sponheimer wrote a fourth study, summarizing the other three.
The method of determining ancient creatures’ diets from carbon isotope data is less than 20 years old and is based on the idea “you are what you eat,” Sponheimer says.
Tiny amounts of tooth enamel were drilled from already broken fossil teeth of museum specimens of human ancestors and relatives. The powder was placed in a mass spectrometer to learn ratios of carbon isotopes incorporated into tooth enamel via diet.
The ratios of rare carbon-13 to common carbon-12 reveal whether an animal ate plants that used so-called C3, C4 or CAM photosynthesis to convert sunlight to energy. Animals eating C4 and CAM plants have enriched amounts of carbon-13.
C3 plants include trees, bushes and shrubs, and their leaves and fruits; most vegetables; cool-season grasses and grains such as timothy, alfalfa, wheat, oats, barley and rice; soybeans; non-grassy herbs and forbs.
C4 plants are warm-season or tropical grasses and sedges and their seeds, leaves or storage organs like roots and tubers. Well-known sedges include water chestnut, papyrus and sawgrass. C4 plants are common in African savannas and deserts. C4 grasses include Bermuda grass and sorghum. C4 grains include corn and millet.
CAM plants include tropical succulent plants such as cactus, salt bush and agave.
Today, North Americans eat about half C3 plants, including vegetables, fruits and grains such as wheat, oats, rye and barley, and about half C4, which largely comes from corn, sorghum and meat animals fed on C4 grasses and grains, Cerling says.
The highest human C3 diets today are found in northern Europe, where only C3 cool-season grasses grow, so meat animals there graze them, not C4 tropical grasses. The highest C4 diets likely are in Central America because of the heavily corn-based diet.
If early humans ate grass-eating insects or large grazing animals like zebras, wildebeest and buffalo, it also would appear they ate C4 grasses. If they ate fish that ate algae, it would give a false appearance of grass-eating because of the way algae takes up carbonate from water, Cerling says. If they ate small antelope and rhinos that browsed on C3 leaves, it would appear they ate C3 trees-shrubs. Small mammals such as hyrax, rabbits and rodents would have added C3 and C4 signals to the teeth of human ancestors.
The Findings: A Dietary History of Human Ancestors and Relatives
Previous research showed that 4.4 million years ago in Ethiopia, early human relative Ardipithecus ramidus (“Ardi”) ate mostly C3 leaves and fruits.
About 4.2 million to 4 million years ago on the Kenyan side of the Turkana Basin, one of Cerling’s new studies shows that human ancestor Australopithecus anamensis ate at least 90 percent leaves and fruits — the same diet as modern chimps.
By 3.4 million years ago in northeast Ethiopia’s Awash Basin, according to Wynn’s study, Australopithecus afarensis was eating significant amounts of C4 grasses and sedges: 22 percent on average, but with a wide range among individuals of anywhere from 0 percent to 69 percent grasses and sedges. The species also ate some succulent plants. Wynn says that switch “documents a transformational stage in our ecological history.” Many scientists previously believed A. afarensis had an ape-like C3 diet. It remains a mystery why A. afarensis expanded its menu to C4 grasses when its likely ancestor, A. anamensis, did not, although both inhabited savanna habitats, Wynn writes.
Also by 3.4 million years ago in Turkana, human relative Kenyanthropus platyops had switched to a highly varied diet of both C3 trees and shrubs and C4 grasses and sedges. The average was 40 percent grasses and sedges, but individuals varied widely, eating anywhere from 5 percent to 65 percent, Cerling says.
About 2.7 million to 2.1 million years ago in southern Africa, hominins Australopithecus africanus and Paranthropus robustus ate tree and shrub foods, but also ate grasses and sedges and perhaps grazing animals. A. africanus averaged 50 percent C4 grass-sedge-based foods, but individuals ranged from none to 80 percent. P. robustus averaged 30 percent grasses-sedges, but ranged from 20 percent to 50 percent.
By 2 million to 1.7 million years ago in Turkana, early humans, Homo, ate a 35 percent grass-and-sedge diet — some possibly from meat of grazing animals — while another hominin, Paranthropus boisei, was eating 75 percent grass — more than any hominin, according to a 2011 study by Cerling. Paranthropus likely was vegetarian. Homo had a mixed diet that likely included meat or insects that had eaten grasses. Wynn says a drier climate may have made Homo and Paranthropus more reliant on C4 grasses.
By 1.4 million years ago in Turkana, Homo had increased the proportion of grass-based food to 55 percent.
Some 10,000 years ago in Turkana, Homo sapiens‘ teeth reveal a diet split 50-50 between C3 trees and shrubs and C4 plants and likely meat — almost identical to the ratio in modern North Americans, Cerling says.
Humans: The Only Surviving Primates with a C4 Grass Diet
Cerling’s second new study shows that while human ancestors ate more grasses and other apes stuck with trees and shrubs, two extinct Kenyan baboons represent the only primate genus that ate primarily grasses and perhaps sedges throughout its history.
Theropithecus brumpti ate a 65 percent tropical grass-and-sedge diet when the baboons lived between 4 million and 2.5 million years ago, contradicting previous claims that they ate forest foods. Later, Theropithecus oswaldi ate a 75 percent grass diet by 2 million years ago and a 100 percent grass diet by 1 million years ago. Both species went extinct, perhaps due to competition from hooved grazing animals. Modern Theropithecus gelada baboons live in Ethiopia’s highlands, where they eat only C3 cool-season grasses.
Cerling notes that primate tropical grass-eaters — Theropithecus baboons and Paranthropus human relatives — went extinct while human ancestors ate an increasingly grass-based diet. Why is an open question.
Note : The above story is reprinted from materials provided by University of Utah.
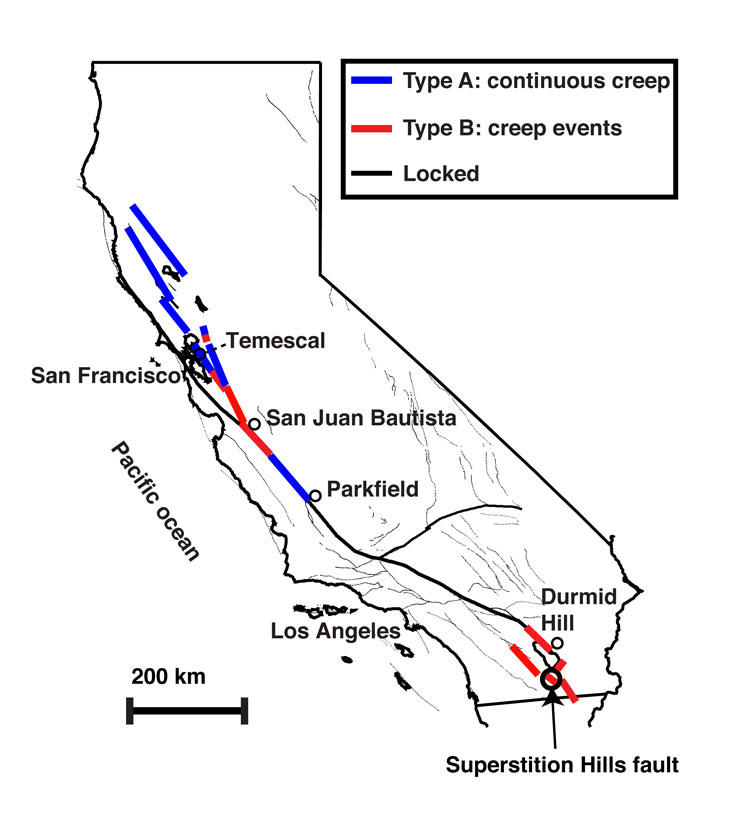
In this map of the major faults in California, fault segments that experience episodic creep events are shown in red. The blue lines indicate segments that experience stable sliding or continuous creep. Fault segments that are “locked” from the surface to the bottom of the fault are shown in black. (Credit: Courtesy of Matt Wei)
New Zealand’s geologic hazards agency reported this week an ongoing, “silent” earthquake that began in January is still going strong. Though it is releasing the energy equivalent of a 7.0 earthquake, New Zealanders can’t feel it because its energy is being released over a long period of time, therefore slow, rather than a few short seconds.
These so-called “slow slip events” are common at subduction zone faults — where an oceanic plate meets a continental plate and dives beneath it. They also occur on continents along strike-slip faults like California’s San Andreas, where two plates move horizontally in opposite directions. Occurring close to the surface, in the upper 3-5 kilometers (km) of the fault, this slow, silent movement is referred to as “creep events.”
In a study published this week in Nature Geoscience, scientists from Woods Hole Oceanographic Institution (WHOI), McGill University, and GNS Science New Zealand provide a new model for understanding the geological source of silent earthquakes, or “creep events” along California’s San Andreas fault. The new study shows creep events originate closer to the surface, a much shallower source along the fault.
“The observation that faults creep in different ways at different places and times in the earthquake cycle has been around for 40 years without a mechanical model that can explain this variability,” says WHOI geologist and co-author Jeff McGuire. “Creep is a basic feature of how faults work that we now understand better.”
Fault creep occurs in shallow portions of the fault and is not considered a seismic event. There are two types of creep. In one form, creep occurs as a continuous stable sliding of unlocked portions of the fault, and can account for approximately 25 millimeters of motion along the fault per year. The other type is called a “creep event,” sudden slow movement, lasting only a few hours, and accommodating approximately 3 centimeters of slip per event. Creep events are separated by long intervals of slow continuous creep.
“Normal earthquakes happen when the locked portions of the fault rupture under the strain of accumulated stress and the plates move or slip along the fault,” says the study’s lead author, WHOI postdoctoral scholar Matt Wei. “This kind of activity is only a portion of the total fault movement per year. However, a significant fraction of the total slip can be attributed to fault creep.”
Scientists have mapped out the segments of the San Andreas fault that experience these different kinds of creep, and which segments are totally “locked,” experiencing no movement at all until an earthquake rupture. They know the source of earthquakes is a layer of unstable rock at about 5- 15 km depth along the fault. But have only recently begun to understand the source of fault creep.
For nearly two decades, geologists have accepted and relied upon a mechanical model to explain the geologic source of fault creep. This model explains that continuous creep is generated in the upper-most “stable” sediment layer of the fault plane and episodic creep events originate in a “conditionally stable” layer of rock sandwiched between the sediment and the unstable layer of rock (the seismogenic zone, where earthquakes originate) below it.
But when Wei and his colleagues tried to use this mechanical model to reproduce the geodetic data after a 1987 earthquake in southern California’s Superstition Hills fault, they found it is impossible to match the observations.
“Superstition Hills was a very large earthquake. Immediately following the quake, the US Geologic Survey installed creepmeters to measure the post-seismic deformation. The result is a unique data set that shows both afterslip and creep events,” says Wei.
The researchers could only match the real world data set and on-the-ground observations by embedding an additional unstable layer within the top sediment layer of the model. “This layer may result from fine-scale lithological heterogeneities within the stable zone — frictional behavior varies with lithology, generating the instability,” the authors write. “Our model suggests that the displacement of and interval between creep events are dependent on the thickness, stress, and frictional properties of the shallow, unstable layer.”
There are major strike-slip faults like the San Andreas around the world, but the extent of creep events along those faults is something of a mystery. “Part of the reason is that we don’t have creepmeters along these faults, which are often in sparsely populated areas. It takes money and effort, so a lot of these faults are not covered [with instruments]. We can use remote sensing to know if they are creeping, but we don’t know if it’s from continuous creep or creep events,” says Wei.
Simulating faults to better understand how stress, strain, and earthquakes work is inherently difficult because of the depth at which the important processes happen. Recovering drill cores and installing instruments at significant depths within Earth is very expensive and still relatively rare. “Rarely are the friction tests done on real cores,” says Wei. “Most of the friction tests are done on synthetic cores. Scientists will grind rocks into powder to simulate the fault.” Decades of these experiments have provided an empirical framework to understand how stress and slip evolve on faults, but geologists are still a long way from having numerical models tailored to the parameters that hold for particular faults in the Earth.
McGuire says the new research is an important step in ground-truthing those lab simulations. “This work has shown that the application of the friction laws derived from the lab can accurately describe some first order variations that we observe with geodesy between different faults in the real world,” he says. “This is an important validation of the scaling up of the lab results to large crustal faults.”
For the scientists, this knowledge is a new beginning for further research into understanding fault motion and the events that trigger them. Creep events are important because they are shallow and release stress, but are still an unknown factor in understanding earthquake behavior. “There’s much we still don’t know. For example, it’s possible that the shallow layer source of creep events could magnify an earthquake as it propagates through these layers,” says Wei.
Additionally, the findings can help understand the slow slip events happening along subduction zones, like the ongoing event in New Zealand. “By validating the friction models with shallow creep events that have very precise data, we can have more confidence in the mechanical implications of the deep subduction zone events,” McGuire says.
Note : The above story is reprinted from materials provided by Woods Hole Oceanographic Institution.
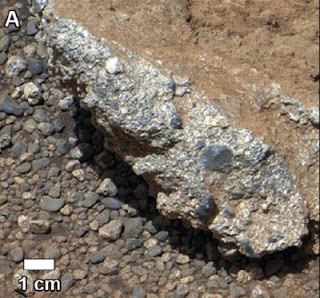
Multiple outcroppings of rocks like this one (termed a pebble conglomerate) were observed along the first 275 meters traversed by the rover with the high-resolution Mastcam. Credit: NASA
Rocks analyzed by NASA’s Mars Curiosity Rover team, including Linda Kah, associate professor of earth and planetary sciences at the University of Tennessee, Knoxville, provide solid evidence that Mars had rivers or streams.
Despite satellite images that show vast networks of channels, past Mars rover missions have shown limited evidence for flowing water on Mars.
Now, rocks analyzed by NASA’s Mars Curiosity Rover team, including Linda Kah, associate professor of earth and planetary sciences at the University of Tennessee, Knoxville, provide solid evidence that Mars had rivers or streams. This suggests that the environment was drastically different than today’s cold and dry conditions, with the potential to support life.
A paper on the team’s findings is published in this week’s edition of Science.
Since its landing last August, the Curiosity Rover has been looking for clues to whether the Martian surface has ever had environments capable of sustaining, or potentially evolving, life. Critical evidence may include hydrated minerals or water-bearing minerals, organic compounds or other chemical ingredients related to life.
Scientists of the Mars Science Laboratory mission used images collected from the rover’s MastCam, which includes two high-resolution cameras mounted onto its mast. The cameras take full-color images and have filters that can isolate wavelengths of light that provide information about minerals present on the planet’s surface.
As the rover moved from its landing site to its current location in “Yellowknife Bay,” the cameras captured images of large rock formations composed of many rounded pebbles cemented into beds several centimeters thick. While such deposits are very common on Earth, the presence of these types of rocks on Mars has great significance for the Red Planet.
“These (rock formations) point to a past on Mars that was warmer, and wet enough to allow water to flow for many kilometers across the surface of Mars,” said Kah, who helped work the cameras.
The clasts, or pebbles within the rock formation, appear to have been rounded by erosion while carried through water, such as in a stream or river. The size and orientation of the pebbles suggest they may have been carried by one or more shallow, fast-moving streams.
Using published abrasion rates and taking into consideration reduced gravity, the scientists estimate the pebbles were moved at least a few kilometers. Analyzing the grain size distribution and similar rock formations, the scientists believe the river was less than a meter deep and the water’s average velocity was 0.2 to 0.75 meters per second.
“These rocks provide a record of past conditions at the site that contrasts with the modern Martian environment, whose atmospheric conditions make liquid water unstable,” said Kah. “Finding ancient river deposits indicates sustained liquid water flows across the landscape, and raises prospects of once habitable conditions.”
Note : The above story is reprinted from materials provided by University of Tennessee at Knoxville
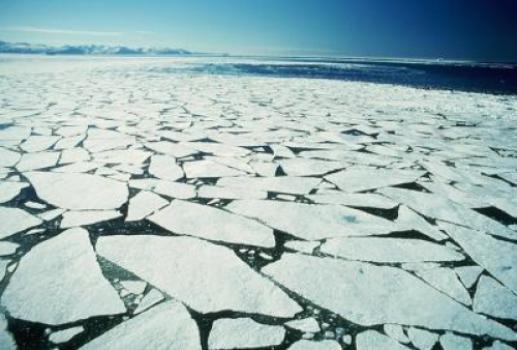
Arctic sea ice formation feeds global ocean circulation. New evidence suggests that this dynamic process persisted through the last ice age. (Credit: National Snow & Ice Data Center)
During the last ice age, when thick ice covered the Arctic, many scientists assumed that the deep currents below that feed the North Atlantic Ocean and help drive global ocean currents slowed or even stopped. But in a new study in Nature, researchers show that the deep Arctic Ocean has been churning briskly for the last 35,000 years, through the chill of the last ice age and warmth of modern times, suggesting that at least one arm of the system of global ocean currents that move heat around the planet has behaved similarly under vastly different climates.
“The Arctic Ocean must have been flushed at approximately the same rate it is today regardless of how different things were at the surface,” said study co-author Jerry McManus, a geochemist at Columbia University’s Lamont-Doherty Earth Observatory.
Researchers reconstructed Arctic circulation through deep time by measuring radioactive trace elements buried in sediments on the Arctic seafloor. Uranium eroded from the continents and delivered to the ocean by rivers, decays into sister elements thorium and protactinium. Thorium and protactinium eventually attach to particles falling through the water and wind up in mud at the bottom. By comparing expected ratios of thorium and protactinium in those ocean sediments to observed amounts, the authors showed that protactinium was being swept out of the Arctic before it could settle to the ocean bottom. From the amount of missing protactinium, scientists can infer how quickly the overlying water must have been flushed at the time the sediments were accumulating.
“The water couldn’t have been stagnant, because we see the export of protactinium,” said the study’s lead author, Sharon Hoffmann, a geochemist at Lamont-Doherty.
The upper part of the modern Arctic Ocean is flushed by North Atlantic currents while the Arctic’s deep basins are flushed by salty currents formed during sea ice formation at the surface. “The study shows that both mechanisms must have been active from the height of glaciation until now,” said Robert Newton, an oceanographer at Lamont-Doherty who was not involved in the research. “There must have been significant melt-back of sea ice each summer even at the height of the last ice age to have sea ice formation on the shelves each year. This will be a surprise to many Arctic researchers who believe deep water formation shuts down during glaciations.”
The researchers analyzed sediment cores collected during the U.S.-Canada Arctic Ocean Section cruise in 1994, a major Arctic research expedition that involved several Lamont-Doherty scientists. In each location, the cores showed that protactinium has been lower than expected for at least the past 35,000 years. By sampling cores from a range of depths, including the bottom of the Arctic deep basins, the researchers show that even the deepest waters were being flushed out at about the same rate as in the modern Arctic.
The only deep exit from the Arctic is through Fram Strait, which divides Greenland and Norway’s Svalbard islands. The deep waters of the modern Arctic flow into the North Atlantic via the Nordic seas, contributing up to 40 percent of the water that becomes North Atlantic Deep Water — known as the “ocean’s lungs” for delivering oxygen and salt to the rest of world’s oceans.
One direction for future research is to find out where the missing Arctic protactinium of the past ended up. “It’s somewhere,” said McManus. “All the protactinium in the ocean is buried in ocean sediments. If it’s not buried in one place, it’s buried in another. Our evidence suggests it’s leaving the Arctic but we think it’s unlikely to get very far before being removed.”
Note : The above story is reprinted from materials provided by The Earth Institute at Columbia University.
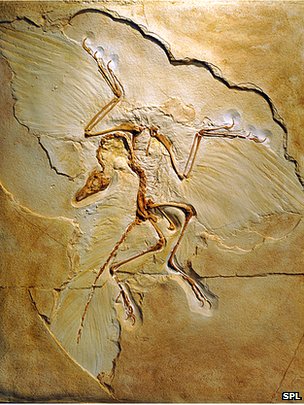
The first Archaeopteryx fossils were discovered in the 1860s
A Jurassic fossil that had been languishing in the archives of a Chinese museum may qualify as the first known bird, researchers say. If they are right, it could mean that flight evolved in dinosaurs only once, in the lineage that led to modern birds.
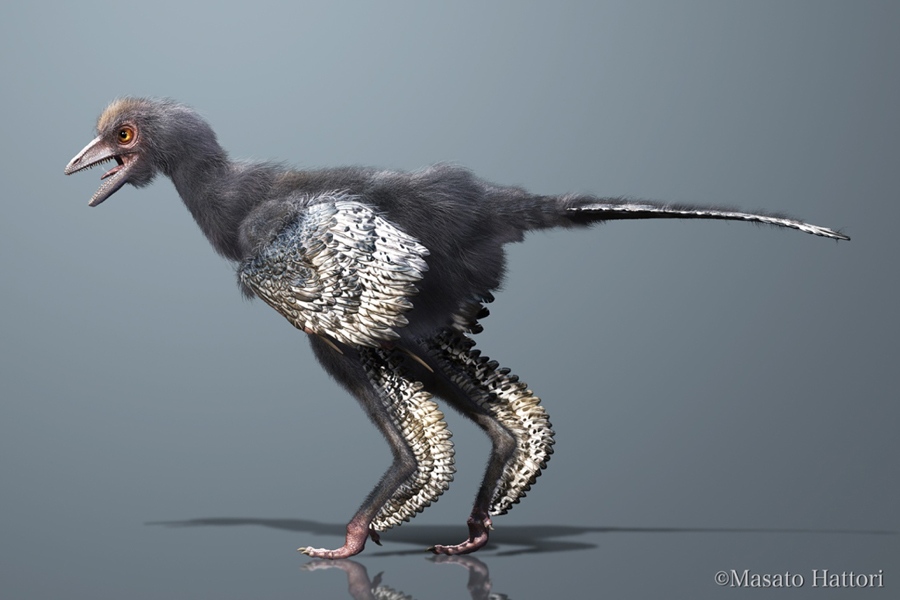
The half-metre tall Aurornis xui, which lived in China 150 million years ago, is believed to be the earliest known member of the bird family tree. Artist’s impression by Masato Hattori
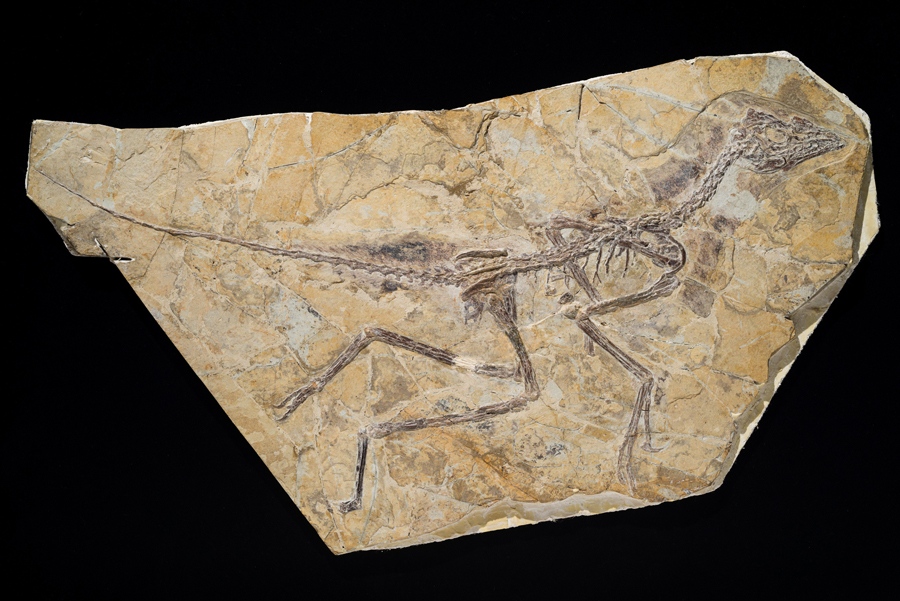
The single specimen of Aurornis xui was unearthed by a farmer in China’s Liaoning Province and had been unidentified until palaeontologist Pascal Godefroit found it last year in the museum at the Fossil and Geology Park in Yizhou.
The specimen measures about half a metre from the tip of its beak to the end of its tail. The feathered
dinosaur, which lived about 150 million years ago, had small, sharp teeth. It also had long forelimbs that presumably helped it to glide through Jurassic forests.
“In my opinion, it’s a bird,” says Godefroit, who is at the Royal Belgian Institute of Natural Sciences in Brussels. “But these sorts of hypotheses are very controversial. We’re at the origins of a group. The differences between birds and [non-avian] dinosaurs are very thin.” Godefroit and his colleagues describe the fossil in a paper published on Nature‘s website today.
Godefroit says that Aurornis probably couldn’t fly, but that it’s hard to be sure because the feathers of the fossil are not well-preserved. Instead, he says, it probably used its wings to glide from tree to tree. But, Godefroit says, several features, including its hip bones, clearly mark it out as a relative of modern birds.
Evolutionary flight path
The Aurornis specimen had lain unidentified in a Chinese museum’s archives until it was found by a palaeontologist last year. Thierry Hubin/IRSNB
The once sharp line between dinosaurs and birds has become blurrier in recent years as new feathered
Godefroit and his colleagues contend that Aurornis is the oldest known member of the Avialae, the group that includes every animal that is more closely related to modern birds than to non-avian dinosaurs such as Velociraptor. With Aurornis rooted at the base of the avian tree, the researchers place Archaeopteryx further up the trunk, firmly within the Avialae lineage, and not with the non-avian dinosaurs as other researchers recently suggested.
Godefroit notes that putting Archaeopteryx back within the bird lineage means that powered flight need have evolved only once among birds and dinosaurs. If Archaeopteryx, with its relatively well-developed wings, was more closely related to Velociraptor than to birds, powered flight would have had to evolve twice.
fossils have surfaced in China. Godefroit sees a clear continuum from Aurornis to the more advanced Archaeopteryx, whose own place on the avian family tree has long been a matter of controversy.
Not everyone is convinced of Aurornis’s primacy. Luis Chiappe, director of the Dinosaur Institute at the Natural History Museum of Los Angeles in California, believes that Archaeopteryx is still the oldest known creature that deserves the title of ‘bird’. Aurornis, he says, “is something that’s very close to the origin of birds, but it’s not a bird”. But, he adds, it is a “great, interesting specimen that pushes our understanding of the evolution of birds back another 10 million years”.
Godefroit says that such institutions such as the museum in Yizhou hold hundreds of yet-to-be described specimens that could further illuminate the picture of avian evolution. “The biodiversity of these small, bird-like dinosaurs was incredible,” he says.
Note : The above story is reprinted from materials provided by Naturedoi:10.1038/nature.2013.13088
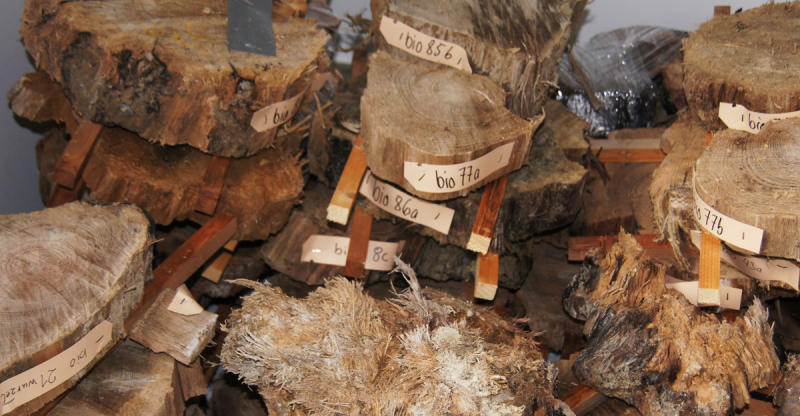
The wood samples are carefully inventoried and prepared for analysis in the laboratory. (Credit: WSL / Gottardo Pestalozzi)
The fact that many finds have happened by chance was demonstrated again recently in Zurich. Daniel Nievergelt, a dendrochronologist at the Swiss Federal Institute for Forest, Snow and Landscape Research WSL, was just having a look at a building site on the southern edge of the city. He knew there was some justification for hope of a spectacular discovery from his collaboration with his colleague Felix Kaiser, who died in 2012 and who in 1999 had already found subfossil* wood during the excavation of the Uetliberg Highway Tunnel.
The researcher took a closer examination of a few tree stumps on the edge of the loamy building pit in the neighborhood of Zurich Binz that had been discarded by the construction workers as waste timber. He found they were pine trees, and immediately investigated them further with colleagues from the WSL. He also sent three samples to the Swiss Federal Institute of Technology (ETH), where they were C14-dated. This confirmed his suspicions: the timber was discovered to go back to between 12,846 BP** and 13,782 BP. With the support of the building-site management, to date the WSL researchers have managed to salvage some 200 pine-tree stumps, which they have had transported in truckloads to the WSL. To the knowledge of the researchers involved, the quality and scale of the find are unique worldwide.
What the find could mean for science
WSL runs one of the leading laboratories for tree-ring research (dendrochronology) worldwide, making a significant contribution to research work in a wide range of disciplines. The most recent finds are being incorporated into a global database of environmental archives and may provide important information about a number of research questions: What was the climate like after the last Ice Age? What events left a mark on the area around Zurich and Earth in general? What is the genetic relationship between the Zurich Binz pines and their cognates today? In addition, the prehistoric wood in Zurich Binz could help in the calibration of the C14 curve.
The tree rings and condition and location of the discovered stumps allow conclusions to be drawn about past fluctuations in temperature and precipitation and attest to disturbances such as fires, storms and earthquakes. The density and chemical composition of the wood may provide clues to the climate and air composition in the past. And since relatively recently, aDNA analysis allow trees’ evolution to be traced.
All the data produced to be published
The WSL researchers are now sawing three sections from each useable stump and are analyzing the wood and the rings in their own laboratories and in those of their partners. The scientists will first try to add to the Central European dendrochronology chart (see image). This dataset contains dated tree rings going back to 12594 BP. The finds that have been made up to now in Zurich are from the period from 12700 BP to 14100 BP. Through meticulous comparison of tree-ring patterns, efforts are now being made to identify the overlaps needed for precise dating. Perhaps the new-found timbers can fill a gap and extend the chronology by around 2,000 years. Whatever the case may be, the timbers discovered in Zurich Binz and the data arising from their analysis are of invaluable scientific importance. In the tradition of open scientific exchange, the WSL will gradually make such data public, for instance through the International Tree-Ring Data Bank (ITRDB), which for decades now has been supplied with a wealth of data by the WSL’s tree-ring laboratory and its founder, Fritz Schweingruber.
* Subfossil = any prehistoric organism which has not fossilized, or only partially. Unlike fossils, subfossils can be dated using the C14 method (source: Wikipedia).
** BP = Before Present: a time-scale that is used in archaeology, geology and other sciences to date events in the past. Since ‘the present’ is constantly changing, international consensus was reached on making 1 January 1950 or the calendar year 1950 the point of reference (source: Wikipedia).
Note : The above story is reprinted from materials provided by Swiss Federal Institute for Forest, Snow and Landscape Research WSL.
A typical, simple dinoflagellate associated with the early Oligocene epoch and found in 33 million year-old sediments. (Credit: IODP)
Seasonal primary productivity of plankton communities appeared with the first ice. This phenomenon, still active today, influences global food webs. These findings, reported in the journal Science, are based on fossil records in sediment cores at different depths.
The study was led by the Andalusian Institute of Earth Sciences, a Spanish National Research Council-University of Granada joint centre.
The Antarctic continental ice cap came into existence during the Oligocene epoch, some 33.6 million years ago, according to data from an international expedition led by the Andalusian Institute of Earth Sciences (IACT) — a Spanish National Research Council-University of Granada joint centre. These findings, based on information contained in ice sediments from different depths, have recently been published in the journal Science.
Before the ice covered Antarctica, Earth was a warm place with a tropical climate. In this region, plankton diversity was high until glaciation reduced the populations leaving only those capable of surviving in the new climate.
The Integrated Ocean Drilling Program international expedition has obtained this information from the paleoclimatic history preserved in sediment strata in the Antarctic depths. IACT researcher Carlota Escutia, who led the expedition, explains that “the fossil record of dinoflagellate cyst communities reflects the substantial reduction and specialization of these species that took place when the ice cap became established and, with it, marked seasonal ice-pack formation and melting began.”
The appearance of the Antarctic polar icecap marks the beginning of plankton communities that are still functioning today. This ice-cap is associated with the ice-pack, the frozen part that disappears and reappears as a function of seasonal climate changes.
The article reports that when the ice-pack melts as the Antarctic summer approaches, this marks the increase in primary productivity of endemic plankton communities. When it melts, the ice frees the nutrients it has accumulated and these are used by the plankton. Dr Escutia says “this phenomenon influences the dynamics of global primary productivity.”
Since ice first expanded across Antarctica and caused the dinoflagellate communities to specialize, these species have been undergoing constant change and evolution. However, the IACT researcher thinks “the great change came when the species simplified their form and found they were forced to adapt to the new climatic conditions.”
Pre-glaciation sediment contained highly varied dinoflagellate communities, with star-shaped morphologies. When the ice appeared 33.6 million years ago, this diversity was limited and their activity subjected to the new seasonal climate.
Note : The above story is reprinted from materials provided by University of Granada.
Officials in Chile and Argentina issue a red alert to citizens living around the Copahue volcano, which sits on the border of both countries. Monday’s red alert, which is the highest level, also calls for the evacuation of nearly 3,000 people as activity increases on the mountaintop.
Andres Chadwick, Chile’s Interior and Security Minister, said the increased activity could lead to an eruption, leading officials to begin evacuating families within a 15.5-mile radius of Copahue. “This evacuation is obligatory; it’s not voluntary,” he told The Associated Press (AP).
Chile’s Emergency Office said the evacuation will last at least 48 hours depending on the level of activity. The agency added that heavy rains have also moved into the area, further complicating matters, possibly prolonging evacuations.
The nearly 10,000-foot-high Copahue volcano, which is nestled within Chile’s Bio Bio region and Argentina’s Neuquen province, last erupted in 1992, according to Chilean Mining Ministry’s Sernageomin geology unit. However, it became active again in 2002, and has recently picked up in activity. The volcano has been releasing gas and producing minor tremors, as registered by area seismometers.
Officials from the region last issued a red alert in December 2012 after the volcano began spewing ash and gas, forcing a temporary evacuation of nearby residents, reports BBC affiliate CBBC.
About 600 residents of Caviahue, Argentina were evacuated late Monday afternoon when the volcano began spewing clouds of gas.
“The volcano is not erupting yet, but as a preventive measure we’ve decided to evacuate the population,” Argentina’s Neuquen Crisis Committee told AP. “There are no ashes in Caviahue. The vapor plume has descended, but in the last days, seismic activity has increased. That’s the reason behind the change of alert in Argentina and Chile.”
Chile has more than 3,000 active, dormant or extinct volcanoes within the Andes Mountains. Copahue is by far the most productive of the 500 that are still relatively active in the region. The peak of the mountain has nine volcanic craters within a 1.2-mile area and a large acidic crater lake on the eastern ridge.
There have been at least six major eruptions on Copahue since the rise of the Holocene, about 12,000 years ago.
Note : The above story is reprinted from materials provided by Lawrence LeBlond for redOrbit