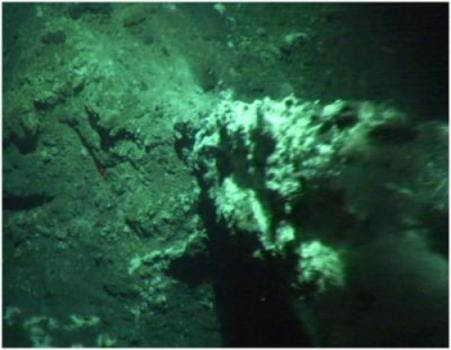
The image, taken by SHRIMP, shows the small relict chimney (around two meters high) found on the seafloor at Hook Ridge at a depth of around 1,200 meters. Emanating hydrothermal fluid is visible as shimmering water. Image courtesy of the National Oceanography Centre, Southampton. (Credit: Image courtesy of National Oceanography Centre, Southampton)
The location of an underwater volcanic vent, marked by a low-lying plume of shimmering water, has been revealed by scientists at the National Oceanography Centre, Southampton.Writing in the journal PLOS ONE the researchers describe how the vent, discovered in a remote region of the Southern Ocean, differs from what we have come to recognise as “classic” hydrothermal vents. Using SHRIMP, the National Oceanography Centre’s high resolution deep-towed camera platform, scientists imaged the seafloor at Hook Ridge, more than 1,000 metres deep.
The study, funded by the Natural Environment Research Council (NERC), aimed to build on our knowledge of how deep-sea creatures associated with hydrothermal activity evolve and migrate between different regions.
Hydrothermal vents are like hot springs, spewing jets of water from the seafloor out into the ocean. The expelled water, if hot enough, is rich in dissolved metals and other chemicals that can nourish a host of strange-looking life, via a process called “chemosynthesis.” The hot water, being more buoyant than the surrounding cold seawater, rises up like a fountain or “plume,” spreading the chemical signature up and out from the source.
The Hook Ridge vent, however, was found to lack the high temperatures and alien-like creatures that we now associate with hot hydrothermal vents. Instead there was a low-lying plume of shimmering water, caused by differences relative to the surrounding seawater in certain properties, such as salinity.
“Geochemical measurements of the water column provided evidence of slightly reducing, localised plumes close to the seafloor at Hook Ridge,” said Dr Alfred Aquilina, lead author and former research fellow at University of Southampton Ocean and Earth Science, which is based at the centre.
“We therefore went in with sled-mounted cameras towed behind the Royal Research Ship James Cook and saw shimmering water above the seafloor, evidence of hydrothermal fluid seeping through the sediment.”
So why were there no strange creatures around the vent? The team investigated this particular area of the deep-sea because prior measurements of the water column above Hook Ridge detected chemical changes consistent with a hydrothermal plume. On investigation, there was also a small relict “chimney” of precipitated minerals on the seafloor, which suggests that the hydrothermal fluid flowing from the vent was once warmer.
The researchers therefore propose that hydrothermal activity at Hook Ridge is too irregular to provide the vital chemicals that support chemosynthetic life.
Dr Aquilina explained why this was an important finding: “This region was investigated because hydrothermal systems in this part of the Southern Ocean may potentially act as stepping stones for genetic material migrating between separate areas in the world ocean,” he said.
“The more hydrothermal vents we can find and investigate, the more we can understand about the evolution and dispersal of the creatures that live off the chemicals expelled in these dark, deep environments.”
The work was carried out as part of the ChEsSO project, which investigates chemosynthetic environments and associated ecosystems south of the Polar Front. Co-authors are from the University of Southampton Ocean and Earth Science and the National Oceanography Centre.
Note : The above story is reprinted from materials provided by National Oceanography Centre.
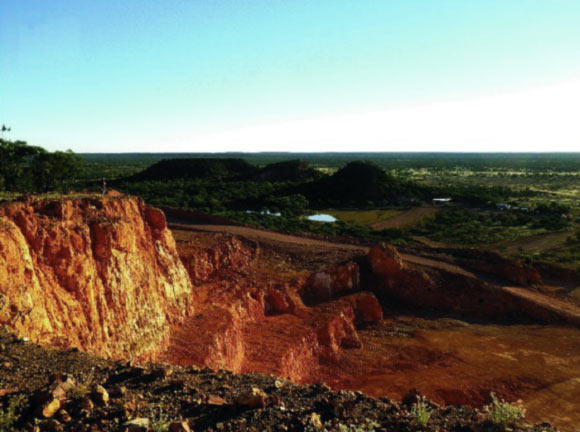
Alaric opal mine is located within the weathered sandstone and mudstone of the Winton Formation, Queensland. Opalized horizon corresponds to a flat pre-late Paleocene paleosurface, buried underneath Cenozoic sediments (P. F. Rey, 2013)
Australia produces over 90 percent of the world’s supply of opal. “Before this we did not know its origin, why it forms at such shallow depths or why it can be found in central Australia and almost nowhere else on Earth,” Prof Rey said.
“The formation of Australian opal was due to an extraordinary episode of acidic weathering, during the drying out of the central Australian landscape.”
These processes occurred when the Eromanga sea, a vast body of water covering 60 percent of Australia, extending from Coober Pedy to the Carpentaria Basin and across to Lightning Ridge, started retreating.
“Between 100 and 97 million years ago this sea came to cover a much smaller area. This meant the previously inundated central Australian landscape started drying out and acidic weathering happened on a massive scale when pyrite minerals released sulfuric acid,” Prof Rey explained.
Acidic weathering of the type that took place in Central Australia is unique on Earth at that scale, covering an estimated 1.3 million sq. km, but it has been described at the surface of Mars.
“The United States and the European community have invested billions of dollars to send orbiters and rovers to Mars in the hope of finding extra-terrestrial life but Central Australia offers a unique natural laboratory where potential Martian bio-geological processes could be studied,” concluded Prof Rey, who reported the findings in a paper in the Australian Journal of Earth Sciences.
Reference:
Bibliographic information: P. F. Rey. 2013. Opalisation of the Great Artesian Basin (central Australia): an Australian story with a Martian twist. Australian Journal of Earth Sciences: An International Geoscience Journal of the Geological Society of Australia, vol. 60, no. 3; DOI: 10.1080/08120099.2013.784219
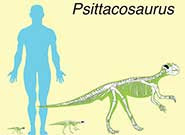
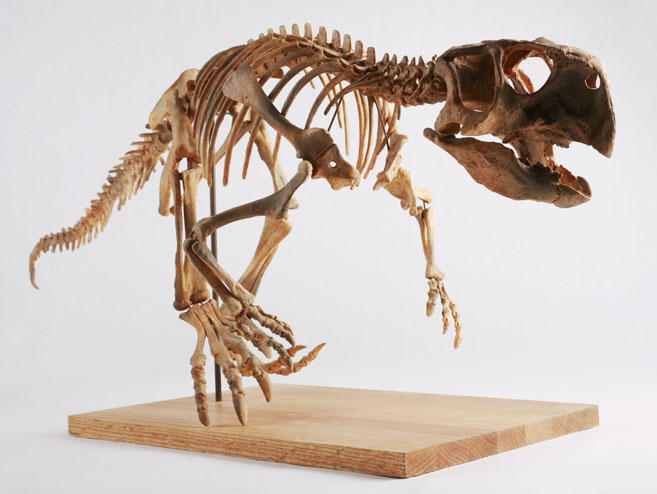
Tracking the growth of dinosaurs and how they changed as they grew is difficult. Using a combination of biomechanical analysis and bone histology, palaeontologists from Beijing, Bristol, and Bonn have shown how one of the best-known dinosaurs switched from four feet to two as it grew.
Psittacosaurus, the ‘parrot dinosaur’ is known from more than 1000 specimens from the Cretaceous, 100 million years ago, of China and other parts of east Asia. As part of his PhD thesis at the University of Bristol, Qi Zhao, now on the staff of the Institute for Vertebrate Paleontology in Beijing, carried out the intricate study on bones of babies, juveniles and adults.
Dr Zhao said: “Some of the bones from baby Psittacosaurus were only a few millimetres across, so I had to
handle them extremely carefully to be able to make useful bone sections. I also had to be sure to cause as little damage to these valuable specimens as possible.”
With special permission from the Beijing Institute, Zhao sectioned two arm and two leg bones from 16 individual dinosaurs, ranging in age from less than one year to 10 years old, or fully-grown. He did the intricate sectioning work in a special palaeohistology laboratory in Bonn, Germany,
The one-year-olds had long arms and short legs, and scuttled about on all fours soon after hatching. The bone sections showed that the arm bones were growing fastest when the animals were ages one to three years. Then, from four to six years, arm growth slowed down, and the leg bones showed a massive growth spurt, meaning they ended up twice as long as the arms, necessary for an animal that stood up on its hind legs as an adult.
Professor Xing Xu of the Beijing Institute, one of Dr Zhao’s thesis supervisors, said: “This remarkable study, the first of its kind, shows how much information is locked in the bones of dinosaurs. We are delighted the study worked so well, and see many ways to use the new methods to understand even more about the astonishing lives of the dinosaurs.”
Professor Mike Benton of the University of Bristol, Dr Zhao’s other PhD supervisor, said: “These kinds of studies can also throw light on the evolution of a dinosaur like Psittacosaurus. Having four-legged babies and juveniles suggests that at some time in their ancestry, both juveniles and adults were also four-legged, and Psittacosaurus and dinosaurs in general became secondarily bipedal.”
The paper is published today in Nature Communications. Note : The above story is reprinted from materials provided by University of Bristol
A Psittacosaurus skeleton cast in the permanent collection of The Children’s Museum of Indianapolis. (Credit: Photo by Michelle Pemberton, via Wikimedia Commons (Creative Commons license))
Tracking the growth of dinosaurs and how they changed as they grew is difficult. Using a combination of biomechanical analysis and bone histology, palaeontologists from Beijing, Bristol, and Bonn have shown how one of the best-known dinosaurs switched from four feet to two as it grew.
Psittacosaurus, the ‘parrot dinosaur’ is known from more than 1000 specimens from the Cretaceous, 100 million years ago, of China and other parts of east Asia. As part of his PhD thesis at the University of Bristol, Qi Zhao, now on the staff of the Institute for Vertebrate Paleontology in Beijing, carried out the intricate study on bones of babies, juveniles and adults.
Dr Zhao said: “Some of the bones from baby Psittacosaurus were only a few millimetres across, so I had to handle them extremely carefully to be able to make useful bone sections. I also had to be sure to cause as little damage to these valuable specimens as possible.”
With special permission from the Beijing Institute, Zhao sectioned two arm and two leg bones from 16 individual dinosaurs, ranging in age from less than one year to 10 years old, or fully-grown. He did the intricate sectioning work in a special palaeohistology laboratory in Bonn, Germany,
The one-year-olds had long arms and short legs, and scuttled about on all fours soon after hatching. The bone sections showed that the arm bones were growing fastest when the animals were ages one to three years. Then, from four to six years, arm growth slowed down, and the leg bones showed a massive growth spurt, meaning they ended up twice as long as the arms, necessary for an animal that stood up on its hind legs as an adult.
Professor Xing Xu of the Beijing Institute, one of Dr Zhao’s thesis supervisors, said: “This remarkable study, the first of its kind, shows how much information is locked in the bones of dinosaurs. We are delighted the study worked so well, and see many ways to use the new methods to understand even more about the astonishing lives of the dinosaurs.”
Professor Mike Benton of the University of Bristol, Dr Zhao’s other PhD supervisor, said: “These kinds of studies can also throw light on the evolution of a dinosaur like Psittacosaurus. Having four-legged babies and juveniles suggests that at some time in their ancestry, both juveniles and adults were also four-legged, and Psittacosaurus and dinosaurs in general became secondarily bipedal.”
Note : The above story is reprinted from materials provided by University of Bristol.
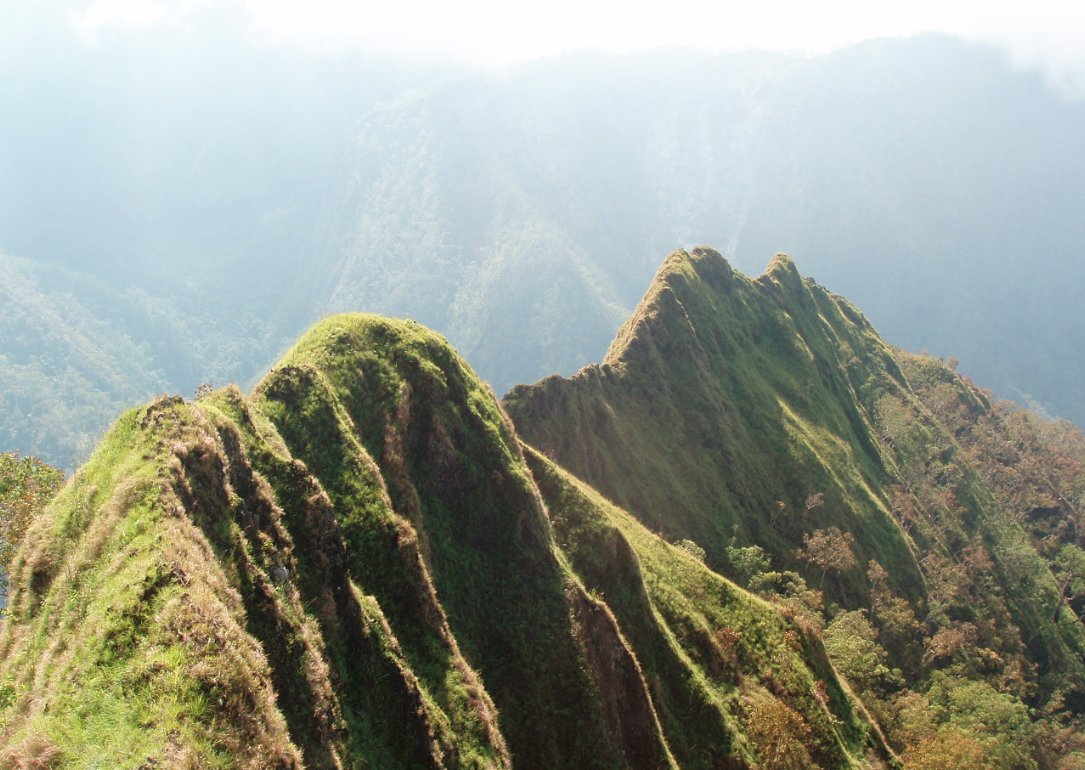
Very steep topography in East Timor. The evolution of this mountain range is dominated by ongoing feedbacks between landslides and river erosion. Credit: Mike Sandiford
Scientists have discovered the reasons behind the lifespan of some of the world’s iconic mountain ranges.
The study conducted by the University of Melbourne, Australia, and Aarhus University, Denmark, has revealed that interactions between landslides and erosion, caused by rivers, explains why some mountain ranges exceed their expected lifespan.
Co-author Professor Mike Sandiford of the School of Earth Sciences at the University of Melbourne said the study had answered the quandary as to why there was fast erosion in active mountain ranges in the Himalayas and slow erosion in others such as the Great Dividing Range in Australia or the Urals in Russia.
“We have shown that links between landslides and rivers are important in maintaining erosion in active or ancient mountain ranges,” he said.
“This study is a great insight into the origins and topography of our globe’s mountainous landscape.”
Mountain ranges are expected to erode away in the absence of tectonic activity but several ranges, such as the Appalachians in the US and the Urals in Russia, have been preserved over several hundred million years.
Co-author, Professor David Egholm from Aarhus University said the new model study published in Nature today provided a plausible mechanism for the preservation of tectonically inactive mountain ranges.
“Computational simulations performed for the study revealed that variations in mountain erosion may relate to a coupling between river incision and landslides,” he said.
Researchers said rivers can cut through bedrock and this process is thought to be the major factor in controlling mountain erosion, however, the long-term preservation of some mountains is at odds with some of the underlying assumptions regarding river erosion rates in current models of river-based landscape evolution.
The study revealed landslides affected river erosion rates in two ways. Large landslides overwhelm river transport capacity and can protect the riverbed from further erosion; conversely, landslides also deliver abrasive agents to the streams, thereby accelerating erosion.
Feedback between these processes can help to stabilize the rates of erosion and increase the lifespan of mountains, the authors said.
Note: The above story is reprinted from materials provided by The University of Melbourne
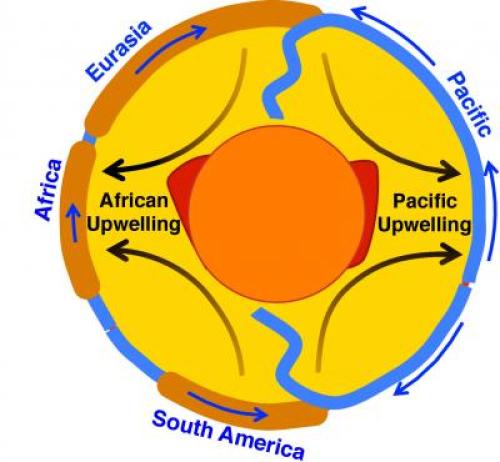
This is a diagram showing a slice through the Earth’s mantle, cutting across major mantle upwelling locations beneath Africa and the Pacific. Credit: C. Conrad (UH SOEST)
A study published in Nature today shares the discovery that large-scale upwelling within Earth’s mantle mostly occurs in only two places: beneath Africa and the Central Pacific. More importantly, Clinton Conrad, Associate Professor of Geology at the University of Hawaii — Manoa’s School of Ocean and Earth Science and Technology (SOEST) and colleagues revealed that these upwelling locations have remained remarkably stable over geologic time, despite dramatic reconfigurations of tectonic plate motions and continental locations on the Earth’s surface. “For example,” said Conrad, “the Pangaea supercontinent formed and broke apart at the surface, but we think that the upwelling locations in the mantle have remained relatively constant despite this activity.”
Conrad has studied patterns of tectonic plates throughout his career, and has long noticed that the plates were, on average, moving northward. “Knowing this,” explained Conrad, “I was curious if I could determine a single location in the Northern Hemisphere toward which all plates are converging, on average.” After locating this point in eastern Asia, Conrad then wondered if other special points on Earth could characterize plate tectonics. “With some mathematical work, I described the plate tectonic ‘quadrupole’, which defines two points of ‘net convergence’ and two points of ‘net divergence’ of tectonic plate motions.”
When the researchers computed the plate tectonic quadruople locations for present-day plate motions, they found that the net divergence locations were consistent with the African and central Pacific locations where scientists think that mantle upwellings are occurring today. “This observation was interesting and important, and it made sense,” said Conrad. “Next, we applied this formula to the time history of plate motions and plotted the points — I was astonished to see that the points have not moved over geologic time!” Because plate motions are merely the surface expression of the underlying dynamics of the Earth’s mantle, Conrad and his colleagues were able to infer that upwelling flow in the mantle must also remain stable over geologic time. “It was as if I was seeing the ‘ghosts’ of ancient mantle flow patterns, recorded in the geologic record of plate motions!”
Earth’s mantle dynamics govern many aspects of geologic change on the Earth’s surface. This recent discovery that mantle upwelling has remained stable and centered on two locations (beneath Africa and the Central Pacific) provides a framework for understanding how mantle dynamics can be linked to surface geology over geologic time. For example, the researchers can now estimate how individual continents have moved relative to these two upwelling locations. This allows them to tie specific events that are observed in the geologic record to the mantle forces that ultimately caused these events.
More broadly, this research opens up a big question for solid earth scientists: What processes cause these two mantle upwelling locations to remain stable within a complex and dynamically evolving system such as the mantle? One notable observation is that the lowermost mantle beneath Africa and the Central Pacific seems to be composed of rock assemblages that are different than the rest of the mantle. Is it possible that these two anomalous regions at the bottom of the mantle are somehow organizing flow patterns for the rest of the mantle? How?
“Answering such questions is important because geologic features such as ocean basins, mountains belts, earthquakes and volcanoes ultimately result from Earth’s interior dynamics,” Conrad described. “Thus, it is important to understand the time-dependent nature of our planet’s interior dynamics in order to better understand the geological forces that affect the planetary surface that is our home.”
The mantle flow framework that can be defined as a result of this study allows geophysicists to predict surface uplift and subsidence patterns as a function of time. These vertical motions of continents and seafloor cause both local and global changes in sea level. In the future, Conrad wants to use this new understanding of mantle flow patterns to predict changes in sea level over geologic time. By comparing these predictions to observations of sea level change, he hopes to develop new constraints on the influence of mantle dynamics on sea level.
Note: The above story is reprinted from materials provided by University of Hawaii at Manoa, via EurekAlert!, a service of AAAS.
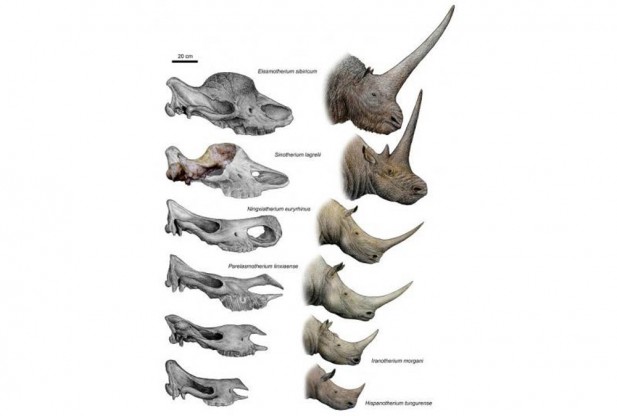
Thought to be the source of inspiration for unicorn paintings on prehistoric cave walls, the extinct genus of the Elasmotherium rhinoceros has always puzzled scientists, mostly because of a gap in the fossil record.
According to a new report from paleontologists at the Chinese Academy of Sciences in Beijing, a recently discovered skull of a Sinotherium lagrelii, a so-called tandem-horned rhino, has filled that gap.
“Morphological and phylogenetic analyses confirm that Sinotherium is a transitional (population) between Elasmotherium and other elasmotheres,” the Chinese researchers wrote in a report that appeared in the journal Chinese Science Bulletin.
Unlike other elasmotheres which had a weak or strong nasal horn, Elasmotherium had a massive, six-foot unicorn-like horn on its forehead. Found in the Late Miocene red clays of the Linxia Basin in northwestern China, the new skull was determined to be around 7 million years old and an intermediate stage between the two horn types.
Because previous fossils of S. lagrelii were only teeth or cranial and mandibular fragments, its horn morphology was completely unknown. Although the fossil has provided more information about where the species fits in taxonomically, researchers were not able to determine many details about its frontal horn, muddying the evolutionary picture somewhat. They said the species’ position in the evolutionary tree as one of transition is consistent with other related elasmotheres in this region of China.
According to the researchers, S. lagrelli’s elongated skull shape, facial structures, and wrinkled enamel allowed it to resist the abrasion of a high-fiber grass diet.
Paleontologists describe Sinotherium as a massive rhinoceros weighing up to 7.7 tons, making it heavier than the largest modern African white rhinos, which weigh in at about 3.5 to 4.0 tons. If the extinct rhino lived by the river, its size would mean regularly getting stuck in wet mud. This potential problem causes scientists to theorize that S. lagrelii lived in an open, semi-arid environment in northern China.
Stories of these unicorn-like rhinos are prominent throughout Chinese mythology. Known as k’i-lin, stories of the animal were supposedly adopted by Turkish and Mongolian cultures. Other unicorn-type creatures – some mythic, some possibly historical – are also found throughout ancient Chinese culture.
The elasmothere’s modern-day relatives continue to struggle in the face of threats from poaching and destruction of their habitat. According to South African officials, the number of rhinos killed since the start of 2013 has risen to 428. During the same time span, officials have arrested 122 individuals for rhino poaching. Officials said 57 were caught in the country’s Kruger National Park. Five people in possession of rhino horns were also arrested.
“On Sunday, Kruger National Park rangers made contact with a group of three poachers near Letaba,” a government spokesperson said. “One poacher was wounded during the shoot-out and later died of his wounds. The other poachers managed to escape.”
Kruger alone has lost 267 rhinos to poachers this year. One of the largest game reserves in Africa, the park’s anti-poaching unit consists of 650 rangers who employ automated movement sensors along the Mozambique border, drone helicopters, and a special dog unit to fend off poachers.
Note : The above story is reprinted from materials provided by Brett Smith for redOrbit
Book Name : 3-D Structural Geology
A Practical Guide to Quantitative Surface
and Subsurface Map Interpretation
Second Edition By : Richard H. Groshong, Jr. Author
Richard H. Groshong, Jr.
University of Alabama
and
3-D Structure Research
10641 Dee Hamner Rd.
Northport, AL 35475
USA
E-mail: [email protected]
Library of Congress Control Number: 2005937627
ISBN-10 3-540-31054-1 Springer Berlin Heidelberg New York
ISBN-13 978-3-540-31054-9 Springer Berlin Heidelberg New York
ISBN 3-540-65422-4 (first edition) Springer Berlin Heidelberg New York
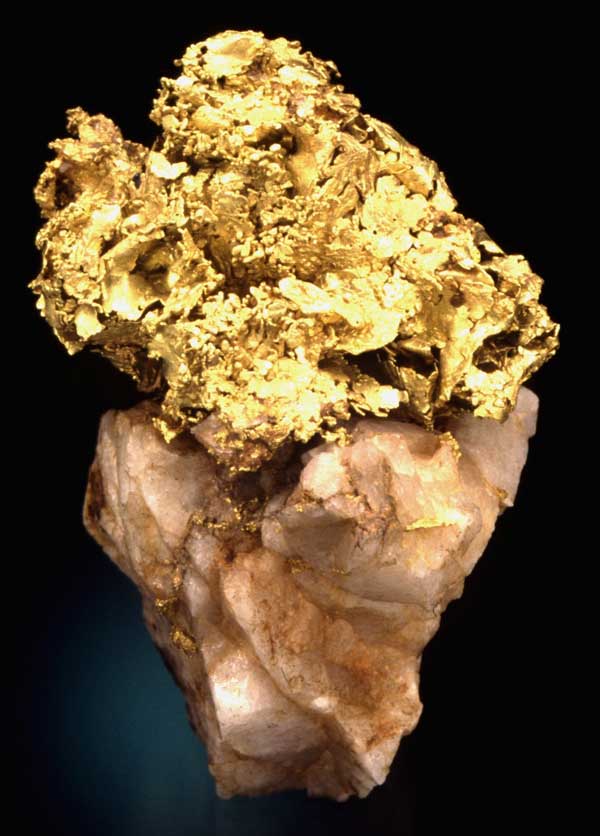
Gold, 6.8 cm high, Homestake Mine, Salmon River District, Siskiyou County. California State Mining and Mineral Museum.
Northwestern University scientists have struck gold in the laboratory. They have discovered an inexpensive and environmentally benign method that uses simple cornstarch — instead of cyanide — to isolate gold from raw materials in a selective manner.
This green method extracts gold from crude sources and leaves behind other metals that are often found mixed together with the crude gold. The new process also can be used to extract gold from consumer electronic waste.
Current methods for gold recovery involve the use of highly poisonous cyanides, often leading to contamination of the environment. Nearly all gold-mining companies use this toxic gold leaching process to sequester the precious metal.
“The elimination of cyanide from the gold industry is of the utmost importance environmentally,” said Sir Fraser Stoddart, the Board of Trustees Professor of Chemistry in the Weinberg College of Arts and Sciences. “We have replaced nasty reagents with a cheap, biologically friendly material derived from starch.”
Sir Fraser’s team discovered the process by accident, using simple test tube chemistry. A series of rigorous follow-up investigations provided evidence for the competitive strength of the new procedure.
The findings will be published May 14 in the online journal Nature Communications.
Zhichang Liu, a postdoctoral fellow in Stoddart’s lab and first author of the paper, took two test tubes containing aqueous solutions — one of the starch-derived alpha-cyclodextrin, the other of a dissolved gold (Au) salt (called aurate) — and mixed them together in a beaker at room temperature.
Liu was trying to make an extended, three-dimensional cubic structure, which could be used to store gases and small molecules. Unexpectedly, he obtained needles, which formed rapidly upon mixing the two solutions.
“Initially, I was disappointed when my experiment didn’t produce cubes, but when I saw the needles, I got excited,” Liu said. “I wanted to learn more about the composition of these needles.”
“Nature decided otherwise,” said Stoddart, a senior author of the paper. “The needles, composed of straw-like bundles of supramolecular wires, emerged from the mixed solutions in less than a minute.”
After discovering the needles, Liu screened six different complexes — cyclodextrins composed of rings of six (alpha), seven (beta) and eight (gamma) glucose units, each combined with aqueous solutions of potassium tetrabromoaurate (KAuBr4) or potassium tetrachloroaurate (KAuCl4).
He found that it was alpha-cyclodextrin, a cyclic starch fragment composed of six glucose units, that isolates gold best of all.
“Alpha-cyclodextrin is the gold medal winner,” Stoddart said. “Zhichang stumbled on a piece of magic for isolating gold from anything in a green way.”
Alkali metal salt waste from this new method is relatively environmentally benign, Stoddart said, while waste from conventional methods includes toxic cyanide salts and gases. The Northwestern procedure is also more efficient than current commercial processes.
The supramolecular nanowires, each 1.3 nanometers in diameter, assemble spontaneously in a straw-like manner. In each wire, the gold ion is held together in the middle of four bromine atoms, while the potassium ion is surrounded by six water molecules; these ions are sandwiched in an alternating fashion by alpha-cyclodextrin rings. Around 4,000 wires are bundled parallel to each other and form individual needles that are visible under an electron microscope.
“There is a lot of chemistry packed into these nanowires,” Stoddart said. “The elegance of the composition of single nanowires was revealed by atomic force microscopy, which throws light on the stacking of the individual donut-shaped alpha-cyclodextrin rings.”
The atomic detail of the single supramolecular wires and their relative disposition within the needles was uncovered by single crystal X-ray crystallography.
The research — a prime example of serendipity at work, brought to fruition by contemporary fundamental science — is poised to find technological application. This basic science has been forged by the team into a practical labscale process for the isolation of gold from scrap alloys.
Note : The above story is reprinted from materials provided by Northwestern University, via EurekAlert!, a service of AAAS.
DURHAM, NC — Homeowners living within one kilometer of shale gas wells appear to be at higher risk of having their drinking water contaminated by stray gases, according to a new Duke University-led study.
Duke scientists analyzed 141 drinking water samples from private water wells across northeastern Pennsylvania’s gas-rich Marcellus shale basin. Their study documented not only higher methane concentrations in drinking water within a kilometer of shale gas drilling — which past studies have shown — but higher ethane and propane concentrations as well.
Methane concentrations were six times higher and ethane concentrations were 23 times higher at homes within a kilometer of a shale gas well. Propane was detected in 10 samples, all of them from homes within a kilometer of drilling.
“The methane, ethane and propane data, and new evidence from hydrocarbon and helium isotopes, all suggest that drilling has affected some homeowners’ water,” said Robert B. Jackson, a professor of environmental sciences at Duke’s Nicholas School of the Environment. “In a minority of cases, the gas even looks Marcellus-like, probably caused by faulty well construction.”
The ethane and propane contamination data are “new and hard to refute,” Jackson stressed. “There is no biological source of ethane and propane in the region and Marcellus gas is high in both, and higher in concentration than the Upper Devonian gas found in-between.”
The team examined which factors might explain their results, including topography, distance to gas wells and distance to geologic features. “Distance to gas wells was, by far, the most significant factor influencing gases in the drinking water we sampled,” said Jackson.
The peer-reviewed findings will appear this week in the online Early Edition of the Proceedings of the National Academy of Sciences.
Hydraulic fracturing, also called hydrofracking or fracking, involves pumping water, sand and chemicals deep underground into horizontal gas wells at high pressure to crack open hydrocarbon-rich shale and extract natural gas. Accelerated shale gas drilling and hydrofracking in recent years has fueled concerns about contamination in nearby drinking water supplies.
Two previous peer-reviewed studies by Duke scientists found direct evidence of methane contamination in water wells near shale-gas drilling sites in northeastern Pennsylvania, as well as possible connectivity between deep brines and shallow aquifers. A third study conducted with U.S. Geological Survey scientists found no evidence of drinking water contamination from shale gas production in Arkansas. None of the studies have found evidence of contamination by fracking fluids.
“Our studies demonstrate that distances from drilling sites, as well as variations in local and regional geology, play major roles in determining the possible risk of groundwater impacts from shale gas development,” said Avner Vengosh, professor of geochemistry and water quality at Duke’s Nicholas School. “As such, they must be taken into consideration before drilling begins.”
“The helium data in this study are the first from a new tool kit we’ve devised for identifying contamination using noble gas isotopes,” said Duke research scientist Thomas H. Darrah. “These tools allow us to identify and trace contaminants with a high degree of certainty.”
Note : The above story is reprinted from materials provided by Duke University
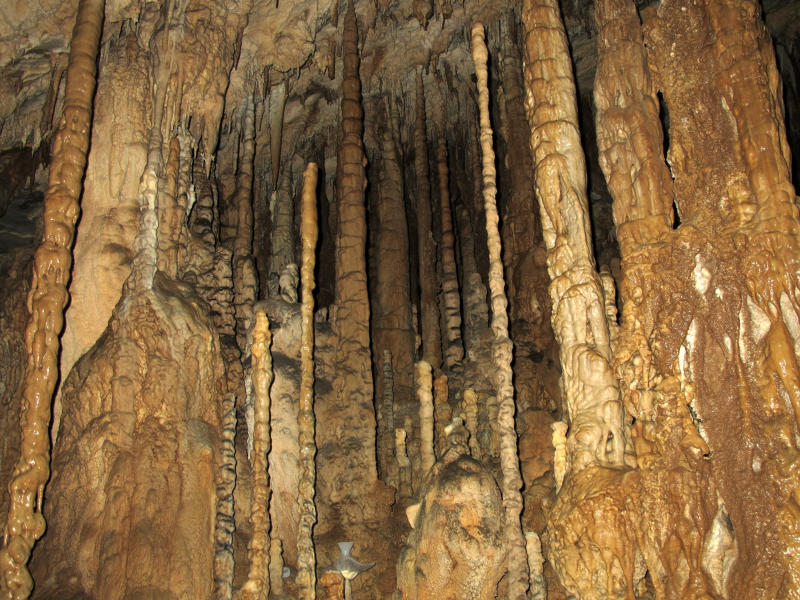
Secret Chamber inside of Clearwater Connection cave in Gunung Mulu National Park. (Credit: Syria Lejau)
A new set of long-term climate records based on cave stalagmites collected from tropical Borneo shows that the western tropical Pacific responded very differently than other regions of the globe to abrupt climate change events. The 100,000-year climate record adds to data on past climate events, and may help scientists assess models designed to predict how Earth’s climate will respond in the future
The new record resulted from oxygen isotope analysis of more than 1,700 calcium carbonate samples taken from four stalagmites found in three different northern Borneo caves. The results suggest that climate feedbacks within the tropical regions may amplify and prolong abrupt climate change events that were first discovered in the North Atlantic.
The results were scheduled to be published June 6 in Science Express, the electronic advance online publication of the journal Science, and will appear later in an issue of printed publication. The research was supported by the National Science Foundation.
Today, relatively subtle changes in the tropical Pacific’s ocean and atmosphere have profound effects on global climate. However, there are few records of past climate changes in this key region that have the length, resolution and age controls needed to reveal the area’s response to abrupt climate change events.
“This is a new record from a very important area of the world,” said Kim Cobb, an associate professor in the School of Earth and Atmospheric Sciences at the Georgia Institute of Technology. “This record will provide a new piece of the puzzle from the tropical Pacific showing us how that climate system has responded to forcing events over the past 100,000 years.”
Among the findings were some surprises that show just how complicated Earth’s climate system can be. While the stalagmite record reflected responses to abrupt changes known as Heinrich events, another major type of event — known as Dansgaard-Oeschger excursions — left no evidence in the Borneo stalagmites. Both types of abrupt climate change events are prominently featured in a previously-published stalagmite climate record from China — which is only slightly north of Borneo.
“To my knowledge, this is the first record that so clearly shows sensitivity to one set of major abrupt climate change events and not another,” said Cobb. “These two types of abrupt change events appear to have different degrees of tropical Pacific involvement, and because the tropical Pacific speaks with such a loud voice when it does speak, we think this is extremely important for understanding the mechanisms underlying these events.”
The researchers were also surprised to discover a very large and abrupt signal in their stalagmite climate records precisely when super-volcano Toba erupted nearby, roughly 74,000 years ago.
The team recovered the stalagmites from caves in Gunung Mulu and Gunung Buda National Parks, in northern Borneo, which is located a few degrees north of the Equator in the western Pacific. Back at their Georgia Tech lab, they analyzed the stalagmites for the ratio of oxygen isotopes contained in samples of calcium carbonate, the material from which the stalagmites were formed. That ratio is set by the oxygen isotopes in rainfall at the site, as the water that seeped into the ground dissolved limestone rock and dripped into the caves to form the stalagmites. The stalagmites accumulate at a rate of roughly one centimeter every thousand years.
“Stalagmites are time capsules of climate signals from thousands of years in the past,” said Stacy Carolin, a Georgia Tech Ph.D. candidate who gathered and analyzed the stalagmites. “We have instrumental records of climate only for the past 100 years or so, and if we want to look deeper into the past, we have to find records like these that locked in climate signals we can extract today.”
In the laboratory, Carolin sawed each stalagmite in half, opening it like a hot dog bun. She then used a tiny drill bit to take samples of the calcium carbonate down the center at one-millimeter steps. Because the stalagmites grew at varying rates, each sample represented as little as 60 years of time, or as much as 200 years. The precise ages of the samples were determined by measuring uranium and thorium isotope ratios, an analysis done with the help of Jess F. Adkins, a professor at the California Institute of Technology and a co-author of the study.
Rainfall oxygen isotopic ratios are good indicators of the amount of rainfall occurring throughout the region, as determined by a modern-day calibration study recently published by another graduate student in Cobb’s lab.
Merging data from the four different stalagmites provided a record of precipitation trends in the western Pacific over the past 100,000 years. That information can be compared to stalagmite and ice core climate records obtained elsewhere in the world.
“This record, which spans the entire last glacial period, adds significantly to the understanding of how various climate forcings are felt by the western tropical Pacific,” Carolin added.
Climate scientists are interested in learning more about abrupt climate changes because they indicate that the climate system may have “tipping points.” So far, the climate system has responded to rising carbon dioxide levels at a fairly steady rate, but many scientists worry about possible nonlinear effects.
“As a society, we haven’t really thought enough about the fact that we are moving Earth’s climate system toward a new state very quickly,” said Cobb. “It’s important to remember that the climate system has important nonlinearities that are most evident in these abrupt climate events. Ultimately, we’d like to be able to reproduce the global signatures of these abrupt climate events with numerical models of the climate system, and investigate the physics that drive such events.”
For Carolin, studying the half-meter-long stalagmites brought an awareness that Earth has not always been as we know it today.
“You have to be impressed with the scope of what you are studying, and recognize that the state our climate is in today is incredibly different from Earth’s climate during the last Ice Age,” she said. “As we consider how humans may be affecting climate, dissecting what was going on tens of thousands of years ago in all regions of the globe can help scientists better predict how the Earth will respond to modern climate forcings.”
In addition to those already mentioned, the research team included Brian Clark, manager of the Gunung Mulu National Park where the samples were gathered; Syria Lejau and Jenny Malang, Gunung Mulu cave guides who aided in sample collection; Jessica Conroy, a Georgia Tech postdoctoral fellow; and Andrew Tuen, a professor at the Universiti Malaysia Sarawak.
This research was funded by the National Science Foundation through PECASE Award ATM-0645291. The findings and conclusions are those of the authors and do not necessarily represent the official views of the NSF.
Note : The above story is reprinted from materials provided by Georgia Institute of Technology. The original article was written by John Toon.
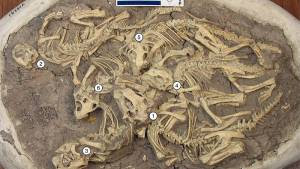
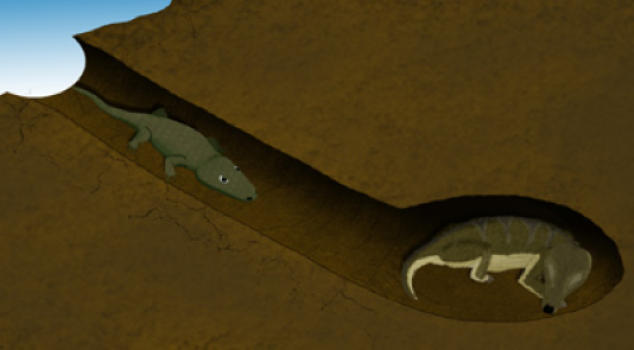
Artist impression of Broomistega seeking shelter in Thrinaxodon’s burrow. (Credit: Image courtesy of University of the Witwatersrand)
Scientists from South Africa, Australia and France have discovered a world first association while scanning a 250 million year old fossilised burrow from the Karoo Basin of South Africa.
The burrow revealed two unrelated vertebrate animals nestled together and fossilised after being trapped by a flash flood event. Facing harsh climatic conditions subsequent to the Permo-Triassic (P-T) mass extinction, the amphibian Broomistega and the mammal forerunner Thrinaxodon cohabited in a burrow.
Scanning shows that the amphibian, which was suffering from broken ribs, crawled into a sleeping mammal’s shelter for protection. This research suggests that short periods of dormancy, called aestivation, in addition to burrowing behaviour, may have been a crucial adaptation that allowed mammal ancestors to survive the P-T extinction.
The international team of scientists was led by Dr Vincent Fernandez from Wits University, South Africa and the European Synchrotron Radiation Facility (ESRF) in Grenoble, France. The other authors from Wits University include Prof. Bruce Rubidge (Director of the newly formed Palaeosciences Centre of Excellence at Wits), Dr Fernando Abdala and Dr Kristian Carlson. Other authors include Dr Della Collins Cook (Indiana University); Dr Adam Yates (Museum of Central Australia) and Dr. Paul Tafforeau (ESRF).
After many impressive results obtained on fossils, synchrotron imaging has led to revived interest in the studies of the numerous fossilised burrows discovered in the Karoo Basin of South Africa and dated to 250 million years ago. The first attempt to investigate one of these burrow-casts surprisingly revealed a world-first association of two unrelated animals.
The fossil was recovered from sedimentary rock strata in the Karoo Basin. It dates from 250 million years ago, at the beginning of the Triassic Period. At that time, the ecosystem was recovering from the Permo-Triassic mass extinction that wiped out most of life on Earth. In the Pangea Supercontinent context, what is now South Africa was an enclave in the southern half called Gondwana. It was the scene of pronounced climatic warming and increased seasonality marked by monsoonal rainfall. To survive this harsh environment, many animals, including mammal-like reptiles (mammal forerunners), developed a digging behaviour, attested by the numerous fossilised burrow casts discovered in the Karoo Basin. These casts have long been thought to enclose fossilised remains, triggering interest from palaeontologists. Early this year, an international group of scientists started to research the contents of these burrows using X-ray synchrotron computed microtomography.
Two burrow casts were selected from the collection at Wits to be scanned using the state-of-the-art facility at the European Synchrotron Radiation Facility (ESRF). Using the unique properties of the X-ray beam which enables non-destructive probing, the scan of the first burrow started to reveal the skull of a mammal-like reptile called Thrinaxodon, an animal previously reported in another burrow.
As the scan progressed, the three-dimensional reconstruction displayed results beyond expectations: the mammal-like reptile was accompanied by an amphibian Broomistega, belonging to the extinct group of Temnospondyl.
“While discovering the results we were amazed by the quality of the images,” says lead author Fernandez, “but the real excitement came when we discovered a second set of teeth completely different from that of the mammal-like reptile. It was really something else.”
Besides the pristine preservation of the two skeletons, the team focused on the reasons explaining such an unusual co-habitation. Fernandez explains: “Burrow-sharing by different species exists in the modern world, but it corresponds to a specific pattern. For example, a small visitor is not going to disturb the host. A large visitor can be accepted by the host if it provides some help, like predator vigilance. But neither of these patterns corresponds to what we have discovered in this fossilised burrow.”
The scientists gathered all the information to try to reconstitute the events that led to this incredible fossil aggregation, testing scenarios one after another. “It’s a fascinating scientific question: what caused the association of these two organisms in the burrow? One of the more obvious possibilities is a predator-prey interaction, but we inspected both skeletons looking for tooth marks or other evidence implying predation, ultimately finding no support for one having attempted to feed on the other,” says Carlson.
His colleague, Cook, adds that the consecutive broken ribs resulted from a single, massive trauma. The amphibian clearly survived the injury for some time because the fractures were healing, but it was surely quite handicapped. According to Fernandez this Broomistega is the first complete skeleton of this rare species that has been discovered. “It tells us that this individual was a juvenile and mostly aquatic at that time of its life,” he says.
The scientists eventually concluded that the amphibian crawled into the burrow in response to its poor physical condition but was not evicted by the mammal-like reptile.
Numerous Thrinaxodon specimens have been found in South Africa, many of them fossilised in a curled-up position. Abdala says: “I have always been fascinated by the preservation of Thrinaxodon fossils in a curled-up position that show even tiny bones of the skeleton preserved. It’s as if they were peacefully resting in shelters at the time of death.”
The shelters prevented disturbance of the skeletal remains from scavengers and weathering. “We also think it might reflect a state of torpor called aestivation in response to aridity and absence of food resources,” Abdala says.
Piecing all the clues together, the team finally elucidated the enigmatic association, concluding that “the mammal-like reptile, Thrinaxodon, was most probably aestivating in its burrow, a key adaptation response together with a burrowing behaviour which enabled our distant ancestors to survive the most dramatic mass extinction event. This state of torpor explains why the amphibian was not chased out of the burrow,” says Rubidge.
Both animals were finally entrapped in the burrow by a sudden flood and preserved together in the sediments for 250 million years.
Tafforeau says: “Thanks to the unique possibilities for high quality imaging of fossils developed during the last decade at the ESRF, these unique specimens remain untouched, protected by their mineral matrix. Who knows what kind of information we’ll be able to obtain from them in the future and which would have been completely lost if the specimen had been prepared out of its burrow cast?”
Note : The above story is reprinted from materials provided by University of the Witwatersrand.
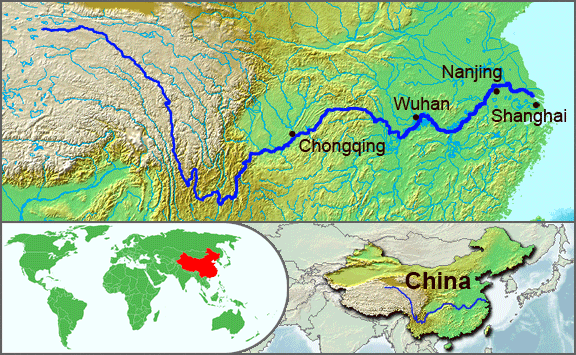
The Yangtze River, or Chang Jiang is the longest river in Asia, and the third longest in the world. It flows for 6,418 kilometres (3,988 mi) from the glaciers on the Qinghai-Tibet Plateau in Qinghai eastward across southwest, central and eastern China before emptying into the East China Sea at Shanghai. It is also one of the biggest rivers by discharge volume in the world. The Yangtze drains one-fifth of the land area of the People’s Republic of China (PRC) and its river basin is home to one-third of the PRC’s population.
Along with the Yellow River, the Yangtze is the most important river in the history, culture and economy of China. The prosperous Yangtze River Delta generates as much as 20% of the PRC’s GDP. The Yangtze River flows through a wide array of ecosystems and is itself habitat to several endemic and endangered species including the Chinese alligator and the Yangtze sturgeon. For thousands of years, people have used the river for water, irrigation, sanitation, transportation, industry, boundary-marking and war. The Three Gorges Dam on the Yangtze River is the largest hydro-electric power station in the world.
In recent years, the river has suffered from industrial pollution, agricultural run-off, siltation, and loss of wetland and lakes, which exacerbates seasonal flooding. Some sections of the river are now protected as nature reserves. A stretch of the Yangtze flowing through deep gorges in western Yunnan is part of the Three Parallel Rivers of Yunnan Protected Areas, a UNESCO World Heritage Site.
Geography
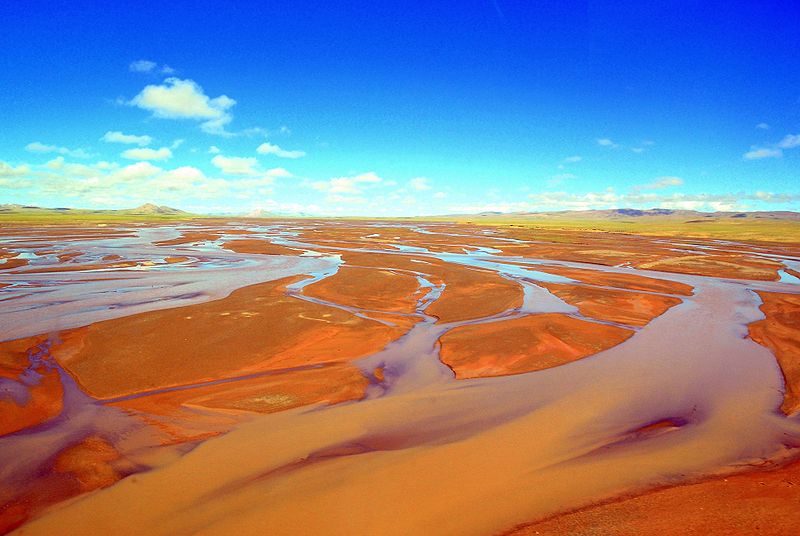
The river originates from several tributaries, two of which have claims to be the source. The Chinese
Yangtze watershed
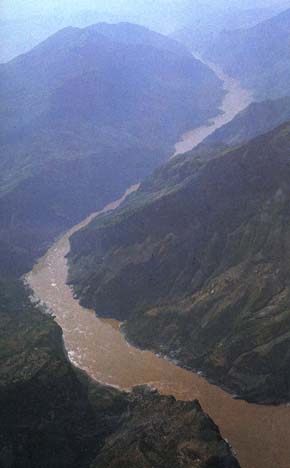
government has recognized the source of the Tuotuo tributary at the base of a glacier lying on the west of Geladandong Mountain in the Dangla Mountain Range on the eastern part of the Qinghai-Tibet Plateau. However, the geographical source (i.e., longest river distance from the sea) lies in wetlands at 32°36′14″N 94°30′44″E and 5,170 m (16,960 ft) above sea level at the head of the Dan Qu tributary. These tributaries join and the river then runs eastward through Qinghai, turning southward down a deep valley at the border of Sichuan and Tibet to reach Yunnan. In the course of this valley, the river’s elevation drops from above 5,000 m (16,000 ft) to less than 1,000 m (3,300 ft). The headwaters of the Yangtze are situated at an elevation of about 4,900 m (16,100 ft). In its descent to sea level, the river falls to an altitude of 305 m (1,001 ft) at Yibin, Sichuan, the head of navigation for riverboats, and to 192 m (630 ft) at Chongqing. Between Chongqing and Yichang (I-ch’ang), at an altitude of 40 m (130 ft) and a distance of about 320 km (200 mi), it passes through the spectacular Yangtze Gorges, which are noted for their natural beauty but are dangerous to shipping.
It enters the basin of Sichuan at Yibin. While in the Sichuan basin, it receives several mighty tributaries, increasing its water volume significantly. It then cuts through Mount Wushan bordering Chongqing and Hubei to create the famous Three Gorges. Eastward of the Three Gorges, Yichang is the first city on the Yangtze Plain.
After entering Hubei, the Yangtze receives more water from thousands of lakes. The largest of these lakes is Dongting Lake, which is located on the border of Hunan and Hubei provinces, and is the outlet for most of the rivers in Hunan. At Wuhan, it receives its biggest tributary, the Han River, bringing water from its northern basin as far as Shaanxi.
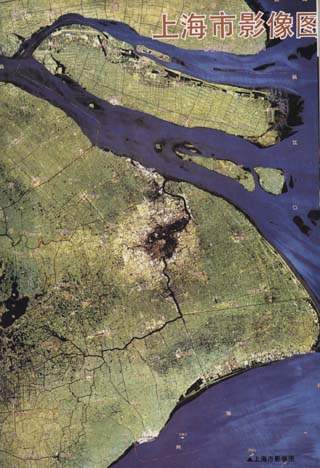
At the northern tip of Jiangxi, Lake Poyang, the biggest freshwater lake in China, merges into the river. The river then runs through Anhui and Jiangsu provinces, receiving more water from innumerable smaller lakes and rivers, and finally reaches the East China Sea at Shanghai.
Four of China’s five main freshwater lakes contribute their waters to the Yangtze River. Traditionally, the upstream part of the Yangtze River refers to the section from Yibin to Yichang; the middle part refers to the section from Yichang to Hukou County, where Lake Poyang meets the river; the downstream part is from Hukou to Shanghai. It is home to many thousands of people.
The origin of the Yangtze River is dated to about 45 million years ago in the Eocene, but many people do not accept this point.
Photo :
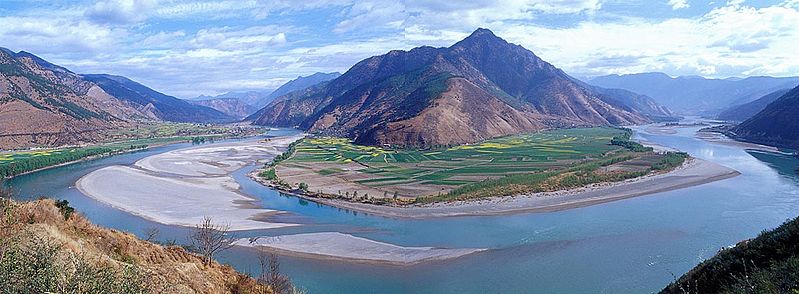
The first turn of the Yangtze (Changjiang) at Shigu (石鼓), Yunnan Province, where the river turns 180 degree from south- to north-boundThe Yangtze river as seen from the Beijing-Lhasa train, on the so-called “First Bridge”
.
The Yangtze is open to navigation all the year around. The picture to the left features one of the so-called “Three Gorges,” dangerous to navigate because of its currents and shallows, but of incredible beauty. China Pictorial, ed., Across China (Beijing: China Pictorial Publishing Company, 1985),The picture to the right shows the Yangtze River flowing into the sea near the biggest city in China, Shanghai. Lu Yinghui, Xinbian Shanghai daguan (Shanghai: Shanghai shehui kexueyuan chuban she, 1993)
Note : The above story is reprinted from materials provided by Wikipedia
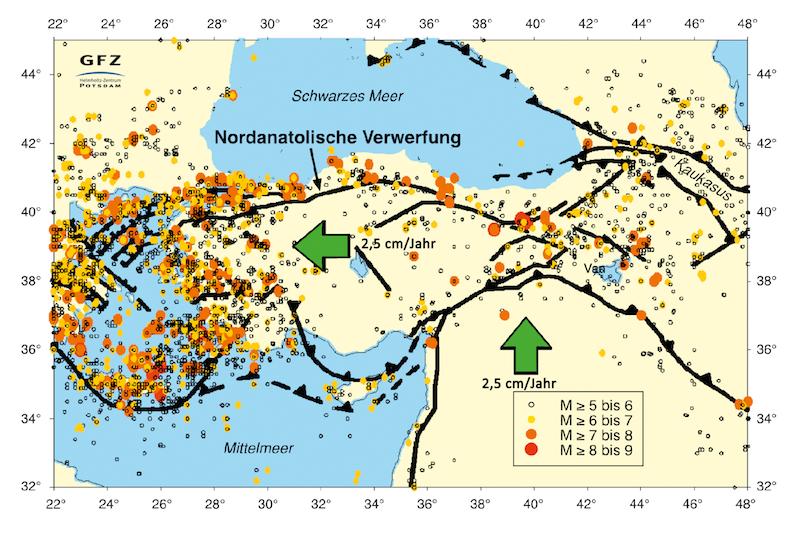
Earthquake researchers have now identified a 30 kilometers long and ten kilometers deep area along the North Anatolian fault zone just south of Istanbul that could be the starting point for a strong earthquake. The group of seismologists including Professor Marco Bohnhoff of the GFZ German Research Centre for Geosciences reported in the current online issue of the scientific journal Nature Communications that this potential earthquake source is only 15 to 20 kilometers from the historic city center of Istanbul.
The Istanbul-Marmara region of northwestern Turkey with a population of more than 15 million faces a high probability of being exposed to an earthquake of magnitude 7 or more. To better understand the processes taking place before a strong earthquake at a critically pressurized fault zone, a seismic monitoring network was built on the Princes Islands in the Sea of Marmara off Istanbul under the auspices of the Potsdam Helmholtz Centre GFZ together with the Kandilli Earthquake Observatory in Istanbul. The Princes Islands offer the only opportunity to monitor the seismic zone running below the seafloor from a distance of few kilometers.
The now available data allow the scientists around GFZ researcher Marco Bohnhoff to come to the conclusion that the area is locked in depth in front of the historic city of Istanbul: “The block we identified reaches ten kilometers deep along the fault zone and has displayed no seismic activity since measurements began over four years ago. This could be an indication that the expected Marmara earthquake could originate there,” says Bohnhoff.
This is also supported by the fact that the fracture zone of the last strong earthquake in the region, in 1999, ended precisely in this area — probably at the same structure, which has been impeding the progressive shift of the Anatolian plate in the south against the Eurasian plate in the north since 1766 and building up pressure. The results are also being compared with findings from other fault zones, such as the San Andreas Fault in California, to better understand the physical processes before an earthquake.
Currently, the GFZ is intensifying its activity to monitor the earthquake zone in front of Istanbul. Together with the Disaster and Emergency Management Presidency of Turkey AFAD, several 300 meter deep holes are currently being drilled around the eastern Marmara Sea, into which highly sensitive borehole seismometers will be placed. With this Geophysical borehole Observatory at the North Anatolian Fault GONAF, measurement accuracy and detection threshold for microearthquakes are improved many times over. In addition, the new data also provide insights on the expected ground motion in the event of an earthquake in the region. Bohnhoff: “Earthquake prediction is scientifically impossible. But studies such as this provide a way to better characterize earthquakes in advance in terms of location, magnitude and rupture progression, and therefore allow a better assessment of damage risk.”
Note : The above story is reprinted from materials provided by Helmholtz Centre Potsdam – GFZ German Research Centre for Geosciences.
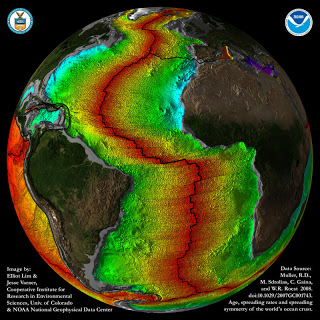
NOAA/NGDC image of the Atlantic crustal age of the ocean floor. Geologists have detected the first evidence that a passive margin in the Atlantic ocean is becoming active. The team mapped the ocean floor and found it was beginning to fracture, indicating tectonic activity around the apparently passive South West Iberia plate margin. (Credit: Mr. Elliot Lim and Mr. Jesse Varner, CIRES & NOAA/NGDC)
A new subduction zone forming off the coast of Portugal heralds the beginning of a cycle that will see the Atlantic Ocean close as continental Europe moves closer to America.
Published in Geology, new research led by Monash University geologists has detected the first evidence that a passive margin in the Atlantic ocean is becoming active. Subduction zones, such as the one beginning near Iberia, are areas where one of the tectonic plates that cover Earth’s surface dives beneath another plate into the mantle — the layer just below the crust.
Lead author Dr João Duarte, from the School of Geosciences said the team mapped the ocean floor and found it was beginning to fracture, indicating tectonic activity around the apparently passive South West Iberia plate margin.
“What we have detected is the very beginnings of an active margin — it’s like an embryonic subduction zone,” Dr Duarte said.
“Significant earthquake activity, including the 1755 quake which devastated Lisbon, indicated that there might be convergent tectonic movement in the area. For the first time, we have been able to provide not only evidences that this is indeed the case, but also a consistent driving mechanism.”
The incipient subduction in the Iberian zone could signal the start of a new phase of the Wilson Cycle — where plate movements break up supercontinents, like Pangaea, and open oceans, stabilise and then form new subduction zones which close the oceans and bring the scattered continents back together.
This break-up and reformation of supercontinents has happened at least three times, over more than four billion years, on Earth. The Iberian subduction will gradually pull Iberia towards the United States over approximately 220 million years.
The findings provide a unique opportunity to observe a passive margin becoming active — a process that will take around 20 million years. Even at this early phase the site will yield data that is crucial to refining the geodynamic models.
“Understanding these processes will certainly provide new insights on how subduction zones may have initiated in the past and how oceans start to close,” Dr Duarte said.
Note : The above story is reprinted from materials provided by Monash University.
A “cold snap” 116 million years ago triggered a similar marine ecosystem crisis to the ones witnessed in the past as a result of global warming, according to new research. (Credit: Copyright Michele Hogan)
A “cold snap” 116 million years ago triggered a similar marine ecosystem crisis to the ones witnessed in the past as a result of global warming, according to research published in Nature Geoscience.
The international study involving experts from the universities of Newcastle, UK, Cologne, Frankfurt and GEOMAR-Kiel, confirms the link between global cooling and a crash in the marine ecosystem during the mid-Cretaceous greenhouse period.
It also quantifies for the first time the amplitude and duration of the temperature change. Analysing the geochemistry and micropaleontology of a marine sediment core taken from the North Atlantic Ocean, the team show that a global temperature drop of up to 5oC resulted in a major shift in the global carbon cycle over a period of 2.5 million years.
Occurring during a time of high tectonic activity that drove the breaking up of the super-continent Pangaea, the research explains how the opening and widening of new ocean basins around Africa, South America and Europe created additional space where large amounts of atmospheric CO2 was fixed by photosynthetic organisms like marine algae. The dead organisms were then buried in the sediments on the sea bed, producing organic, carbon rich shale in these new basins, locking away the carbon that was previously in the atmosphere.
The result of this massive carbon fixing mechanism was a drop in the levels of atmospheric CO2, reducing the greenhouse effect and lowering global temperature.
This period of global cooling came to an end after about 2 million years following the onset of a period of intense local volcanic activity in the Indian Ocean. Producing huge volumes of volcanic gas, carbon that had been removed from the atmosphere when it was locked away in the shale was replaced with CO2 from Earth’s interior, re-instating a greenhouse effect which led to warmer climate and an end to the “cold snap.”
The research team highlight in this study how global climate is intrinsically linked to processes taking place in Earth’s interior at million year time scales. These processes can modify ecospace for marine life, driving evolution.
Current research efforts tend to concentrate on global warming and the impact that a rise of a few degrees might have on past and present day ecosystems. This study shows that if global temperatures swing the other way by a similar amount, the result can be just as severe, at least for marine life.
However, the research team emphasise that the observed changes of the Earth system in the Cretaceous happened over millions of years, rather than decades or centennial, which cannot easily be related to our rapidly changing modern climate conditions.
“As always it’s a question of fine balance and scale,” explains Thomas Wagner, Professor of Earth Systems Science at Newcastle University, and one of the leaders of this study.
“All earth system processes are operating all the time and at different temporal and spatial scales; but when something upsets the balance — be it a large scale but long term natural phenomenon or a short and massive change to global greenhouse gases due to anthropogenic activity — there are multiple, potential knock-on effects on the whole system.
“The trick is to identify and quantify the initial drivers and consequences, which remains an ongoing challenge in climate research.”
Note : The above story is reprinted from materials provided by Newcastle University.
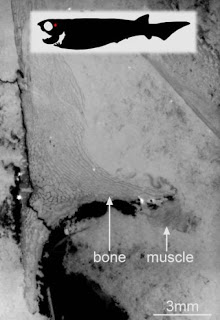
This is an alternative version with a pircture depicting the location in the fossil fish — virtual thin section made in a nodule showing preserved bundles of muscles attached to the skull plate of a placoderm (fossil armored fish). (Credit: ESRF/Sophie Sanchez)
Swedish, Australian and French researchers present for the first time miraculously preserved musculature of 380 million year old armoured fish discovered in north-west Australia. This research will help scientists to better understand how neck and abdominal muscles evolved during the transition from jawless to jawed vertebrates.
The scientific paper describing the discovery is published today in the journal Science.
The team of scientists who studied the fossilised fish was jointly directed by Prof. Kate Trinajstic, Curtin University, Perth, Australia and Prof. Per Erik Ahlberg of Uppsala University Sweden. The team also included scientists from the European Synchrotron Radiation Facility (ESRF), Grenoble, France; the Western Australian Museum, Perth; Flinders University, Adelaide; the Research School of Earth Sciences at the Australian National University, Canberra; the Research School of Physics and Engineering at the Australian National University; and the Australian Regenerative Medicine Institute, Monash University, Australia.
The word “fossil” naturally conjures up a vision of rattling skeletons. Bones and teeth fossilise far more easily than soft tissues and are usually the only traces of the animal that remain. This makes the rare fossils of soft tissues all the more valuable as windows to the biology of extinct organisms. Such tissues almost never fossilise and scientists usually have to extrapolate skin coverings and musculature from knowledge of modern organisms and from the fossilised skeletons.
The Gogo Formation, a sedimentary rock formation in north-western Australia, has long been famous for yielding exquisitely preserved fossil fish. Among other things it contains placoderms, an extinct group that includes some of the earliest jawed fish.
A few years ago, an Australian research team work led by Prof. Trinajstic made the remarkable discovery that these fossils also contained soft tissues including nerve and muscle cells. Now they have collaborated with the research group of Professor Per Ahlberg, Uppsala University, and with the European Synchrotron (ESRF) in Grenoble, France, to document and reconstruct the musculature of the placoderms. “High contrast X-ray images were produced thanks to a powerful beam and a protocol developed for fossil imaging at the ESRF. This is unique in the world and has enabled us to “reconstruct” some fossilised muscles and document the muscles of neck and abdomen in these early jawed fish, without damaging or affecting the fossilised remains,” says Sophie Sanchez, one of the authors, from the ESRF and Uppsala University.
These early vertebrates prove to have a well-developed neck musculature as well as powerful abdominal muscles — not unlike some human equivalents displayed on the beaches of the world every summer. Living fish, by contrast, usually have a rather simple body musculature without such specialisations.
“This shows that vertebrates developed a sophisticated musculature much earlier than we had thought” says Per Ahlberg, co-author of the project. “It also cautions against thinking that we can interpret fossil organisms simply by metaphorically draping their skeletons in the soft tissues of living relatives.”
Note : The above story is reprinted from materials provided by European Synchrotron Radiation Facility, via EurekAlert!, a service of AAAS.
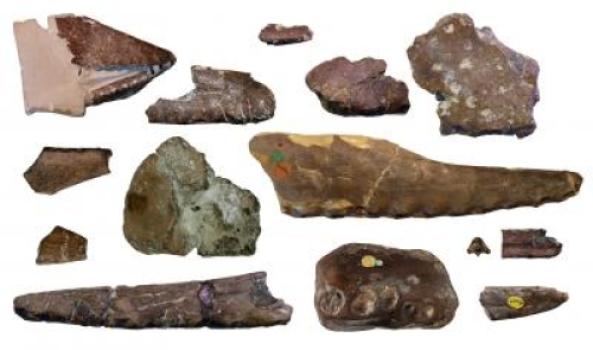
The holotypes of the species recognized as valid by the researchers, put to the same scale, illustrate how diverse this pterosaur fauna was. (Credit: Dr. Taissa Rodrigues & NHMUK PV 39412, NHMUK PV R 1822, NHMUK PV 39409 and NHMUK PV 43074 – Natural History Museum)
Brazilian paleontologists Taissa Rodrigues, of the Federal University of Espirito Santo, and Alexander W. A. Kellner, of the National Museum of the Federal University of Rio de Janeiro, have just presented the most extensive review yet available of toothed pterosaurs from the Cretaceous of England. The study features detailed taxonomic information, diagnoses and photographs of 30 species and was published in the open access journal ZooKeys.
Pterosaurs from the Cretaceous of England were first described by British naturalists Richard Owen and Harry Seeley in the 19th century, when little was known about the diversity of the group, resulting in the description of dozens of species, all based on very fragmentary remains, represented mostly by the tips of the snouts of these animals. However, more recent findings of pterosaur fossils have challenged views on their diversity.
Results show that these pterosaurs had a remarkable diversity in their appearances. Some species had head crests of different sizes and shapes, while others had none. Most had large teeth at the tip of their snouts and were fish eaters, but others had smaller teeth, suggesting different feeding preferences. The paleontologists were able to identify fourteen different species, belonging to at least five different genera, showing a greater diversity than previously thought.
Most of these fossils were found in a deposit known as the Cambridge Greensand, located in the eastern part of the country. This unit, one of the most important for the study of flying reptiles, records a past marine environment where the bones that were already fossilized and buried, were eroded, exposed to weathering, and then buried again. Cycles of erosion and burial must have taken place during several years. Due to this peculiarity, the pterosaur assemblage from this deposit probably presents temporal mixing of faunas, thus explaining the high diversity found.
Another find was that these English flying reptiles turned out to be closely related to species unearthed in northeastern Brazil and eastern China. According to Dr. Rodrigues, ‘This is very interesting, especially because the continents had already drifted apart. If these animals were migratory, we would expect to find the same species in all these deposits.’ Instead, the scientists have discovered that England, Brazil and China all had their own species and genera.
Analysis of fossils from other continents showed that this group of pterosaurs was already widespread in the whole planet 110 million years ago, and must have been important faunistic elements at this time of the Cretaceous period, being early bird competitors, before they went extinct a few million years later.
Note : The above story is reprinted from materials provided by Pensoft Publishers. The original story is licensed under a Creative Commons License.
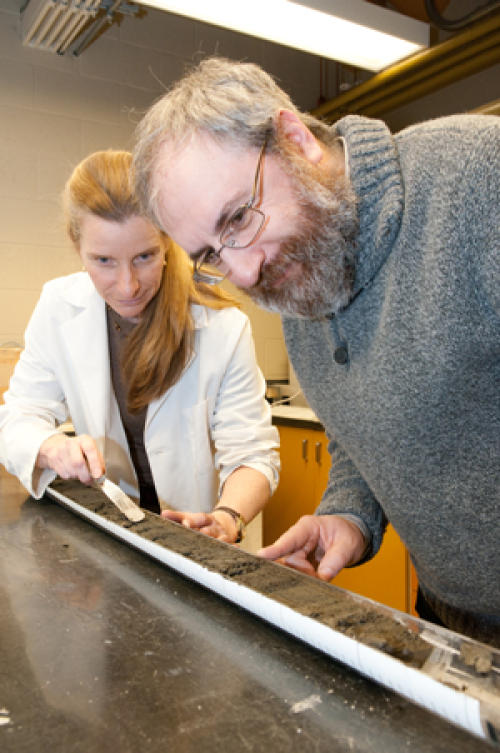
Checking core samples in the lab. (Credit: Dan Anthon, Royal Roads University)
Understanding the size and frequency of large earthquakes along the Pacific coast of North America is of great importance, not just to scientists, but also to government planners and the general public. The only way to predict the frequency and intensity of the ground motion expected from large and giant “megathrust ” earthquakes along Canada’s west coast is to analyze the geologic record.
A new study published today in the Canadian Journal of Earth Sciences presents an exceptionally well-dated first record of earthquake history along the south coast of BC. Using a new high-resolution age model, a team of scientists meticulously identified and dated the disturbed sedimentary layers in a 40-metre marine sediment core raised from Effingham Inlet. The disturbances appear to have been caused by large and megathrust earthquakes that have occurred over the past 11,000 years.
One of the co-authors of the study, Dr. Audrey Dallimore, Associate Professor at Royal Roads University explains: “Some BC coastal fjords preserve annually layered organic sediments going back all the way to deglacial times. In Effingham Inlet, on the west coast of Vancouver Island, these sediments reveal disturbances we interpret were caused by earthquakes. With our very detailed age model that includes 68 radiocarbon dates and the Mazama Ash deposit (a volcanic eruption that took place 6800 yrs ago); we have identified 22 earthquake shaking events over the last 11,000 years, giving an estimate of a recurrence interval for large and megathrust earthquakes of about 500 years. However, it appears that the time between major shaking events can stretch up to about a 1,000 years.
“The last megathrust earthquake originating from the Cascadia subduction zone occurred in 1700 AD. Therefore, we are now in the risk zone of another earthquake. Even though it could be tomorrow or perhaps even centuries before it occurs, paleoseismic studies such as this one can help us understand the nature and frequency of rupture along the Cascadia Subduction Zone, and help Canadian coastal communities to improve their hazard assessments and emergency preparedness plans.”
“This exceptionally well-dated paleoseismic study by Enkin et al., involved a multi-disciplinary team of Canadian university and federal government scientists, and a core from the 2002 international drill program Marges Ouest Nord Américaines (MONA) campaign,” says Dr. Olav Lian, an associate editor of the Canadian Journal of Earth Sciences, professor at the University of the Fraser Valley and Director of the university’s Luminescence Dating Laboratory. “It gives us our first glimpse back in geologic time, of the recurrence interval of large and megathrust earthquakes impacting the vulnerable BC outer coastline. It also supports paleoseismic data found in offshore marine sediment cores along the US portion of the Cascadia Subduction Zone, recently released in an important United States Geological Survey (USGS) paleoseismic study by a team of researchers led by Dr. Chris Goldfinger of Oregon State University.
In addition to analyzing the Effingham Inlet record for earthquake events, this study site has also revealed much information about climate and ocean changes throughout the Holocene to the present. These findings also clearly illustrate the importance of analyzing the geologic record to help today’s planners and policy makers, and ultimately to increase the resiliency of Canadian communities. ”
Note : The above story is reprinted from materials provided by Canadian Science Publishing (NRC Research Press).
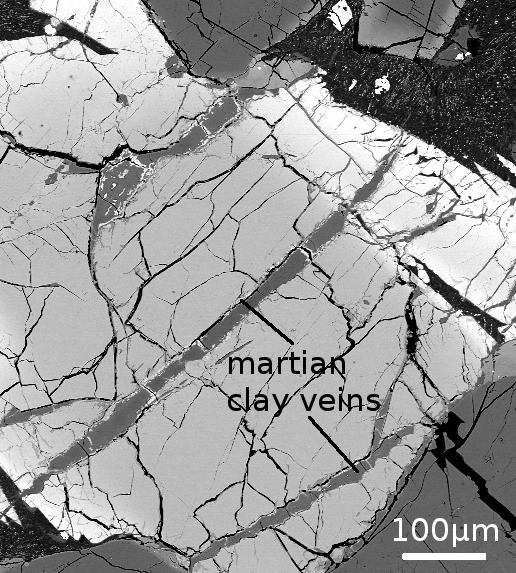
Electron microscope image showing the 700-million-year-old Martian clay veins containing boron (100 µm = one tenth of a millimeter). (Credit: Image courtesy of Institute for Astronomy at the University of Hawaii at Manoa)
Researchers from the University of Hawaii at Manoa NASA Astrobiology Institute (UHNAI) have discovered high concentrations of boron in a Martian meteorite. When present in its oxidized form (borate), boron may have played a key role in the formation of RNA, one of the building blocks for life.
The work was published on June 6 in PLOS ONE.
The Antarctic Search for Meteorites team found the Martian meteorite used in this study in Antarctica during its 2009-2010 field season. The minerals it contains, as well as its chemical composition, clearly show that it is of Martian origin.
Using the ion microprobe in the W. M. Keck Cosmochemistry Laboratory at UH, the team was able to analyze veins of Martian clay in the meteorite. After ruling out contamination from Earth, they determined boron abundances in these clays are over ten times higher than in any previously measured meteorite.
“Borates may have been important for the origin of life on Earth because they can stabilize ribose, a crucial component of RNA. In early life RNA is thought to have been the informational precursor to DNA,” said James Stephenson, a UHNAI postdoctoral fellow.
RNA may have been the first molecule to store information and pass it on to the next generation, a mechanism crucial for evolution. Although life has now evolved a sophisticated mechanism to synthesize RNA, the first RNA molecules must have been made without such help. One of the most difficult steps in making RNA nonbiologically is the formation of the RNA sugar component, ribose. Previous laboratory tests have shown that without borate the chemicals available on the early Earth fail to build ribose. However, in the presence of borate, ribose is spontaneously produced and stabilized.
This work was born from the uniquely interdisciplinary environment of UHNAI. The lead authors on the paper, Stephenson, an evolutionary biologist, and Lydia Hallis, a cosmochemist who is also a UHNAI
On our planet, borate-enriched salt, sediment and clay deposits are relatively common, but such deposits
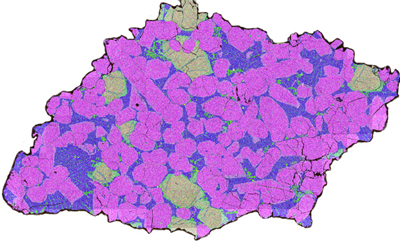
Thin section of the Martian meteorite MIL 090030 analyzed by the UHNAI researchers.
The significance goes beyond an interest in the red planet, as Hallis explains: “Earth and Mars used to have
The presence of ancient borate-enriched clays on Mars implies that these clays may also have been present on the early Earth. Borate-enriched clays such as the ones studied here may have represented chemical havens in which one of life’s key molecular building blocks could form.
UHNAI is a research center that links the biological, chemical, geological, and astronomical sciences to better understand the origin, history, distribution, and role of water as it relates to life in the universe.
had never previously been found on an extraterrestrial body. This new research suggests that when life was getting started on Earth, borate could also have been concentrated in deposits on Mars.
much more in common than they do today. Over time, Mars has lost a lot of its atmosphere and surface water, but ancient meteorites preserve delicate clays from wetter periods in Mars’ history. The Martian clay we studied is thought to be up to 700 million years old. The recycling of the Earth’s crust via plate tectonics has left no evidence of clays this old on our planet; hence Martian clays could provide essential information regarding environmental conditions on the early Earth.”
postdoctoral fellow, first came up with the idea over an after-work beer. “Given that boron has been implicated in the emergence of life, I had assumed that it was well characterized in meteorites,” said Stephenson. “Discussing this with Dr. Hallis, I found out that it was barely studied. I was shocked and excited. She then informed me that both the samples and the specialized machinery needed to analyze them were available at UH.”
Note : The above story is reprinted from materials provided by Institute for Astronomy at the University of Hawaii at Manoa.