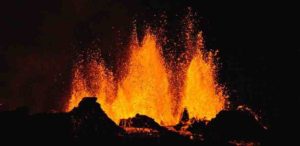
Cardiff University scientists have revealed the true extent of the internal ‘plumbing system’ that drives volcanic activity around the world.
An examination of pockets of magma contained within crystals has revealed that the large chambers of molten rock which feed volcanoes can extend to over 16 km beneath the Earth’s surface.
The new study, published today in Nature, has challenged our understanding of the structure of ocean volcanoes, with previous estimates suggesting that magma chambers were located up to 6 km below the surface.
Interconnected magma chambers and reservoirs are the key driver of the dynamics of volcanic systems around the world, so understanding their nature is an important step towards understanding how volcanoes are supplied with magma, and, ultimately, how they erupt.
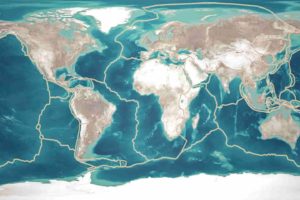
Mid-ocean ridges in particular make up the most significant volcanic system on our planet, forming a roughly 80,000 km-long network of undersea mountains along which 75 percent of Earth’s volcanism occurs.
However, because these volcanoes are located under thousands of metres of water, and sometimes permanent sea ice, we are only just starting to understand what the subsurface architecture of these volcanoes look like.
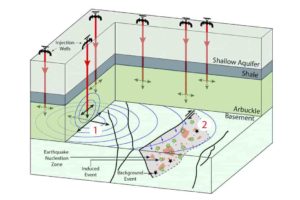
It is known that magma plumbing systems exist below the Earth’s surface, which can be thought of as a series of interconnected magma conduits and reservoirs, much like the pipes and tanks that make up plumbing systems in a house, instead at mid-ocean ridges the tap is a volcano.
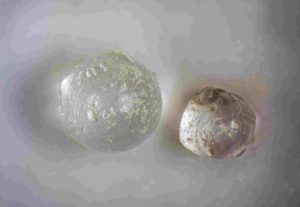
In their study, the team analysed common minerals such as olivine and plagioclase which grew deep within the volcanoes and were subsequently erupted from the Gakkel Ridge located beneath the Arctic Ocean between Greenland and Siberia.
These minerals act as tape recorders from which changes in the physical and chemical conditions of the environment within which they grew can be measured. Critically, the team were able to record what processes occurred and at what depths these minerals began to crystallise in magma reservoirs.
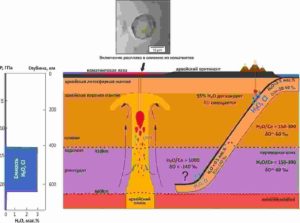
Lead author of the study, Ph.D. student Emma Bennett, from the School of Earth and Ocean Sciences, said: “To calculate the depths of magma reservoirs we used melt inclusions, which are small pockets of magma that become trapped within growing crystals at different depths in the magmatic system. These pockets of melt contain dissolved CO2 and H2O.
“Because the melt cannot dissolve as much CO2 at shallow pressure as it can at high pressure, we can determine what pressure the melt inclusion was trapped, and in turn work out the depth at which crystallisation occurred, by measuring the amount of CO2 in the melt inclusions.
“Put simply, crystal growth in a magmatic environment can be likened to the growth rings on a tree; for example, a change in the chemical environment will result in the growth of a new layer with a different crystal composition.
“By analysing multiple melt inclusions we can start to reconstruct the architecture of the magmatic system.”
The study was the first to use the mineral plagioclase as a proxy for the depth of magma reservoirs, with previous studies using the mineral olivine.
The results showed that magma plumbing systems at mid-ocean ridges extend to much greater depths than previously thought. Oceanic crust is normally only around 6 km thick, and conventionally magma chambers were thought of as being located here.
Yet the new data has shown that the plumbing system extends to at least 16 km depth, which means that the magma chambers that fed the Gakkel Ridge volcanoes are located much deeper down in the mantle.
Reference:
Emma N. Bennett et al. Deep roots for mid-ocean-ridge volcanoes revealed by plagioclase-hosted melt inclusions, Nature (2019). DOI: 10.1038/s41586-019-1448-0
Note: The above post is reprinted from materials provided by Cardiff University.