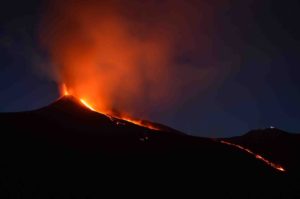
Much like a forensic team recreates a scene to determine how a crime was committed, researchers at the University of New Hampshire are using scientific sleuthing to better understand the journey of magma, or molten rock, in one of Europe’s largest and most active volcanoes, Mount Etna. Researchers applied several techniques, in a new way, to create a more accurate picture of the volcano’s plumbing system and how quickly the magma rises to the top to cause an eruption. Their findings contribute to our understanding of how and when volcanoes erupt.
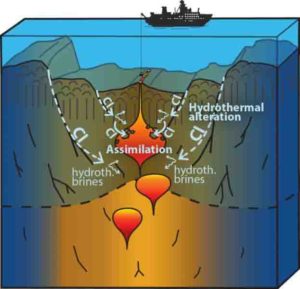
In their study, recently published in the journal Geochemical Perspective Letters, the UNH team set out to determine if the magma lingers below in pockets of the volcano or if it pushes up all at once. To put the pieces of the puzzle together, they combined three approaches previously not used together to reconstruct the ancient magma plumbing system by looking for chemical signatures in lava rock collected from flows on the surface. They looked at the minerals and the trace elements in the rocks because the tracers can help identify where the minerals have been by how they crystallized.
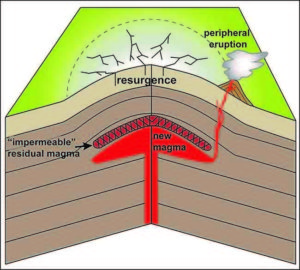
“As magma moves up through Earth’s crust beneath the volcano, it starts to crystallize,” says Sarah Miller, of UNH’s department of Earth sciences and lead author of the study. “Some elements move rapidly and some more slowly, so there is a chemical record of events in those crystals that can help us determine their journey.”
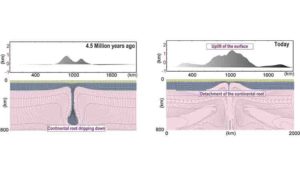
Extracting the timing and magma source information for ancient volcanism demonstrates how long-lived pre-eruptive processes of transport and storage work at Mount Etna. The researchers found a range of crystallization depths, suggesting there were discrete sites beneath the volcano where the rising magma crystallized. Their chemical forensic work showed two interesting things about the volcano. First, the source that produced magma in the ancient Mount Etna is much the same as what happens in Mount Etna in the present-day. Secondly, they showed that the crystals were virtually chemically identical to the lavas in which they erupted. This second finding suggests that in Mount Etna the length of time for crystal storage beneath the volcano is likely relatively short, a result which could help provide insight with recent findings for larger more explosive eruptive systems like Yellowstone.
“This proof-of-concept work puts us in a position to apply our approach more widely to other volcanoes,” said Julie Bryce, professor and chair of Earth sciences and a co-author of this paper. “Our work advances ways we can examine and think about volcanic plumbing systems beneath frequently active volcanic centers. Reconstructing the dynamics of these plumbing systems, and knowing how long-lived they are, helps in anticipating future changes in eruptive potential.”
The University of New Hampshire is a flagship research university that inspires innovation and transforms lives in our state, nation and world. More than 16,000 students from all 50 states and 71 countries engage with an award-winning faculty in top ranked programs in business, engineering, law, liberal arts and the sciences across more than 200 programs of study. UNH’s research portfolio includes partnerships with NASA, NOAA, NSF and NIH, receiving more than $100 million in competitive external funding every year to further explore and define the frontiers of land, sea and space.
Reference:
S.A. Miller et al. Magma dynamics of ancient Mt. Etna inferred from clinopyroxene isotopic and trace element systematics, Geochemical Perspectives Letters (2017). DOI: 10.7185/geochemlet.1735
Note: The above post is reprinted from materials provided by University of New Hampshire.