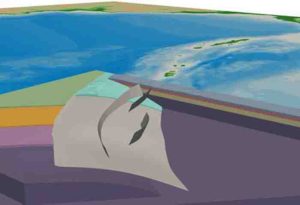
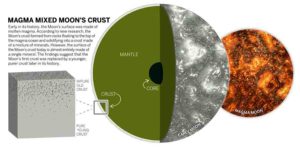
Home Blog Page 108

Past mass extinctions could help scientists prevent the next one

learcut logging in the Pacific Northwest
Scientists say human activity such as this clearcut logging in the Pacific Northwest could be ushering in the next mass extinction. Credit: Dave Mantel/iStockPhoto

Black rhinos, red wolves, whooping cranes: the global list of endangered species grows every year to the point where some researchers say we’re witnessing the start of Earth’s next mass extinction.

University of Cincinnati geology professor Thomas Algeo is studying the most devastating cataclysm ever to strike the planet to inform our understanding of global changes scientists are observing today. Algeo gave a keynote presentation on the topic to the Geological Society of America during its annual conference last month in Seattle.

Algeo, who works in the McMicken College of Arts & Sciences, has spent his career investigating Earth’s five biggest known extinctions, including a calamity 252 million years ago that wiped out most life on Earth at the time.

“There has been a lot of interest in studying these events. They inform us about the course of biological evolution during Earth’s history,” he said.

Extinction is a natural part of evolution, Algeo said. But mass extinctions are marked by a devastating loss of biodiversity, usually as a result of a catastrophic global disaster. Scientists have identified five of them in Earth’s history, the largest of which is sometimes called “the Great Dying.” This natural disaster occurred between the Permian and Triassic periods when volcanoes in what is now Siberia erupted and spewed enough lava to cover more than 400,000 square miles – an area 10 times bigger than Ohio.

To put that in perspective, the 1980 eruption of Mount St. Helens in Washington leveled 150 square miles of forest and spewed so much lava that ash fell onto car windshields 1,500 miles away in Oklahoma. That eruption blasted 3 cubic kilometers of material into the atmosphere.

The Permian-Triassic extinction featured 11 periods of major volcanic eruptions, spewing 3 million cubic kilometers of ash and rock into the air over a span of 1 million years. Afterward, ocean surface temperatures increased by 10 degrees Celsius from the greenhouse effect of volcanic methane and carbon dioxide in the air. The land became a veritable dust bowl with frequent and intense storms, while the oceans were depleted of oxygen and became highly acidified.

Scientists are still at odds about which of the resulting consequences was most responsible for the enormous die-off of plants and animals.

“Is it the rise in temperature? The lack of oxygen in the water or acidification of the oceans?” Algeo said. “I think it’s going to be very difficult to tease apart these effects because they’re all operating simultaneously.”

Algeo also is studying how long it takes plants and animals to recover after a mass extinction.

“We want to know how the recovery was related to changing and ameliorating environmental conditions,” he said. “There is a lot of potential to make new discoveries in this area.”

Life persisted after each global extinction. Surviving species adapted to the new conditions and the hardiest and most prolific of them, called “disaster taxa,” spread out quickly to fill the void, albeit with much lower species diversity, Algeo said.

Algeo in 1995 developed the prevailing theory for one of the Big 5 mass extinctions, which occurred at the end of the Devonian Period 360 million years ago. That extinction was considerably slower, spanning 25 million years, and doomed about half of life on Earth, particularly marine life.

Instead of a single catastrophic event such as a meteor strike or volcanic eruption, Algeo suggested a surprising culprit was to blame: plants.

“During the Devonian, land plants became established and started developing innovations such as leaves and root systems that allowed them to grow more vigorously in different environments,” he said. “They developed woody tissues that allowed them to grow bigger. And they developed seeds so they could colonize drier habitats.”

Over millions of years, Earth sprouted a massive new garden but at a cost. Waterways became choked with nutrients from decomposing plants. This decaying vegetation absorbed oxygen in the water, starving out other life, a process called eutrophication.

It’s a phenomenon that’s becoming more common now in waterways from the Gulf of Mexico to estuaries along the East Coast, fed by nutrient runoff from coastal development.

“Plants mine out nutrients in the soil, which is locked up temporarily in the biomass. But when the plant dies, eventually those nutrients get washed into waterways and into the ocean, triggering massive blooms of marine algae,” he said.

Geologists studying the Devonian find huge deposits of organic-rich black shale, evidence that supports Algeo’s hypothesis.

“It all links together very nicely,” Algeo said.

Knowing more about the impacts to the Earth after the biggest natural catastrophes can inform current research into climate change, water quality and biodiversity. Previous mass extinctions can serve as a cautionary tale for decisions we make today, he said.

“Previous mass extinctions show that things can go drastically wrong and wipe out huge parts of the biosphere in relatively short periods,” he said. “We should be concerned about that.”

The idea that humans are precipitating the world’s next mass extinction is controversial but supported by evidence. A study published this year in Nature found that 1 in 4 mammals and 13 percent of all birds were threatened with extinction from expanding development, habitat fragmentation, hunting and pollution. The most species-rich forests are expected to see increasing extinction risks at current human population and land-use projections, the study said.

“There’s a general pattern in mass extinctions. The higher up the food chain you go, the more likely you are to go extinct,” Algeo said.

Scientists and conservation groups around the world are working hard to protect biodiversity. Nonprofit groups such as Gorilla Doctors, which provides medical intervention to endangered mountain gorillas, are focused on a single species while others, such as the National Wildlife Federation, have broader goals.

“A lot of people tend to think of the extinction crisis as something happening far off in tropical rainforests. But here in the United States, we have many species in our own back yards that have declined and are seriously threatened,” said Bruce Stein, associate vice president of conservation science and climate adaptation for the National Wildlife Federation.

Stein said the fossil record has a lot to say about how species adjust to climate change. This could help inform conservation efforts in years to come.

“We can learn a lot by looking at species that survived extinction episodes,” he said.

In particular, scientists are studying the biggest cold-weather animals, which are expected to be the first to succumb to climate change. For example, moose are declining in the southern part of their range where they face a growing threat from parasites such as ticks and brainworm-causing nematodes that traditionally were kept in check by cold winters.

“They get a massive tick load in the summer that just sucks them dry. These moose scratch on trees and end up rubbing off their fur. They call them ghost moose,” Stein said. “Without this insulation, they don’t survive the winter.”

Intervention has brought some well-known species back from the brink of extinction in recent years, which shows what is possible with both public will and resources. But the trend line for many species is discouraging, Stein said.

“There are some great success stories: bald eagles and peregrine falcons. The California condor,” Stein said. “But for every recovery or success, there are far more species in serious trouble or declining.”

The inevitable loss of biodiversity will have few noticeable repercussions for people. But the same underlying issues are expected to lead to increasing population migration as people flee famine, drought, disease and natural disasters such as hurricanes and floods. The Obama Administration in 2016 declared climate change “a significant and growing threat to national security.”

Despite the challenges, Stein said there is reason for optimism.

“If we hold the pace of climate change, there are opportunities for people, plants and animals to adapt to those changes,” he said.

UC’s Algeo said it could take more time and natural catastrophes for the public to make sacrifices and demand policy changes.

“I personally think there will be another mass extinction. It’s going to be a very hard thing to stop,” Algeo said. “There will have to be visible consequences before people wake up to the degree that they demand action from their leaders.

“It’s a global problem,” Algeo said. “It requires a global solution.”

Note: The above post is reprinted from materials provided by University of Cincinnati.

Is Iceland’s tallest volcano awakening?

Öræfajökull Volcano
Öræfajökull. Credit: Dave McGarvie

Table of Contents

Two women and a boy took refuge on the roof … but it was carried away by the deluge of water, and as far as the eye could reach, the three unfortunate persons were seen clinging to the roof. One of the women was afterwards found among the mud of the jökulhlaup [Icelandic term for meltwater flood], but burnt, and as it were parboild; her body was so damaged and tender, but it could scarcely be touched.

This is an eyewitness account of three fatalities during the last eruption (1727) of Iceland’s highest volcano, Öræfajökull. It was a relatively small eruption. The previous eruption in 1362, however, remains Iceland’s largest explosive eruption since the island was settled about 1,100 years ago.

This time, thick deposits of pumice and ash (also known as tephra) covered the volcano, while sailors at the time reported pumice floating “in such masses that ships could hardly make their way through it”. Ash from the 1362 eruption has been found in Greenland and western Europe recently.

Since June 2017, there have been “swarms” of small earthquakes in the region. Earthquakes are rare at Öræfajökull, so these have prompted meetings between locals, scientists and civil protection authorities. The unusual activity may indicate a reawakening of Öræfajökull, so it is timely to review previous eruptions and the potential effects of a future eruption.

Towering over 2km above coastal plains, Öræfajökull is a majestic sight. Its upper half is covered in ice that feeds valley glaciers that can be easily accessed. Tourists and filmmakers love it.

We first studied the volcano in 2001-2002. Our two main findings were that it has a variety of eruption styles and a surprising abundance of lavas known as rhyolites. We know that this can erupt very explosively – as it did in 1362.

To better understand the 1362 eruption, we have also mapped deposits preserved on the volcano. We found that this explosive eruption was surprisingly variable. It was not just a simple plume that gets gradually weaker, as is common at other volcanoes such as Hekla.

The eruption started by depositing a tephra blanket from a relatively low plume. Next, sticky ash/hail carpeted the volcano. Then the main phase of the eruption began with pyroclastic flows (fast-moving current of hot gas and volcanic matter) racing down the flanks, before a tall plume was established and rained huge pumices down on the land while ash clouds drifted away. As the eruption ended, its explosive energy fluctuated rapidly.

The main implication of our study is that explosive eruptions at Öræfajökull can be complicated. The most powerful phase with the highest plume and widest ash dispersal was probably short-lived (lasting from a few hours to a few days), but there were other stages before and after it with varying degrees of explosivity.

Locally, the eruption was devastating. Rich farmland at the foot of the volcano was covered by thick tephra deposits and swept by pyroclastic flows. The area was abandoned and renamed “Öræfi” (wasteland). Originally called Hnappafellsjökull, the volcano was renamed Öræfajökull.

What of the inhabitants – did they perish or escape? Three crucial pieces of evidence come from excavations of abandoned farms. Buildings had collapsed prior to the tephra fall and, despite evidence of prosperity, virtually nothing valuable was left behind. Also, no corpses were found. Conclusion? Inhabitants of these farms realised they were in danger, packed their belongings, and left. Large earthquakes then destroyed the buildings before the eruption started.

Air travel

The Icelandic volcano Eyjafjallajökull erupted in 2010, causing a lot of problems to air travel across Europe. Would a repeat of the 1362 eruption cause Eyjafjallajökull 2010-style disruption? No, it would not.

Eyjafjallajökull caused so much disruption because the eruption lasted for weeks, with the wind often blowing towards Europe, and because aircraft attempted to “avoid all ash“. Since then, improvements to volcanic ash cloud detection and simulation have been made. These, combined with revised procedures at the regulators and airlines, allow planes to fly where low concentrations of ash may be present. For example, the Grímsvötn 2011 eruption, which produced twice as much tephra as the Eyjafjallajökull 2010 eruption in one tenth of the time, caused just 1% of the flight cancellations.

A repeat of the 1362 eruption would disperse ash widely, but our results suggest this stage would be short-lived. This is just one scenario. Others, such as the eruption of lava beneath the ice, may be longer lasting but any disruption would be more localised.

Evacuation

It’s important to be prepared. Any buildings in the paths of floods would be destroyed. There are farming communities in the area but these have learned from the 1727 eruption and have relocated their farms from the glacier outlets. Before the small 1727 eruption there were earthquake shocks that terrified the people, which suggests that big earthquakes might provide warning of the next eruption and allow time for evacuation.

One of the biggest concerns would be the large number of tourists in the area – especially in summer. The nearby visitor centre of Skaftafell is the seventh most popular tourist destination in Iceland. However, Skaftafell lies outside the flood pathways of both the 1362 and 1727 eruptions – and so it is probably safe from floods.

It’s impossible to estimate exactly when Öræfajökull will next erupt. She may just be turning over in her sleep, soon to return to quiet slumber. Icelandic scientists recently installed additional earthquake monitoring equipment: with their acknowledged expertise in eruption monitoring they will provide the best possible information should Öræfajökull fully awaken.

Note: The above post is reprinted from materials provided by The Conversation. The original article was written by Dave McGarvie, Senior lecturer, The Open University; John A Stevenson, Senior Software Developer, British Geological Survey, and Peter Nicholls, PhD candidate in volcanology, The Open University

This article was originally published on The Conversation. Read the original article.

How a ‘shadow zone’ traps the world’s oldest ocean water

This is a schematic illustration of water currents.
This is a schematic illustration of water currents. Credit: Fabien Roquet and Casimir de Lavergne

New research from an international team has revealed why the oldest water in the ocean in the North Pacific has remained trapped in a shadow zone around 2km below the sea surface for over 1000 years.

To put it in context, the last time this water encountered the atmosphere the Goths had just invaded the Western Roman Empire.

The research suggests the time the ancient water spent below the surface is a consequence of the shape of the ocean floor and its impact on vertical circulation.

“Carbon-14 dating had already told us the most ancient water lied in the deep North Pacific. But until now we had struggled to understand why the very oldest waters huddle around the depth of 2km,” said lead author from the University of New South Wales, Dr Casimir de Lavergne. “What we have found is that at around 2km below the surface of the Indian and Pacific Oceans there is a ‘shadow zone’ with barely any vertical movement that suspends ocean water in an area for centuries.

The shadow zone is an area of almost stagnant water sitting between the rising currents caused by the rough topography and geothermal heat sources below 2.5km and the shallower wind driven currents closer to the surface.

Before this research, models of deep ocean circulation did not accurately account for the constraint of the ocean floor on bottom waters. Once the researchers precisely factored it in they found the bottom water can not rise above 2.5km below the surface, leaving the region directly above isolated.

While the researchers have unlocked one part of the puzzle their results also have the potential to tell us much more.

“When this isolated shadow zone traps millennia old ocean water it also traps nutrients and carbon which have a direct impact on the capacity of the ocean to modify climate over centennial time scales,” said fellow author from Stockholm University, Dr Fabien Roquet.

The article “Abyssal ocean overturning shaped by seafloor distribution” is published in the scientific journal Nature.

Reference:
C. de Lavergne, G. Madec, F. Roquet, R. M. Holmes, T. J. McDougall. Abyssal ocean overturning shaped by seafloor distribution. Nature, 2017; 551 (7679): 181 DOI: 10.1038/nature24472

Note: The above post is reprinted from materials provided by Stockholm University.

What are Ripple Marks?

Ripple Marks
Ripple Marks

Ripple marks are sedimentary structures and indicate agitation by water (current or waves) or wind.

Ripple marks are ridges of sediment that form in response to wind blowing along a layer of sediment. They are form perpendicular to the wind direction and each ridge is roughly equidistant from the ripple mark on either side.

The troughs and ridges of fossilized ripple mark in sandstone and siltstones are hardened versions of the short-lived ripples in the loose sand of a modern-day stream, lake, sea, or sand dune. Ripples may be made by water or, in sand dunes, by wind. The symmetry of water-current ripple marks indicate whether they were formed by gentle waves or faster water currents.

What are types of Ripple marks?

There are two types:

Symmetrical ripple marks

Often found on beaches, they are created by a two way current, for example the waves on a beach (swash and backwash). This creates ripple marks with pointed crests and rounded troughs, which aren’t inclined more to a certain direction. Three common sedimentary structures that are created by these processes are herringbone cross-stratification, flaser bedding, and interference ripples.

Asymmetrical ripple marks

These are created by a one way current, for example in a river, or the wind in a desert. This creates ripple marks with still pointed crests and rounded troughs, but which are inclined more strongly in the direction of the current. For this reason, they can be used as palaeocurrent indicators.

Ripple marks Size (scale)

  • Very small: Very small cross-lamination means that the ripple height is roughly one centimeter. It is lenticular, wavy and flaser lamination.
  • Small: Small cross-bedding are ripples set at a height less than ten centimeters, while the thickness is only a few millimeters. Some ripples that may fit this category are wind ripples, wave ripples, and current ripples.
  • Medium: Medium cross-lamination are ripples with a height greater than ten centimeters, and less than one meter in thickness. Some ripples that may fit this category would be current-formed sand waves, and storm-generated hummocky cross stratification.
  • Large: Large cross-bedding are ripples with a height greater than one meter, and a thickness equivalent to one meter or greater. Some ripples that may fit this category would be high energy river-bed bars, sand waves, epsilon cross-bedding and Gilbert-type cross-bedding.

Reference:
Wikipedia: Sedimentary structures
Wikipedia
Indiana University Bloomington: Sedimentary Structures
Kansas Geological Survey
University of California, Davis: The Ripple effect: Asymmetric Ripple Marks at Cavern Point

New postcranial skeleton of ancient dolphin Albertocetus meffordum found in South Carolina

Albertocetus meffordum.
Albertocetus meffordum. Credit: Boessenecker et al (2017)

A partial skeleton from an Oligocene dolphin species was found in South Carolina, according to a study published November 8, 2017 in the open-access journal PLOS ONE by Robert Boessenecker from the College of Charleston, South Carolina, USA, and Erum Ahmed and Jonathan Geisler from the New York Institute of Technology, New York.

Previous research has shed light on the early evolutionary history of toothed whales, and particularly xenorophid dolphins – the earliest group of echolocating dolphins. Since the archaeological record for Xenorophidae is very limited, prior studies have focused on the crania or earbones of xenorophid dolphins.

The authors of the present study report five new specimens of xenorophid dolphins from North and South Carolina. Four of the specimens belonged to the xenorophid Albertocetus meffordorum, and one contained a partial skeleton including ribs, vertebrae, and chevrons as well as a partial skull and mandible. Since these specimens were collected from formations dating to the Oligocene (33.9 million to 23 million years before the present), this finding extends the known evolutionary history for this group.

The researchers studied the internal anatomy of the Albertocetus cranium using CT scan data, revealing that its brain was quite large in size, the largest yet for an early Oligocene toothed whale. Brain anatomy was further intermediate between modern cetaceans (such as dolphins, whales, and porpoises) and terrestrial even-toed hoofed animals (such as pigs, deer, and sheep). The partial vertebral column indicates that Albertocetus retained a similar shape and moved similarly to its archaeocete ancestors that lived 40 to 35 million years ago. Vertebrae from the tail indicate that Albertocetus had tail flukes like modern dolphins, but not a caudal peduncle – a narrow tail stock seen in all modern whales and dolphins.

The authors suggest that further collecting efforts in North and South Carolina might yield additional cetaceans that are contemporary with the specimens described in this study, and would continue to piece together the evolutionary history of this species.

The lead author Robert Boessenecker says, “Fossils like these new specimens of Albertocetus are critical windows into the earliest evolution of modern whales, and shed light on the split between baleen whales and echolocating whales about 30-35 million years ago.”

Reference:
Boessenecker RW, Ahmed E, Geisler JH (2017) New records of the dolphin Albertocetus meffordorum (Odontoceti: Xenorophidae) from the lower Oligocene of South Carolina: Encephalization, sensory anatomy, postcranial morphology, and ontogeny of early odontocetes. PLoS ONE 12(11): e0186476. DOI: 10.1371/journal.pone.0186476

Note: The above post is reprinted from materials provided by Public Library of Science.

Mysterious ‘geomagnetic spike’ 3,000 years ago challenges our understanding of the Earth’s interior

Earth magnetic field
The Earth has a powerful magnetic field. Credit: NASA

The Earth’s magnetic field, generated some 3,000km below our feet in the liquid iron core, threads through the whole planet and far into space – protecting life and satellites from harmful radiation from the sun. But this shielding effect is far from constant, as the field strength varies significantly in both space and time.

Over the last century, the field strength has changed relatively slowly: the biggest change is a 10% fall in the southern Atlantic, which is still a large enough effect to cause electronic problems for satellites that have passed through the region. However, new observations and modelling suggest that a much greater change strangely occurred around 1000BC in a much smaller region.

This “geomagnetic spike” offers a potentially profound new insight into the dynamics and evolution of Earth’s hidden interior that is now starting to be uncovered.

So what are geomagnetic spikes and what are the prospects and implications of another one coming along? The geomagnetic spike of 1000BC was first identified from copper slag heaps located in Jordan and Israel. These were dated from organic material within the slag heaps using radiocarbon dating.

Scientists then investigated the copper using sophisticated laboratory techniques to work out what the Earth’s magnetic field was at the time – relying on the fact that when melted iron cools rapidly, it freezes with a signature of the field at that instant. By taking samples from different layers of the slag heap – with slightly different ages and magnetisation – they could also see how the field strength changed with time. They found that the copper slag had recorded Earth’s magnetic field strength rising and then falling by over 100% in only 30 years.

Unexpectedly high field strengths around 1000BC have also been uncovered in Turkey, China and Georgia from a variety of sources. Remarkably, the field strength in India, Egypt and Cyprus around the same time was completely normal, indicating that the spike was perhaps only 2,000km wide. Such a rapid change over such a small area marks out the geomagnetic spike as one of the most extreme variations of Earth’s magnetic field ever recorded.

The spike seen in Jordan is the result of a much stronger and narrower magnetic feature that was created in Earth’s liquid core. The process that generated the spike is still shrouded in mystery, though it is likely related to the flow of iron within the core, which drags around the magnetic field as it moves (currents produce magnetic fields). The core is heated from below and cooled from above, so the iron within is thought to undergo vigorous turbulent motion, similar to a strongly heated pan of water. One possibility is that the spike was drawn to the surface of Earth’s core by a jet of upward moving iron.

After this, the spike may have moved northwest before merging with other magnetic features near the geographic poles. Alternatively, the spike intensity may have waned while it remained under Jordan.

All of these options suggest that behaviour of the liquid iron at the top of Earth’s core around 1000BC was very different to that seen today. Most of our knowledge of the core derives from roughly the last 200 years, corresponding to the time when direct magnetic field measurements have been available. Prior to discovery of the spike there was no reason to suspect that core flow speeds would be much different in 1000BC to today – indeed, the available models suggest there was little difference.

However, explaining the rapid changes associated with the spike requires flows five to ten times those at present, a large change in a short space of time. Moreover, such a narrow spike requires a similarly localised flow, which contrasts with the global-scale circulations we see today. The prospect that the iron core could flow faster and change more suddenly than previously thought, together with the possibility that even more extreme spike-like events occurred in the past, is challenging some conventional views on the dynamics of Earth’s core.

Future impact?

Changes in Earth’s magnetic field are not generally thought to have direct consequences for life, but there are potentially significant societal implications that arise from our reliance on electronic infrastructure. A variety of effects can arise from interactions between Earth’s magnetic field and charged particles reaching Earth from the sun.

Of particular importance are geomagnetic storms (caused by the solar wind), which are known to cause power outages and disruption to satellite and communications systems. The economic implications of severe storms are estimated to run into billions of pounds and their importance is now reflected in the national risk register.

Geomagnetic storms tend to be most prevalent in regions where Earth’s magnetic field is unusually weak. Spikes are regions of unusually strong magnetic field, but a fundamental law of nature means that they must be accompanied by regions of weaker field elsewhere on the globe. The key question is whether the field gets a little bit weaker over a large region or becomes very weak in just a small region. The latter “anti-spike” scenario could be similar to or more extreme than the current south Atlantic weak spot.

Whether there will be more spikes is hard to say. Until very recently, the Jordanian spike was the only such event ever observed. However, there is now tantalising new evidence for another spike-like feature in Texas, also around 1000BC. Our understanding of what spikes should look like, how they change in time, and how they relate to the motion of the liquid iron in Earth’s core are also improving rapidly.

Coupled with numerical simulations that model the dynamics of Earth’s core, it may soon be possible to make the first predictions of how often spikes occur and the most likely locations where they could have occurred in the past (and may occur in the future). It could turn out that they are more common than we think.

Note: The above post is reprinted from materials provided by The Conversation. Christopher Davies, NERC Independent Research Fellow/Lecturer in Geophysics, University of Leeds

This article was originally published on The Conversation. Read the original article.

Height and weight evolved at different speeds in the bodies of our ancestors

Femoral head bones of different species illustrating the size range in the hominin lineage
Femoral head bones of different species illustrating the size range in the hominin lineage. From top to bottom: Australopithecus afarensis (4-3 million years; ~40 kg, 130 cm); Homo ergaster (1.9-1.4 million years; 55-60 kg; ~165 cm); Neanderthal (200.000-30.000 years; ~70 kg; ~163 cm). Credit: University of Cambridge

A wide-ranging new study of fossils spanning over four million years suggests that stature and body mass advanced at different speeds during the evolution of hominins — the ancestral lineage of which Homo sapiens alone still exist.

Published today in the journal Royal Society Open Science, the research also shows that, rather than steadily increasing in size, hominin bodies evolved in “pulse and stasis” fluctuations, with some lineages even shrinking.

The findings are from the largest study of hominin body sizes, involving 311 specimens dating from earliest upright species of 4.4m years ago right through to the modern humans that followed the last ice age.

While researchers describe the physical evolution of assorted hominin species as a “long and winding road with many branches and dead ends,” they say that broad patterns in the data suggest bursts of growth at key stages, followed by plateaus where little changed for many millennia.

The scientists were surprised to find a “decoupling” of bulk and stature around one and a half million years ago, when hominins grew roughly 10cm taller but would not consistently gain any heft for a further million years, with an average increase of 10-15kgs occurring around 500,000 years ago.

Before this event, height and weight in hominin species appeared to evolve roughly “in concert,” say the authors of this first study to jointly analyse both aspects of body size over millions of years.

“An increase solely in stature would have created a leaner physique, with long legs and narrow hips and shoulders. This may have been an adaptation to new environments and endurance hunting, as early Homo species left the forests and moved on to more arid African savannahs,” says lead author Dr Manuel Will from Cambridge’s Department of Archaeology, and a Research Fellow at Gonville and Caius College.

“The higher surface-to-volume ratio of a tall, slender body would be an advantage when stalking animals for hours in the dry heat, as a larger skin area increases the capacity for the evaporation of sweat.”

“The later addition of body mass coincides with ever-increasing migrations into higher latitudes, where a bulkier body would be better suited for thermoregulation in colder Eurasian climates,” he says.

However, Dr Will points out that, while these are valid theories, vast gaps in the fossil record continue to mask absolute truths. In fact, Will and colleagues often had to estimate body sizes from highly fragmented remains — in some cases from just a single toe bone.

The study found body size to be highly variable during earlier hominin history, with a range of differently shaped species: from broad, gorilla-like Paranthropus to the more wiry or ‘gracile’ Australopithecus afarensis. Hominins from four million years ago weighed a rough average of 25kg and stood at 125-130cm.

As physicality morphs over deep time, increasingly converging on larger body sizes, the scientists observe three key “pulses” of significant change.

The first occurs with the dawn of our own defined species bracket, Homo, around 2.2-1.9m years ago. This period sees a joint surge in both height (around 20 cm) and weight (between 15-20kg).

Stature then separated from heft with a height increase alone of 10cm between 1.4-1.6m years ago, shortly after the emergence of Homo erectus. “From a modern perspective this is where we see a familiar stature reached and maintained. Body mass, however, is still some way off,” explains Will.

It’s not until a million years later (0.5-0.4m years ago) that consistently heavier hominins appear in the fossil record, with an estimated 10-15kg greater body mass signalling adaptation to environments north of the Mediterranean.

“From then onwards, average body height and weight stays more or less the same in the hominin lineage, leading ultimately to ourselves,” says Will.

There are, however, a couple of exceptions to this grand narrative: Homo naledi and Homo floresiensis*. Recently discovered remains suggest these species swam against the tide of increasing body size through time.

“They may have derived from much older small-bodied ancestors, or adapted to evolutionary pressures occurring in small and isolated populations,” says Will. Floresiensis was discovered on an Indonesian island.

“Our study shows that, other than these two species, hominins that appear after 1.4m years ago are all larger than 140cm and 40kg. This doesn’t change until human bodies diversify again in just the last few thousand years.”

“These findings suggest extremely strong selective pressures against small body sizes which shifted the evolutionary spectrum towards the larger bodies we have today.”

Will and colleagues say evolutionary pressures that may have contributed include ‘cladogenesis’: the splitting of a lineage, with one line — the smaller-bodied one, in this case — becoming extinct, perhaps as a result of inter-species competition.

They also suggest that sexual dimorphism — the physical distinction between genders, with females typically smaller in mammals — was more prevalent in early hominin species but then steadily ironed out by evolution.

Study co-author Dr Jay Stock, also from Cambridge’s Department of Archaeology, suggests this growth trajectory may continue.

“Many human groups have continued to get taller over just the past century. With improved nutrition and healthcare, average statures will likely continue to rise in the near future. However, there is certainly a ceiling set by our genes, which define our maximum potential for growth,” Stock says.

“Body size is one of the most important determinants of the biology of every organism on the planet,” adds Will. “Reconstructing the evolutionary history of body size has the potential to provide us with insights into the development of locomotion, brain complexity, feeding strategies, even social life.”

Reference:
Manuel Will, Adrián Pablos, Jay T. Stock. Long-term patterns of body mass and stature evolution within the hominin lineage. Royal Society Open Science, 2017; 4 (11): 171339 DOI: 10.1098/rsos.171339

Note: The above post is reprinted from materials provided by University of Cambridge. The original story is licensed under a Creative Commons License.

Changing climate to bring more landslides on logged land

An aerial image of the Oso landslide on April 13, 2014. Credit: Photo courtesy Tim Stark

Washington State University researchers say landslides on logged forests will be more widespread as the Northwest climate changes.

In a study modelled on clear-cut lands on the Olympic Peninsula, they anticipate the climate of 2045 and conclude that there will be a 7 -11 percent increase in the land that is highly vulnerable to landslides. The researchers say their findings are applicable to the Cascade Mountain Range area as well.

The study, published in Engineering Geology, is the first to look at landslides and climate change in the Pacific Northwest. The University of Washington’s Climate Impacts Group “State of Knowledge” report in 2015 looked at reasons behind climate-influenced landslides — earlier snowmelt, more rain, less cohesive soils — but stopped short of predicting an increase in landslides.

The WSU study goes a step further.

“Logged landscapes become more susceptible to landslide activity under climate change,” said Jennifer Adam, an associate professor of civil and environmental engineering and associate director of the State of Washington Water Research Center.

Warning and tool

Adam said the study can serve as both a warning and a tool, helping land managers identify several features of vulnerable slopes that can guide their harvesting decisions. The researchers found vulnerable slopes tend to be at elevations over 1,600 feet, with slopes in the range of 40 or more degrees and talus or sandy soils.

“This study allowed us to look at exactly what characteristics of the landscape became more susceptible, allowing us to identify win-win situations in which both environmental and economic outcomes can be improved by targeted logging locations,” Adam said. “It’s not that we’re saying, (Would it be clearer to say, “We’re not saying, ‘Don’t log….”)

‘Don’t log because you’re going to have more landslides.'”

The study, said lead author Muhammad Barik, “is telling people, if you are cutting trees on this slope, it might be OK today. But in the future, it might not be, so plan according to that. If you do logging in this area without considering future projections, it might become susceptible to landslides.”

Oso landslide

Washington witnessed the deadliest landslide in U.S. history three years ago when 270 million cubic feet of mud barreled through a neighborhood outside Oso, Wash., killing 43 people and destroying 49 homes. A subsequent engineering report found that recent logging may have increased the amount of water on the slope, though the report did not pin the slide on any single cause.

Landslides also can lead to billions of dollars of economic losses and damage aquatic habitats, including those used by the region’s endangered salmon, the researchers write. Clear-cutting reduces the rainfall that can be intercepted by leaves and reduces the ability of roots to reinforce soil that is more likely to be saturated under the Northwest’s changing climate.

“Wet soil is not cohesive, so it becomes very unstable,” said Adam. “If you don’t have a lot of vegetation and deep roots holding that soil in place, then it becomes susceptible to landslides.”

Olympic Forest

Adam and Barik looked at one of the wettest locations in the continental United States, the Queets watershed in the Olympic Experimental State Forest, which receives between 96 and 236 inches of rain a year. While they chose the area for its varied geography, it is typical of rainforest from southern Oregon to southeast Alaska. Their hydrologic model, which is commonly used around the Pacific Northwest, considered variations in soil, land cover, topography and subsurface moisture as it simulated water-induced slope failures. They factored in meteorological data, a digital landslide database and satellite imagery.

Climate change is expected to bring warmer and wetter winters to the region, as well as more frequent extreme rainfall events.

“The combination of warming, precipitation and less snow means more liquid precipitation, which will then sit in the soil and keep it wet and unstable,” said Adam.

To anticipate the climate of 2045, the researchers used two greenhouse-gas emission scenarios of the United Nations’ Intergovernmental Panel on Climate Change. One scenario, which predicts the lowest emissions, saw an average 7.1 percent increase in the area highly susceptible to landslides. The other scenario, which predicts the highest emissions, saw an average increase of 10.7 percent.

“We’re giving you a tool to see into the future,” said Barik, who did the research as part of his WSU doctoral studies. “Most of the landslide studies are based on historical data. Here, along with historical data, we also used climate models so you can look at future projections.”

Reference:
Improved landslide susceptibility prediction for sustainable forest management in an altered climate. DOI: 10.1016/j.enggeo.2017.09.026

Note: The above post is reprinted from materials provided by Washington State University.

What is the Difference Between a Mineral and a Mineraloid?

Minerals
Representative Image: Minerals

What is Mineral?

A mineral is a naturally occurring chemical compound, usually of crystalline form and abiogenic in origin (not produced by life processes). A mineral has one specific chemical composition, whereas a rock can be an aggregate of different minerals or mineraloids. The study of minerals is called mineralogy.

There are over 5,300 known mineral species; as of March 2017, over 5,230 of these had been approved by the International Mineralogical Association (IMA). The silicate minerals compose over 90% of the Earth’s crust. Silicon and oxygen constitute approximately 75% of the Earth’s crust, which translates directly into the predominance of silicate minerals.

Minerals are distinguished by various chemical and physical properties. Differences in chemical composition and crystal structure distinguish the various species, which were determined by the mineral’s geological environment when formed. Changes in the temperature, pressure, or bulk composition of a rock mass cause changes in its minerals.

Minerals can be described by their various physical properties, which are related to their chemical structure and composition. Common distinguishing characteristics include crystal structure and habit, hardness, lustre, diaphaneity, colour, streak, tenacity, cleavage, fracture, parting, specific gravity, magnetism, taste or smell, radioactivity, and reaction to acid. (How to Identify Minerals?)

Minerals are classified by key chemical constituents; the two dominant systems are the Dana classification and the Strunz classification. The silicate class of minerals is subdivided into six subclasses by the degree of polymerization in the chemical structure. All silicate minerals have a base unit of a [SiO4]4− silica tetrahedron—that is, a silicon cation coordinated by four oxygen anions, which gives the shape of a tetrahedron. These tetrahedra can be polymerized to give the subclasses: orthosilicates (no polymerization, thus single tetrahedra), disilicates (two tetrahedra bonded together), cyclosilicates (rings of tetrahedra), inosilicates (chains of tetrahedra), phyllosilicates (sheets of tetrahedra), and tectosilicates (three-dimensional network of tetrahedra). Other important mineral groups include the native elements, sulfides, oxides, halides, carbonates, sulfates, and phosphates.

What is Mineraloid?

A mineraloid is a mineral-like substance that does not demonstrate crystallinity. Mineraloids possess chemical compositions that vary beyond the generally accepted ranges for specific minerals. For example, obsidian is an amorphous glass and not a crystal. Jet is derived from decaying wood under extreme pressure. Opal is another mineraloid because of its non-crystalline nature. Pearl, considered by some to be a mineral because of the presence of calcium carbonate crystals within its structure, would be better considered a mineraloid because the crystals are bonded by an organic material, and there is no definite proportion of the components.

Examples:

  • Amber, non-crystalline structure, organic
  • Chlorophaeite
  • Deweylite, a mixture of serpentine and talc or stevensite
  • Ebonite, vulcanized natural or synthetic rubber (organic); lacks a crystalline structure
  • Jet, non-crystalline nature, organic (very compact coal)
  • Lechatelierite, nearly pure silica glass
  • Limonite, a mixture of oxides and hydroxides of iron
  • Mercury, liquid (IMA/CNMNC valid mineral name)
  • Obsidian, volcanic glass – non-crystalline structure, a silica rich glass
  • Opal, non-crystalline hydrated silica silicon dioxide (IMA/CNMNC valid mineral name)
  • Palagonit
  • Pearl, organically produced carbonate
  • Petroleum, liquid, organic
  • Pyrobitumen, amorphous fossilized petroleum (noncrystalline, organic)
  • Sideromelane
  • Shungite, black, lustrous, more than 98 weight percent of carbon
  • Tektites, meteoritic silica rich glass

Reference:
Wikipedia: Mineral
Wikipedia: Mineraloid

Large Yellow Rough Diamond unearthed

Yellow Rough Diamond
Yellow Rough Diamond . Image courtesy of ALROSA.

ALROSA’s affiliate Almazy Anabara has extracted a large 34.17-carat yellow diamond. It is the largest fancy-colored rough diamond extracted by the Company this year.

The rough diamond, extracted from Ebelyakh alluvial deposit, measures 20.17 х 19.65 х 15.1 mm. It is a transparent intense yellow crystal with a small inclusion in the intermediate zone.

Before the end of October, it will be delivered to the United Selling Organization ALROSA (USO ALROSA) in Moscow, where the Company specialists will give it a more detailed and accurate assessment.

“This year for ALROSA has already hit the record in the number of large fancy-colored stones. We used to extract fancy-colored rough diamonds over 10 carats once a year on the average. This year, we have already recovered several large fancy-colored diamonds, and this 34.17-carat yellow stone is the largest one so far. The Company’s specialists are still to study the stone more in detail, but we can say in advance that it is fancy vivid yellow, which is very rare and highly valued. The stone will become a worthy addition to our collection of large rare-colored diamonds that we are forming and will bring to the market,” said the director of the United Selling Organization ALROSA Evgeny Agureev.

Almazy Anabara is traditionally the leader in the number of fancy-colored stones. Earlier this year, Almazy Anabara also extracted a unique 27.85-carat pure pink diamond – the largest pink stone in ALROSA’s history.

Note: The above post is reprinted from materials provided by  ALROSA.

How to turn a volcano into a power station

Erta Ale in eastern Ethiopia
Erta Ale in eastern Ethiopia. Credit: mbrand85/shutterstock

Ethiopia tends to conjure images of sprawling dusty deserts, bustling streets in Addis Ababa or the precipitous cliffs of the Simien Mountains – possibly with a distance runner bounding along in the background. Yet the country is also one of the most volcanically active on Earth, thanks to Africa’s Great Rift Valley, which runs right through its heart.

Rifting is the geological process that rips tectonic plates apart, roughly at the speed your fingernails grow. In Ethiopia this has enabled magma to force its way to the surface, and there are over 60 known volcanoes. Many have undergone colossal eruptions in the past, leaving behind immense craters that pepper the rift floor. Some volcanoes are still active today. Visit them and you find bubbling mud ponds, hot springs and scores of steaming vents.

This steam has been used by locals for washing and bathing, but underlying this is a much bigger opportunity. The surface activity suggests extremely hot fluids deep below, perhaps up to 300°C–400°C. Drill down and it should be possible access this high temperature steam, which could drive large turbines and produce huge amounts of power. This matters greatly in a country where 77% of the population has no access to electricity, one of the lowest levels in Africa.

Geothermal power has recently become a serious proposition thanks to geophysical surveys suggesting that some volcanoes could yield a gigawatt of power. That’s the equivalent of several million solar panels or 500 wind turbines from each. The total untapped resource is estimated to be in the region of 10GW.

Converting this energy into power would build on the geothermal pilot project that began some 20 years ago at Aluto volcano in the lakes region 200km south of Addis Ababa. Its infrastructure is currently being upgraded to increase production tenfold, from 7MW to 70MW. In sum, geothermal looks like a fantastic low-carbon renewable solution for Ethiopia that could form the backbone of the power sector and help lift people out of poverty.

Scratching the surface

The major problem is that, unlike more developed geothermal economies like Iceland, very little is known about Ethiopia’s volcanoes. In almost all cases, we don’t even know when the last eruption took place – a vital question since erupting volcanoes and large-scale power generation will not make happy bedfellows.

In recent years, the UK’s Natural Environment Research Council (NERC) has been funding RiftVolc, a consortium of British and Ethiopian universities and geological surveys, to address some of these issues. This has focused on understanding the hazards and developing methods for exploring and monitoring the volcanoes so that they can be exploited safely and sustainably.

Teams of scientists have been out in the field for the past three years deploying monitoring equipment and making observations. Yet some of the most important breakthroughs have come through an entirely different route – through researchers analysing satellite images at their desks.

This has produced exciting findings at Aluto. Using a satellite radar technique, we discovered that the volcano’s surface is inflating and deflating. The best analogy is breathing – we found sharp “inhalations” inflating the surface over a few months, followed by gradual “exhalations” which cause slow subsidence over many years. We’re not exactly sure what is causing these ups and downs, but it is good evidence that magma, geothermal waters or gases are moving around in the depths some five km below the surface.

Taking the temperature

In our most recent paper, we used satellite thermal images to probe the emissions of Aluto’s steam vents in more detail. We found that the locations where gases were escaping often coincided with known fault lines and fractures on the volcano.

When we monitored the temperature of these vents over several years, we were surprised to find that most were quite stable. Only a few vents on the eastern margin showed measurable temperature changes. And crucially, this was not happening in synchronicity with Aluto’s ups and downs – we might have expected that surface temperatures would increase following a period of inflation, as hot fluids rise up from the belly of the volcano.

It was only when we delved into the rainfall records that we came up with an explanation: the vents that show variations appear to be changing as a delayed response to rainfall on the higher ground of the rift margin. Our conclusion was that the vents nearer the centre of the volcano were not perturbed by rainfall and thus represent a better sample of the hottest waters in the geothermal reservoir. This obviously makes a difference when it comes to planning where to drill wells and build power stations on the volcano, but there’s a much wider significance.

This is one of the first times anyone has monitored a geothermal resource from space, and it demonstrates what can be achieved. Since the satellite data is freely available, it represents an inexpensive and risk-free way of assessing geothermal potential.

With similar volcanoes scattered across countries like Kenya, Tanzania and Uganda, the technique could allow us to discover and monitor new untapped geothermal resources in the Rift Valley as well as around the world. When you zoom back and look at the big picture, it is amazing what starts to come into view.

Note: The above post is reprinted from materials provided by The Conversation. The original article was written by William Hutchison, Research Fellow, University of St Andrews; Juliet Biggs, Reader in Earth Sciences, University of Bristol, and Tamsin Mather, Professor of Earth Sciences, University of Oxford

This article was originally published on The Conversation. Read the original article.

Aussie snakes and lizards trace back to Asia 30 million years ago

Eastern brown snake
Eastern brown snake. Credit: John Tann, Flickr.

Deadly snakes are among Australia’s most iconic animals. Now a new study led by The Australian National University (ANU) has helped explain how they descended from creatures that have come from Asia over the past 30 million years.

Lead researcher Dr Paul Oliver said about 85 per cent of more than 1,000 snake and lizard species in Australia descended from creatures that floated across waters from Asia to Australia.

The research helps explain how Australia has become home to about 11 per cent of the world’s 6,300 reptile species — the highest proportion of any country around the world.

“Around 30 million years ago it appears that the world changed, and subsequently there was an influx of lizard and snakes into Australia,” said Dr Oliver from the ANU Research School of Biology.

“We think this is linked to how Australia’s rapid movement north, by continental movement standards, has changed ocean currents and global climates.”

The researchers conducted the study using animal tree-of-life data combined with empirical evidence and simulations.

The origins for reptiles contrast with other famous Australian animal groups including marsupials and birds, which include many more species descended from ancestors that lived on Gondwana, a super continent that included Australia, Antarctica, South America, Africa and Madagascar.

Dr Oliver said that the study found that the immigration of reptiles into Australia was clustered in time.

“The influx of lizards and snakes into Australia corresponds with a time when fossil evidence suggests animal and plant communities underwent major changes across the world,” he said.

“The movement of Australia may have been a key driver of these global changes.”

The research is published in the Nature Ecology and Evolution.

Reference:
Paul M. Oliver, Andrew F. Hugall. Phylogenetic evidence for mid-Cenozoic turnover of a diverse continental biota. Nature Ecology & Evolution, 2017; DOI: 10.1038/s41559-017-0355-8

Note: The above post is reprinted from materials provided by Australian National University.

Man’s earliest ancestors discovered in southern England

These are fossil teeth under electron microscope.
These are fossil teeth under electron microscope. Credit: University of Portsmouth

Fossils of the oldest mammals related to humankind have been discovered on the Jurassic Coast of Dorset.

The two teeth are from small, rat-like creatures that lived 145 million years ago in the shadow of the dinosaurs. They are the earliest undisputed fossils of mammals belonging to the line that led to human beings.

They are also the ancestors to most mammals alive today, including creatures as diverse as the Blue Whale and the Pigmy Shrew. The findings are published in the Journal, Acta Palaeontologica Polonica, in a paper by Dr Steve Sweetman, Research Fellow at the University of Portsmouth, and co-authors from the same university. Dr Sweetman, whose primary research interest concerns all the small vertebrates that lived with the dinosaurs, identified the teeth but it was University of Portsmouth undergraduate student, Grant Smith who made the discovery.

Dr Sweetman said: “Grant was sifting through small samples of earliest Cretaceous rocks collected on the coast of Dorset as part of his undergraduate dissertation project in the hope of finding some interesting remains. Quite unexpectedly he found not one but two quite remarkable teeth of a type never before seen from rocks of this age. I was asked to look at them and give an opinion and even at first glance my jaw dropped!”

“The teeth are of a type so highly evolved that I realised straight away I was looking at remains of Early Cretaceous mammals that more closely resembled those that lived during the latest Cretaceous — some 60 million years later in geological history. In the world of palaeontology there has been a lot of debate around a specimen found in China, which is approximately 160 million years old. This was originally said to be of the same type as ours but recent studies have ruled this out. That being the case, our 145 million year old teeth are undoubtedly the earliest yet known from the line of mammals that lead to our own species.”

Dr Sweetman believes the mammals were small, furry creatures and most likely nocturnal. One, a possible burrower, probably ate insects and the larger may have eaten plants as well.

He said: “The teeth are of a highly advanced type that can pierce, cut and crush food. They are also very worn which suggests the animals to which they belonged lived to a good age for their species. No mean feat when you’re sharing your habitat with predatory dinosaurs!”

The teeth were recovered from rocks exposed in cliffs near Swanage which has given up thousands of iconic fossils. Grant, now reading for his Master’s degree at The University of Portsmouth, said that he knew he was looking at something mammalian but didn’t realise he had discovered something quite so special. His supervisor, Dave Martill, Professor of Palaeobiology, confirmed that they were mammalian, but suggested Dr Sweetman, a mammal expert should see them.

Professor Martill said: “We looked at them with a microscope but despite over 30 years’ experience these teeth looked very different and we decided we needed to bring in a third pair of eyes and more expertise in the field in the form of our colleague, Dr Sweetman.

“Steve made the connection immediately, but what I’m most pleased about is that a student who is a complete beginner was able to make a remarkable scientific discovery in palaeontology and see his discovery and his name published in a scientific paper. The Jurassic Coast is always unveiling fresh secrets and I’d like to think that similar discoveries will continue to be made right on our doorstep.”

One of the new species has been named Durlstotherium newmani, christened after Charlie Newman, the landlord of the Square and Compass pub in Worth Matravers, close to where the fossils were discovered.

Reference:
Steven Sweetman, Grant Smith, David Martill. Highly derived eutherian mammals from the earliest Cretaceous of southern Britain. Acta Palaeontologica Polonica, 2017; 62 DOI: 10.4202/app.00408.2017

Note: The above post is reprinted from materials provided by University of Portsmouth.

Heat Source Under West Antarctica

Illustration of flowing water under the Antarctic ice sheet
Illustration of flowing water under the Antarctic ice sheet. Blue dots indicate lakes, lines show rivers. Marie Byrd Land is part of the bulging “elbow” leading to the Antarctic Peninsula, left center. Credit: NSF/Zina Deretsky

A new NASA study adds evidence that a geothermal heat source called a mantle plume lies deep below Antarctica’s Marie Byrd Land, explaining some of the melting that creates lakes and rivers under the ice sheet. Although the heat source isn’t a new or increasing threat to the West Antarctic ice sheet, it may help explain why the ice sheet collapsed rapidly in an earlier era of rapid climate change, and why it is so unstable today.

The stability of an ice sheet is closely related to how much water lubricates it from below, allowing glaciers to slide more easily. Understanding the sources and future of the meltwater under West Antarctica is important for estimating the rate at which ice may be lost to the ocean in the future.

Antarctica’s bedrock is laced with rivers and lakes, the largest of which is the size of Lake Erie. Many lakes fill and drain rapidly, forcing the ice surface thousands of feet above them to rise and fall by as much as 20 feet (6 meters). The motion allows scientists to estimate where and how much water must exist at the base.

Some 30 years ago, a scientist at the University of Colorado Denver suggested that heat from a mantle plume under Marie Byrd Land might explain regional volcanic activity and a topographic dome feature. Very recent seismic imaging has supported this concept. When Hélène Seroussi of NASA’s Jet Propulsion Laboratory in Pasadena, California, first heard the idea, however, “I thought it was crazy,” she said. “I didn’t see how we could have that amount of heat and still have ice on top of it.”

With few direct measurements existing from under the ice, Seroussi and Erik Ivins of JPL concluded the best way to study the mantle plume idea was by numerical modeling. They used the Ice Sheet System Model (ISSM), a numerical depiction of the physics of ice sheets developed by scientists at JPL and the University of California, Irvine. Seroussi enhanced the ISSM to capture natural sources of heating and heat transport from freezing, melting and liquid water; friction; and other processes.

To assure the model was realistic, the scientists drew on observations of changes in the altitude of the ice sheet surface made by NASA’s IceSat satellite and airborne Operation IceBridge campaign. “These place a powerful constraint on allowable melt rates — the very thing we wanted to predict,” Ivins said. Since the location and size of the possible mantle plume were unknown, they tested a full range of what was physically possible for multiple parameters, producing dozens of different simulations.

They found that the flux of energy from the mantle plume must be no more than 150 milliwatts per square meter. For comparison, in U.S. regions with no volcanic activity, the heat flux from Earth’s mantle is 40 to 60 milliwatts. Under Yellowstone National Park — a well-known geothermal hot spot — the heat from below is about 200 milliwatts per square meter averaged over the entire park, though individual geothermal features such as geysers are much hotter.

Seroussi and Ivins’ simulations using a heat flow higher than 150 milliwatts per square meter showed too much melting to be compatible with the space-based data, except in one location: an area inland of the Ross Sea known for intense flows of water. This region required a heat flow of at least 150-180 milliwatts per square meter to agree with the observations. However, seismic imaging has shown that mantle heat in this region may reach the ice sheet through a rift, that is, a fracture in Earth’s crust such as appears in Africa’s Great Rift Valley.

Mantle plumes are thought to be narrow streams of hot rock rising through Earth’s mantle and spreading out like a mushroom cap under the crust. The buoyancy of the material, some of it molten, causes the crust to bulge upward. The theory of mantle plumes was proposed in the 1970s to explain geothermal activity that occurs far from the boundary of a tectonic plate, such as Hawaii and Yellowstone.

The Marie Byrd Land mantle plume formed 50 to 110 million years ago, long before the West Antarctic ice sheet came into existence. At the end of the last ice age around 11,000 years ago, the ice sheet went through a period of rapid, sustained ice loss when changes in global weather patterns and rising sea levels pushed warm water closer to the ice sheet — just as is happening today. Seroussi and Ivins suggest the mantle plume could facilitate this kind of rapid loss.

Reference:
Helene Seroussi, Erik R. Ivins, Douglas A. Wiens, Johannes Bondzio. Influence of a West Antarctic mantle plume on ice sheet basal conditions. Journal of Geophysical Research: Solid Earth, 2017; 122 (9): 7127 DOI: 10.1002/2017JB014423

Note: The above post is reprinted from materials provided by NASA/Jet Propulsion Laboratory. Original written by Carol Rasmussen.

Earthquakes caused by industrial activities, what are the risks and how can they be reduced?

European Seismic Hazard Map
European Seismic Hazard Map. Credit: Giorgios Michas, Author provided

On September 3, 2016, a magnitude 5.8 earthquake struck just northwest of Pawnee, Oklahoma, causing moderate to severe damages in buildings near the epicenter. It was the largest ever recorded in the state.

The Pawnee earthquake followed the dramatic increase of seismic events in the central United States beginning in 2009, associated with the increase of underground wastewater disposal by oil and gas operators. This and other events in the area raised public concerns and led governmental agencies to shut down injection wells and establish new regulations regarding wastewater injections.

While human-caused earthquakes have been documented for more than a century, their increasing number reported worldwide has drawn much scientific, social and political attention. Such earthquakes are related to industrial activities such as mining, construction of water dams, injection of liquids such as waste water and carbon dioxide, and extractions associated with oil and gas exploitation.

With the ever-increasing demand for energy and mineral supplies worldwide, the number of human-caused earthquakes is expected to rise in the upcoming years. Some of the largest and more destructive earthquakes of the past few years have been related to man-made activities, such as the 2008 magnitude 7.9 Wenchuan (China) earthquake and the 2015 magnitude 7.8 Nepal earthquake.

In most of the cases industrial activities do not induce earthquakes. But this becomes problematic when such activities are close to active faults. In this case, even small stresses underground caused by man-made activities can destabilise faults, inducing earthquakes.

Faulty fluid injections

Such stresses, such as fluid injections, are even capable of migrating long distances in the planetary crust, can induce earthquakes days, months or even years after the injection.

The above figure shows that as fluid pressure at the top of the well Basel 1 (purple line) was increasing during injection, the induced seismicity rate also increased (bluish bars). In the bottom figure, the average squared distance of the induced earthquakes from the well is shown, which indicates the complex propagation of seismicity away from the well over time. The largest-earthquakes (magnitude greater than 3, shown with stars) occurred after the injection ended.

Such problems, along with the general lack of knowledge of the exact stress and faulting conditions below ground, make such earthquakes difficult to forecast or manage.

In Europe, where the population density is higher than the United States, public concern over man-made earthquakes is greater. In the well-known case of Basel, Switzerland, which took place in 2006, approximately 11,500 cubic metres of water were injected at high pressure into a 5-km deep well to make the extraction of geothermal energy possible. During the injection phase, more than 10,000 earthquakes were induced, including some strong events that were felt in Basel itself. These raised public concern and anger, leading to the termination of the project and to more than $9 million on damage claims.

Nature’s work

In Southern Europe, which has a higher risk of natural occurring earthquakes, public tolerance on induced earthquakes due to industrial activities is even more limited. The deadly 2012 Emilia (Italy) earthquake sequence became a topic of sustained public debate and political discussion, based on the proximity of the earthquake epicentres to an oil field.

The Italian government established an international committee to investigate, and while no clear link between regional seismicity and oil-extraction was found, one wasn’t excluded either. Other studies concluded that the earthquakes were a natural event.

Another recent case is that of the Castor project, an underground offshore gas-storage facility in the Gulf of Valencia, Spain. The US$2 billion project was terminated by the Spanish government in 2014 following a burst of regional seismicity immediately after the initiation of gas-injection operations, and the public concern that followed.

The above European Seismic Hazard Map displays the most seismically hazardous areas in Europe measured by the peak ground acceleration (PGA) that may be expected during an earthquake, with a 10% probability to be reached or exceeded in 50 years. Green indicates comparatively low hazard values of PGA below 0.1g; yellow to orange show a moderate hazard, between 0.1-to-0.25g; and red identify high-hazard areas with PGA of more than 0.25.

The challenges ahead

The previous cases illustrate some of the coming challenges to be faced with man-made earthquakes. The ability to distinguish between natural and human-induced earthquakes can be difficult or even impossible, especially in seismically active regions, while in other cases the risk associated with industrial activities is significantly underestimated. Such problems pose novel challenges for risk mitigation and economic growth, especially in seismically active regions such as Southern Europe.

The image above illustrates the drilling and extraction operations may take place near or within seismically active regions, increasing the risk of activating faults and/or accelerating the occurrence of earthquakes that would otherwise would occur naturally sometime in the future.

To significantly reduce such hazards, regulations are required that include hazard modelling as well as assessment before and during industrial activity that might perturb regional stress fields. Such regulations were recently issued in North America, including California, Oklahoma, Ohio and Texas, as well as in and Canada. In Europe, the EU has not yet issued any such regulations, but guidelines have been put forth in some countries that have experienced induced earthquakes, including the Netherlands, Switzerland, the UK, Germany, France and Italy.

In addition, communication campaigns that will inform the public on the economic benefits and the risks that such industrial operations may have, should also put forth. Such measures will assure the effective mitigation of the associated risk and the sustainability of the industrial project.

Note: The above post is reprinted from materials provided by The Conversation.The original article was written by Georgios Michas, Postdoctoral Research Associate, Technological Educational Institute of Crete

This article was originally published on The Conversation. Read the original article.

Mammals switched to daytime activity after dinosaur extinction

Dinosaur illustration

Mammals only started being active in the daytime after non-avian dinosaurs were wiped out about 66 million years ago (mya), finds a new study led by UCL and Tel Aviv University’s Steinhardt Museum of Natural History.

A long-standing theory holds that the common ancestor to all mammals was nocturnal, but the new discovery reveals when mammals started living in the daytime for the first time. It also provides insight into which species changed behaviour first.

The study, published today in Nature Ecology & Evolution, analysed data of 2415 species of mammals alive today using computer algorithms to reconstruct the likely activity patterns of their ancient ancestors who lived millions of years ago.

Two different mammalian family trees portraying alternative timelines for the evolution of mammals were used in the analysis. The results from both show that mammals switched to daytime activity shortly after the dinosaurs had disappeared. This change did not happen in an instant — it involved an intermediate stage of mixed day and night activity over millions of years, which coincided with the events that decimated the dinosaurs.

“We were very surprised to find such close correlation between the disappearance of dinosaurs and the beginning of daytime activity in mammals, but we found the same result unanimously using several alternative analyses,” explained lead author, PhD student Roi Maor (Tel Aviv University and UCL).

The team found that the ancestors of simian primates — such as gorillas, gibbons and tamarins — were among the first to give up nocturnal activity altogether. However, the two evolutionary timelines varied, giving a window between 52-33 mya for this to have occurred.

This discovery fits well with the fact that simian primates are the only mammals that have evolved adaptations to seeing well in daylight. The visual acuity and colour perception of simians is comparable to those of diurnal reptiles and birds — groups that never left the daytime niche.

“It’s very difficult to relate behaviour changes in mammals that lived so long ago to ecological conditions at the time, so we can’t say that the dinosaurs dying out caused mammals to start being active in the daytime. However, we see a clear correlation in our findings,” added co-author Professor Kate Jones (UCL Genetics, Evolution & Environment).

“We analysed a lot of data on the behaviour and ancestry of living animals for two reasons — firstly, because the fossil record from that era is very limited and secondly, behaviour as a trait is very hard to infer from fossils,” explained co-author, Professor Tamar Dayan (Chair of The Steinhardt Museum of Natural History, Tel Aviv University).

“You have to observe a living mammal to see if it is active at night or in the day. Fossil evidence from mammals often suggest that they were nocturnal even if they were not. Many subsequent adaptations that allow us to live in daylight are in our soft tissues.”

The team say further research is needed to better populate the mammalian family tree to give more accurate information on when the behaviour of species changes from night time to day time activity.

Reference:
Roi Maor, Tamar Dayan, Henry Ferguson-Gow, Kate E. Jones. Temporal niche expansion in mammals from a nocturnal ancestor after dinosaur extinction. Nature Ecology & Evolution, 2017; DOI: 10.1038/s41559-017-0366-5

Note: The above post is reprinted from materials provided by University College London.

Caribbean islands reveal a ‘lost world’ of ancient mammals

Caribbean animals
The “lost world” of Caribbean animals included ground sloths, enigmatic monkeys, giant rodents, a vampire bat, and shew-like insectivores before the arrival of humans. Credit: Illustration by D. Rini.

Although filled with tropical life today, the Caribbean islands have been a hotspot of mammal extinction since the end of the last glaciation, some 12,000 years ago. Since people also arrived after that time, it has been impossible to determine whether natural changes or human influence are most responsible for these extinctions. A new review by an international team of scientists, including Stony Brook University Professor Liliana M. Dávalos, reports an analysis of the incredibly diverse “lost world” of Caribbean fossils that includes giant rodents, vampire bats, enigmatic monkeys, ground sloths, shrews and dozens of other ancient mammals. The article, published November 6 in the Annual Review of Ecology, Evolution, and Systematics, reveals that the arrival of humans and their subsequent activities throughout the islands was likely the primary cause of the extinction of native mammal species there.

The Caribbean islands were not the only region to lose many mammal species; many large mammals from ground sloths to mastodons also vanished from continental North America. As dramatic and natural changes in the environment and the arrival of people to the continent roughly coincide in time, a scientific debate on what caused the demise of this fauna continues. Because people arrived to the islands long after the end of the glaciation, starting some 6,000 years ago, the Caribbean islands provide an ideal laboratory for discovering the cause of these losses.

In the review, the scientists report analyses of the most comprehensive radiocarbon data set of Caribbean mammals and human arrivals in the Caribbean, representing 57 extinction and extirpation (when a population vanishes from an island) events for native species. While the scattered data by themselves are invaluable, separate data points are hard to interpret, as different methods used at various sites can obscure larger patterns. So, the research team introduced a chronology developed by collecting established fossil dates reported in dozens of already-published and peer reviewed papers in an array of scientific journals.

“By using models to estimate the time of overlap between people and extinct mammals on each island, we were able to show most mammal extinctions happened after the arrival of humans on various islands in the Caribbean, and not before,” explained Dávalos, who led the quantitative analyses of the study. While the overlap between people and the fauna is not proof positive of human causes for the many extinction events in the region, it is an important step to determine why these mammals went extinct. Weaving together data from the many journal articles and archaeological site reports, the team concluded that the timing of extinctions indicates humans may be involved in the extinction of more than 60% of the nearly 150 native mammal species.

Multiple waves of human settlement in the Caribbean occurred over the past six to seven thousand years. The first settlers, Amerindian people from South or Central America known as the Lithic culture, were followed by two other waves — the Archaic and Ceramic, both from South America. The authors showed that after the initial waves of human arrival, mammal extinctions followed, presumably first caused by hunting and later by forest clearing for agriculture, which reduces the habitat for native mammals. A final wave of human migration, this time from across the Atlantic, brought with it cats, rats, goats, mongoose, and other introduced mammals. The ensuing change in habitats, and both competition and predation, resulted in the extinction of about a dozen populations on the smaller islands of the Lesser Antilles. These predators and competitors can affect the populations of Caribbean mammals that survived previous extinction waves.

“While this article is the result of an important collaboration of scientists — with each author bringing their expertise to the table to solve the puzzle mammal extinction — saving the community of mammals of today needs a much wider group of professionals, especially on each island, which is why we are assembling a larger team,” she added.

Dávalos’ team is now working to bring together a larger, interdisciplinary team of colleagues to create an intensive conservation management plan incorporating the expertise of conservation researchers, biologist, ecologists, policy-makers, educators, and land and wildlife management experts to save the last surviving native Caribbean mammals.

“In examining data from both paleontological digs and archeological reports, the evidence highlights the need for urgent human intervention to protect the native mammal species still inhabiting the region, and that is why we are coming together with scientists from all over the Caribbean,” concluded Dávalos.

Reference:
Siobhán B. Cooke, Liliana M. Dávalos, Alexis M. Mychajliw, Samuel T. Turvey, Nathan S. Upham. Anthropogenic Extinction Dominates Holocene Declines of West Indian Mammals. Annual Review of Ecology, Evolution, and Systematics, 2016; 48 (1) DOI: 10.1146/annurev-ecolsys-110316-022754

Note: The above post is reprinted from materials provided by Stony Brook University.

Scientists Find Potential “Missing Link” in Chemistry That Led to Life on Earth

Artist’s conception of comet approaching Earth-like planet. The explosion of a comet near our planet’s surface, it was proposed, might have lofted enough dust and debris into Earth’s atmosphere to temporarily dim the sun. Credit: Shutterstock

Chemists at The Scripps Research Institute (TSRI) have found a compound that may have been a crucial factor in the origins of life on Earth.

Origins-of-life researchers have hypothesized that a chemical reaction called phosphorylation may have been crucial for the assembly of three key ingredients in early life forms: short strands of nucleotides to store genetic information, short chains of amino acids (peptides) to do the main work of cells, and lipids to form encapsulating structures such as cell walls. Yet, no one has ever found a phosphorylating agent that was plausibly present on early Earth and could have produced these three classes of molecules side-by-side under the same realistic conditions.

TSRI chemists have now identified just such a compound: diamidophosphate (DAP).

“We suggest a phosphorylation chemistry that could have given rise, all in the same place, to oligonucleotides, oligopeptides, and the cell-like structures to enclose them,” said study senior author Ramanarayanan Krishnamurthy, associate professor of chemistry at TSRI. “That in turn would have allowed other chemistries that were not possible before, potentially leading to the first simple, cell-based living entities.”

The study, reported in Nature Chemistry, is part of an ongoing effort by scientists around the world to find plausible routes for the epic journey from pre-biological chemistry to cell-based biochemistry.

Other researchers have described chemical reactions that might have enabled the phosphorylation of pre-biological molecules on the early Earth. But these scenarios have involved different phosphorylating agents for different types of molecule, as well as different and often uncommon reaction environments.

“It has been hard to imagine how these very different processes could have combined in the same place to yield the first primitive life forms,” said Krishnamurthy.

He and his team, including co-first authors Clémentine Gibard, Subhendu Bhowmik, and Megha Karki, all postdoctoral research associates at TSRI, showed first that DAP could phosphorylate each of the four nucleoside building blocks of RNA in water or a paste-like state under a wide range of temperatures and other conditions.

With the addition of the catalyst imidazole, a simple organic compound that was itself plausibly present on the early Earth, DAP’s activity also led to the appearance of short, RNA-like chains of these phosphorylated building blocks.

Moreover, DAP with water and imidazole efficiently phosphorylated the lipid building blocks glycerol and fatty acids, leading to the self-assembly of small phospho-lipid capsules called vesicles — primitive versions of cells.

DAP in water at room temperature also phosphorylated the amino acids glycine, aspartic acid and glutamic acid, and then helped link these molecules into short peptide chains (peptides are smaller versions of proteins).

“With DAP and water and these mild conditions, you can get these three important classes of pre-biological molecules to come together and be transformed, creating the opportunity for them to interact together,” Krishnamurthy said.

Krishnamurthy and his colleagues have shown previously that DAP can efficiently phosphorylate a variety of simple sugars and thus help construct phosphorus-containing carbohydrates that would have been involved in early life forms. Their new work suggests that DAP could have had a much more central role in the origins of life.

“It reminds me of the Fairy Godmother in Cinderella, who waves a wand and ‘poof,’ ‘poof,’ ‘poof,’ everything simple is transformed into something more complex and interesting,” Krishnamurthy said.

DAP’s importance in kick-starting life on Earth could be hard to prove several billion years after the fact. Krishnamurthy noted, though, that key aspects of the molecule’s chemistry are still found in modern biology.

“DAP phosphorylates via the same phosphorus-nitrogen bond breakage and under the same conditions as protein kinases, which are ubiquitous in present-day life forms,” he said. “DAP’s phosphorylation chemistry also closely resembles what is seen in the reactions at the heart of every cell’s metabolic cycle.”

Krishnamurthy now plans to follow these leads, and he has also teamed with early-Earth geochemists to try to identify potential sources of DAP, or similarly acting phosphorus-nitrogen compounds, that were on the planet before life arose.

“There may have been minerals on the early Earth that released such phosphorus-nitrogen compounds under the right conditions,” he said. “Astronomers have found evidence for phosphorus-nitrogen compounds in the gas and dust of interstellar space, so it’s certainly plausible that such compounds were present on the early Earth and played a role in the emergence of the complex molecules of life.”

Reference:
Clémentine Gibard, Subhendu Bhowmik, Megha Karki, Eun-Kyong Kim, Ramanarayanan Krishnamurthy. Phosphorylation, oligomerization and self-assembly in water under potential prebiotic conditions. Nature Chemistry, 2017; DOI: 10.1038/nchem.2878

Note: The above post is reprinted from materials provided by Scripps Research Institute.

Magma held in ‘cold storage’ before giant volcano eruption

Long Valley Caldera in California
A new study looks at rock from the titanic eruption that formed Long Valley Caldera in California 765,000 years ago. Calderas occur when a volcano collapses after an eruption. Long Valley has been studied by Wes Hildreth (in background), an author of the new PNAS study, for decades. The study signals that we don’t fully understand these giant eruptions. Credit: U.S. Geological Survey

Long Valley, California, has long defined the “super-eruption.” About 765,000 years ago, a pool of molten rock exploded into the sky. Within one nightmarish week, 760 cubic kilometers of lava and ash spewed out in the kind of volcanic cataclysm we hope never to witness.

The ash likely cooled the planet by shielding the sun, before settling across the western half of North America.

Here’s a rule of geoscience: The past heralds the future. So it’s not just morbid curiosity that attracts geoscientists to places like Long Valley. It’s an ardent desire to understand why super-eruptions happen, ultimately to understand where and when they are likely to occur again.

This week (Nov. 6, 2017), in the Proceedings of the National Academy of Sciences, a report shows that the giant body of magma—molten rock—at Long Valley was much cooler before the eruption than previously thought.

“The older view is that there’s a long period with a big tank of molten rock in the crust,” says first author Nathan Andersen, who recently graduated from the University of Wisconsin-Madison with a Ph.D. in geoscience. “But that idea is falling out of favor.

“A new view is that magma is stored for a long period in a state that is locked, cool, crystalline, and unable to produce an eruption. That dormant system would need a huge infusion of heat to erupt.”

It’s hard to understand how the rock could be heated from an estimated 400 degrees Celsius to the 700 to 850 degrees needed to erupt, but the main cause must be a quick rise of much hotter rock from deep below.

Instead of a long-lasting pool of molten rock, the crystals from solidified rock were incorporated shortly before the eruption, Andersen says. So the molten conditions likely lasted only a few decades, at most a few centuries. “Basically, the picture has evolved from the ‘big tank’ view to the ‘mush’ view, and now we propose that there is an underappreciation of the contribution of the truly cold, solidified rock.”

The new results are rooted in a detailed analysis of argon isotopes in crystals from the Bishop Tuff—the high-volume rock released when the Long Valley Caldera formed. Argon, produced by the radioactive decay of potassium, quickly escapes from hot crystals, so if the magma body that contained these crystals was uniformly hot before eruption, argon would not accumulate, and the dates for all 49 crystals should be the same.

And yet, using a new, high-precision mass spectrometer in the Geochronology Lab at UW-Madison, the research group’s dates spanned a 16,000 year range, indicating the presence of some argon that formed long before the eruption. That points to unexpectedly cool conditions before the giant eruption.

Better tools make better science, Andersen says. “The new instrument is more sensitive than its predecessors, so it can measure a smaller volume of gas with higher precision. When we looked in greater detail at single crystals, it became clear some must have been derived from magma that had completely solidified—transitioned from a mush to a rock.”

“Nathan found that about half of the crystals began to crystallize a few thousand years before the eruption, indicating cooler conditions,” says Brad Singer, a professor of geoscience at UW-Madison and director of the Geochronology Lab. “To get the true eruption age, you need to see the dispersion of dates. The youngest crystals show the date of eruption.”

The results have meaning beyond volcanology, however, as ash from Long Valley and other giant eruptions is commonly used for dating.

“These huge eruptions deposit ash all over the place, and that lets you make correlations in the rock record to aid geologic, biologic and climatic studies across the continent,” says Andersen. “This blanket of ash anchors you in time. The closer we can pin down the eruption age, the better we can study all facets of Earth’s history.”

“It’s controversial, but finding these older crystals means that part of this large magma body was very cool immediately prior to eruption,” says Singer, a volcanologist who was Andersen’s UW advisor. “This flies in the face of a lot of thermodynamics.”

A better understanding of the pre-eruption process could lead to better volcano forecasting—a highly useful but difficult proposition at present.

“This does not point to prediction in any concrete way,” says Singer, “but it does point to the fact that we don’t understand what is going on in these systems, in the period of 10 to 1,000 years that precedes a large eruption.”

Reference:
Nathan L. Andersen el al., “Incremental heating of Bishop Tuff sanidine reveals preeruptive radiogenic Ar and rapid remobilization from cold storage,” PNAS (2017). DOI: 10.1073/pnas.1709581114

Note: The above post is reprinted from materials provided by University of Wisconsin-Madison.

Researchers document transformation of graphite into hexagonal diamond

Graphite & Hexagonal Diamond
Representative image: Graphite & Hexagonal Diamond

A new study by Washington State University researchers answers longstanding questions about the formation of a rare type of diamond during major meteorite strikes.

Hexagonal diamond or lonsdaleite is harder than the type of diamond typically worn on an engagement ring and is thought to be naturally made when large, graphite-bearing meteorites slam into Earth.

Scientists have puzzled over the exact pressure and other conditions needed to make hexagonal diamond since its discovery in an Arizona meteorite fragment half a century ago.

Now, a team of WSU researchers has for the first time observed and recorded the creation of hexagonal diamond in highly oriented pyrolytic graphite under shock compression, revealing crucial details about how it is formed. The discovery could help planetary scientists use the presence of hexagonal diamond at meteorite craters to estimate the severity of impacts.

The research was possible because of an unprecedented experimental development-the WSU-led Dynamic Compression Sector at Argonne National Laboratory’s Advanced Photon Source. The DCS is a first-of-its-kind experimental facility that links different shock wave compression capabilities to synchrotron x-rays. Using its unique capabilities, the WSU team was able to take x-ray snap shots of the transformation of graphite to hexagonal diamond in real-time.

The results of the researchers’ work are published in the journal Science Advances.

“The transformation to hexagonal diamond occurs at a significantly lower stress than previously believed,” said WSU Regents Professor Yogendra Gupta, director of the Institute for Shock Physics and a co-author of the study. “This result has important implications regarding the estimates of thermodynamic conditions at the terrestrial sites of meteor impacts.”

Making diamonds

WSU shock physicist Stefan Turneaure and a team of researchers found that the crystalline structure of a highly oriented form of graphite transforms to the uncommon hexagonal form of diamond at a pressure of 500,000 atmospheres, around four times lower than previous studies had indicated.

To obtain their results, the researchers shot a lithium fluoride impactor at 11,000 mph into a 2 mm thick graphite disk. They then used pulsed synchrotron x-rays to take snapshots every 150 billionths of a second while the shockwave from the impact compressed the graphite sample. Their work clearly showed the graphite sample transformed into the hexagonal form of diamond before being obliterated into dust.

“Most past research relied on microstructural examination of samples after they were shock compressed to infer what might have happened,” Turneaure said. “Such late-time measurements do not tell the whole story of what happened to the material during shock compression.”

Moving forward

Turneaure and Gupta said the next step in the research will be to investigate under what conditions pure hexagonal diamond can be recovered after shock compression.

“Diamond is a material that is very easy to get excited about and our work in this area is just beginning,” Gupta said. “Moving forward, we plan to investigate the persistence of this form of diamond under lower pressure. Because it is thought to be 60 percent harder than the common cubic diamond, hexagonal diamond could have many potential uses in industry if it could be successfully recovered after shock compression.”

Reference:
Transformation of shock-compressed graphite to hexagonal diamond in nanoseconds. DOI: 10.1126/sciadv.aao3561

Note: The above post is reprinted from materials provided by Washington State University.

Related Articles