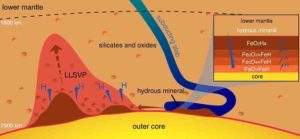
An illustration from the paper showing oxygen and hydrogen cycling in the deep Earth. Credit: Carnegie Institution for Science
Reservoirs of oxygen-rich iron between the Earth’s core and mantle could have played a major role in Earth’s history, including the breakup of supercontinents, drastic changes in Earth’s atmospheric makeup, and the creation of life, according to recent work from an international research team published in National Science Review.
The team—which includes scientists from Carnegie, Stanford University, the Center for High Pressure Science and Technology Advanced Research in China, and the University of Chicago—probed the chemistry of iron and water under the extreme temperatures and pressures of the Earth’s core-mantle boundary.
When the action of plate tectonics draws water-containing minerals down deep enough to meet the Earth’s iron core, the extreme conditions cause the iron to grab oxygen atoms from the water molecules and set the hydrogen atoms free. The hydrogen escapes to the surface, but the oxygen gets trapped into crystalline iron dioxide, which can only exist under such intense pressures and temperatures.
Using theoretical calculations as well as laboratory experiments to recreate the environment of the core-mantle boundary, the team determined that iron dioxide can be created using a laser-heated diamond anvil cell to put materials under between about 950 and 1 million times normal atmospheric pressure and more than 3,500 degrees Fahrenheit.
“Based on our knowledge of the chemical makeup of the slabs that are drawn into the Earth’s deep interior by plate tectonics, we think 300 million tons of water could be carried down to meet iron in the core and generate massive iron dioxide rocks each year,” said lead author Ho-kwang “Dave” Mao.
These extremely oxygen-rich solid rocks may accumulate steadily year-by-year above the core, growing into gigantic, continent-like sizes. A geological event that heated up these iron dioxide rocks could cause a massive eruption, suddenly releasing a great deal of oxygen to the surface.
The authors hypothesize that such an oxygen explosion could put a tremendous amount of the gas into the Earth’s atmosphere—enough to cause the so-called Great Oxygenation Event, which occurred about 2.5 billion years ago and created our oxygen-rich atmosphere, conditions that kickstarted the rise oxygen-dependent life as we know it.
“This newly discovered high-temperature and intense-pressure water-splitting reaction affects geochemistry from the deep interior to the atmosphere” said Mao. “Many previous theories need to be re-examined now.
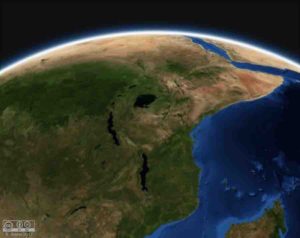
The East African Rift System is currently the largest in the world. Yet, the global rift network 130 and 50 million years ago was more than 5 times longer. Credit: Brune, Nasa WorldWind
The concentration of carbon dioxide (CO2) in the atmosphere determines whether the Earth is in greenhouse or ice age state. Before humans began to have an impact on the amount of CO2 in the air, it depended solely on the interplay of geological and biological processes, the global carbon cycle. A recent study, headed by the GFZ German Research Centre for Geosciences in Potsdam, shows that the break-up of continents — also known as rifting — contributed significantly to higher CO2 concentrations in the atmosphere.
The carbon distribution on Earth is highly unbalanced: In fact only one-hundred-thousandth of the carbon dioxide on our planet is found in the atmosphere, biosphere and the oceans with the remaining 99.999% bound in the deep Earth. However, this enormous carbon store at depth is not isolated from the atmosphere. There is a constant exchange between the underground and the surface over millions of years: Tectonic plates that sink into the deep mantle take large amounts of carbon with them. At the same time it was believed that deep carbon is released due to volcanism at mid-oceanic ridges in the form of CO2.
In the current study, published in Nature Geoscience, the research team comes to a different conclusion. Although volcanic activity at the bottom of the ocean floor causes CO2 to be released, the main CO2 input from depth to the atmosphere, however, occurs in continental rift systems such as the East African Rift or the Eger Rift in Czech Republic. “Rift systems develop by tectonic stretching of the continental crust, which may lead to break-up of entire plates,” explains Sascha Brune from GFZ. “The East African Rift with a total length of 6,000 km is the largest in the world, but it appears small in comparison to the rift systems which were formed 130 million years ago when the supercontinent Pangea broke apart, comprising a network with a total length of more than 40,000 km.”
With the help of plate tectonic models of the past 200 million years and other geological evidence scientists have reconstructed how the global rift network has evolved. They have been able to prove the existence of two major periods of enhanced rifting approx. 130 and 50 million years ago. Using numerical carbon cycle models the authors simulated the effect of increased CO2 degassing from the rifts and showed that both rifting periods correlate with higher CO2 concentrations in the atmosphere at that time.
“The global CO2 degassing rates at rift systems, however, are just a fraction of the anthropogenic carbon release today,” adds Brune. “Yet, they represent a missing key component of the deep carbon cycle that controls long-term climate change over millions of years.”
Reference:
Sascha Brune, Simon E. Williams, R. Dietmar Müller. Potential links between continental rifting, CO2 degassing and climate change through time. Nature Geoscience, 2017; DOI: 10.1038/s41561-017-0003-6
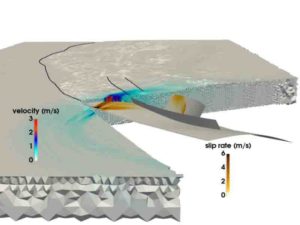
Using LRZ’s SuperMUC supercomputer, a joint research team from the Technical University of Munich and Ludwigs-Maximilians-Uni Munich were able to create the largest multiphysics simulation of an earthquake and tsunami. This image shows rupture propagation and the resulting seismic wave field during 2004 Sumatra-Andaman earthquake. Credit: C. Uphoff, S.Rettenberger, M. Bader, Technical University of Munich. E. Madden, T. Ulrich, S. Wollherr, A. Gabriel, Ludwigs-Maximilians-Universität.
Just before 8:00 a.m. local time on December 26, 2004, people in southeast Asia were starting their days when the third strongest recorded earthquake in history ripped a 1,500-kilometer tear in the ocean floor off the coast of the Indonesian island of Sumatra.
The earthquake lasted between 8 and 10 minutes (one of the longest ever recorded), and lifted the ocean floor several meters, creating a tsunami with 30-meter waves that devastated whole communities. The event caused nearly 200,000 deaths across 15 countries, and released as much energy above and below ground as multiple centuries of US energy usage.
The Sumatra-Andaman Earthquake, as it is called, was as surprising as it was violent. Despite major advancements in earthquake monitoring and warning systems over the last 50 years, earth scientists were unable to predict it because relatively little data exists about such large-scale seismological events. Researchers have a wealth of information related to semi-regular, lower-to-medium-strength earthquakes, but disasters such as the Sumatra-Andaman — events that only happen every couple hundred years — are too rare to create reliable data sets.
In order to more fully understand these events, and hopefully provide better prediction and mitigation methods, a team of researchers from the Ludwig-Maximilians-Universität Munich (LMU) and Technical University of Munich (TUM) is using supercomputing resources at the Leibniz Supercomputing Centre (LRZ) to better understand these rare, extremely dangerous seismic phenomena.
“Our general motivation is to better understand the entire process of why some earthquakes and resulting tsunamis are so much bigger than others,” said TUM Professor Dr. Michael Bader. “Sometimes we see relatively small tsunamis when earthquakes are large, or surprisingly large tsunamis connected with relatively small earthquakes. Simulation is one of the tools to get insight into these events.”
The team strives for “coupled” simulations of both earthquakes and subsequent tsunamis. It recently completed its largest earthquake simulation yet. Using the SuperMUC supercomputer at LRZ, the team was able to simulate 1,500 kilometers of non-linear fracture mechanics — the earthquake source — coupled to seismic waves traveling up to India and Thailand over a little more than 8 minutes of the Sumatra-Andaman earthquake. Through several in-house computational innovations, the team achieved a 13-fold improvement in time to solution. In recognition of this achievement, the project was nominated for the best paper award at SC17, one of the world’s premier supercomputing conferences, held this year on November 12-17 in Denver, Colorado.
Megathrust earthquakes, massive scale simulations
Earthquakes happen as rock below Earth’s surface breaks suddenly, often as a result of the slow movement of tectonic plates.
One rough predictor of an ocean-based earthquake’s ability to unleash a large tsunami is whether plates are grinding against one another or colliding head-on. If two or more plates collide, one plate will often force the other below it. Regions where this process occurs are called subduction zones and can host very large, shallowly dipping faults — so called “megathrusts.” Energy release across such huge zones of weakness tends to create violent tsunamis, as the ocean floor rises a significant amount, temporarily displacing large amounts of water.
Until recently, though, researchers doing computational geophysics had great difficulties simulating subduction earthquakes at the necessary level of detail and accuracy. Large-scale earthquake simulations are difficult generally, but subduction events are even more complex.
“Modeling earthquakes is a multiscale problem in both space and time,” said Dr. Alice Gabriel, the lead researcher from the LMU side of the team. “Reality is complex, meaning that incorporating the observed complexity of earthquake sources invariably involves the use of numerical methods, highly efficient simulation software, and, of course, high-performance computing (HPC). Only by exploiting HPC can we create models that can both resolve the dynamic stress release and ruptures happening with an earthquake while also simulating seafloor displacement over thousands of kilometers.”
When researchers simulate an earthquake, they use a computational grid to divide the simulation into many small pieces. They then compute specific equations for various aspects of the simulation, such as generated seismic shaking or ocean floor displacement, among others, over “time steps,” or simulation snapshots over time that help put it in motion, much like a flip book.
The finer the grid, the more accurate the simulation, but the more computationally demanding it becomes. In addition, the more complex the geometry of the earthquake, the more complex the grid becomes, further complicating the computation. To simulate subduction earthquakes, computational scientists have to create a large grid that can also accurately represent the very shallow angles at which the two continental plates meet. This requires the grid cells around the subduction area to be extra small, and often slim in shape.
Unlike continental earthquakes, which have been better documented through computation and observation, subduction events often happen deep in the ocean, meaning that it is much more difficult to constrain a simulation by ground shaking observations and detailed, reliable data from direct observation and laboratory experiments.
Furthermore, computing a coupled, large-scale earthquake-tsunami simulation requires using data from a wide variety of sources. Researchers must take into account the seafloor shape, the shape and strength of the plate boundary ruptured by the earthquake and the material behaviour of Earth’s crust at each level, among other aspects. The team has spent the last several years developing methods to more efficiently integrate these disparate data sources into a consistent model.
To reduce the enormous computing time, the team exploited a method called “local time stepping.” In areas where the simulations require much more spatial detail, researchers also must “slow down” the simulation by performing more time steps in these areas. Other sections that require less detail may execute much bigger — and thus — far fewer time steps.
If the team had to run its entire simulation at a uniform small time step, it would have required roughly 3 million individual iterations. However, only few cells of the computational grid required this time step size. Major parts could be computed with much larger time steps, some requiring only 3000 time steps. This reduced the computational demand significantly and led to much of the team’s 13-fold speedup. This advancement also led to the team’s simulation being the largest, longest first-principles simulation of an earthquake of this type.
Forward motion
Due to its close collaboration with LRZ staff, the team had opportunities to use the entire SuperMUC machine for its simulations. Bader indicated that these extremely large-scale runs are invaluable for the team to gain deeper insights in its research. “There is a big difference if you run on a quarter of a machine or a full machine, as that last factor of 4 often reveals the critical bottlenecks,” he said.
The team’s ability to take full advantage of current-generation supercomputing resources has it excited about the future. It’s not necessarily important that next-generation machines offer the opportunity for the LMU-TUM researchers to run “larger” simulations — current simulations can effectively simulate a large enough geographic area. Rather, the team is excited about the opportunity to modify the input data and run many more iterations during a set amount of computing time.
“We have been doing one individual simulation, trying to accurately guess the starting configuration, such as the initial stresses and forces, but all of these are still uncertain,” Bader said. “So we would like to run our simulation with many different settings to see how slight changes in the fault system or other factors would impact the study. These would be larger parameter studies, which is another layer of performance that a computer would need to provide.”
Gabriel also mentioned that next-generation machines will hopefully be able to simulate urgent, real-time scenarios that can help predict hazards as they relate to likely aftershock regions. The team is excited to see the next-generation architectures at LRZ and the other Gauss Centre for Supercomputing centres, the High-Performance Computing Center Stuttgart and the Jülich Supercomputing Centre.
In Bader’s view, the team’s recent work not only represents its largest-scale simulation to date, but also the increasingly strong collaboration between the domain scientists and computational scientists in the group. “This paper has a strong seismology component and a strong HPC component,” he said. “This is really a 50-50 paper for us. Our collaboration has been going nicely, and it is because it isn’t about getting ours or theirs. Both groups profit, and this is really nice joint work.”
This work was carried out using Gauss Centre for Supercomputing resources based at the Leibniz Supercomputing Centre.
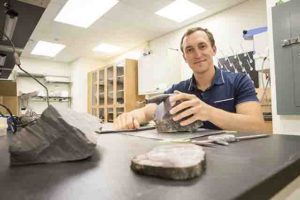
Erik Gulbranson, paleoecologist and visiting assistant professor at UWM, studies some of the fossilized trees he brought back from Antarctica. Gulbranson is returning there for further research this year. Credit: UWM Photo/Troye Fox
During Antarctica’s summer, from late November through January, UW-Milwaukee geologists Erik Gulbranson and John Isbell climbed the McIntyre Promontory’s frozen slopes in the Transantarctic Mountains. High above the ice fields, they combed the mountain’s gray rocks for fossils from the continent’s green, forested past.
By the trip’s end, the geologists had found fossil fragments of 13 trees. The discovered fossils reveal that the trees are over 260 million years old, meaning that this forest grew at the end of the Permian Period, before the first dinosaurs.
“People have known about the fossils in Antarctica since the 1910-12 Robert Falcon Scott expedition,” said Gulbranson, a paleoecologist and visiting assistant professor in UWM’s Department of Geosciences. “However, most of Antarctica is still unexplored. Sometimes, you might be the first person to ever climb a particular mountain.”
The time frame is exactly what they are looking for. The Permian Period ended 251 million years ago in history’s greatest mass extinction, as the Earth rapidly shifted from icehouse to greenhouse conditions. More than 90 percent of species on Earth disappeared, including the polar forests. Because the Antarctic forests grew at polar latitudes where plants can’t grow today, Gulbranson believes that the trees were an extremely hearty species and is trying to determine why they went extinct.
Many scientists now believe that a massive increase in atmospheric greenhouse gases, such as carbon dioxide and methane, caused the Permian-Triassic extinction. It’s likely that over the course of 200,000 years — a short time, geologically speaking — volcanic eruptions in Siberia released many tons of greenhouse gases into the atmosphere.
Isbell, a distinguished professor of geosciences at UWM, has previously studied Antarctica’s Permian glacial deposits to determine how the climate changed. On this expedition, he used the rocks around the fossilized trees to determine how the fossils fit into Antarctica’s geologic history.
“This forest is a glimpse of life before the extinction, which can help us understand what caused the event,” Gulbranson said. It can also give clues to how plants were different than today.
At the Permian Period’s end, Antarctica was warmer and more humid than it is today. The world’s continents, as we know them, were packed together in two giant landmasses — one in the north and one in the south. Antarctica was part of Gondwana, the supercontinent spanning the Southern Hemisphere that also included present-day South America, Africa, India, Australia and the Arabian Peninsula.
There would have been a mixture of mosses, ferns and an extinct plant called Glossopteris, and it’s likely that this forest stretched across the entirety of Gondwana.
Gulbranson said that the fossil forests looked different than forests today. During the Permian Period, forests were a potentially low diversity assemblage of different plant types with specific functions that affected how the entire forest responded to environmental change. This is contrast to modern high-latitude forests that display greater plant diversity.
“This plant group must have been capable of surviving and thriving in a variety of environments,” Gulbranson said. “It’s extremely rare, even today, for a group to appear across nearly an entire hemisphere of the globe.”
But not even these robust forests survived the high carbon dioxide concentrations of the mass extinction.
The resilient plants also must have survived through the polar extremes of perpetual light and total darkness. Even in a warmer past, the polar regions would have experienced months of darkness in winter and would have gone without sunset during the summer months.
By studying the preserved tree rings, Gulbranson and colleagues have found that these trees transitioned from summer activity to winter dormancy rapidly, perhaps within a month. Modern plants make the same transition over the course of several months and also conserve water by making food during the day and resting at night. Scientists don’t yet know how months of perpetual light would have affected the plants’ day-and-night cycles.
“There isn’t anything like that today,” Gulbranson said. “These trees could turn their growing cycles on and off like a light switch. We know the winter shutoff happened right away, but we don’t know how active they were during the summertime and if they could force themselves into dormancy while it was still light out.”
He’ll return to the site later this month and stay through January 2018. He hopes to learn more about the extinction event. He previously wasn’t able to study the extinction period because of weather constraints and aircraft troubles.
Gulbranson is going to look for deposits from the mass extinction to see if he can determine exactly how the forests responded as carbon dioxide rose.
“The geologic record shows us the beginning, middle and end of climate change events,” Gulbranson said. “With further study, we can better understand how greenhouse gases and climate change affect life on Earth.”
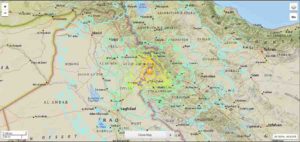
At least 210 people were killed in Iran and Iraq on Sunday when a powerful magnitude 7.3 earthquake hit the region, state media in the two countries said, as rescuers searched for dozens trapped under rubble.
Officials expected the casualty toll to rise when search and rescue teams reached remote areas of Iran.
A quake registering a magnitude between 7 and 7.9 can inflict widespread and heavy damage. Moreover, many houses in rural areas of Iran are made of mud bricks that can crumble easily in a quake.
The earthquake was felt in several provinces of Iran but the hardest hit province was Kermanshah, which announced three days of mourning.
Tectonic Summary
The November 12, 2017 M 7.3 earthquake near the Iran-Iraq border in northwest Iran (220 km northeast of Baghdad, Iraq) occurred as the result of oblique-thrust faulting at mid-crustal depth (~25 km). Preliminary focal mechanism solutions for the event indicate rupture occurred on a fault dipping shallowly to the east-northeast, or on a fault dipping steeply to the southwest. At the location of this earthquake, the Arabia plate is moving towards the north with respect to Eurasia at a rate of about 26 mm/yr. The two plates converge along a northwest-striking plate boundary in the general vicinity of this earthquake, driving the uplift of the Zagros mountains in Iran. The location of the event and the shallow, northeast-dipping plane of the focal mechanism solution are consistent with rupture of a plate boundary related structure in this region.
While commonly plotted as points on maps, earthquakes of this size are more appropriately described as slip over a larger fault area. Oblique-thrust-faulting events of the size of the November 12th, 2017 earthquake are typically about 65×25 km (length x width).
Over the preceding century, the region within 250 km of the hypocenter of the November 12, 2017 earthquake has experienced 4 other M6+ earthquakes. The most recent of these was a M 6.1 earthquake about 100 km to the south of the November 2017 event in January 1967. In the late 1950s and early 1960s, a cluster of M 6.0-6.7 earthquakes occurred along the plate boundary about 200 km to the southeast of today’s earthquake. In November 2013, a pair of M 5.6 and M 5.8 earthquakes occurred about 60 km south of the November 2017 event. They are not known to have caused significant damage or fatalities. A M 7.4 earthquake in June 1990, 400 km to the northeast of the November 12, 2017 event, caused between 40,000-50,000 fatalities, more than 60,000 injuries, and left more than 600,000 homeless in the in the Rasht-Qazvin-Zanjan area of Iran.
Note: The above post is reprinted from materials provided by USGS.
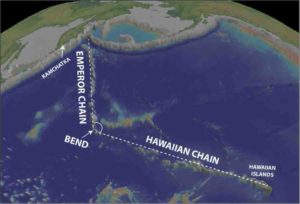
Seafloor topography (bathymetry) of the Pacific showing the volcanos and submerged seamounts of the Hawaiian and Emperor Chains together with the 50 million-year-old bend between them. Credit: Google Earth
Hawaii sits at the end of a chain of volcanoes running across the Pacific Ocean floor, but in the middle of this chain lies a bend of 60 degrees. For many decades geoscientists have struggled to explain exactly how and why this feature occurred around 50 Million years ago. A new study in Science Advances led by postdoctoral researcher Mathew Domeier along with colleagues from the Centre for Earth Evolution and Dynamics (CEED), University of Oslo, sheds light on this long-standing geological controversy – A massive collision at the edge of the Pacific Ocean was the culprit.
Mantle plumes and volcanic chains
There is more than meets the eye with the Hawaiian Islands of the Pacific Ocean. The islands presently sit above a so-called mantle plume, or a conduit of anomalously hot rock upwelling from thousands of kilometers deep in the Earth’s interior. This hot feature explains why the islands are dotted with active volcanoes. But the Hawaiian Islands also reside on the Pacific tectonic plate, which is moving across the top of the mantle plume—at the blistering pace of a few cm/year—which means that in a few million years the islands will have moved off the hot conduit and volcanism in the Hawaiian Islands will cease.
As Hawaii’s active volcanoes die in the future, new volcanic islands will appear elsewhere on the Pacific Plate, specifically at spots that replace the Hawaiian Islands above the hot conduit. This process is much like what would happen if you moved a sheet of paper over a stationary candle: the movement of the paper will be recorded as a trail of burn marks from the heat of the candle beneath. Hawaii is presently over the “candle,” but in the future it will have moved away from it and the candle will begin singing a new spot on the paper.
This process has happened over and over again in Earth’s long history, and Hawaii is just the latest volcanic chapter in a story that extends backward at least 80 million years. The Hawaiian Islands lie at the end of a chain of now-extinct volcanoes and seamounts (submerged volcanoes) that stretch ~6,000 km northwest across the floor of the Pacific Plate, to the junction between the western Aleutian Islands and the Peninsula of Kamchatka. Returning to our paper and candle analogy—this chain is the same as the path of singed marks leading backwards from the present location of the candle beneath the paper. In the Pacific, the volcanoes and seamounts that constitute this chain grow progressively older to the northwest, as would be expected if the chain marked the slow and progressive drift of the Pacific Plate above a mantle plume.
But something curious catches the eye about this submerged volcanic chain in the Pacific: it isn’t straight. A very conspicuous kink divides the chain into two segments: a mostly west-trending segment (the “Hawaiian Chain’) and a mostly north-trending segment (the “Emperor Chain’); the kink between is thus commonly referred to as the “Hawaiian-Emperor Bend.” Volcanic rocks sampled from seamounts on either side of the bend have been dated, and indicate that the bend developed approximately 47 million years ago.
So what caused it? This very question has been the source of debate and controversy among researchers for half a century. The classical explanation is that the bend marked a swift and substantial change in the direction of motion of the Pacific Plate about 50 million years ago, but supporters of this interpretation have struggled to explain why that sudden change occurred.
The research team from University of Oslo carefully collected together a variety of evidence that suggests that the Pacific Plate changed its course about 50 million years ago because an archipelago that previously formed the northern end of the Pacific Plate crashed into eastern Asia at that time.
The archipelago comprised what is known as an island arc: an elongate chain of volcanoes and volcanic rocks formed above a subduction zone (a zone where the seafloor of an oceanic tectonic plate is pushed under another tectonic plate and sinks into the mantle below). The team was able to work out the fiery history of the island arc and its relation to the Hawaiian-Emperor Bend from three key sources of data:
Exotic rocks: The pieces of that island arc, which are now found on the peninsula of Kamchatka and in the Japanese Islands, are geologically exotic, meaning that they do not have the same characteristics of other rocks from the same region and were clearly transported from somewhere else—and they specifically reveal that they formed far away from any large continents (like Asia).
Magnetic rocks: Magnetic information preserved in the island arc rocks (acquired from the Earth’s magnetic field when the rocks originally formed) can be used to determine the latitude at which they originated—and the magnetic information from the island arc rocks reveals that they came from further south than where they are located today (this also corroborates their exotic nature).
Deep rocks: Island arcs only develop along a subduction zone, so the formation of the island arc should have been accompanied by subduction, and subduction, in turn, is associated with the sinking of oceanic tectonic plates into Earth’s interior. The relics of subducted oceanic plates can be “imaged” by seismic waves generated by earthquakes, in much the same way that your bones can be imaged with X-rays during a CT scan. By such seismic imaging techniques we have identified the relics of a subduction system that was formerly located at the northern end of the Pacific Plate, at the same place that the island arc rocks were located according to their magnetic data.
A crash caused the bend
Together, the geologic, magnetic and seismic clues from the North Pacific indicate that subduction and island arc construction began 80 million years ago at the northern end of the Pacific Plate. Immediately after subduction started, the subduction zone began moving north, pulling the island arc and the Pacific Plate north with it. This northward migration continued from 80 to 50 million years, at which time the Emperor Chain was formed by the northern drift of the Pacific over the mantle plume.
By about 50 million years ago, the northern migration of subduction led to a colossal collision between the island arc at the northern end of the Pacific Plate and the northeast edge of Asia. This massive crash left large segments of the former island arc stranded in northeast Japan and on the peninsula of Kamchatka, and terminated subduction there.
The crash and the cessation of subduction effectively halted the northward course of the Pacific Plate at that time, and it was this event that was responsible for suddenly re-routing the direction of the Pacific Plate 50 million years ago. So in the end, it was a continental-scale fender-bender that gave the Pacific its spectacular bend, according to the new study published in Science Advances.
Reference:
Mathew Domeier et al. Intraoceanic subduction spanned the Pacific in the Late Cretaceous–Paleocene, Science Advances (2017). DOI: 10.1126/sciadv.aao2303
Note: The above post is reprinted from materials provided by CEED.
An asteroid, also known as the Chicxulub Impactor, hit Earth some 66 million years ago, causing a crater 180 km wide. The impact of the asteroid heated organic matter in rocks and ejected it into the atmosphere, forming soot in the stratosphere.
Soot is a strong, light-absorbing aerosol that caused global climate changes that triggered the mass extinction of dinosaurs, ammonites, and other animals, and led to the macroevolution of mammals and the appearance of humans.
Based on results of a new study, the researchers say that the probability of the mass-extinction occurring was only 13 percent. This is because the catastrophic chain of events could only have occurred if the asteroid had hit the hydrocarbon-rich areas occupying approximately 13 percent of Earth’s surface.
Led by Tohoku University Professor Kunio Kaiho, the researchers came by their hypothesis by calculating the amount of soot in the stratosphere and estimating climate changes caused by soot using a global climate model developed at the Meteorological Research Institute. The results are significant because they explain the pattern of extinction and survival.
During the study, Kaiho thought that the amount of soot and temperature anomaly might have been affected by the amount of sedimentary organic-matter. So, he analyzed the amount of sedimentary organic-matter in Earth to obtain readings of temperature anomaly caused by soot in the stratosphere.
Naga Oshima of the Meteorological Research Institute conducted the global climate model calculations to obtain temperature anomalies caused by various amounts of soot injected into the stratosphere.
Kaiho clarified the relationship between the findings and concluded that the significant cooling and mass-extinction event could have only have occurred if the asteroid had hit hydrocarbon-rich areas occupying approximately 13 percent of Earth’s surface.
If the asteroid had hit a low-medium hydrocarbon area on Earth (occupying approximately 87 percent of Earth’s surface), mass extinction could not have occurred and the Mesozoic biota could have persisted beyond the Cretaceous/Paleogene boundary.
The site of the asteroid impact, therefore, changed the history of life on Earth.
According to the study, soot from hydrocarbon-rich areas caused global cooling of 8-11°C and cooling on land of 13-17°C. It also caused a decrease in precipitation by approximately 70-85 percent on land and a decrease of approximately 5-7°C in seawater temperature at a 50-m water depth, leading to mass extinction of life forms including dinosaurs and ammonites.
At the time, these hydrocarbon-rich areas were marine coastal margins, where the productivity of marine algae was generally high and sedimentary rocks were thickly deposited. Therefore, these areas contained a high amount of organic matter, part of which became soot from the heat of the asteroid’s impact.
Thus, the researchers concluded that the Chicxulub impact occurred in a hydrocarbon-rich area and is a rare case of mass extinction being caused at such an impact site.
Kaiho and Oshima are doing further studies to clarify the frequency of all the cooling events by impacts. Kaiho’s team is analyzing climate change caused by large volcanic eruptions that may have contributed to other mass extinctions. It is hoped that the results will lead to further understanding of the processes behind those mass extinctions.
Reference:
Kunio Kaiho, Naga Oshima. Site of asteroid impact changed the history of life on Earth: the low probability of mass extinction. Scientific Reports, November 2017 DOI: 10.1038/s41598-017-141990-x
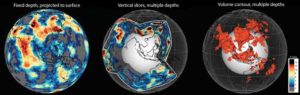
The maps are showing different viewing options for the region under Southeast Asia. Credit: Illustration Grace E. Shephard
We think of oceans as being stable and permanent. However, they move at about the same speed as your fingernails grow. Geoscientists at CEED, University of Oslo have found a novel way of mapping the Earth’s ancient oceans.
The surface of the Earth is in constant motion. New crust is formed at mid-oceanic ridges, such as the Mid-Atlantic Ridge, and older crust is destroyed.
If we go millions of years back in time, the oceans and the continents of planet Earth were very different. Oceans that once existed are now buried deep inside the interior of the Earth, in the mantle.
Seismic tomography uses earthquakes to image Earth’s interior down to approximately 2,800 km. Models based on this technique are used to show how the surface of our planet may have looked like up to 200 million years ago.
Simple and powerful
Grace Shephard at the Centre for Earth Evolution and Dynamics (CEED), University of Oslo has found a simple, yet powerful way to combine images from alternative seismic tomography models. In a new study published in Nature, Shephard and colleagues Mathew Domeier (CEED), Kara Matthews, and Kasra Hosseini (both University of Oxford) reveal a new way of displaying models of the evolution of the Earth’s interior.
“There are many different ways of creating such models, and lots of different data input can be used,” explains Grace Shephard, who has been a postdoctoral researcher at CEED since she took her Ph.D. at the University of Sydney four years ago.
“We wanted a quick and simple way to see which features are common across all of the models. By comparing up to 14 different models, for instance, we can visualize where they agree and thus identify what we call the most robust anomalies. This gives more accurate and more easily available information about the movements of ocean basins and contents back in time — and the interaction between the Earth’s crust and the mantle.”
Reconstructing continents and oceans
The tomography models are used to reconstruct movements of continents and oceans. The novel and open way of displaying the models takes away some of the decision making for scientists studying the dynamics of the Earth.
“With this tool, geoscientists can choose which models to use, how deep into the mantle to go, and a few other parameters,” explains Shephard. — Thus, they can zoom into their area of interest. However, we must remember that the maps are only as good as the tomography models they are built upon.
Grace Shephard and colleagues have also studied if there are more agreement between the various tomography models at certain depths of the mantle. They have made discoveries that suggest more paleoseafloor can be found at around 1,000 — 1,400 km beneath the surface than at other depths.
An inner “traffic jam”?
“If these depths are translated to time — and we presuppose that the seafloor sinks into the mantle at a rate of 1 centimeter per year — it could mean that there was a period around 100-140 million years ago that experienced more ocean destruction. However, it could also identify a controversial region in the Earth that is more viscous, or ‘sticky,’ and causes sinking features to pile up, a bit like a traffic jam. These findings, and the reasons behind, bear critical information about the surface and interior evolution of our planet,” explains Shephard.
To understand the evolution of the Earth, it is essential to study the subduction zones. The tectonic plates of the oceans are being subducted under the continental plates, or under other oceanic plates. Examples include the Pacific Ocean moving under Japan, and subductions within the Mediterranean region. Plate reconstruction models generally agree that about 130 million years ago, there was a peak in the amount of subduction happening. So the maps by Shephard and colleagues could provide independent evidence for this event.
Reversing the evolution Grace Shephard shows us computer animations reversing these evolutionary processes. She brings back to the surface oceans that have been buried deep inside the mantle for millions of years. It may look like a game, but it illustrates an important point:
“Studying these processes in new ways opens up new questions. That is something we welcome, because we need to find out what questions to ask and what to focus on in order to understand the development of the Earth. We always have to keep in mind what is an observations and what is a model. The models need to be tested against observations, to make way for new and improved models. It is an iterative procedure.”
Why are the models of the Earth’s interior important?
“It is a fundamental way of understanding more about our planet, the configuration of continents and oceans, climate change, mountain building, the location of precious resources, biology, etc. Lines of evidence in the past can be crucial for insight into what will happen in the future, and is critical for the interaction of society and the natural environment.”
Earth 1 million years from now
“If you look at Earth from space, the distribution of continents and oceans will then look much the same, even though life, the climate and sea level may have dramatically changed. If we move even further ahead, say 10 or 100 million years, it is very hard to say how oceans may be opening and closing, but we have some clues. Some people think that the Atlantic will close, and others think the Arctic or Indian oceans will close. We can follow the rules of the past when we look to the future, but this task keeps geoscientists very busy.
The fossils provide further evidence that early anthropoids were minuscule creatures. Credit: Northern Illinois University
At Northern Illinois University, Dan Gebo opens a cabinet and pulls out a drawer full of thin plastic cases filled with clear gelatin capsules. Inside each numbered capsule is a tiny fossil — some are so small they rival the diminutive size of a mustard seed.
It’s hard to imagine that anyone would be able to recognize these flecks as fossils, much less link them to an ancient world that was very different from our own, yet has quite a bit to do with us — or the evolution of us.
The nearly 500 finger and toe bones belonged to tiny early primates — some half the size of a mouse. During the mid-Eocene period, about 45 million years ago, they lived in tree canopies and fed on fruit and insects in a tropical rainforest in what is now China.
The fossilized phalanges are described in detail in a new study by Gebo and colleagues, published online this fall ahead of print in the Journal of Human Evolution.
Representing nine different taxonomic families of primates and as many as 25 species, the specimens include numerous fossils attributed to Eosimias, the very first anthropoid known to date, and three fossils attributed to a new and much more advanced anthropoid. The anthropoid lineage would later include monkeys, apes and humans.
“The fossils are extraordinarily small, but in terms of quantity this is the largest single assemblage of fossil primate finger and toe specimens ever recorded,” said Gebo, an NIU professor of anthropology and biology who specializes in the study of primate anatomy.
All of the finger and toe fossils imply tree-dwelling primates with grasping digits in both hands and feet. Many of the smaller fossils are between 1 and 2 millimeters in length, and the animals would have ranged in full body size from 10 to 1,000 grams (0.35 to 35.3 ounces).
“The new study provides further evidence that early anthropoids were minuscule creatures, the size of a mouse or smaller,” Gebo said. “It also adds to the evidence pointing toward Asia as the initial continent for primate evolution. While apes and fossil humans do come from Africa, their ancestors came from Asia.”
The newly described fossils were originally recovered from a commercial quarry near the village of Shanghuang in the southern Jiangsu Province of China, about 100 miles west of Shanghai. In recent decades, Shanghuang has become well-known among paleontologists.
“Shanghuang is truly an amazingly diverse fossil primate locality, unequaled across the Eocene,” Gebo said. “Because no existing primate communities show this type of body-size distribution, the Shanghuang primate fauna emphasizes that past ecosystems were often radically different from those we are familiar with today.”
Co-author Christopher Beard, a paleontologist at the University of Kansas in Lawrence who has been working on Shanghuang fossils for 25 years, said the limestone in the quarry is of Triassic age — from the very beginning of the Age of Dinosaurs some 220 million years ago. Owing to a subsequent phase of erosion, the limestone developed large fissures containing fossil-rich sediments dating to the middle Eocene, after dinosaurs went extinct.
In the early 1990s, more than 10 tons of fossil-bearing matrix were collected from the fissures and shipped to the Institute of Vertebrate Paleontology and Paleoanthropology in Beijing and the Carnegie Museum of Natural History in Pittsburgh. There, the matrix was washed and screened, yielding fossil bones and teeth from ancient mammals, many of which remain to be identified.
“Because of commercial exploitation of the quarry site, the fossil-bearing fissure-fillings at Shanghuang are now exhausted,” Beard said. “So, the fossils that we currently have are all that will ever be found from this site.”
Gebo was initially recruited during the late 1990s to spearhead research on primate limb and ankle bones from Shanghuang. That led to two publications in 2000, when he and colleagues first announced the discovery of 45 million-year-old, thumb-length primates, the smallest ever recovered, from this same site. The work identifying body parts also helped cement the status of Eosimias, first identified by Beard on the basis of jaw fragments discovered at the site, as an extremely primitive anthropoid lying at the very beginning of our lineage’s evolutionary past.
In more recent years, Gebo found additional specimens, sifting through miscellaneous elements from Shanghuang both at the Carnegie Museum and the University of Kansas. He brought the delicate and minuscule finger and toe fossils to NIU for study using traditional and electron-scanning microscopes.
The fossils that endured the millennia may be small but still have a story to tell. “We can actually identify different types of primates from the shapes of their fingers and toes,” Gebo said.
Primates are mammals, characterized by having bigger brains, grasping hands and feet, nails instead of claws and eyes located in the front of the skull. Living prosimians, or living lower primates, include lemurs and tarsiers, and have broader fingertips. In contrast, most living anthropoids, also known as higher primates, have narrow fingertips.
Fossils from the unnamed advanced anthropoid are narrow, Gebo said.
“These are the earliest known examples of those narrow fingers and toes that are key to anthropoid evolution,” he added. “We can see evolution occurring at this site, from the broader finger or toe tips to more narrow.”
Unlike other prehistoric forests across the globe that have a mixture of large and small primates, Shanghuang’s fossil record is unique in being nearly absent of larger creatures.
The unusual size distribution is likely the result of a sampling bias, Gebo said. Researchers might be missing the larger primate fauna because of processes affecting fossil preservation, and for similar reasons scientists at other Eocene localities could be missing the small-sized fauna.
“Many of the fossil specimens from Shanghuang show evidence of partial digestion by predatory birds, which may have specialized on preying upon the small primates and other mammals that are so common at Shanghuang, thus explaining the apparent bias toward small fossil species there,” Beard added.
Some of the primate fossils found in Shanghuang are found in other countries. Eosimias fossils have been recovered in Myanmar, for example. But Shanghuang stands out because of the presence of more advanced anthropoids and the sheer diversity of primates.
“You don’t find all of these fossil primates in one place except at Shanghuang,” Gebo said.
Reference:
Daniel L. Gebo, Marian Dagosto, Xijun Ni, K. Christopher Beard. Phalangeal morphology of Shanghuang fossil primates. Journal of Human Evolution, 2017; 113: 38 DOI: 10.1016/j.jhevol.2017.08.001
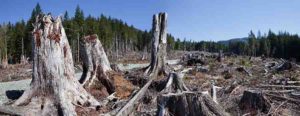
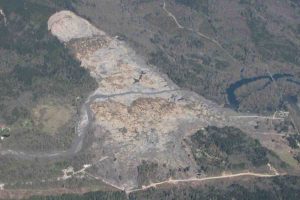
Scientists say human activity such as this clearcut logging in the Pacific Northwest could be ushering in the next mass extinction. Credit: Dave Mantel/iStockPhoto
Black rhinos, red wolves, whooping cranes: the global list of endangered species grows every year to the point where some researchers say we’re witnessing the start of Earth’s next mass extinction.
University of Cincinnati geology professor Thomas Algeo is studying the most devastating cataclysm ever to strike the planet to inform our understanding of global changes scientists are observing today. Algeo gave a keynote presentation on the topic to the Geological Society of America during its annual conference last month in Seattle.
Algeo, who works in the McMicken College of Arts & Sciences, has spent his career investigating Earth’s five biggest known extinctions, including a calamity 252 million years ago that wiped out most life on Earth at the time.
“There has been a lot of interest in studying these events. They inform us about the course of biological evolution during Earth’s history,” he said.
Extinction is a natural part of evolution, Algeo said. But mass extinctions are marked by a devastating loss of biodiversity, usually as a result of a catastrophic global disaster. Scientists have identified five of them in Earth’s history, the largest of which is sometimes called “the Great Dying.” This natural disaster occurred between the Permian and Triassic periods when volcanoes in what is now Siberia erupted and spewed enough lava to cover more than 400,000 square miles – an area 10 times bigger than Ohio.
To put that in perspective, the 1980 eruption of Mount St. Helens in Washington leveled 150 square miles of forest and spewed so much lava that ash fell onto car windshields 1,500 miles away in Oklahoma. That eruption blasted 3 cubic kilometers of material into the atmosphere.
The Permian-Triassic extinction featured 11 periods of major volcanic eruptions, spewing 3 million cubic kilometers of ash and rock into the air over a span of 1 million years. Afterward, ocean surface temperatures increased by 10 degrees Celsius from the greenhouse effect of volcanic methane and carbon dioxide in the air. The land became a veritable dust bowl with frequent and intense storms, while the oceans were depleted of oxygen and became highly acidified.
Scientists are still at odds about which of the resulting consequences was most responsible for the enormous die-off of plants and animals.
“Is it the rise in temperature? The lack of oxygen in the water or acidification of the oceans?” Algeo said. “I think it’s going to be very difficult to tease apart these effects because they’re all operating simultaneously.”
Algeo also is studying how long it takes plants and animals to recover after a mass extinction.
“We want to know how the recovery was related to changing and ameliorating environmental conditions,” he said. “There is a lot of potential to make new discoveries in this area.”
Life persisted after each global extinction. Surviving species adapted to the new conditions and the hardiest and most prolific of them, called “disaster taxa,” spread out quickly to fill the void, albeit with much lower species diversity, Algeo said.
Algeo in 1995 developed the prevailing theory for one of the Big 5 mass extinctions, which occurred at the end of the Devonian Period 360 million years ago. That extinction was considerably slower, spanning 25 million years, and doomed about half of life on Earth, particularly marine life.
Instead of a single catastrophic event such as a meteor strike or volcanic eruption, Algeo suggested a surprising culprit was to blame: plants.
“During the Devonian, land plants became established and started developing innovations such as leaves and root systems that allowed them to grow more vigorously in different environments,” he said. “They developed woody tissues that allowed them to grow bigger. And they developed seeds so they could colonize drier habitats.”
Over millions of years, Earth sprouted a massive new garden but at a cost. Waterways became choked with nutrients from decomposing plants. This decaying vegetation absorbed oxygen in the water, starving out other life, a process called eutrophication.
It’s a phenomenon that’s becoming more common now in waterways from the Gulf of Mexico to estuaries along the East Coast, fed by nutrient runoff from coastal development.
“Plants mine out nutrients in the soil, which is locked up temporarily in the biomass. But when the plant dies, eventually those nutrients get washed into waterways and into the ocean, triggering massive blooms of marine algae,” he said.
Geologists studying the Devonian find huge deposits of organic-rich black shale, evidence that supports Algeo’s hypothesis.
“It all links together very nicely,” Algeo said.
Knowing more about the impacts to the Earth after the biggest natural catastrophes can inform current research into climate change, water quality and biodiversity. Previous mass extinctions can serve as a cautionary tale for decisions we make today, he said.
“Previous mass extinctions show that things can go drastically wrong and wipe out huge parts of the biosphere in relatively short periods,” he said. “We should be concerned about that.”
The idea that humans are precipitating the world’s next mass extinction is controversial but supported by evidence. A study published this year in Nature found that 1 in 4 mammals and 13 percent of all birds were threatened with extinction from expanding development, habitat fragmentation, hunting and pollution. The most species-rich forests are expected to see increasing extinction risks at current human population and land-use projections, the study said.
“There’s a general pattern in mass extinctions. The higher up the food chain you go, the more likely you are to go extinct,” Algeo said.
Scientists and conservation groups around the world are working hard to protect biodiversity. Nonprofit groups such as Gorilla Doctors, which provides medical intervention to endangered mountain gorillas, are focused on a single species while others, such as the National Wildlife Federation, have broader goals.
“A lot of people tend to think of the extinction crisis as something happening far off in tropical rainforests. But here in the United States, we have many species in our own back yards that have declined and are seriously threatened,” said Bruce Stein, associate vice president of conservation science and climate adaptation for the National Wildlife Federation.
Stein said the fossil record has a lot to say about how species adjust to climate change. This could help inform conservation efforts in years to come.
“We can learn a lot by looking at species that survived extinction episodes,” he said.
In particular, scientists are studying the biggest cold-weather animals, which are expected to be the first to succumb to climate change. For example, moose are declining in the southern part of their range where they face a growing threat from parasites such as ticks and brainworm-causing nematodes that traditionally were kept in check by cold winters.
“They get a massive tick load in the summer that just sucks them dry. These moose scratch on trees and end up rubbing off their fur. They call them ghost moose,” Stein said. “Without this insulation, they don’t survive the winter.”
Intervention has brought some well-known species back from the brink of extinction in recent years, which shows what is possible with both public will and resources. But the trend line for many species is discouraging, Stein said.
“There are some great success stories: bald eagles and peregrine falcons. The California condor,” Stein said. “But for every recovery or success, there are far more species in serious trouble or declining.”
The inevitable loss of biodiversity will have few noticeable repercussions for people. But the same underlying issues are expected to lead to increasing population migration as people flee famine, drought, disease and natural disasters such as hurricanes and floods. The Obama Administration in 2016 declared climate change “a significant and growing threat to national security.”
Despite the challenges, Stein said there is reason for optimism.
“If we hold the pace of climate change, there are opportunities for people, plants and animals to adapt to those changes,” he said.
UC’s Algeo said it could take more time and natural catastrophes for the public to make sacrifices and demand policy changes.
“I personally think there will be another mass extinction. It’s going to be a very hard thing to stop,” Algeo said. “There will have to be visible consequences before people wake up to the degree that they demand action from their leaders.
“It’s a global problem,” Algeo said. “It requires a global solution.”
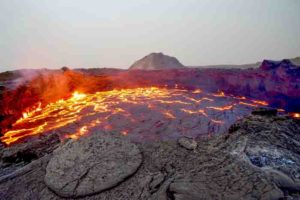
Two women and a boy took refuge on the roof … but it was carried away by the deluge of water, and as far as the eye could reach, the three unfortunate persons were seen clinging to the roof. One of the women was afterwards found among the mud of the jökulhlaup [Icelandic term for meltwater flood], but burnt, and as it were parboild; her body was so damaged and tender, but it could scarcely be touched.
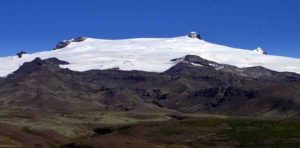
This is an eyewitness account of three fatalities during the last eruption (1727) of Iceland’s highest volcano, Öræfajökull. It was a relatively small eruption. The previous eruption in 1362, however, remains Iceland’s largest explosive eruption since the island was settled about 1,100 years ago.
This time, thick deposits of pumice and ash (also known as tephra) covered the volcano, while sailors at the time reported pumice floating “in such masses that ships could hardly make their way through it”. Ash from the 1362 eruption has been found in Greenland and western Europe recently.
Since June 2017, there have been “swarms” of small earthquakes in the region. Earthquakes are rare at Öræfajökull, so these have prompted meetings between locals, scientists and civil protection authorities. The unusual activity may indicate a reawakening of Öræfajökull, so it is timely to review previous eruptions and the potential effects of a future eruption.
Towering over 2km above coastal plains, Öræfajökull is a majestic sight. Its upper half is covered in ice that feeds valley glaciers that can be easily accessed. Tourists and filmmakers love it.
We first studied the volcano in 2001-2002. Our two main findings were that it has a variety of eruption styles and a surprising abundance of lavas known as rhyolites. We know that this can erupt very explosively – as it did in 1362.
To better understand the 1362 eruption, we have also mapped deposits preserved on the volcano. We found that this explosive eruption was surprisingly variable. It was not just a simple plume that gets gradually weaker, as is common at other volcanoes such as Hekla.
The eruption started by depositing a tephra blanket from a relatively low plume. Next, sticky ash/hail carpeted the volcano. Then the main phase of the eruption began with pyroclastic flows (fast-moving current of hot gas and volcanic matter) racing down the flanks, before a tall plume was established and rained huge pumices down on the land while ash clouds drifted away. As the eruption ended, its explosive energy fluctuated rapidly.
The main implication of our study is that explosive eruptions at Öræfajökull can be complicated. The most powerful phase with the highest plume and widest ash dispersal was probably short-lived (lasting from a few hours to a few days), but there were other stages before and after it with varying degrees of explosivity.
Locally, the eruption was devastating. Rich farmland at the foot of the volcano was covered by thick tephra deposits and swept by pyroclastic flows. The area was abandoned and renamed “Öræfi” (wasteland). Originally called Hnappafellsjökull, the volcano was renamed Öræfajökull.
What of the inhabitants – did they perish or escape? Three crucial pieces of evidence come from excavations of abandoned farms. Buildings had collapsed prior to the tephra fall and, despite evidence of prosperity, virtually nothing valuable was left behind. Also, no corpses were found. Conclusion? Inhabitants of these farms realised they were in danger, packed their belongings, and left. Large earthquakes then destroyed the buildings before the eruption started.
Air travel
The Icelandic volcano Eyjafjallajökull erupted in 2010, causing a lot of problems to air travel across Europe. Would a repeat of the 1362 eruption cause Eyjafjallajökull 2010-style disruption? No, it would not.
Eyjafjallajökull caused so much disruption because the eruption lasted for weeks, with the wind often blowing towards Europe, and because aircraft attempted to “avoid all ash“. Since then, improvements to volcanic ash cloud detection and simulation have been made. These, combined with revised procedures at the regulators and airlines, allow planes to fly where low concentrations of ash may be present. For example, the Grímsvötn 2011 eruption, which produced twice as much tephra as the Eyjafjallajökull 2010 eruption in one tenth of the time, caused just 1% of the flight cancellations.
A repeat of the 1362 eruption would disperse ash widely, but our results suggest this stage would be short-lived. This is just one scenario. Others, such as the eruption of lava beneath the ice, may be longer lasting but any disruption would be more localised.
Evacuation
It’s important to be prepared. Any buildings in the paths of floods would be destroyed. There are farming communities in the area but these have learned from the 1727 eruption and have relocated their farms from the glacier outlets. Before the small 1727 eruption there were earthquake shocks that terrified the people, which suggests that big earthquakes might provide warning of the next eruption and allow time for evacuation.
One of the biggest concerns would be the large number of tourists in the area – especially in summer. The nearby visitor centre of Skaftafell is the seventh most popular tourist destination in Iceland. However, Skaftafell lies outside the flood pathways of both the 1362 and 1727 eruptions – and so it is probably safe from floods.
It’s impossible to estimate exactly when Öræfajökull will next erupt. She may just be turning over in her sleep, soon to return to quiet slumber. Icelandic scientists recently installed additional earthquake monitoring equipment: with their acknowledged expertise in eruption monitoring they will provide the best possible information should Öræfajökull fully awaken.
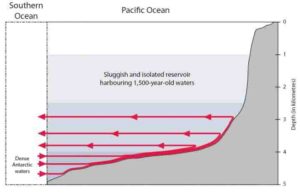
This is a schematic illustration of water currents. Credit: Fabien Roquet and Casimir de Lavergne
New research from an international team has revealed why the oldest water in the ocean in the North Pacific has remained trapped in a shadow zone around 2km below the sea surface for over 1000 years.
To put it in context, the last time this water encountered the atmosphere the Goths had just invaded the Western Roman Empire.
The research suggests the time the ancient water spent below the surface is a consequence of the shape of the ocean floor and its impact on vertical circulation.
“Carbon-14 dating had already told us the most ancient water lied in the deep North Pacific. But until now we had struggled to understand why the very oldest waters huddle around the depth of 2km,” said lead author from the University of New South Wales, Dr Casimir de Lavergne. “What we have found is that at around 2km below the surface of the Indian and Pacific Oceans there is a ‘shadow zone’ with barely any vertical movement that suspends ocean water in an area for centuries.
The shadow zone is an area of almost stagnant water sitting between the rising currents caused by the rough topography and geothermal heat sources below 2.5km and the shallower wind driven currents closer to the surface.
Before this research, models of deep ocean circulation did not accurately account for the constraint of the ocean floor on bottom waters. Once the researchers precisely factored it in they found the bottom water can not rise above 2.5km below the surface, leaving the region directly above isolated.
While the researchers have unlocked one part of the puzzle their results also have the potential to tell us much more.
“When this isolated shadow zone traps millennia old ocean water it also traps nutrients and carbon which have a direct impact on the capacity of the ocean to modify climate over centennial time scales,” said fellow author from Stockholm University, Dr Fabien Roquet.
The article “Abyssal ocean overturning shaped by seafloor distribution” is published in the scientific journal Nature.
Reference:
C. de Lavergne, G. Madec, F. Roquet, R. M. Holmes, T. J. McDougall. Abyssal ocean overturning shaped by seafloor distribution. Nature, 2017; 551 (7679): 181 DOI: 10.1038/nature24472
Note: The above post is reprinted from materials provided by Stockholm University.
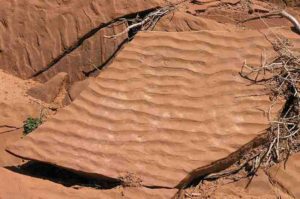
Ripple marks are sedimentary structures and indicate agitation by water (current or waves) or wind.
Ripple marks are ridges of sediment that form in response to wind blowing along a layer of sediment. They are form perpendicular to the wind direction and each ridge is roughly equidistant from the ripple mark on either side.
The troughs and ridges of fossilized ripple mark in sandstone and siltstones are hardened versions of the short-lived ripples in the loose sand of a modern-day stream, lake, sea, or sand dune. Ripples may be made by water or, in sand dunes, by wind. The symmetry of water-current ripple marks indicate whether they were formed by gentle waves or faster water currents.
What are types of Ripple marks?
There are two types:
Symmetrical ripple marks
Often found on beaches, they are created by a two way current, for example the waves on a beach (swash and backwash). This creates ripple marks with pointed crests and rounded troughs, which aren’t inclined more to a certain direction. Three common sedimentary structures that are created by these processes are herringbone cross-stratification, flaser bedding, and interference ripples.
Asymmetrical ripple marks
These are created by a one way current, for example in a river, or the wind in a desert. This creates ripple marks with still pointed crests and rounded troughs, but which are inclined more strongly in the direction of the current. For this reason, they can be used as palaeocurrent indicators.
Ripple marks Size (scale)
Very small: Very small cross-lamination means that the ripple height is roughly one centimeter. It is lenticular, wavy and flaser lamination.
Small: Small cross-bedding are ripples set at a height less than ten centimeters, while the thickness is only a few millimeters. Some ripples that may fit this category are wind ripples, wave ripples, and current ripples.
Medium: Medium cross-lamination are ripples with a height greater than ten centimeters, and less than one meter in thickness. Some ripples that may fit this category would be current-formed sand waves, and storm-generated hummocky cross stratification.
Large: Large cross-bedding are ripples with a height greater than one meter, and a thickness equivalent to one meter or greater. Some ripples that may fit this category would be high energy river-bed bars, sand waves, epsilon cross-bedding and Gilbert-type cross-bedding.
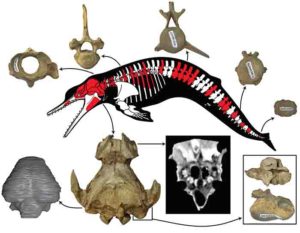
Albertocetus meffordum. Credit: Boessenecker et al (2017)
A partial skeleton from an Oligocene dolphin species was found in South Carolina, according to a study published November 8, 2017 in the open-access journal PLOS ONE by Robert Boessenecker from the College of Charleston, South Carolina, USA, and Erum Ahmed and Jonathan Geisler from the New York Institute of Technology, New York.
Previous research has shed light on the early evolutionary history of toothed whales, and particularly xenorophid dolphins – the earliest group of echolocating dolphins. Since the archaeological record for Xenorophidae is very limited, prior studies have focused on the crania or earbones of xenorophid dolphins.
The authors of the present study report five new specimens of xenorophid dolphins from North and South Carolina. Four of the specimens belonged to the xenorophid Albertocetus meffordorum, and one contained a partial skeleton including ribs, vertebrae, and chevrons as well as a partial skull and mandible. Since these specimens were collected from formations dating to the Oligocene (33.9 million to 23 million years before the present), this finding extends the known evolutionary history for this group.
The researchers studied the internal anatomy of the Albertocetus cranium using CT scan data, revealing that its brain was quite large in size, the largest yet for an early Oligocene toothed whale. Brain anatomy was further intermediate between modern cetaceans (such as dolphins, whales, and porpoises) and terrestrial even-toed hoofed animals (such as pigs, deer, and sheep). The partial vertebral column indicates that Albertocetus retained a similar shape and moved similarly to its archaeocete ancestors that lived 40 to 35 million years ago. Vertebrae from the tail indicate that Albertocetus had tail flukes like modern dolphins, but not a caudal peduncle – a narrow tail stock seen in all modern whales and dolphins.
The authors suggest that further collecting efforts in North and South Carolina might yield additional cetaceans that are contemporary with the specimens described in this study, and would continue to piece together the evolutionary history of this species.
The lead author Robert Boessenecker says, “Fossils like these new specimens of Albertocetus are critical windows into the earliest evolution of modern whales, and shed light on the split between baleen whales and echolocating whales about 30-35 million years ago.”
Reference:
Boessenecker RW, Ahmed E, Geisler JH (2017) New records of the dolphin Albertocetus meffordorum (Odontoceti: Xenorophidae) from the lower Oligocene of South Carolina: Encephalization, sensory anatomy, postcranial morphology, and ontogeny of early odontocetes. PLoS ONE 12(11): e0186476. DOI: 10.1371/journal.pone.0186476
The Earth has a powerful magnetic field. Credit: NASA
The Earth’s magnetic field, generated some 3,000km below our feet in the liquid iron core, threads through the whole planet and far into space – protecting life and satellites from harmful radiation from the sun. But this shielding effect is far from constant, as the field strength varies significantly in both space and time.
Over the last century, the field strength has changed relatively slowly: the biggest change is a 10% fall in the southern Atlantic, which is still a large enough effect to cause electronic problems for satellites that have passed through the region. However, new observations and modelling suggest that a much greater change strangely occurred around 1000BC in a much smaller region.
This “geomagnetic spike” offers a potentially profound new insight into the dynamics and evolution of Earth’s hidden interior that is now starting to be uncovered.
So what are geomagnetic spikes and what are the prospects and implications of another one coming along? The geomagnetic spike of 1000BC was first identified from copper slag heaps located in Jordan and Israel. These were dated from organic material within the slag heaps using radiocarbon dating.
Scientists then investigated the copper using sophisticated laboratory techniques to work out what the Earth’s magnetic field was at the time – relying on the fact that when melted iron cools rapidly, it freezes with a signature of the field at that instant. By taking samples from different layers of the slag heap – with slightly different ages and magnetisation – they could also see how the field strength changed with time. They found that the copper slag had recorded Earth’s magnetic field strength rising and then falling by over 100% in only 30 years.
Unexpectedly high field strengths around 1000BC have also been uncovered in Turkey, China and Georgia from a variety of sources. Remarkably, the field strength in India, Egypt and Cyprus around the same time was completely normal, indicating that the spike was perhaps only 2,000km wide. Such a rapid change over such a small area marks out the geomagnetic spike as one of the most extreme variations of Earth’s magnetic field ever recorded.
The spike seen in Jordan is the result of a much stronger and narrower magnetic feature that was created in Earth’s liquid core. The process that generated the spike is still shrouded in mystery, though it is likely related to the flow of iron within the core, which drags around the magnetic field as it moves (currents produce magnetic fields). The core is heated from below and cooled from above, so the iron within is thought to undergo vigorous turbulent motion, similar to a strongly heated pan of water. One possibility is that the spike was drawn to the surface of Earth’s core by a jet of upward moving iron.
After this, the spike may have moved northwest before merging with other magnetic features near the geographic poles. Alternatively, the spike intensity may have waned while it remained under Jordan.
All of these options suggest that behaviour of the liquid iron at the top of Earth’s core around 1000BC was very different to that seen today. Most of our knowledge of the core derives from roughly the last 200 years, corresponding to the time when direct magnetic field measurements have been available. Prior to discovery of the spike there was no reason to suspect that core flow speeds would be much different in 1000BC to today – indeed, the available models suggest there was little difference.
However, explaining the rapid changes associated with the spike requires flows five to ten times those at present, a large change in a short space of time. Moreover, such a narrow spike requires a similarly localised flow, which contrasts with the global-scale circulations we see today. The prospect that the iron core could flow faster and change more suddenly than previously thought, together with the possibility that even more extreme spike-like events occurred in the past, is challenging some conventional views on the dynamics of Earth’s core.
Future impact?
Changes in Earth’s magnetic field are not generally thought to have direct consequences for life, but there are potentially significant societal implications that arise from our reliance on electronic infrastructure. A variety of effects can arise from interactions between Earth’s magnetic field and charged particles reaching Earth from the sun.
Of particular importance are geomagnetic storms (caused by the solar wind), which are known to cause power outages and disruption to satellite and communications systems. The economic implications of severe storms are estimated to run into billions of pounds and their importance is now reflected in the national risk register.
Geomagnetic storms tend to be most prevalent in regions where Earth’s magnetic field is unusually weak. Spikes are regions of unusually strong magnetic field, but a fundamental law of nature means that they must be accompanied by regions of weaker field elsewhere on the globe. The key question is whether the field gets a little bit weaker over a large region or becomes very weak in just a small region. The latter “anti-spike” scenario could be similar to or more extreme than the current south Atlantic weak spot.
Whether there will be more spikes is hard to say. Until very recently, the Jordanian spike was the only such event ever observed. However, there is now tantalising new evidence for another spike-like feature in Texas, also around 1000BC. Our understanding of what spikes should look like, how they change in time, and how they relate to the motion of the liquid iron in Earth’s core are also improving rapidly.
Coupled with numerical simulations that model the dynamics of Earth’s core, it may soon be possible to make the first predictions of how often spikes occur and the most likely locations where they could have occurred in the past (and may occur in the future). It could turn out that they are more common than we think.
Femoral head bones of different species illustrating the size range in the hominin lineage. From top to bottom: Australopithecus afarensis (4-3 million years; ~40 kg, 130 cm); Homo ergaster (1.9-1.4 million years; 55-60 kg; ~165 cm); Neanderthal (200.000-30.000 years; ~70 kg; ~163 cm). Credit: University of Cambridge
A wide-ranging new study of fossils spanning over four million years suggests that stature and body mass advanced at different speeds during the evolution of hominins — the ancestral lineage of which Homo sapiens alone still exist.
Published today in the journal Royal Society Open Science, the research also shows that, rather than steadily increasing in size, hominin bodies evolved in “pulse and stasis” fluctuations, with some lineages even shrinking.
The findings are from the largest study of hominin body sizes, involving 311 specimens dating from earliest upright species of 4.4m years ago right through to the modern humans that followed the last ice age.
While researchers describe the physical evolution of assorted hominin species as a “long and winding road with many branches and dead ends,” they say that broad patterns in the data suggest bursts of growth at key stages, followed by plateaus where little changed for many millennia.
The scientists were surprised to find a “decoupling” of bulk and stature around one and a half million years ago, when hominins grew roughly 10cm taller but would not consistently gain any heft for a further million years, with an average increase of 10-15kgs occurring around 500,000 years ago.
Before this event, height and weight in hominin species appeared to evolve roughly “in concert,” say the authors of this first study to jointly analyse both aspects of body size over millions of years.
“An increase solely in stature would have created a leaner physique, with long legs and narrow hips and shoulders. This may have been an adaptation to new environments and endurance hunting, as early Homo species left the forests and moved on to more arid African savannahs,” says lead author Dr Manuel Will from Cambridge’s Department of Archaeology, and a Research Fellow at Gonville and Caius College.
“The higher surface-to-volume ratio of a tall, slender body would be an advantage when stalking animals for hours in the dry heat, as a larger skin area increases the capacity for the evaporation of sweat.”
“The later addition of body mass coincides with ever-increasing migrations into higher latitudes, where a bulkier body would be better suited for thermoregulation in colder Eurasian climates,” he says.
However, Dr Will points out that, while these are valid theories, vast gaps in the fossil record continue to mask absolute truths. In fact, Will and colleagues often had to estimate body sizes from highly fragmented remains — in some cases from just a single toe bone.
The study found body size to be highly variable during earlier hominin history, with a range of differently shaped species: from broad, gorilla-like Paranthropus to the more wiry or ‘gracile’ Australopithecus afarensis. Hominins from four million years ago weighed a rough average of 25kg and stood at 125-130cm.
As physicality morphs over deep time, increasingly converging on larger body sizes, the scientists observe three key “pulses” of significant change.
The first occurs with the dawn of our own defined species bracket, Homo, around 2.2-1.9m years ago. This period sees a joint surge in both height (around 20 cm) and weight (between 15-20kg).
Stature then separated from heft with a height increase alone of 10cm between 1.4-1.6m years ago, shortly after the emergence of Homo erectus. “From a modern perspective this is where we see a familiar stature reached and maintained. Body mass, however, is still some way off,” explains Will.
It’s not until a million years later (0.5-0.4m years ago) that consistently heavier hominins appear in the fossil record, with an estimated 10-15kg greater body mass signalling adaptation to environments north of the Mediterranean.
“From then onwards, average body height and weight stays more or less the same in the hominin lineage, leading ultimately to ourselves,” says Will.
There are, however, a couple of exceptions to this grand narrative: Homo naledi and Homo floresiensis*. Recently discovered remains suggest these species swam against the tide of increasing body size through time.
“They may have derived from much older small-bodied ancestors, or adapted to evolutionary pressures occurring in small and isolated populations,” says Will. Floresiensis was discovered on an Indonesian island.
“Our study shows that, other than these two species, hominins that appear after 1.4m years ago are all larger than 140cm and 40kg. This doesn’t change until human bodies diversify again in just the last few thousand years.”
“These findings suggest extremely strong selective pressures against small body sizes which shifted the evolutionary spectrum towards the larger bodies we have today.”
Will and colleagues say evolutionary pressures that may have contributed include ‘cladogenesis’: the splitting of a lineage, with one line — the smaller-bodied one, in this case — becoming extinct, perhaps as a result of inter-species competition.
They also suggest that sexual dimorphism — the physical distinction between genders, with females typically smaller in mammals — was more prevalent in early hominin species but then steadily ironed out by evolution.
Study co-author Dr Jay Stock, also from Cambridge’s Department of Archaeology, suggests this growth trajectory may continue.
“Many human groups have continued to get taller over just the past century. With improved nutrition and healthcare, average statures will likely continue to rise in the near future. However, there is certainly a ceiling set by our genes, which define our maximum potential for growth,” Stock says.
“Body size is one of the most important determinants of the biology of every organism on the planet,” adds Will. “Reconstructing the evolutionary history of body size has the potential to provide us with insights into the development of locomotion, brain complexity, feeding strategies, even social life.”
Reference:
Manuel Will, Adrián Pablos, Jay T. Stock. Long-term patterns of body mass and stature evolution within the hominin lineage. Royal Society Open Science, 2017; 4 (11): 171339 DOI: 10.1098/rsos.171339
Note: The above post is reprinted from materials provided by University of Cambridge. The original story is licensed under a Creative Commons License.
An aerial image of the Oso landslide on April 13, 2014. Credit: Photo courtesy Tim Stark
Washington State University researchers say landslides on logged forests will be more widespread as the Northwest climate changes.
In a study modelled on clear-cut lands on the Olympic Peninsula, they anticipate the climate of 2045 and conclude that there will be a 7 -11 percent increase in the land that is highly vulnerable to landslides. The researchers say their findings are applicable to the Cascade Mountain Range area as well.
The study, published in Engineering Geology, is the first to look at landslides and climate change in the Pacific Northwest. The University of Washington’s Climate Impacts Group “State of Knowledge” report in 2015 looked at reasons behind climate-influenced landslides — earlier snowmelt, more rain, less cohesive soils — but stopped short of predicting an increase in landslides.
The WSU study goes a step further.
“Logged landscapes become more susceptible to landslide activity under climate change,” said Jennifer Adam, an associate professor of civil and environmental engineering and associate director of the State of Washington Water Research Center.
Warning and tool
Adam said the study can serve as both a warning and a tool, helping land managers identify several features of vulnerable slopes that can guide their harvesting decisions. The researchers found vulnerable slopes tend to be at elevations over 1,600 feet, with slopes in the range of 40 or more degrees and talus or sandy soils.
“This study allowed us to look at exactly what characteristics of the landscape became more susceptible, allowing us to identify win-win situations in which both environmental and economic outcomes can be improved by targeted logging locations,” Adam said. “It’s not that we’re saying, (Would it be clearer to say, “We’re not saying, ‘Don’t log….”)
‘Don’t log because you’re going to have more landslides.'”
The study, said lead author Muhammad Barik, “is telling people, if you are cutting trees on this slope, it might be OK today. But in the future, it might not be, so plan according to that. If you do logging in this area without considering future projections, it might become susceptible to landslides.”
Oso landslide
Washington witnessed the deadliest landslide in U.S. history three years ago when 270 million cubic feet of mud barreled through a neighborhood outside Oso, Wash., killing 43 people and destroying 49 homes. A subsequent engineering report found that recent logging may have increased the amount of water on the slope, though the report did not pin the slide on any single cause.
Landslides also can lead to billions of dollars of economic losses and damage aquatic habitats, including those used by the region’s endangered salmon, the researchers write. Clear-cutting reduces the rainfall that can be intercepted by leaves and reduces the ability of roots to reinforce soil that is more likely to be saturated under the Northwest’s changing climate.
“Wet soil is not cohesive, so it becomes very unstable,” said Adam. “If you don’t have a lot of vegetation and deep roots holding that soil in place, then it becomes susceptible to landslides.”
Olympic Forest
Adam and Barik looked at one of the wettest locations in the continental United States, the Queets watershed in the Olympic Experimental State Forest, which receives between 96 and 236 inches of rain a year. While they chose the area for its varied geography, it is typical of rainforest from southern Oregon to southeast Alaska. Their hydrologic model, which is commonly used around the Pacific Northwest, considered variations in soil, land cover, topography and subsurface moisture as it simulated water-induced slope failures. They factored in meteorological data, a digital landslide database and satellite imagery.
Climate change is expected to bring warmer and wetter winters to the region, as well as more frequent extreme rainfall events.
“The combination of warming, precipitation and less snow means more liquid precipitation, which will then sit in the soil and keep it wet and unstable,” said Adam.
To anticipate the climate of 2045, the researchers used two greenhouse-gas emission scenarios of the United Nations’ Intergovernmental Panel on Climate Change. One scenario, which predicts the lowest emissions, saw an average 7.1 percent increase in the area highly susceptible to landslides. The other scenario, which predicts the highest emissions, saw an average increase of 10.7 percent.
“We’re giving you a tool to see into the future,” said Barik, who did the research as part of his WSU doctoral studies. “Most of the landslide studies are based on historical data. Here, along with historical data, we also used climate models so you can look at future projections.”
Reference:
Improved landslide susceptibility prediction for sustainable forest management in an altered climate. DOI: 10.1016/j.enggeo.2017.09.026
A mineral is a naturally occurring chemical compound, usually of crystalline form and abiogenic in origin (not produced by life processes). A mineral has one specific chemical composition, whereas a rock can be an aggregate of different minerals or mineraloids. The study of minerals is called mineralogy.
There are over 5,300 known mineral species; as of March 2017, over 5,230 of these had been approved by the International Mineralogical Association (IMA). The silicate minerals compose over 90% of the Earth’s crust. Silicon and oxygen constitute approximately 75% of the Earth’s crust, which translates directly into the predominance of silicate minerals.
Minerals are distinguished by various chemical and physical properties. Differences in chemical composition and crystal structure distinguish the various species, which were determined by the mineral’s geological environment when formed. Changes in the temperature, pressure, or bulk composition of a rock mass cause changes in its minerals.
Minerals can be described by their various physical properties, which are related to their chemical structure and composition. Common distinguishing characteristics include crystal structure and habit, hardness, lustre, diaphaneity, colour, streak, tenacity, cleavage, fracture, parting, specific gravity, magnetism, taste or smell, radioactivity, and reaction to acid. (How to Identify Minerals?)
Minerals are classified by key chemical constituents; the two dominant systems are the Dana classification and the Strunz classification. The silicate class of minerals is subdivided into six subclasses by the degree of polymerization in the chemical structure. All silicate minerals have a base unit of a [SiO4]4− silica tetrahedron—that is, a silicon cation coordinated by four oxygen anions, which gives the shape of a tetrahedron. These tetrahedra can be polymerized to give the subclasses: orthosilicates (no polymerization, thus single tetrahedra), disilicates (two tetrahedra bonded together), cyclosilicates (rings of tetrahedra), inosilicates (chains of tetrahedra), phyllosilicates (sheets of tetrahedra), and tectosilicates (three-dimensional network of tetrahedra). Other important mineral groups include the native elements, sulfides, oxides, halides, carbonates, sulfates, and phosphates.
What is Mineraloid?
A mineraloid is a mineral-like substance that does not demonstrate crystallinity. Mineraloids possess chemical compositions that vary beyond the generally accepted ranges for specific minerals. For example, obsidian is an amorphous glass and not a crystal. Jet is derived from decaying wood under extreme pressure. Opal is another mineraloid because of its non-crystalline nature. Pearl, considered by some to be a mineral because of the presence of calcium carbonate crystals within its structure, would be better considered a mineraloid because the crystals are bonded by an organic material, and there is no definite proportion of the components.
ALROSA’s affiliate Almazy Anabara has extracted a large 34.17-carat yellow diamond. It is the largest fancy-colored rough diamond extracted by the Company this year.
The rough diamond, extracted from Ebelyakh alluvial deposit, measures 20.17 х 19.65 х 15.1 mm. It is a transparent intense yellow crystal with a small inclusion in the intermediate zone.
Before the end of October, it will be delivered to the United Selling Organization ALROSA (USO ALROSA) in Moscow, where the Company specialists will give it a more detailed and accurate assessment.
“This year for ALROSA has already hit the record in the number of large fancy-colored stones. We used to extract fancy-colored rough diamonds over 10 carats once a year on the average. This year, we have already recovered several large fancy-colored diamonds, and this 34.17-carat yellow stone is the largest one so far. The Company’s specialists are still to study the stone more in detail, but we can say in advance that it is fancy vivid yellow, which is very rare and highly valued. The stone will become a worthy addition to our collection of large rare-colored diamonds that we are forming and will bring to the market,” said the director of the United Selling Organization ALROSA Evgeny Agureev.
Almazy Anabara is traditionally the leader in the number of fancy-colored stones. Earlier this year, Almazy Anabara also extracted a unique 27.85-carat pure pink diamond – the largest pink stone in ALROSA’s history.
Note: The above post is reprinted from materials provided by ALROSA.
Erta Ale in eastern Ethiopia. Credit: mbrand85/shutterstock
Ethiopia tends to conjure images of sprawling dusty deserts, bustling streets in Addis Ababa or the precipitous cliffs of the Simien Mountains – possibly with a distance runner bounding along in the background. Yet the country is also one of the most volcanically active on Earth, thanks to Africa’s Great Rift Valley, which runs right through its heart.
Rifting is the geological process that rips tectonic plates apart, roughly at the speed your fingernails grow. In Ethiopia this has enabled magma to force its way to the surface, and there are over 60 known volcanoes. Many have undergone colossal eruptions in the past, leaving behind immense craters that pepper the rift floor. Some volcanoes are still active today. Visit them and you find bubbling mud ponds, hot springs and scores of steaming vents.
This steam has been used by locals for washing and bathing, but underlying this is a much bigger opportunity. The surface activity suggests extremely hot fluids deep below, perhaps up to 300°C–400°C. Drill down and it should be possible access this high temperature steam, which could drive large turbines and produce huge amounts of power. This matters greatly in a country where 77% of the population has no access to electricity, one of the lowest levels in Africa.
Geothermal power has recently become a serious proposition thanks to geophysical surveys suggesting that some volcanoes could yield a gigawatt of power. That’s the equivalent of several million solar panels or 500 wind turbines from each. The total untapped resource is estimated to be in the region of 10GW.
Converting this energy into power would build on the geothermal pilot project that began some 20 years ago at Aluto volcano in the lakes region 200km south of Addis Ababa. Its infrastructure is currently being upgraded to increase production tenfold, from 7MW to 70MW. In sum, geothermal looks like a fantastic low-carbon renewable solution for Ethiopia that could form the backbone of the power sector and help lift people out of poverty.
Scratching the surface
The major problem is that, unlike more developed geothermal economies like Iceland, very little is known about Ethiopia’s volcanoes. In almost all cases, we don’t even know when the last eruption took place – a vital question since erupting volcanoes and large-scale power generation will not make happy bedfellows.
In recent years, the UK’s Natural Environment Research Council (NERC) has been funding RiftVolc, a consortium of British and Ethiopian universities and geological surveys, to address some of these issues. This has focused on understanding the hazards and developing methods for exploring and monitoring the volcanoes so that they can be exploited safely and sustainably.
Teams of scientists have been out in the field for the past three years deploying monitoring equipment and making observations. Yet some of the most important breakthroughs have come through an entirely different route – through researchers analysing satellite images at their desks.
This has produced exciting findings at Aluto. Using a satellite radar technique, we discovered that the volcano’s surface is inflating and deflating. The best analogy is breathing – we found sharp “inhalations” inflating the surface over a few months, followed by gradual “exhalations” which cause slow subsidence over many years. We’re not exactly sure what is causing these ups and downs, but it is good evidence that magma, geothermal waters or gases are moving around in the depths some five km below the surface.
Taking the temperature
In our most recent paper, we used satellite thermal images to probe the emissions of Aluto’s steam vents in more detail. We found that the locations where gases were escaping often coincided with known fault lines and fractures on the volcano.
When we monitored the temperature of these vents over several years, we were surprised to find that most were quite stable. Only a few vents on the eastern margin showed measurable temperature changes. And crucially, this was not happening in synchronicity with Aluto’s ups and downs – we might have expected that surface temperatures would increase following a period of inflation, as hot fluids rise up from the belly of the volcano.
It was only when we delved into the rainfall records that we came up with an explanation: the vents that show variations appear to be changing as a delayed response to rainfall on the higher ground of the rift margin. Our conclusion was that the vents nearer the centre of the volcano were not perturbed by rainfall and thus represent a better sample of the hottest waters in the geothermal reservoir. This obviously makes a difference when it comes to planning where to drill wells and build power stations on the volcano, but there’s a much wider significance.
This is one of the first times anyone has monitored a geothermal resource from space, and it demonstrates what can be achieved. Since the satellite data is freely available, it represents an inexpensive and risk-free way of assessing geothermal potential.
With similar volcanoes scattered across countries like Kenya, Tanzania and Uganda, the technique could allow us to discover and monitor new untapped geothermal resources in the Rift Valley as well as around the world. When you zoom back and look at the big picture, it is amazing what starts to come into view.