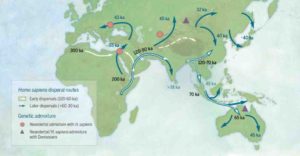
Home Blog Page 106

Less life: Limited phosphorus recycling suppressed early Earth’s biosphere

This is a Wyoming portion of The Phosphoria Formation, a deposit that stretches across several states in the western United States and is the largest source of phosphorus fertilizer in the country
As Earth’s oxygen levels rose to near-modern levels over the last 800 million years, phosphorus levels increased, as well, according to modeling led by the UW’s Michael Kipp and others. Accordingly, Kipp says, large phosphate deposits show up in abundance in the rock record at about this time. This is a Wyoming portion of The Phosphoria Formation, a deposit that stretches across several states in the western United States and is the largest source of phosphorus fertilizer in the country. The photo shows layers of phosphorus that are 10s of meters thick, shales the contain high concentrations of organic carbon and phosphorus. Kipp said many such deposits are documented over time but are rare in the Precambrian era. “Thus, they might represent a conspicuous temporal record of limited phosphorus recycling.” Credit: Michael Kipp / University of Washington

The amount of biomass — life — in Earth’s ancient oceans may have been limited due to low recycling of the key nutrient phosphorus, according to new research by the University of Washington and the University of St. Andrews in Scotland.

The research, published online Nov. 22 in the journal Science Advances, also comments on the role of volcanism in supporting Earth’s early biosphere — and may even apply to the search for life on other worlds.

The paper’s lead author is Michael Kipp, a UW doctoral student in Earth and space sciences; coauthor is Eva Stüeken, a research fellow at the University of St. Andrews and former UW postdoctoral researcher. Roger Buick, UW professor of Earth and space sciences, advised the researchers.

Their aim, Kipp said, was to use theoretical modeling to study how ocean phosphorus levels have changed throughout Earth’s history.

“We were interested in phosphorus because it is thought to be the nutrient that limits the amount of life there is in the ocean, along with carbon and nitrogen,” said Kipp. “You change the relative amount of those and you change, basically, the amount of biological productivity.”

Kipp said their model shows the ability of phosphorus to be recycled in the ancient ocean “was much lower than today, maybe on the order of 10 times less.”

All life needs abundant food to thrive, and the chemical element phosphorus — which washes into the ocean from rivers as phosphate — is a key nutrient. Once in the ocean, phosphorus gets recycled several times as organisms such as plankton or eukaryotic algae that “eat” it are in turn consumed by other organisms.

“As these organisms use the phosphorus, they in turn get grazed upon, or they die and other bacteria decompose their organic matter,” said Kipp, “and they release some of that phosphorus back into the ocean. It actually cycles through several times,” allowing the liberated phosphorus to build up in the ocean. The amount of recycling is a key control on the amount of total phosphorus in the ocean, which in turn supports life.

Buick explained: “Every gardener knows that their plants grow only small and scraggly without phosphate fertilizer. The same applies for photosynthetic life in the oceans, where the phosphate ‘fertilizer’ comes largely from phosphorus liberated by the degradation of dead plankton.”

But all of this requires oxygen. In today’s oxygen-rich oceans, nearly all phosphorus gets recycled in this way and little falls to the ocean floor. Several billion years ago, in the Precambrian era, however, there was little or no oxygen in the environment.

“There are some alternatives to oxygen that certain bacteria could use, said co-author Stüeken. “Some bacteria can digest food using sulfate. Others use iron oxides.” Sulfate, she said, was the most important control on phosphorus recycling in the Precambrian era.

“Our analysis shows that these alternative pathways were the dominant route of phosphorus recycling in the Precambrian, when oxygen was very low,” Stüeken said. “However, they are much less effective than digestion with oxygen, meaning that only a smaller amount of biomass could be digested. As a consequence, much less phosphorus would have been recycled, and therefore total biological productivity would have been suppressed relative to today.”

Kipp likened early Earth’s low-oxygen ocean to a kind of “canned” environment, with oxygen sealed out: “It’s a closed system. If you go back to the early Precambrian oceans, there’s not very much going on in terms of biological activity.”

Stüeken noted that volcanoes were the biggest source of sulfate in the Precambrian, unlike now, and so they were necessary for sustaining a significant biosphere by enabling phosphorus recycling.

In fact, minus such volcanic sulfate, Stüeken said, Earth’s biosphere would have been very small, and may not have survived over billions of years. The findings, then, illustrate “how strongly life is tied to fundamental geological processes such as volcanism on the early Earth,” she said.

Kipp and Stüeken’s modeling may have implications as well for the search for life beyond Earth.

Astronomers will use upcoming ground- and space-based telescopes such as the James Webb Space Telescope, set for launch in 2019, to look for the impact of a marine biosphere, as Earth has, on a planet’s atmosphere. But low phosphorus, the researchers say, could cause an inhabited world to appear uninhabited — making a sort of “false negative.”

Kipp said, “If there is less life — basically, less photosynthetic output — it’s harder to accumulate atmospheric oxygen than if you had modern phosphorus levels and production rates. This could mean that some planets might appear to be uninhabited due to their lack of oxygen, but in reality they have biospheres that are limited in extent due to low phosphorus availability.

“These ‘false negatives’ are one of the biggest challenges facing us in the search for life elsewhere,” said Victoria Meadows, UW astronomy professor and principal investigator for the NASA Astrobiology Institute’s Virtual Planetary Laboratory, based at the UW.

“But research on early Earth’s environments increases our chance of success by revealing processes and planetary properties that guide our search for life on nearby exoplanets.”

Reference:
Michael A. Kipp, Eva E. Stüeken. Biomass recycling and Earth’s early phosphorus cycle. Science Advances, 2017; 3 (11): eaao4795 DOI: 10.1126/sciadv.aao4795

Note: The above post is reprinted from materials provided by University of Washington.

Decline in atmospheric carbon dioxide key to ancient climate transition

shell of a fossil planktic foraminifera Globigerinoides ruber.
Reflected light image of the shell of a fossil planktic foraminifera Globigerinoides ruber. The boron isotopic composition of the shells of this species was used to reconstruct atmospheric CO2 1 million years ago in this study. Credit: Tom Chalk

A decline in atmospheric carbon dioxide (CO2) levels led to a fundamental shift in the behaviour of the Earth’s climate system around one million years ago, according to new research led by the University of Southampton.

A team of international scientists used new geochemical measurements, coupled with a model of the ‘Earth system’, to show that the growth and changing nature of continental ice sheets, approximately a million years ago, coincided with a cascade of events that ultimately lowered atmospheric CO2 during glacial intervals — periods when the Earth experienced extreme cold.

The researchers have shown this change was key in triggering what is known as the Mid-Pleistocene Transition (MPT), which lasted around 400,000 years. The MPT had long lasting effects on the frequency at which the Earth transitioned between periods of warm and cold climate, (the ‘ice age cycles’).

Findings of the study are published in the journal Proceedings of the National Academy of Sciences.

For much of the last three million years the Earth’s climate naturally cycled every 40,000 years from frigid glacial intervals, where continental ice covered much of North America and Europe, to warm interglacial climates like the pre-industrial period, when Europe and North America were largely ice free.

These ice age cycles, also known as Milkovitch Cycles after the Serbian mathematician who discovered them, are paced by regular changes in the way the Earth orbits the sun and spins on its axis, caused by the gravitational pull of the other planets in our solar system. Around one million years ago, during the MPT, the period of the cycles abruptly changed to every 100,000 years. However, this transition is not accompanied by a change in the nature of the orbital cycles and so represents a significant challenge to the Milkovitch Theory to explain ice age cycles.

Dr Tom Chalk, a post-doctoral fellow at the University of Southampton, who jointly led the study explains: “We know from bubbles of the ancient atmosphere trapped in Antarctic ice cores that changes in atmospheric CO2 accompanied the more recent ice age cycles. CO2 was low when it was cold during the glacials and it was higher during the warm interglacials — in this way it acted as a key amplifier of the relatively minor climate forcing from the orbital cycles. Unfortunately, the ice core records only stretch back to around 800,000 years ago and so do not go over this key transition interval. In order to better understand the cause of the MPT, we needed a way to reconstruct CO2 further back in time.”

To do this, the team used a technique based on the boron isotopic composition of the shells of ancient marine fossils called ‘foraminifera’. These are tiny marine plankton that live near the sea surface and the chemical make-up of their microscopic shells records the environmental conditions of the time when they lived, millions of years ago.

Professor Gavin Foster, of the University of Southampton, continues: “From these boron isotope measurements we were able to recover a snapshot of the variability in atmospheric CO2 around 1.1 million years ago. We were able to show, for the first time that, just as in the ice core record, CO2 and climate varied in tandem. There were two main differences however: firstly, during the glacials before the MPT, CO2 did not drop as low as it did in the ice core record after the MPT, remaining about 20-40 parts per million (ppm) higher. Secondly, the climate system was also more sensitive to changing CO2 after the MPT than before.”

The Earth’s climate system is very complex and the various interconnections between its numerous processes and feedbacks are best understood within a computational modelling framework. Dr Mathis Hain, a NERC Independent Research Fellow at the University of Southampton, added: “In order to determine why glacial-aged CO2 declined by 20-40 ppm across the MPT we used a biogeochemical model. Our best model fit to the available data suggests that the reduced drawdown of CO2 during glacial periods prior to the MPT was due to a reduced flux of dust to the Southern Ocean at this time. A higher dust flux during more recent glacial intervals brought much needed iron to that region, stimulating primary productivity and phytoplankton growth, locking more CO2 away in the deep ocean. We do not know yet exactly why the climate became dustier after MPT, but it is likely due to the ice sheets getting bigger and changing atmospheric circulation.”

Over the last 20 years or so there have been many different ideas to explain this important climate transition, some have called on changes in the nature of the ice sheets themselves, others on atmospheric CO2 change. What the team’s new data and modelling show is that what happened in reality was a mix of both types of ideas — the climate and the ice sheets became more sensitive, this led to bigger ice sheets, and this in turn led to enhanced CO2 drawdown. As with many facets of the Earth system these changes acted in a vicious circle, feeding on one another, ultimately sustaining longer glacial periods following the MPT.

There is still much that remains to be found out about how the Earth system responds to climate forcing. This study, however, illustrates the exquisite coupling that exists in the Earth System between climate change, ice-sheet mass, and the polar ocean mechanisms that regulate natural CO2 change.

Reference:
Thomas B. Chalk, Mathis P. Hain, Gavin L. Foster, Eelco J. Rohling, Philip F. Sexton, Marcus P. S. Badger, Soraya G. Cherry, Adam P. Hasenfratz, Gerald H. Haug, Samuel L. Jaccard, Alfredo Martínez-García, Heiko Pälike, Richard D. Pancost, Paul A. Wilson. Causes of ice age intensification across the Mid-Pleistocene Transition. Proceedings of the National Academy of Sciences, 2017; 201702143 DOI: 10.1073/pnas.1702143114

Note: The above post is reprinted from materials provided by University of Southampton.

Unique underwater stalactites

The Hells Bells in the El Zapote cave near Puerto Morelos on the Yucatán Peninsula.
The Hells Bells in the El Zapote cave near Puerto Morelos on the Yucatán Peninsula. Credit: E.A.N./IPA/INAH/MUDE/UNAM/HEIDELBERG

In recent years, researchers have identified a small group of stalactites that appear to have calcified underwater instead of in a dry cave. The Hells Bells in the El Zapote cave near Puerto Morelos on the Yucatán Peninsula are just such formations. A German-Mexican research team led by Prof. Dr Wolfgang Stinnesbeck from the Institute of Earth Sciences at Heidelberg University recently investigated how these bell-shaped, metre-long formations developed, assisted by bacteria and algae. The results of their research have been published in the journal Palaeogeography, Palaeoclimatology, Palaeoecology.

Hanging speleothems, also called stalactites, result through physicochemical processes in which water high in calcium carbonate dries up. Normally they rejuvenate and form a tip at the lower end from which the drops of water fall to the cave floor. The formations in the El Zapote cave, which are up to two metres long, expand conically downward and are hollow with round, elliptical or horseshoe-shaped cross-sections. Not only are they unique in shape and size, but also their mode of growth, according to Prof. Stinnesbeck. They grow in a lightless environment near the base of a 30 m freshwater unit immediately above a zone of oxygen-depleted and sulfide-rich toxic saltwater. “The local diving community dubbed them Hells Bells, which we think is especially appropriate,” states Wolfgang Stinnesbeck. Uranium-thorium dating of the calcium carbonate verifies that these formations must have actually grown underwater, proving that the Hells Bells must have formed in ancient times. Even then the deep regions of the cave had already been submerged for thousands of years.

According to the Heidelberg geoscientist, this underwater world on the Yucatán Peninsula in Mexico represents an enigmatic ecosystem providing the conditions for the formation of the biggest underwater speleothems worldwide. Previously discovered speleothems of this type are much smaller and less conspicuous than the Hells Bells, adds Prof. Stinnesbeck. The researchers suspect that the growth of these hollow structures is tied to the specific physical and biochemical conditions near the halocline, the layer that separates the freshwater from the underlying saltwater. “Microbes involved in the nitrogen cycle, which are still active today, could have played a major role in calcite precipitation because of their ability to increase the pH,” explains Dr Stinnesbeck.

Reference:
Stinnesbeck, W., Frey, E., Zell, P., Avíles, J., Hering, F., Frank, N., Arps, J., Geenen, A., Gescher, J., Isenbeck-Schröter, M., Ritter, S., Stinnesbeck, S., Aceves Núñez, E., Fito Dahne, V., González González, A.H., Deininger, M. Hells Bells – unique speleothems from the Yucatán Peninsula, Mexico, generated under highly specific subaquatic conditions. Palaeogeography, Palaeoclimatology, Palaeoecology, 2017 DOI: 10.1016/j.palaeo.2017.10.01

Note: The above post is reprinted from materials provided by Heidelberg University.

Research reveals the scale at which Earth’s mantle composition varies

The mantle beneath Earth's mid-oceanic ridges contains heterogeneous blobs of material
The mantle beneath Earth’s mid-oceanic ridges contains heterogeneous blobs of material. A new study puts new constraints on the sizes of those blobs. Credit: Boda Liu

New research by Brown University geochemists provides new insights on the scale at which Earth’s mantle varies in chemical composition. The findings could help scientists better understand the mixing process of mantle convection, the slow churning that drives the movement of Earth’s tectonic plates.

“We know that the mantle is heterogeneous in composition, but it’s been difficult to figure out how large or small those heterogeneities might be,” said Boda Liu, a Ph.D. student in geology at Brown. “What we show here is that there must be heterogeneities of at least a kilometer in size to produce the chemical signature we observe in rocks derived from mantle materials.”

The research, which Liu co-authored with Yan Liang, a professor in Brown’s Department of Earth Environmental and Planetary Sciences, is published in Science Advances.

Earth’s crust is on a constantly moving conveyer belt driven by the convecting mantle. At mid-ocean ridges, the boundaries on the ocean floor where tectonic plates are pulling away from each other, new crust is created by eruption of magmas formed by the rising of the mantle materials from depth. At subductions zones, where one tectonic plate slides beneath another, old crust material, weathered by processes on the surface, is pushed back down into the mantle. This recycling can create mantle materials of different or “enriched” compositions, which geochemists refer to as “heterogeneities.” What happens to that enriched material once it’s recycled isn’t fully understood.

“This is one of the big questions in Earth science,” Liang said. “To what extent does mantle convection mix and homogenize these heterogeneities out? Or how might these heterogeneities be preserved?”

Scientists learn about the composition of the mantle by studying mid-ocean ridge basalts (MORBs), rocks formed by the solidification of magmas erupted on the seafloor. Like fingerprints, isotope compositions of MORBs can be used to trace the mantle source from which they were derived.

Another type of seafloor rock called abyssal peridotites is the leftover mantle after the formation of MORBs. These are chunks of mantle rock that once were the uppermost mantle and later uplifted to the seafloor. Abyssal peridotites have a different isotope composition than MORBs that appear to come from the same mantle region. To explain that difference in isotope compositions, scientists have concluded that the MORBs are capturing the isotope signal from pockets of enriched material—the remnants of subducted crust preserved in the mantle.

The question this new study sought to answer is how large those enriched pockets would need to be for their isotope signature to survive the trip to the surface. As magma rises toward the surface, it interacts with the ambient mantle, which would tend to dampen the signal of enriched material in the melt. For their study, Liu and Liang modeled the melting and magma transport processes. They found that in order to produce the different isotope signals between MORBs and abyssal peridotites, the pockets of enriched material at depth would need to be at least one kilometer in size.

“If the length scale of the heterogeneity is too small, the chemical exchange during magma flow would wipe the heterogeneities out,” Liang said. “So in order to produce the composition difference we see, our model shows that the heterogeneity needs to be a kilometer or more.”

The researchers hope their study will add a new perspective to the fine-scale structure of the mantle produced by mantle convection.

“Our contribution here is to give some sense of how large some of these heterogeneities might be,” Liang said. “So the question to the broader community becomes: What might be the deep mantle processes that can produce this?”

Reference:
Boda Liu et al. The prevalence of kilometer-scale heterogeneity in the source region of MORB upper mantle, Science Advances (2017). DOI: 10.1126/sciadv.1701872

Note: The above post is reprinted from materials provided by Brown University.

Going underground: Cambridge digs into the history of geology with landmark exhibition

‘A Geological Map of England and Wales’, 1819, George Bellas Greenough (1778-1855). Credit: University of Cambridge

A box full of diamonds, volcanic rock from Mount Vesuvius, and the geology guide that Darwin packed for his epic voyage on the Beagle will go on display in Cambridge this week as part of the first major exhibition to celebrate geological map-making.

Uncovering how the ground beneath our feet was mapped for the first time – and revealing some of the controversies and tragedies geology brought to the surface of intellectual debate, Landscapes Below opens to the public on Friday, November 24, at Cambridge University Library.

Featuring the biggest-ever object (1.9mx1.6m) to go on display at the Library: George Bellas Greenough’s 1819 A Geological Map of England and Wales (the first map produced by the Geological Society of London), as well as a visually stunning collection of maps from the earliest days of geology – the exhibition explores how these new subterranean visions of the British landscape influenced our understanding of the Earth. All the maps belonging to the library are going on display for the first time.

“I think the maps are beautiful objects, tell fascinating stories and frame geology in a new light,” said exhibition curator Allison Ksiazkiewicz. “This was a new take on nature and a new way of thinking about the landscape for those interested in nature.

“We show how the early pioneers of this new science wrestled with the ideas of a visual vocabulary – and how for the first time people were encouraged to think about the secretive world beneath their feet.”

As well as maps, Landscapes Below also brings together an extraordinary collection of fossils, artworks and a collection of 154 diamonds, on loan from the Sedgwick Museum of Earth Sciences. Displayed together for the first time, the diamonds were collected, arranged, and produced by Jacques Louis, Comte de Bournon who later became the Keeper of the Royal Mineral Collection for King Louis XVIII.

Another important exhibit on display for the first time is the first edition of George Cuvier and Alexandre Brongniart’s Researches on the Fossil Bones of Quadrupeds (1811), on loan from Trinity College. It examined the geology of the Paris Basin and revolutionised what was considered ‘young’ in geological terms.

Artists were also keen to accurately depict the geological landscape. After surviving Captain Cook’s ill-fated third voyage of discovery, artist, John Webber returned to England and travelled around the country painting landscapes and geological formations, as seen in Landscape of Rocks in Derbyshire. Christopher Packe’s A New Philosophico-Chorographical Chart of East-Kent (1743), on loan from the Geological Society of London, is a remarkable, engraved map that draws on early modern medicine in the interpretation of the surrounding landscape.

“The objects we’re putting on display show the many different applications of geological knowledge,” added Ksiazkiewicz. “Whether it’s a map showing the coal fields of Lancashire in the 1830s – or revealing how this new science was used for economic and military reasons.”

In many ways, the landscapes the earliest geologists worked among became battlegrounds as a scientific old guard – loyal to the established pursuits of mineralogy and chemistry – opposed a new generation of scientists intent on using the fossil record in the study of the Earth’s age and formation.

Exhibitions Officer Chris Burgess said: “Maps were central to the development of geology but disagreement between its leading figures was common. Maps of the period did not just show new knowledge but represented visible arguments about how that knowledge should be recorded.”

The exhibition also includes objects from those with rather tragic histories, including William Smith – whose famous 1815 Geological Map of England has been described as the ‘Magna Carta of geology’. Despite publishing the world’s first geological map (which is still used as the basis of such maps today), Smith was shunned by the scientific community for many years, became a bankrupt, and ended up in debtors’ prison.

John MacCulloch, who produced the Geological Map of Scotland, did not live to see his work published after his honeymoon carriage overturned and killed him at the age of 61. He spent 15 summers surveying Scotland, after convincing the Board of Ordnance to sponsor the project. There was some dispute about how MacCulloch calculated his mileage and spent the funds, and the Ordnance only paid for six summers’ worth of work. Five summers were paid for by the Treasury and four from his own pocket.

Added Ksiazkiewicz: “Not only do these maps and objects represent years of work by individuals looking to develop a new science of the Earth, they stir the imagination. You can imagine yourself walking across the landscape and absorbing all that comes with it – views, antiquities, fossils, and vegetation. And weather, there’s always weather.”

Landscapes Below runs from November 25, 2017 to March 29, 2018 at Cambridge University Library’s Milstein Exhibition Centre. Admission is free. Opening times are Mon-Fri 9am-6pm and Saturday 9am-16.30pm. Closed Sundays.

Note: The above post is reprinted from materials provided by University of Cambridge.

Climate change could increase volcano eruptions

Tephras -- rock fragments and particles ejected by a volcanic eruption.
Tephras — rock fragments and particles ejected by a volcanic eruption. Credit: Image courtesy of University of Leeds

Shrinking glacier cover could lead to increased volcanic activity in Iceland, warn scientists.

A new study, led by the University of Leeds, has found that there was less volcanic activity in Iceland when glacier cover was more extensive and as the glaciers melted volcanic eruptions increased due to subsequent changes in surface pressure.

Dr Graeme Swindles, from the School of Geography at Leeds, said: “Climate change caused by humans is creating rapid ice melt in volcanically active regions. In Iceland, this has put us on a path to more frequent volcanic eruptions.”

The study examined Icelandic volcanic ash preserved in peat deposits and lake sediments and identified a period of significantly reduced volcanic activity between 5,500 and 4,500 years ago. This period came after a major decrease in global temperature, which caused glacier growth in Iceland.

The findings, published in the journal Geology, found there was a time lag of roughly 600 years between the climate event and a noticeable decrease in the number of volcanic eruptions. The study suggests that perhaps a similar time lag can be expected following the more recent shift to warmer temperatures.

Iceland’s volcanic system is in process of recovering from the ‘Little Ice Age’ — a recorded period of colder climate roughly between the years 1500 to 1850. Since the end of the Little Ice Age, a combination of natural and human caused climate warming is causing Icelandic glaciers to melt again.

Dr Swindles said: “The human effect on global warming makes it difficult to predict how long the time lag will be but the trends of the past show us more eruptions in Iceland can be expected in the future.

“These long term consequences of human effect on the climate is why summits like COP are so important. It is vital to understand how actions today can impact future generations in ways that have not been fully realised, such as more ash clouds over Europe, more particles in the atmosphere and problems for aviation. ”

Icelandic volcanism is controlled by complex interactions between rifts in continental plate boundaries, underground gas and magma build-up and pressure on the volcano’s surface from glaciers and ice. Changes in surface pressure can alter the stress on shallow chambers where magma builds up.

Study co-author, Dr Ivan Savov, from the School of Earth & Environment at Leeds, explains: “When glaciers retreat there is less pressure on Earth’s surface. This can increase the amount of mantle melt as well as affect magma flow and how much magma the crust can hold.

“Even small changes in surface pressure can alter the likelihood of eruptions at ice-covered volcanos.”

Reference:
Graeme T. Swindles, Elizabeth J. Watson, Ivan P. Savov, Ian T. Lawson, Anja Schmidt, Andrew Hooper, Claire L. Cooper, Charles B. Connor, Manuel Gloor, Jonathan L. Carrivick. Climatic control on Icelandic volcanic activity during the mid-Holocene. Geology, 2017; DOI: 10.1130/G39633.1

Note: The above post is reprinted from materials provided by University of Leeds.

Mysterious deep-Earth seismic signature explained

The movement of seismic waves through the material of the mantle allows scientists to image Earth's interior, just as a medical ultrasound allows technicians to look inside a blood vessel
The movement of seismic waves through the material of the mantle allows scientists to image Earth’s interior, just as a medical ultrasound allows technicians to look inside a blood vessel. Image is courtesy of Edward Garnero and Allen McNamara’s 2008 Science paper Structure and Dynamics of Earth’s Lower Mantle, provided with Garnero’s permission. Credit: Edward Garnero and Allen McNamara

New research on oxygen and iron chemistry under the extreme conditions found deep inside the Earth could explain a longstanding seismic mystery called ultralow velocity zones. Published in Nature, the findings could have far-reaching implications on our understanding of Earth’s geologic history, including life-altering events such as the Great Oxygenation Event, which occurred 2.4 billion years ago.

Sitting at the boundary between the lower mantle and the core, 1,800 miles beneath Earth’s surface, ultralow velocity zones (UVZ) are known to scientists because of their unusual seismic signatures. Although this region is far too deep for researchers to ever observe directly, instruments that can measure the propagation of seismic waves caused by earthquakes allow them to visualize changes in Earth’s interior structure; similar to how ultrasound measurements let medical professionals look inside of our bodies.

These seismic measurements enabled scientists to visualize these ultralow velocity zones in some regions along the core-mantle boundary, by observing the slowing down of seismic waves passing through them. But knowing UVZs exist didn’t explain what caused them.

However, recent findings about iron and oxygen chemistry under deep-Earth conditions provide an answer to this longstanding mystery.

It turns out that water contained in some minerals that get pulled down into the Earth due to plate tectonic activity could, under extreme pressures and temperatures, split up—liberating hydrogen and enabling the residual oxygen to combine with iron metal from the core to create a novel high-pressure mineral, iron peroxide.

Led by Carnegie’s Ho-kwang “Dave” Mao, the research team believes that as much as 300 million tons of water could be carried down into Earth’s interior every year and generate deep, massive reservoirs of iron dioxide, which could be the source of the ultralow velocity zones that slow down seismic waves at the core-mantle boundary.

To test this idea, the team used sophisticated tools at Argonne National Laboratory to examine the propagation of seismic waves through samples of iron peroxide that were created under deep-Earth-mimicking pressure and temperature conditions employing a laser-heated diamond anvil cell. They found that a mixture of normal mantle rock with 40 to 50 percent iron peroxide had the same seismic signature as the enigmatic ultralow velocity zones.

For the research team, one of the most-exciting aspects of this finding is the potential of a reservoir of oxygen deep in the planet’s interior, which if periodically released to the Earth’s surface could significantly alter the Earth’s early atmosphere, potentially explaining the dramatic increase in atmospheric oxygen that occurred about 2.4 billion years ago according to the geologic record.

“Finding the existence of a giant internal oxygen reservoir has many far-reaching implications,” Mao explained. “Now we should reconsider the consequences of sporadic oxygen outbursts and their correlations to other major events in the Earth’s history, such as the banded-iron formation, snowball Earth, mass extinctions, flood basalts, and supercontinent rifts.”

Reference:
Hydrogen-bearing iron peroxide and the origin of ultralow-velocity zones, Nature (2017). DOI:10.1038/nature24461

Note: The above post is reprinted from materials provided by Carnegie Institution for Science.

How the Earth stops high-energy neutrinos in their tracks

This image shows a visual representation of one of the highest-energy neutrino detections superimposed on a view of the IceCube Lab at the South Pole
This image shows a visual representation of one of the highest-energy neutrino detections superimposed on a view of the IceCube Lab at the South Pole. Credit: IceCube Collaboration

For the first time, a science experiment has measured Earth’s ability to absorb neutrinos — the smaller-than-an-atom particles that zoom throughout space and through us by the trillions every second at nearly the speed of light. The experiment was achieved with the IceCube detector, an array of 5,160 basketball-sized sensors frozen deep within a cubic kilometer of very clear ice near the South Pole. The results of this experiment by the IceCube collaboration, which includes Penn State physicists, will be published in the online edition of the journal Nature on November 22, 2017.

“This achievement is important because it shows, for the first time, that very-high-energy neutrinos can be absorbed by something — in this case, the Earth,” said Doug Cowen, professor of physics and astronomy & astrophysics at Penn State. The first detections of extremely-high-energy neutrinos were made by IceCube in 2013, but a mystery remained about whether any kind of matter could truly stop a neutrino’s journey through space. “We knew that lower-energy neutrinos pass through just about anything,” Cowen said, “but although we had expected higher-energy neutrinos to be different, no previous experiments had been able to demonstrate convincingly that higher-energy neutrinos could be stopped by anything.”

The results in the Nature paper are based on one year of data from about 10,800 neutrino-related interactions. Cowen and Tyler Anderson, an assistant research professor of physics at Penn State, are members of the IceCube collaboration. They are coauthors of the Nature paper who helped to build the IceCube detector and are contributing to its maintenance and management.

This new discovery with IceCube is an exciting addition to our deepening understanding of how the universe works. It also is a little bit of a disappointment for those who hope for an experiment that will reveal something that cannot be explained by the current Standard Model of Particle Physics. “The results of this Ice Cube study are fully consistent with the Standard Model of Particle Physics — the reigning theory that for the past half century has described all the physical forces in the universe except gravity,” Cowen said.

Neutrinos first were formed at the beginning of the universe, and they continue to be produced by stars throughout space and by nuclear reactors on Earth. “Understanding how neutrinos interact is key to the operation of IceCube,” explained Francis Halzen, principal investigator for the IceCube Neutrino Observatory and a University of Wisconsin-Madison professor of physics. “We were of course hoping for some new physics to appear, but we unfortunately find that the Standard Model, as usual, withstands the test,” Halzen said.

IceCube’s sensors do not directly observe neutrinos, but instead measure flashes of blue light, known as Cherenkov radiation, emitted after a series of interactions involving fast-moving charged particles that are created when neutrinos interact with the ice. By measuring the light patterns from these interactions in or near the detector array, IceCube can estimate the neutrinos’ energies and directions of travel. The scientists found that the neutrinos that had to travel the farthest through Earth were less likely to reach the detector.

Most of the neutrinos selected for this study were more than a million times more energetic than the neutrinos produced by more familiar sources, like the Sun or nuclear power plants. The analysis also included a small number of astrophysical neutrinos, which are produced outside the Earth’s atmosphere, from cosmic accelerators unidentified to date, perhaps associated with supermassive black holes.

“Neutrinos have quite a well-earned reputation of surprising us with their behavior,” says Darren Grant, spokesperson for the IceCube Collaboration, a professor of physics at the University of Alberta in Canada, and a former postdoctoral scholar at Penn State. “It is incredibly exciting to see this first measurement and the potential it holds for future precision tests.”

In addition to providing the first measurement of the Earth’s absorption of neutrinos, the analysis shows that IceCube’s scientific reach extends beyond its core focus on particle physics discoveries and the emerging field of neutrino astronomy into the fields of planetary science and nuclear physics. This analysis also is of interest to geophysicists who would like to use neutrinos to image the Earth’s interior in order to explore the boundary between the Earth’s inner solid core and its liquid outer core.

“IceCube was built to both explore the frontiers of physics and, in doing so, possibly challenge existing perceptions of the nature of universe. This new finding and others yet to come are in that spirt of scientific discovery,” said James Whitmore, program director in the National Science Foundation’s physics division. Physicists now hope to repeat the study using an expanded, multiyear analysis of data from the full 86-string IceCube array, and to look at higher ranges of neutrino energies for any hints of new physics beyond the Standard Model.

Reference:
M. G. Aartsen et al. Measurement of the multi-TeV neutrino interaction cross-section with IceCube using Earth absorption. Nature, 2017; DOI: 10.1038/nature24459

Note: The above post is reprinted from materials provided by Penn State.

Water cooling for the Earth’s crust

The hydrothermal circulation changes the ocean crust and increases the Chlorine (CL) concentration of the rocks by incorporation of sea water
The hydrothermal circulation changes the ocean crust and increases the Chlorine (CL) concentration of the rocks by incorporation of sea water. The magma takes up parts of this crust leading to an increase of chlorine of the magma. If the magma erupts at the sea floor, basalt lava is formed that we sampled and investigated in detail. Credit: GEOMAR

How deep can seawater penetrate through cracks and fissures into the seafloor? By applying a new analysis method, an international team of researchers has now discovered that the water can penetrate to depths of more than 10 kilometers below the seafloor. This result suggests a stronger cooling effect on the hot mantle.

Hot vents in the deep sea and geysers on land document the penetration of water into the hot interior of the Earth. This happens primarily in regions where the crust breaks up and magma chambers are close to the surface, e.g. in the area of mid-ocean ridges. But how deep does the water penetrate and cool the upper part of the hot mantle? So far it has been assumed that this process only reaches depths of a few kilometres. A new analytical method, developed at GEOMAR Helmholtz Centre for Ocean Research Kiel, now shows that water penetrates much deeper into the Earth than previously thought.

“Chlorine is the key element in our investigations,” explains Dr. Froukje van der Zwan, first author of the GEOMAR study. “We were able to detect this indicator for seawater in basalt rock even in very low concentrations,” van der Zwan continues. In her PhD thesis, she developed a new method to study chlorine levels in rock samples collected at the Southern Mid-Atlantic Ridge and Gakkel Ridge in Central Arctic. In addition, a chemical analysis of selected crystals in the rocks samples also allowed the depth at which the chlorine was incorporated into the rock to be determined.

“For our analyses, we had to push the electron-beam microprobe to its limits. It is a special scanning electron microscope, to which spectrometers are attached for the quantitative analysis of major, minor and trace element concentration,” van der Zwan explains. The microprobe, as well as other necessary devices, were available at GEOMAR. Furthermore, with the results of this study, the authors were able to verify theoretical models that were developed at GEOMAR.

“So far, it has been assumed that high pressure and temperatures prevented water from penetrating below 10 kilometres,” says Prof. Dr. Colin Devey, co-author of the GEOMAR study. “We can now show that the water penetrates much deeper,” Devey continues. This finding is important for the cooling of the oceanic crust and its heat budget, as well as for the total level of volatiles in the oceanic crust, which are later subducted and recycled into the mantle.

Reference:
Froukje M. van der Zwan, Colin W. Devey, Thor H. Hansteen, Renat R. Almeev, Nico Augustin, Matthias Frische, Karsten M. Haase, Ali Basaham, Jonathan E. Snow. Lower crustal hydrothermal circulation at slow-spreading ridges: evidence from chlorine in Arctic and South Atlantic basalt glasses and melt inclusions. Contributions to Mineralogy and Petrology, 2017; 172 (11-12) DOI: 10.1007/s00410-017-1418-1

Note: The above post is reprinted from materials provided by Helmholtz Centre for Ocean Research Kiel (GEOMAR).

Ice shapes the landslide landscape on Mars

This image from NASA's Mars Curiosity rover shows the Amargosa Valley, on the slopes leading up to Mount Sharp on Mars
This image from NASA’s Mars Curiosity rover shows the Amargosa Valley, on the slopes leading up to Mount Sharp on Mars. Credit: NASA / JPL-Caltech / MSSS

How good is your Martian geography? Does Valles Marineris ring a bell? This area is known for having landslides that are among the largest and longest in the entire solar system. They make the perfect object of study due to their steep collapse close to the scarp, extreme thinning, and long front runout. In a new research paper published in EPJ Plus, Fabio De Blasio and colleagues from Milano-Bicocca University, Italy, explain the extent to which ice may have been an important medium of lubrication for landslides on Mars. This can in turn help us understand the geomorphological history of the planet and the environment of deposition.

The authors noted that the landslides in Valles Marineris are of similar shape as ice-lubricated landslides on Earth. In their paper, they feed these observations, combined with remote sensing measurements showing the presence of massive ice under the soil, into a numerical simulation exploring the possibility that such landslides were lubricated by ice.

They then explore two possible scenarios to explain what happens to landslides rocks: one in which ice is only present at the base, and another in which ice impregnates the soil. To reproduce the vertical collapse of landslide material in the landslide scarp area and the extreme thinning and runout in the front, the model must take into account the presence of ice in the calculations.

The authors, therefore, demonstrate how the presence of ice, exposed on the ground or in the collapsing slope, could affect the shape and velocity of these landslides. The calculated velocity of landslides are often well in excess of 100 m/s and up to 200 m/s at peak. The authors then compare the results of the numerical simulations with real images and elevation profiles, allowing them to draw conclusions regarding the influence of the climate on shaping Martian landscapes.

Reference:
Fabio Vittorio De Blasio, Giovanni Battista Crosta. Modelling Martian landslides: dynamics, velocity, and paleoenvironmental implications. The European Physical Journal Plus, 2017; 132 (11) DOI: 10.1140/epjp/i2017-11727-x

Note: The above post is reprinted from materials provided by Springer.

Water On Mars? : Previous evidence of water on Mars now identified as grainflows

This HiRISE image cutout shows Recurring Slope Lineae in Tivat crater on Mars in enhanced color
This HiRISE image cutout shows Recurring Slope Lineae in Tivat crater on Mars in enhanced color. The narrow, dark flows descend downhill (towards the upper left). Analysis shows that the flows all end at approximately the same slope, which is similar to the angle of repose for sand. Credit: NASA/JPL/University of Arizona/USGS

Dark features previously proposed as evidence for significant liquid water flowing on Mars have now been identified as granular flows, where sand and dust move rather than liquid water, according to a new article published in Nature Geoscience by the U.S. Geological Survey.

These new findings indicate that present-day Mars may not have a significant volume of liquid water. The water-restricted conditions that exist on Mars would make it difficult for Earth-like life to exist near the surface of the planet.

Scientists from the USGS, the University of Arizona, Durham University (England) and the Planetary Science Institute analyzed narrow, down-slope trending surface features on Mars that are darker than their surroundings, called Recurring Slope Lineae, or RSL. These RSL features grow incrementally, fade when inactive and recur annually during the warmest time of year on Mars. RSL are mostly found on steep rocky slopes in dark regions of Mars, such as the southern mid-latitudes, Valles Marineris near the equator, and in Acidalia Planitia on the northern plains. The appearance and growth of these features resemble seeping liquid water, but how they form remains unclear, and this research demonstrated that the RSL flows seen by HiRISE are likely moving granular material like sand and dust.

“We’ve thought of RSL as possible liquid water flows, but the slopes are more like what we expect for dry sand,” said USGS scientist and lead author Colin Dundas. “This new understanding of RSL supports other evidence that shows that Mars today is very dry.”

The terminal end of the RSL slopes, said Dundas, are identical to the slopes of sand dunes where movement is caused by dry granular flows. Water almost certainly is not responsible for this behavior, which would require the volume of liquid to correspond to the length of slope available, producing more liquid on longer slopes. Instead, the 151 RSL examined by the study authors all end on similar slopes despite very different lengths. Additionally, said the scientists, water is unlikely to be produced only near the tops of slopes at these angles and if it were, it should be able to flow onto lower slopes.

This new research finds that these RSL features are flows of granular material and thus, align with the long-standing hypothesis that the surface of Mars lacks flowing water. Small amounts of water could still be involved in their initiation in some fashion, as hydrated minerals have been detected at some RSL locations. The authors conclude that liquid on present-day Mars may be limited to traces of dissolved moisture from the atmosphere and thin films of water.

Reference:
Colin M. Dundas, Alfred S. McEwen, Matthew Chojnacki, Moses P. Milazzo, Shane Byrne, Jim N. McElwaine, Anna Urso. Granular flows at recurring slope lineae on Mars indicate a limited role for liquid water. Nature Geoscience, 2017; DOI: 10.1038/s41561-017-0012-5

Note: The above post is reprinted from materials provided by US Geological Survey.

Moon’s crust underwent resurfacing after forming from magma ocean

Moon crust formation graphic.
Moon crust formation graphic. Credit: The University of Texas at Austin/Jackson School of Geosciences

The Earth’s Moon had a rough start in life. Formed from a chunk of the Earth that was lopped off during a planetary collision, it spent its early years covered by a roiling global ocean of molten magma before cooling and forming the serene surface we know today.

A research team led by The University of Texas at Austin Jackson School of Geosciences took to the lab to recreate the magmatic melt that once formed the lunar surface and uncovered new insights on how the modern moonscape came to be. Their study shows that the Moon’s crust initially formed from rock floating to the surface of the magma ocean and cooling. However, the team also found that one of the great mysteries of the lunar body’s formation – how it could develop a crust composed of just one mineral – cannot be explained by the initial crust formation and must have been the result of some secondary event.

The results were published on Nov. 21 in the Journal for Geophysical Research: Planets.

“It’s fascinating to me that there could be a body as big as the Moon that was completely molten,” said Nick Dygert, an assistant professor at the University of Tennessee, Knoxville who led the research while a postdoctoral researcher in the Jackson School’s Department of Geological Sciences. “That we can run these simple experiments, in these tiny little capsules here on Earth and make first order predictions about how such a large body would have evolved is one of the really exciting things about mineral physics.”

Dygert collaborated with Jackson School Associate Professor Jung-Fu Lin, Professor James Gardner and Ph.D. student Edward Marshall, as well as Yoshio Kono, a beamline scientist at the Geophysical Laboratory at the Carnegie Institution of Washington.

Large portions of the Moon’s crust are made up of 98 percent plagioclase—a type of mineral. According to prevailing theory, which the study calls into question, the purity is due to plagioclase floating to the surface of the magma ocean over hundreds of millions of years and solidifying into the Moon’s crust. This theory hinges on the magma ocean having a specific viscosity, a term related to the magma’s “gooiness,” that would allow plagioclase to separate from other dense minerals it crystallized with and rise to the top.

Dygert decided to test the plausibility of this theory by measuring the viscosity of lunar magma directly. The feat involved recreating the molten material in the lab by flash melting mineral powders in Moon-like proportions in a high pressure apparatus at a synchrotron facility, a machine that shoots out a concentrated beam of high energy X-rays, and then measuring the time it took for a melt-resistant sphere to sink through the magma.

“Previously, there had not been any laboratory data to support models,” said Lin. “So this is really the first time we have reliable laboratory experimental results to understand how the Moon’s crust and interior formed.”

The experiment found that the magma melt had a very low viscosity, somewhere between that of olive oil and corn syrup at room temperature, a value that would have supported plagioclase flotation. However, it would have also led to mixing of plagioclase with the magma, a process that would trap other minerals in between the plagioclase crystals, creating an impure crust on the lunar surface. Because satellite-based investigations demonstrate that a significant portion of the crust on the Moon’s surface is pure, a secondary process must have resurfaced the Moon, exposing a deeper, younger, purer layer of flotation crust. Dygert said the results support a “crustal overturn” on the lunar surface where the old mixed crust was replaced with young, buoyant, hot deposits of pure plagioclase. The older cruse could have also been eroded away by asteroids slamming into the Moon’s surface.

Dygert said the study’s results exemplify how small-scale experiments can lead to large-scale understanding of geological processes that build planetary bodies in our solar system and others.

“I view the Moon as a planetary lab,” Dygert said. “It’s so small that it cooled quickly, and there’s no atmosphere or plate tectonics to wipe out the earliest processes of planetary evolution. The concepts described here could be applicable to just about any planet.”

Reference:
Nick Dygert et al, A Low Viscosity Lunar Magma Ocean Forms a Stratified Anorthitic Flotation Crust With Mafic Poor and Rich Units, Geophysical Research Letters (2017). DOI: 10.1002/2017GL075703

Note: The above post is reprinted from materials provided by University of Texas at Austin.

How Rivers Resist Erosion

Riverbed armor
The surface of riverbeds tend to be covered with relatively large rocks, a protection against erosion. Penn geophysicists used a concept from granular physics to explain why this is the case. Credit: Frank Garvock

Pop the top off a can of mixed nuts and, chances are, Brazil nuts will be at the top. This phenomenon, of large particles tending to rise to the top of mixtures while small particles tend to sink down, is popularly known as the “Brazil nut effect” and more technically as granular segregation.

Look down at the top of a riverbed and it’s easy to draw a parallel: the top of a riverbed is typically lined with larger cobbles, while finer sand and small gravel particles make up the deeper layers.

Physicists concerned with particle movement have given a lot of thought to the mechanics by which particles sort in these types of scenarios, but that research has not been translated to earth science until now. In a new study, geophysicists from the University of Pennsylvania found that granular segregation helps explain the tendency of riverbeds to be lined by, or “armored” with, a layer of relatively larger particles.

Published in the journal Nature Communications, the findings enhance understanding of how riverbeds form, with implications for how rivers may also erode. But the research also makes new insights into the fundamental physics of particle segregation, which apply to all sorts of granular materials, from riverbeds and soils to industrial and pharmaceutical substances.

“There has been this granular segregation phenomenon that has been studied for decades,” said Douglas J. Jerolmack, associate professor in the Department of Earth and Environmental Science in Penn’s School of Arts and Sciences, “and then there’s this separate explanation by geologists and engineers about why riverbeds get a coarse layer on the surface, and the two had never met before. Our major contribution here is really taking the granular physics understanding of the segregation of particles — how big particles segregate and move up to the surface — and introducing it to the river problem.”

Jerolmack collaborated on the work with postdoctoral researchers Behrooz Ferdowsi, now at Princeton University; Carlos P. Ortiz, now at Deloitte Consulting; and Morgane Houssais, now at the City University of New York. Riverbed armoring is seen almost universally and is understood to be a way that rivers prevent excessive erosion.

“We call this armoring because the larger particles are like an armor that protects the riverbed underneath from getting eroded,” Jerolmack said. “If there are big cobbles that are lining the riverbed, then I’ll need a big flood in order to move them.”

Geologists have generally thought that fluid mechanics controls this pattern. The river water would wash away the finer particles, leaving the larger particles behind.

But the Penn-led team recognized that this explanation failed to conceive of the riverbed as a granular system, which would also be subject to the Brazil nut effect, not just the shear force of water.

To see if granular segregation did apply in a fluid system, the researchers turned to a laboratory stand-in for a river: a doughnut-shaped channel filled with large and small spherical particles. The lid of the channel pushes the fluid atop the particles, replicating the flow of a river.

As they had shown in an earlier study, particles move along the riverbed by two mechanisms: those at the top are pushed by the flow of liquid, while those deeper down creep along slowly due to the interaction among particles.

In the new work, the Penn team wanted to understand how these particles moved not just horizontally but also vertically in the bed.

Using their custom-built channel and fluid embedded with a fluorescent dye, Jerolmack and colleagues were able to scan through the entire depth of the channel and visualize the entire plane of particles, even those buried under several dozen other particles.

“It’s almost like taking an X-ray of our granular sample but with a laser and photographs,” Jerolmack said.

With the help of a software program, they were able to then track the horizontal and vertical positions of all of these particles through time. And they saw the Brazil nut effect in action.

“In this laboratory experiment of a very simplified river,” Jerolmack said, “we saw that, when we have a liquid pushing grains on the riverbed, those grains push grains underneath them that push grains that are underneath them and so on, and it creates this jostling motion that allows large particles to kind of float up. So we confirmed that this general behavior that is seen in granular systems seems to also occur in rivers.”

Another major finding, confirmed by computer simulations that account for the friction felt by each particle in the riverbed, was that this segregation of particles by size played out in two stages. In the first, the larger particles near the surface of the riverbed moved up, while those packed in the deeper parts of the bed appeared to remain almost motionless. But in a second stage, these creeping, deeper grains began to sort, the large ones occasionally getting sucked up into the faster flowing particles toward the top of the river bed and jostling upward.

“Basically no one had gone looking to see if exceedingly slow-moving granular materials contributed to segregation,” Jerolmack said. “The observation that we did see segregation happening, that coarse particles were moving up from this creeping layer, is brand new to science and also has all sorts of implications. It might explain how we see segregation happening in slow-moving places like soils on a hillside, where we tend to find coarse particles at the surface, despite there being no fluid force moving over them.”

Researchers have found it difficult to predict when rivers erode, or when hillsides dissolve into landslides, and these findings may help explain why these predictions have proved so elusive.

“We’ve been working on these problems for 100 years, and we still can’t predict with much certainty what fluid force is going to cause grains to start eroding,” Jerolmack said. “And that point changes through time. River-engineering projects, bridges and buildings all rely on estimates of the erosion threshold. I think we need to start from scratch with a new framework that incorporates granular physics.”

While these experiments and simulations can’t provide an exact replication for the complex conditions seen in rivers, such as turbulence, Jerolmack notes that the findings point to a need for integrating earth science with fundamental physics research to advance knowledge in both spheres.

“Our inability to predict when erosion will occur, our inability to predict when a slow, oozing pile of dirt on a hill will suddenly become a landslide, is because we are up against our limit of the fundamental understanding of how disordered materials behave,” Jerolmack said. “We need to advance our understanding of fundamental physics of disordered materials in order to have any shot at making predictions in the earth-materials realm. And this is one problem where I think we’ve made a start at doing that.

“Penn is an ideal place to do this,” he said. “Here there are a large number of physicists and engineers with a broad and interdisciplinary view of materials science. Collaborations facilitated by the Materials Research Science and Engineering Center have made this kind of work possible.”

The study was supported by the United States Army Research Office (Grant 64455EV) and National Science Foundation (grants EAR-1224943, EAR-1344280 and DMR-1120901).

Reference:
Behrooz Ferdowsi, Carlos P. Ortiz, Morgane Houssais, Douglas J. Jerolmack. River-bed armouring as a granular segregation phenomenon. Nature Communications, 2017; 8 (1) DOI: 10.1038/s41467-017-01681-3

Note: The above post is reprinted from materials provided by University of Pennsylvania.

High-latitude volcanic eruptions have global impact

Photo of early stages of the eruption of the Sarychev on June 12, 2009
Photo of early stages of the eruption of the Sarychev on June 12, 2009. Image from the International Space Station of. Image courtesy of Earth Sciences and Image Analysis Laboratory, National Aeronautics and Space Administration (NASA) Johnson Space Center. NASA Photo ID: ISS020-E-9048. Credit: NASA

Volcanic eruptions emit sulfate aerosols via volcanic plumes, which may stay in the stratosphere for months to years, reflecting sunlight back into space, cooling the Earth’s lower atmosphere or troposphere over a long time period. It is traditionally believed that because of atmospheric circulation patterns, eruptions in the tropics could have an effect on the climate in both hemispheres while eruptions at mid or high latitudes only have impact over the hemisphere where they erupt.

“Well, it is not always the case,” says Dr. Xue Wu, the corresponding author of a recently published study in Atmospheric Chemistry and Physics. “We have found evidence showing that a high-latitude volcano can enhance the aerosol layer in the tropical stratosphere, and also have impact on the climate of both hemispheres.”

WU is from the Key Laboratory of Middle Atmosphere and Global Environment Observation (LAGEO), Institute of Atmospheric Physics, Chinese Academy of Sciences. She worked with Dr. Sabine Griessbach and Dr. Lars Hoffmann from Jülich supercomputing center, Forschungszentrum Jülich, Germay on a high-latitude volcanic eruption case. They used the Lagrangian particle dispersion model—MPTRAC and multi-source satellite observations to study the transport of volcanic aerosol from the high-latitude volcanic eruption Sarychev (48°N, 153°E).

The study revealed that when the Sarychev volcano erupted in June 2009, the Asian summer monsoon (ASM) anticyclonic circulation was developing. The anticyclonic circulation facilitated the meridional transport of aerosols from the extratropical upper troposphere/lower stratosphere to the tropical tropopause region. Then, the aerosols ascended slowly in the upward branch of the Brewer-Dobson circulation (BDC), the primary circulation in the stratosphere, and dispersed with the poleward branches of the BDC to both hemispheres. With the help of the ASM anticyclonic circulation, this high-latitude volcanic eruption will not only influence the climate in the northern hemisphere where the Sarychev located, but also have impact on the southern hemisphere, just as a tropical eruption does.

Based on their calculation, although there was only about 4 percent of the total SO2 from the Sarychev eruption (1.2±0.2106 tons) transported to the tropical stratosphere, it would result in 6 ±1104 tons of sulfate aerosol, which is several times higher than the 1.5-2104 tons per year required to explain the increase trend of the tropical stratospheric aerosol. On the contrary, if the Sarychev erupted in winter, the aerosol would be confined to the polar side of the strong subtropical jets, deposited or be washed out from the atmosphere in a relatively short time.

WU says, “It’s all about timing. If a high-latitude volcano erupts when the ambient atmospheric conditions are favorable for transport, it is well worth more attention.”

In the past decade, the Sarychev eruption in 2009 was not the only case of the ASM circulation transporting sulfate aerosol to the tropical stratosphere. “We may expect more in the future,” says Wu.

Reference:
Xue Wu et al, Equatorward dispersion of a high-latitude volcanic plume and its relation to the Asian summer monsoon: a case study of the Sarychev eruption in 2009, Atmospheric Chemistry and Physics (2017). DOI: 10.5194/acp-17-13439-2017

Note: The above post is reprinted from materials provided by Chinese Academy of Sciences.

First Recorded Fossil of Dipteronia in East Asia Reported from Yunnan

Fossil of Dipteronia brownii and extant Dipteronia browni
Fossil of Dipteronia brownii and extant Dipteronia browni. Credit: DING Wenna

Dipteronia (Sapindaceae) is an ancient relictual woody genus in East Asia and is endemic to southern and central China with two extant species: Dipteronia sinensis and Dipteronia dyeriana.

Compared to its modern restricted distribution, Dipteronia was present in the Far East and North America during the Palaeogene. However, when Dipteronia migrated to China and where it came from were still unknown due to the lacking fossil record.

In a new study published in Review of Palaeobotany and Palynology, researchers from Paleoecology Group of Xishuangbanna Tropical Botanical Garden (XTBG) of the Chinese Academy of Sciences present a newly discovered fossil occurrence of Dipteronia fruits from the early Oligocene (about 33.9 million to 23 million years ago) of Yunnan, southwestern China.

They collected fossil dicotyledonous leaves and two winged fruits of Dipteronia in lacustrine mudstones near Lühe Town (25°8.5′N, 101°22.5′E,), Chuxiong Yi Autonomous Prefecture, Yunnan Province.

They studied the fossil fruits morphologically and compared with both extant and fossil representatives of Dipteronia.

The fossils show combined characteristics of Dipteronia sinensis and Dipteronia brownii and fall within the range of morphological variability of D. brownii. Therefore, the researchers adopt a broad circumscription and assign their fossils to D. brownii.

Dipteronia fruit fossils fall within the range of variation in general size and shape of Dipteronia sinensis, which demonstrates that the genus has retained its unique fruit morphology since the Palaeogene.

Therefore, the central and southern regions of China, which experienced relative tectonic and climatic stability, provided suitable habitats for these palaeoendemic taxa

The new fossil discovery suggests that the palaeoendemic genus Dipteronia was widely distributed in North America and Asia during the Palaeogene, and had existed in southwestern China by the Rupelian.

Reference:
An early Oligocene occurrence of the palaeoendemic genus Dipteronia (Sapindaceae) from Southwest China. DOI: 10.1016/j.revpalbo.2017.11.002

Note: The above post is reprinted from materials provided by Chinese Academy of Sciences.

A seismometer is able to detect the earth shacking generated by human activity in the city

Seismic record captured by the seismometer installed in the ICTJA-CSIC during the Bruce Springsteen concert at Camp Nou on May 14, 2016. The upper panel shows the seismogram, while the lower panel shows the spectrogram where it is possible to see the distribution of the energy between the different frequencies. You can distinguish the different songs of the concert and highlight those performed during the encores towards the end of the concert
Seismic record captured by the seismometer installed in the ICTJA-CSIC during the Bruce Springsteen concert at Camp Nou on May 14, 2016. The upper panel shows the seismogram, while the lower panel shows the spectrogram where it is possible to see the distribution of the energy between the different frequencies. You can distinguish the different songs of the concert and highlight those performed during the encores towards the end of the concert. Credit: Jordi Díaz

The last Bruce Springsteen’s concert in Barcelona was held on May 14, 2016 at the Fc Barcelona Stadium. For more than 3 hours, 65,000 spectators who fulfilled the Camp Nou stadium danced to the sound of the songs performed by “The Boss”. A seismometer installed at the basement of the Institute of Earth Sciences Jaume Almera of the CSIC (ICTJA-CSIC), located just 500 meters from the stadium, recorded the vibrations of the ground caused by coordinated jumping of the audience while dancing Springsteen’s songs. This is one of the cases analyzed by a team of researchers from the ICTJA-CSIC in a study on urban seismology that has been published in the journal Scientific Reports.

In the paper, researchers haves identified the source of some of the signals recorded in recent years by a seismic station installed in the ICTJA building. The authors have verified that the seismometer has been able to detect the earth shacking generated by phenomena linked to human activity such as the subway activity, traffic, the celebration of goals during certain football matches, concerts and even fireworks launched from the vicinity of the Institute.

“Current seismometers are very sensitive devices, and they are able to register all kind of signals. Within the city, human activity produces a large number of detectable vibrations and earth shakings. If we treat and analyze the recorded seismic signal we’re able to stablish the source which originated it”, explains the researcher of the ICTJA-CSIC and first author of the study Jordi Díaz that remembers that these vibrations “are imperceptible for humans”.

Díaz remembers that the seismometer was installed in the building with an scientific dissemination purpose. “Over the years we have seen that the station registered curious and weird seismic signals. This led us to ask ourselves about their causes “says the ICTJA-CSIC researcher.

Traffic, subway and soccer matches

The paper shows how the seismometer installed in the ICTJA-CSIC building is able to detect the traffic activity in the nearby Diagonal Avenue, one of the main Barcelona’s traffic entrance. Diaz says that “the signal shows the evolution of traffic throughout the week and between daytime and nighttime. We can see that the peaks occur mainly in rush hours. The signal shows the decrease of the traffic activity during the nighttime and in weekends”.

According to the article, the seismometer can also record the vibrations induced by tube trains along a subway line running beneath Diagonal Avenue (L3). “The Institute is located at a distance about 150 meters from the “Palau Reial” subway station so we can detect the individual passage of each train,” says Jordi Díaz. The authors were able to observe in the recorded signal “the variations in the frequency of the tube trains circulation throughout the day and during the entire week. We could see how the intervals between the peaks of maximum intensity of the seismic signal increase during night and in the weekends “.

The celebrations of the goals during soccer matches held in the Camp Nou can also be registered by the seismic station installed at ICTJA-CSIC. In the paper, the authors have also analyzed the signal generated by the reaction of the public to each of the three goals scored by FC Barcelona in the last 15 minutes of the first leg Champions League semifinals game against Bayern Munich in May 2015.

Díaz considers that the seismic signal recorded during the Bruce Springsteen performance is “one of the most interesting, since it contains a lot of information. The recorded data of earth vibrations also allows us to identify the different songs of the playlist because when the rhythm and intensity of the music change, the way the audience dance also changes “.

According to Diaz, this study evidences that “seismometers can be used as an easy-to-use complementary monitoring tool for certain processes related with the urban environment, such as road traffic or subway activity”.

The researcher considers that it has been ”interesting to see the difference between the vibrations generated by those celebrating a goal in the Camp Nou Stadium from those generated by a crowd dancing during a concert in the same sceneario. This analysis could provide, for example, interesting information to engineers on building’s behaviour “.

Reference:
J. Diaz, M. Ruiz, Pilar S. Sanchez-Pastor, P. Romero, (2017), Urban seismology: on the origin of earth vibrations within a city, Scientific Reports DOI: 10.1038 / s41598-017-15499-y

Note: The above post is reprinted from materials provided by Instituto de Ciencias de la Tierra Jaume Almera (ICTJA). The original article was written by Jordi Díaz.

Seafloor sediments appear to enhance Earthquake and Tsunami danger in Pacific Northwest

The Cascadia Subduction Zone is capable of generating powerful earthquakes.
The Cascadia Subduction Zone is capable of generating powerful earthquakes. The study found compact sediments along the coast of Washington and northern Oregon, a result that suggests that the area could be more prone to producing larger quakes than subduction zone areas farther south with less compact sediments. Adapted from FEMA graphic. Credit: FEMA/Jackson School of Geosciences/UT Austin

The Cascadia Subduction Zone off the coast of the Pacific Northwest has all the ingredients for making powerful earthquakes — and according to the geological record, the region is due for its next “big one.”

A new study led by The University of Texas at Austin has found that the occurrence of these big, destructive quakes and associated devastating tsunamis may be linked to compact sediments along large portions of the subduction zone. In particular, they found that big, destructive quakes may have a better chance of occurring offshore of Washington and northern Oregon than farther south along the subduction zone — although any large quake would impact the surrounding area.

“We observed very compact sediments offshore of Washington and northern Oregon that could support earthquake rupture over a long distance and close to the trench, which increases both earthquake and tsunami hazards,” said lead author Shuoshuo Han, a postdoctoral fellow at the University of Texas Institute for Geophysics (UTIG). UTIG is a research unit of the Jackson School of Geosciences.

The findings, published in Nature Geoscience on Nov. 20, are important for understanding factors that influence earthquake and tsunami generation in Cascadia and at other subduction zones around the world. Researchers from Columbia University and Penn State University also contributed to the study.

Subduction zones are areas where one tectonic plate dives or “subducts” beneath another plate. The world’s most powerful earthquakes are produced at the interface between the two plates. At certain subduction zones, such as those in Cascadia, Sumatra and eastern Alaska, a thick sediment layer overlies the subducting oceanic plate. Some of the sediment is scraped off during subduction and piled up on the top plate, forming a thick wedge of material, while the rest of the sediment travels down with the bottom plate.

How the stress is built up and released at the plate interface is greatly influenced by the degree of compaction of both the sediment wedge and the sediment between the plates. To understand sediment compaction along Cascadia, Han and her collaborators conducted a seismic survey off the coast of Washington and Oregon that allowed the researchers to see up to four miles of sediment layers overlaying the subduction zone. This was accomplished by the using nearly five-mile-long seismic streamers, a scientific tool used to image the seafloor using soundwaves.

“These kinds of long-streamer marine seismic studies provide the best tools available to the science community to efficiently probe subduction zones in high resolution,” said co-author Suzanne Carbotte, a research professor at Columbia University.

Combining the seismic data with measurements from sediment samples previously retrieved from this region through ocean drilling, they found that while the thickness of the incoming sediment is similar offshore of Washington and Oregon, the compaction is very different. Off the coast of Washington and northern Oregon, where almost all of the sediments glom on to the top plate and are incorporated into the wedge, the sediments were tightly packed together without much water in the pore space between the sediment grains — an arrangement that can make the plates more prone to sticking to each other and building up high stress that can be released as a large earthquake. In turn, the compacted sediments could boost the ability of large earthquakes to trigger large tsunamis because the sediments are able to stick and move together during earthquakes. This can boost their ability to move massive amounts of overlying seawater.

“That combination of both storing more stress and the ability for it to propagate farther is important for both generating large earthquakes and for propagating to very shallow depths,” said Nathan Bangs, a senior research scientist at UTIG and study co-author.

The propagation of earthquakes into shallow depths is what causes large tsunamis like the one that followed the Magnitude 9.0 earthquake that struck Tohoku, Japan in 2011.

In contrast, off the coast of central Oregon, the thick layer of subducting sediments are less compact, with water in the pore space between the grains. This arrangement prevents the plates from sticking as much, and allows them to rupture with less stress accumulated-thereby generating smaller earthquakes.

The Cascadia Subduction Zone generates a large earthquake roughly every 200 to 530 years. And with the last large earthquake occurring in 1700, scientists are expecting a large quake to occur in the future, although it’s impossible to pinpoint the timing exactly. The research findings can help scientists understand more about the features that make some areas of subduction zones better earthquake incubators than others.

“The results are consistent with existing constraints on earthquake behavior, offer an explanation for differences in structural style along the margin, and may provide clues about the propensity for shallow earthquake slip in different regions,” said co-author Demian Saffer, a Penn State University professor.

The study was funded by the National Science Foundation.

Reference:
Shuoshuo Han, Nathan L. Bangs, Suzanne M. Carbotte, Demian M. Saffer, James C. Gibson. Links between sediment consolidation and Cascadia megathrust slip behaviour. Nature Geoscience, 2017; DOI: 10.1038/s41561-017-0007-2

Note: The above post is reprinted from materials provided by University of Texas at Austin.

Space dust may transport life between worlds, research suggests

Some of the coldest and darkest dust in space shines brightly in this infrared image from the Herschel Observatory.
Some of the coldest and darkest dust in space shines brightly in this infrared image from the Herschel Observatory. Credit: ESA/NASA/JPL-Caltech

Life on our planet might have originated from biological particles brought to Earth in streams of space dust, a study suggests.

Fast-moving flows of interplanetary dust that continually bombard our planet’s atmosphere could deliver tiny organisms from far-off worlds, or send Earth-based organisms to other planets, according to the research.

The dust streams could collide with biological particles in Earth’s atmosphere with enough energy to knock them into space, a scientist has suggested.

Such an event could enable bacteria and other forms of life to make their way from one planet in the solar system to another and perhaps beyond.

The finding suggests that large asteroid impacts may not be the sole mechanism by which life could transfer between planets, as was previously thought.

The research from the University of Edinburgh calculated how powerful flows of space dust — which can move at up to 70 km a second — could collide with particles in our atmospheric system.

It found that small particles existing at 150 km or higher above Earth’s surface could be knocked beyond the limit of Earth’s gravity by space dust and eventually reach other planets. The same mechanism could enable the exchange of atmospheric particles between distant planets.

Some bacteria, plants and small animals called tardigrades are known to be able to survive in space, so it is possible that such organisms — if present in Earth’s upper atmosphere — might collide with fast-moving space dust and withstand a journey to another planet.

The study, published in Astrobiology, was partly funded by the Science and Technology Facilities Council.

Professor Arjun Berera, from the University of Edinburgh’s School of Physics and Astronomy, who led the study, said: “The proposition that space dust collisions could propel organisms over enormous distances between planets raises some exciting prospects of how life and the atmospheres of planets originated. The streaming of fast space dust is found throughout planetary systems and could be a common factor in proliferating life.”

Reference:
Arjun Berera. Space Dust Collisions as a Planetary Escape Mechanism. Astrobiology, 2017; DOI: 10.1089/ast.2017.1662

Note: The above post is reprinted from materials provided by University of Edinburgh.

Oxygen levels link to ancient explosion of life, researchers find

Trilobite, Ordovician fossils

Oxygen has provided a breath of fresh air to the study of the Earth’s evolution some 400-plus million years ago.

A team of researchers, including a faculty member and postdoctoral fellow from Washington University in St. Louis, found that oxygen levels appear to increase at about the same time as a three-fold increase in biodiversity during the Ordovician Period, between 445 and 485 million years ago, according to a study published Nov. 20 in Nature Geoscience.

“This oxygenation is supported by two approaches that are mostly independent from each other, using different sets of geochemical records and predicting the same amount of oxygenation occurred at roughly the same time as diversification,” said Cole Edwards, the principal investigator of a study conducted when he was a postdoctoral fellow in the lab under the paper’s senior author, David Fike, associate professor in Earth and Planetary Sciences in Arts & Sciences. The other authors are Matthew Saltzman of Ohio State University and Dana Royer of Wesleyan University in Connecticut.

“We made another link between biodiversification and oxygen levels, but this time during the Ordovician where near-modern levels of oxygen were reached about 455 million years ago,” said Edwards, assistant professor in geological and environmental sciences at Appalachian State in Boone, N.C. “It should be stressed that this was probably not the only reason why diversification occurred at that time. It is likely that other changes — such as ocean cooling, increased nutrient supply to the oceans and predation pressures — worked together to allow animal life to diversify for millions of years.”

This explosion of diversity, recognized as the Great Ordovician Biodiversification Event, brought about the rise of various marine life, tremendous change across species families and types, as well as changes to the Earth, starting at the bottom of the ocean floors. Asteroid impacts were among the many disruptions studied as the reasons for such an explosion of change. Edwards, Fike and others wanted to continue to probe the link between oxygen levels in the ocean-atmosphere and diversity levels of animals through deep time.

Estimating such oxygen levels is particularly difficult: There is no way to directly measure the composition of ancient atmospheres or oceans. Time machines exist only in fiction.

Using geochemical proxies, high-resolution data and chemical signatures preserved in carbonate rocks formed from seawater, the researchers were able to identify an oxygen increase during the Middle and Late Ordovician periods — and a rapid rise, at that. They cite a nearly 80-percent increase in oxygen levels where oxygen constituted about 14 percent of the atmosphere during the Darriwilian Stage (Middle Ordovician 460-465 million years ago) and increased to as high as 24 percent of the atmosphere by the mid-Katian (Late Ordovician 450-455 million years ago).

“This study suggests that atmospheric oxygen levels did not reach and maintain modern levels for millions of years after the Cambrian explosion, which is traditionally viewed as the time when the ocean-atmosphere was oxygenated,” Edwards said. “In this research, we show that the oxygenation of the atmosphere and shallow ocean took millions of years, and only when shallow seas became progressively oxygenated were the major pulses of diversification able to take place.”

The chemical signatures that served as proxies for dissolved inorganic carbon included data from geologic settings ranging from the Great Basin in the western United States, to the northern and eastern U.S., to Canada and its Maritimes, as well as Argentina in the Southern Hemisphere and Estonia in the Eastern Hemisphere. Nevada, Utah, Oklahoma, Missouri (New London north and Highway MM south of St. Louis), Iowa, Ohio, West Virginia and Pennsylvania were among the data points across the U.S.

The researchers concluded that it remained unclear whether the increased oxygenation had a direct effect on animal life, or even if it had a passive effect by, say, expanding the oxygen-rich ecospace. So it is difficult to resolve if temperature, increased oxygenation or something else served as the driver for biodiversification. But the findings showed that oxygen certainly was spiking during the times of some of the greatest change.

“Oxygen and animal life have always been linked, but most of the focus has been on how animals came to be,” said Saltzman, professor and school director of Earth Sciences at Ohio State. “Our work suggests that oxygen may have been just as important in understanding how animals came to be so diverse and abundant.”

Reference:
Cole T. Edwards, Matthew R. Saltzman, Dana L. Royer, David A. Fike. Oxygenation as a driver of the Great Ordovician Biodiversification Event. Nature Geoscience, 2017; DOI: 10.1038/s41561-017-0006-3

Note: The above post is reprinted from materials provided by Washington University in St. Louis. Original written by Chuck Finder.

Clay mineral waters Earth’s mantle from the inside

Kaolinite sinks into the subduction zone with the oceanic plate.
Kaolinite sinks into the subduction zone with the oceanic plate. As it changes into the newly discovered phase it takes in water from its surroundings and releases it upon further structure change down in the mantle. Credit: Wikimedia Commons, MagentaGreen (modified) CC BY SA 3.0

The first observation of a super-hydrated phase of the clay mineral kaolinite could improve our understanding of processes that lead to volcanism and affect earthquakes. In high-pressure and high-temperature X-ray measurements that were partly conducted at DESY, scientists created conditions similar to those in so-called subduction zones where an oceanic plate dives under the continental crust. The transport and release of water during subduction causes strong volcanic activity. An international team led by scientists of Yonsei University in the Republic of Korea, presents the results in the scientific journal Nature Geoscience.

In a subduction zone, a heavy oceanic plate meets a second, lighter continental plate and moves under it and into the earth’s mantle. With the oceanic plate, water enters the earth as it is trapped in minerals of the oceanic crust or overlaying sediments. These minerals slowly sink deeper into the mantle over millions of years. With increasing depth, temperature and pressure, the minerals become instable, break down and transform into new compounds.

During these transformations, water is released and rises into the surrounding, hotter mantle where it decreases the melting temperature of the mantle rock. “When the mantle rocks melt, magma is generated. This can lead to volcanic activity when the magma rises to the surface,” explains Yongjae Lee from Yonsei University who led the study. “While we know that the water cycle in subduction zones influences volcanism and possibly seismicity, we don’t know much about the processes that form this cycle.”

Since these processes take place many kilometres under Earth’s surface, it is impossible to observe them directly. Even the Kola Superdeep Borehole in Russia, the deepest borehole on Earth, reaches no deeper than 12,262 metres. One way to learn more about the transformations in greater depths of subduction zones is to create similar conditions in the laboratory. High-pressure and high-temperature measurements allow scientists to take a close look at the structural changes in the different minerals that form the crust and sediments.

One of these minerals is kaolinite, a clay mineral containing aluminium that is an important part of the oceanic sediments. The scientists were now able to observe the formation of a new phase of the mineral, so-called super-hydrated kaolinite. They examined a sample of kaolinite in the presence of water at pressures and temperatures corresponding to those at different depths in subduction zones. With X-ray diffraction and infrared spectra measurements, structural and chemical changes were characterized.

At a pressure of circa 2.5 Giga-Pascal (GPa), more than 25,000 times the average pressure at sea level, and a temperature of 200 degrees Celsius, the super-hydrated phase was observed. These conditions are present at a depth of about 75 kilometres in subduction zones. In the new phase, water molecules are enclosed between the layers of the mineral. The super-hydrated kaolinite contains more water than any other known aluminosilicate mineral in the mantle. When pressure and temperature sink back to ambient conditions, the structure reverts to its original form.

In measurements carried out at the Extreme Conditions Beamline P02.2 at DESYs X-ray source PETRA III, the scientists examined the breakdown of the new phase at even higher pressures and temperatures. “Our beamline provides an environment to investigate samples at extreme pressures and temperatures. Using a so-called graphite resistive heated diamond anvil cell, we were able to observe the changes at a pressure of up to 19 Giga-Pascal and a temperature of up to 800 degrees,” says DESY-scientist Hanns-Peter Liermann of the Extreme Conditions Beamline who co-authored the study. The super-hydrated kaolinite broke down at 5 Giga-Pascal and 500 degrees, two additional transformations happened at higher pressures and temperatures. During these transformations, the water that was intercalated in the kaolinite is released.

The observation of the formation and breakdown of the super-hydrated kaolinite bears important information about the processes that occur over a depth range of about 75 kilometres to 480 kilometres in subduction zones. The release of water that takes place when the super-hydrated kaolinite breaks down could be an important part of the water cycle that causes volcanism along subduction zones. The breakdown probably happens below a depth of about 200 kilometres, the released water could then contribute to the formation of magma.

Additionally, the super-hydrated kaolinite could influence seismicity. During the formation of the new phase, the water that surrounds kaolinite is removed from the environment. This could change the friction between the subducting and the overlying slabs. The scientists assume that other minerals in the sediment or crust could undergo similar transformations. Thus, the study could improve the understanding of the geochemical processes in subduction zones of the earth.

Reference:
Huijeong Hwang, Donghoon Seoung, Yongjae Lee, Zhenxian Liu, Hanns-Peter Liermann, Hyunchae Cynn, Thomas Vogt, Chi-Chang Kao, Ho-Kwang Mao. A role for subducted super-hydrated kaolinite in Earth’s deep water cycle. Nature Geoscience, 2017; DOI: 10.1038/s41561-017-0008-1

Note: The above post is reprinted from materials provided by Deutsches Elektronen-Synchrotron DESY.

Related Articles