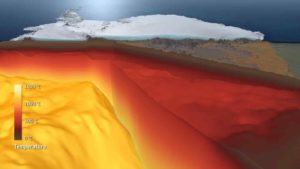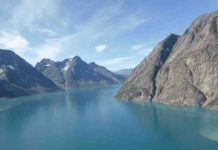
Reconstructed paleo-elevation in southwestern North America at the Late Eocene (36 million years ago). Credit: Bahadori and Holt
By using the latest computer numerical modeling technologies, combined with geologic compilations and seismic data, researchers in the Department of Geosciences at Stony Brook University have developed a complete geodynamic model that explains the forces behind the remarkable collapse of what were lofty mountains some 30 million years ago in what is now part of the American West.
The research, published in Nature Communications, includes visuals that reveal how the mountains were probably higher than the Rockies are today and how a complex system of faults chopped the region up, allowing mountains to expand bountifully and form the Basin and Range province and the now dangerous San Andreas fault system in California.
The article is authored by graduate student Ali Bahadori and William E. Holt, Ph.D., and the study was funded by the National Science Foundation.
Holt, who is the project leader, says that the results will be combined with climate and erosion models of the vast region to better explain this geologic evolution over millions of years and its impact on the fauna and flora found in the fossil record.
Reference:
Alireza Bahadori et al. Geodynamic evolution of southwestern North America since the Late Eocene, Nature Communications (2019). DOI: 10.1038/s41467-019-12950-8
The Sentinel-6A spacecraft sits in its clean room in Germany’s IABG space test center. The satellite is being prepared for a scheduled launch in November 2020 from Vandenberg Air Force Base in California. Credit: IABG
Earth’s climate is changing, and the study of oceans is vital to understanding the effects of those changes on our future. For the first time, U.S and European agencies are preparing to launch a 10-year satellite mission to continue to study the clearest sign of global warming—rising sea levels. The Sentinel-6/Jason-CS mission (short for Jason-Continuity of Service), will be the longest-running mission dedicated to answering the question: How much will Earth’s oceans rise by 2030?
By 2030, Sentinel-6/Jason-CS will add to nearly 40 years of sea level records, providing us with the clearest, most sensitive measure of how humans are changing the planet and its climate.
The mission consists of two identical satellites, Sentinel-6A and Sentinel-6B, launching five years apart. The Sentinel-6A spacecraft was on display for the media on Nov. 15 for a last look in its clean room in Germany’s IABG space test center. The satellite is being prepared for a scheduled launch in November 2020 from Vandenberg Air Force Base in California on a SpaceX Falcon 9 rocket.
Sentinel-6/Jason-CS follows in the footsteps of four other joint U.S.-European satellite missions—TOPEX/Poseidon and Jason-1, Ocean Surface Topography/Jason-2, and Jason-3—that have measured sea level rise over the past three decades. The data gathered by those missions have shown that Earth’s oceans are rising by an average of 0.1 inches (3 millimeters) per year.
Sentinel-6/Jason-CS will continue that work, studying not just sea level change but also changes in ocean circulation, climate variability such as El Niño and La Niña, and weather patterns, including hurricanes and storms.
“Global sea level rise is, in a way, the most complete measure of how humans are changing the climate,” said Josh Willis, the mission’s project scientist at NASA’s Jet Propulsion Laboratory in Pasadena, California. “If you think about it, global sea level rise means that 70 percent of Earth’s surface is getting taller—70 percent of the planet is changing its shape and growing. So it’s the whole planet changing. That’s what we’re really measuring.”
Decades of space- and ground-based observations have documented Earth’s surface temperature rising at a rapidly accelerating rate. The oceans help to stabilize our climate by absorbing over 90 percent of the heat trapped on the planet by excess greenhouse gases, like carbon dioxide, that have been emitted into the atmosphere since the start of the Industrial Revolution.
As the oceans warm, they expand, increasing the volume of water; the trapped heat also melts ice sheets and glaciers, contributing further to sea level rise. The rate at which it is rising has accelerated over the past 25 years and is expected to continue accelerating in years to come.
Sentinel-6/Jason-CS will measure down to the millimeter how much global sea level rises during the 2020s and how fast that rise accelerates. As the rate increases, humans will need to adapt to the effects of rising seas—including flooding, coastal erosion, hazards from storms and negative impacts to marine life.
Along with measuring sea level rise, the mission will provide datasets that can help with weather predictions, assessing temperature changes in the atmosphere and collecting high-resolution vertical profiles of temperature and humidity.
As with its Jason-series predecessors, Sentinel-6/Jason-CS will gather global ocean data every 10 days, providing insights into large ocean features like El Niño events. However, unlike previous Jason-series missions, its higher-resolution instruments will also be able to provide data on smaller ocean features—including complex currents—that will benefit navigation and fishing communities.
“Global sea level rise is one of the most expensive and disruptive impacts of climate change that there is,” said Willis. “In our lifetimes, we’re not going to see global sea level fall by a meaningful amount. We’re literally charting how much sea level rise we’re going have to deal with for the next several generations.”
Note: The above post is reprinted from materials provided by NASA.
Curtin University research has revealed how pairing satellite images with an existing global network of radio telescopes can be used to paint a previously unseen whole-of-planet picture of the geological processes that shape the Earth’s crust.
The research, published in Geophysical Research Letters, showed that satellite images capturing the movement of the Earth’s surface on different continents as a result of geological and man-made forces can be integrated using radio telescopes to deliver a global-scale view and new understanding of these processes.
Lead researcher Dr. Amy Parker, an ARC Research Fellow from Curtin’s School of Earth and Planetary Sciences, said the global network of radio telescopes was shown to be a key link to integrating satellite measurements of ground movements on a global scale.
“The height of the Earth’s surface is constantly changed by geological forces like earthquakes and the effects of human activities, such as mining or ground water extraction,” Dr. Parker said.
“Increasing numbers of scientists are measuring these changes using the global coverage of images from radar satellites, however, it has not been previously possible to link together ground movements measured on different continents because they are measured relative to an arbitrary point and not a globally consistent reference frame.
“This is the first time we have thought about how to integrate these measurements on a global scale, and the potential benefits of this approach in terms of our understanding of the processes that shape our planet’s crust are significant.”
Dr. Parker said the study, which was done in collaboration with researchers from the University of Tasmania and Chalmers University of Technology in Sweden, demonstrated that the already existing global network of radio telescopes could be the missing link to integrate these satellite measurements on a worldwide scale.
“By harnessing the power of these radio telescopes, we hope to shed new light on the processes that shape the Earth’s crust including a complete, consistent assessment of the contribution of land displacements to relative sea-level rise,” Dr. Parker said.
Reference:
A. L. Parker et al. The Potential for Unifying Global‐Scale Satellite Measurements of Ground Displacements Using Radio Telescopes, Geophysical Research Letters (2019). DOI: 10.1029/2019GL084915
Aerial view of the acidic hot springs in the shallow water of the Taiwanese Kueishantao volcanic island, visible through the whitish discoloration of the sea water by sulphur. Credit: Mario Lebrato, Uni Kiel
The volcanic island of Kueishantao in northeastern Taiwan is an extreme habitat for marine organisms. With an active volcano, the coastal area has a unique hydrothermal field with a multitude of hot springs and volcanic gases. The acidity of the study area was among the highest in the world. The easily accessible shallow water around the volcanic island therefore represents an ideal research environment for investigating the adaptability of marine organisms, some of which are highly specialised, such as crabs, to highly acidified and toxic seawater.
For about ten years, marine researchers from the Institute of Geosciences at Kiel University (CAU), together with their Chinese and Taiwanese partners from Zhejiang University in Hangzhou and the National Taiwan Ocean University in Keelung, regularly collected data on geological, chemical and biological processes when two events disrupted the results of the time series in 2016. First, the island was shaken by an earthquake and hit by the severe tropical typhoon Nepartak only a few weeks later. On the basis of data collected over many years, the researchers from Kiel, China and Taiwan were now able to demonstrate for the first time that biogeochemical processes had changed due to the consequences of the enormous earthquake and typhoon and how different organisms were able to adapt to the changed seawater biogeochemistry in the course of only one year. The first results of the interdisciplinary study, based on extensive data dating back to the 1960s, were recently published in the international journal Nature Scientific Reports.
“Our study clearly shows how closely atmospheric, geological, biological and chemical processes interact and how an ecosystem with extreme living conditions such as volcanic sources on the ocean floor reacts to disturbances caused by natural events,” says Dr. Mario Lebrato of the Institute of Geosciences at Kiel University. For years, scientists led by Dr. Dieter Garbe-Schönberg and Dr. Mario Lebrato from the Institute of Geosciences at the CAU have been researching the shallow hydrothermal system “Kueishantao.” The selected site has a large number of carbon dioxide emissions in the shallow water. In addition, the sources release toxic metals. Sulphur discolours the water over large areas. The volcanic gases—with a high sulphur compounds—lead to a strong acidification of the sea water. Through methods of airborne drone surveying, modelling, regular sampling and laboratory experiments research into the hydrothermal field therefore makes an important contribution to the effects of ocean acidification on marine communities. Only a few specialized animal species such as crabs, snails and bacteria live in the immediate vicinity of the sources. A few metres away, on the other hand, is the diverse life of a tropical ocean.
“Due to the high acidity, the high content of toxic substances and elevated temperatures of the water, the living conditions prevailing there can serve as a natural laboratory for the investigation of significant environmental pollution by humans. The sources at Kueishantao are therefore ideal for investigating future scenarios,” says co-author Dr. Yiming Wang, who recently moved from Kiel University to the Max Planck Institute for the Science of Human History in Jena.
After the severe events in 2016, the study area changed completely. The seabed was buried under a layer of sediment and rubble. In addition, the acidic warm water sources dried up, and the composition of the sea water had significantly and continuously changed over a long period of time. Aerial photos taken with drones, samples taken by research divers from Kiel and Taiwan as well as biogeochemical investigations clearly showed the spatial and chemical extent of the disturbances. These were recorded by the biologist and research diver Mario Lebrato and his Taiwanese colleague Li Chun Tseng and compared with the results of earlier samplings. “What initially looked like a catastrophe for our current time series study turned out to be a stroke of luck afterwards. This gave us the rare opportunity to observe how organisms adapt to the severe disturbances. We were able to draw on a comprehensive database to do this” explains project manager Dr. Dieter Garbe-Schönberg from the Institute of Geosciences at Kiel University.
Reference:
Mario Lebrato et al, Earthquake and typhoon trigger unprecedented transient shifts in shallow hydrothermal vents biogeochemistry, Scientific Reports (2019). DOI: 10.1038/s41598-019-53314-y
A 91-million-year-old fossil shark newly named Cretodus houghtonorum discovered in Kansas joins a list of large dinosaur-era animals. Preserved in sediments deposited in an ancient ocean called the Western Interior Seaway that covered the middle of North America during the Late Cretaceous period (144 million to 66 million years ago), Cretodus houghtonorum was an impressive shark estimated to be nearly 17 feet or slightly more than 5 meters long based on a new study appearing in the Journal of Vertebrate Paleontology.
The fossil shark was discovered and excavated in 2010 at a ranch near Tipton, Kansas, in Mitchell County by researchers Kenshu Shimada and Michael Everhart and two central Kansas residents, Fred Smith and Gail Pearson. Shimada is a professor of paleobiology at DePaul University in Chicago. He and Everhart are both adjunct research associates at the Sternberg Museum of Natural History, Fort Hays State University in Hays, Kansas. The species name houghtonorum is in honor of Keith and Deborah Houghton, the landowners who donated the specimen to the museum for science.
Although a largely disarticulated and incomplete skeleton, it represents the best Cretodus specimen discovered in North America, according to Shimada. The discovery consists of 134 teeth, 61 vertebrae, 23 placoid scales and fragments of calcified cartilage, which when analyzed by scientists provided a vast amount of biological information about the extinct shark. Besides its estimated large body size, anatomical data suggested that it was a rather sluggish shark, belonged to a shark group called Lamniformes that includes modern-day great white and sand tiger sharks as distant cousins, and had a rather distinct tooth pattern for a lamniform shark.
“Much of what we know about extinct sharks is based on isolated teeth, but an associated specimen representing a single shark individual like the one we describe provides a wealth of anatomical information that in turn offers better insights into its ecology,” said Shimada, the lead author on the study.
“As important ecological components in marine ecosystems, understanding about sharks in the past and present is critical to evaluate the roles they have played in their environments and biodiversity through time, and more importantly how they may affect the future marine ecosystem if they become extinct,” he said.
During the excavation, Shimada and Everhart believed they had a specimen of Cretodus crassidens, a species originally described from England and subsequently reported commonly from North America. However, not even a single tooth matched the tooth shape of the original Cretodus crassidens specimen or any other known species of Cretodus, Shimada said.
“That’s when we realized that almost all the teeth from North America previously reported as Cretodus crassidens belong to a different species new to science,” he noted.
The growth model of the shark calibrated from observed vertebral growth rings indicates that the shark could have theoretically reached up to about 22 feet (about 6.8 meters).
“What is more exciting is its inferred large size at birth, almost 4 feet or 1.2 meters in length, suggesting that the cannibalistic behavior for nurturing embryos commonly observed within the uteri of modern female lamniforms must have already evolved by the late Cretaceous period,” Shimada added.
Furthermore, the Cretodus houghtonorum fossil intriguingly co-occurred with isolated teeth of another shark, Squalicorax, as well as with fragments of two fin spines of a yet another shark, a hybodont shark.
“Circumstantially, we think the shark possibly fed on the much smaller hybodont and was in turn scavenged by Squalicorax after its death,” said Everhart.
Discoveries like this would not be possible without the cooperation and generosity of local landowners, and the local knowledge and enthusiasm of amateur fossil collectors, according to the authors.
“We believe that continued cooperation between paleontologists and those who are most familiar with the land is essential to improving our understanding of the geologic history of Kansas and Earth as a whole,” said Everhart.
The new study, “A new large Late Cretaceous lamniform shark from North America with comments on the taxonomy, paleoecology, and evolution of the genus Cretodus,” will appear in the forthcoming issue of the Journal of Vertebrate Paleontology.
Reference:
Kenshu Shimada et al. A New Large Late Cretaceous Lamniform Shark from North America, with Comments on the Taxonomy, Paleoecology, and Evolution of the Genus Cretodus, Journal of Vertebrate Paleontology (2019). DOI: 10.1080/02724634.2019.1673399
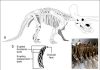
The pink arrow points to the predentary and the blue arrow points to the upper portion of the jaw, which has no teeth. Together, they may have been covered by a keratinous beak, and the predentary was most likely mobile Credit: IVPP
The predentary bone is one of the most enigmatic skeletal elements in avian evolution. Located at the tip of the lower jaw, this bone is absent in more primitive birds and in living birds; it is thought to have been lost during evolution. For over 30 years, the origin and function of the avian predentary has remained mysterious.
Now, however, Alida Bailleul, LI Zhiheng, Jingmai O”Connor and ZHOU Zhonghe from the Institute of Vertebrate Paleontology and Paleoanthropology (IVPP) of the Chinese Academy of Sciences have made significant progress towards solving this long-standing mystery. Their findings were published in Proceedings of the National Academy of Sciences (PNAS) on November 18.
Using a battery of analytical methods, the team, led by Dr. Bailleul, presents strong evidence that the avian predentary was covered by a keratinous beak—a horny sheath that covers the bones of the rostrum in all living birds, all of which are edentulous and have beaks. It also provides evidence the predentary was proprioceptive, i.e., it was able to detect external mechanical stimuli; and was mobile—thus representing a now extinct form of cranial kinesis.
Cranial kinesis occurs when joints are able to move within the skull—mainly between the upper jaw and the braincase. This feature is widespread in living birds; however, it is thought to be mostly absent in Mesozoic birds.
Based on her examination of the fossilized tissues of the predentary and other jaw elements of Yanornis martini from the Jehol Biota, Dr. Bailleul identified a specific type of cartilage inside the joint between the predentary and dentary that strongly suggests some movement between these elements.
The team noticed that the predentary is only found in ornithuromorphs that have teeth. However, the tip of the premaxilla—the bone of the upper bill that would have occluded with the predentary—is without teeth. This suggests that the tip of the upper jaw, like the predentary, was also covered with a keratinous beak.
The tiny beak at the tip of the skull, combined with the sensitive and mobile predentary bone and teeth that were most likely also proprioceptive, represents a unique feeding adaptation that allowed greater dexterity when manipulating food. Although bizarre and now extinct, this unique feeding apparatus persisted in the ornithuromorph clade for at least 58 million years, from the Early to the Late Cretaceous.
Using information from the fossilized tissues and preexisting data on the embryology of living birds, the team also formulated a hypothesis regarding the origin of this bone, suggesting it is a sesamoid, similar to the human knee cap. Identification as a sesamoid means this bone is a novel skeletal innovation unique to one lineage of ornithuromorphs, and that it did not arise from a preexisting skull bone.
Although additional research on fossils birds (and also extant birds) is required to confirm some of these hypotheses, the predentary is such a small bone that it is only rarely preserved, thus making it very difficult—if not impossible—to find specimens that can shed light on the remaining pieces of this mystery.
Reference:
Alida M. Bailleul el al., “Origin of the avian predentary and evidence of a unique form of cranial kinesis in Cretaceous ornithuromorphs,” PNAS (2019). www.pnas.org/cgi/doi/10.1073/pnas.1911820116
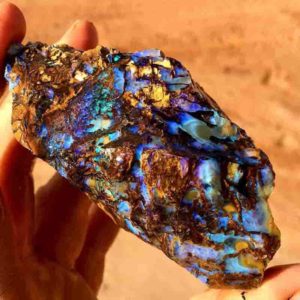
Multicolor rough crystal opal from Coober Pedy, South Australia, expressing nearly every color of the visible spectrum. Credit: Dpulitzer
Fire Opal
Fire opal is a translucent opal with warm body colors ranging from yellow to orange to gold. Even though it usually doesn’t show any color play, sometimes a stone will show bright green flashes. Querétaro in Mexico is the most popular supplier of fire opals; these opals are commonly referred to as Mexican fire opals.
Sometimes fire opals that do not display color play are referred to as jelly opals. Occasionally Mexican opals are cut into their rhyolitic host material if slicing and polishing is difficult enough. A form of opal from Mexico is called an opal from Cantera. A type of opal from Mexico, known as Mexican water opal, is also a colorless opal that shows either a bluish or golden internal shine.
Not all fire opals are similar. We distinguish between the common fire opals, which are either faced or cut into cabochons depending on their quality, and the particularly valuable ones, which, in addition to their vivacious color, also have the typical opal gaudy color play. But the fire opal plays its part as a high-quality gemstone to perfection with or without color play.
Fire opal has a Mohs hardness of 5.5 to 6, which is weak enough that many items will damage it during daily wear. Fire opal is also poor in tenacity, meaning it can be chipped or broken quickly.
Fire opal is best used in accessories such as earrings, pins and pendants that are not normally exposed to rough wear. If a fire opal is placed into a circle, it is recommended to have a setting built specifically to protect the stone from abrasion and impact.
How Is Fire Opal Formed?
Opal is a hydrated amorphous type of silica (SiO2·nH2O); its water content can differ by weight from 3 to 21%, but is typically between 6 and 10%. It is known as a mineraloid because of its amorphous nature, unlike crystalline types of silica, classified as minerals. It is deposited at a relatively low temperature and can occur in nearly any rock fissures, most commonly found in limonite, sandstone, rhyolite, marl, and basalt. Opal is Australia’s largest gemstone.
There are two broad opal classes: precious and normal. Play-of-color (iridescence) precious opal shows, not regular opal. Play-of-color was described as’ a pseudochromatic optical effect resulting in bursts of colored light from certain minerals as they are converted into white light.’ The precious opal’s internal structure allows it to diffract light, resulting in play-of-colour. Opal may be clear, translucent or opaque depending on the conditions under which it was made, and the background color may be white, black or almost any color of the visual spectrum.
Where Is Fire Opal Found?
For nearly 100 years, Mexico has been the primary fire opal source in the world. Fire Opal is found in Queretaro, Hidalgo, Guerrero, Michoacan, Julisio, Chihuahua and San Luis Potosi states of Mexico. Queretaro’s mines are the most important and have been mining since 1835. Small fire opal pebbles can be found in silica-rich lava flows.
Smaller quantities of fire opal are produced in Australia, Brazil, Honduras and Guatemala. Some beautiful fire opals are produced in the United States, Nevada and Oregon.
Is Fire Opal valuable?
Fire opal is a mineral opal variety, red, orange or yellow in colour. The visibility and clarity differ, as well as the particular complexity and brightness of its color, and these are some of the factors that determine the quality of fire opal. In comparison, the price of red fire opal is usually higher than the price of yellow samples.
Why is opal so expensive?
Several experienced opal valuers will price the opal per carat and the final value will be determined by the average price per carat. Over many years there has been guidelines developed on how to value Opal. We are going to explore the some factors that contribute to an Opals final value.
COLOR : Color is the first thing that you will notice about an opal. Red is the rarest and most sought out color. In order of value, the most valuable color is red, then orange, green, blue and purple. However, Opal is usually never a single color. DIRECTION OF COLOR : Opals are a gemstone that dramatically change appearance based on what angle the Opal is viewed at. When an Opal is at it’s brightest, this is called ‘facing’. The direction of color can affect the price becuase it will determine how versatile the Opal is. PATTERN : Opals that have a rare or unique pattern are more valuable. The Harlequin pattern is the rarest and most loved pattern in opals but it is very rare. BRIGHTNESS : The Opal brightness guide was produced by the Australian opal association along with the body tone guide.
The eruption of the Merapi on 11 May 2018. Credit: Université de Strasbourg/Uppsala University/Technical University of Munich/The University of Leeds/Universitas Gadjah Mada/German Research Center for Geosciences
When will the next eruption take place? Examination of samples from Indonesia’s Mount Merapi show that the explosivity of stratovolcanoes rises when mineral-rich gases seal the pores and microcracks in the uppermost layers of stone. These findings result in new possibilities for the prediction of an eruption.
Mount Merapi on Java is among the most dangerous volcanoes in the world. Geoscientists have usually used seismic measurements which illustrate underground movements when warning the population of a coming eruption in time.
An international team including scientists from the Technical University of Munich (TUM) has now found another indication for an upcoming eruption in the lava from the peak of Mount Merapi: The uppermost layer of stone, the “plug dome,” becomes impermeable for underground gases before the volcano erupts.
“Our investigations show that the physical properties of the plug dome change over time,” says Prof. H. Albert Gilg from the TUM Professorship for Engineering Geology . “Following an eruption the lava is still easily permeable, but this permeability then sinks over time. Gases are trapped, pressure rises and finally the plug dome bursts in a violent explosion.”
Mount Merapi as a model volcano
Using six lava samples, one from an eruption of Mount Merapi in 2006, the others from the 1902 eruption — the researchers were able to ascertain alterations in the stone. Investigation of pore volumes, densities, mineral composition and structure revealed that permeability dropped by four orders of magnitude as stone alteration increased. The cause is newly formed minerals, in particular potassium and sodium aluminum sulfates which seal the fine cracks and pores in the lava.
The cycle of destruction
Computer simulations confirmed that the reduced permeability of the plug dome was actually responsible for the next eruption. The models show that a stratovolcano like Mount Merapi undergoes three phases: First, after an eruption when the lava is still permeable, outgassing is possible; in the second phase the plug dome becomes impermeable for gases, while at the same time the internal pressure continuously increases; in the third phase the pressure bursts the plug dome.
Photographs of Mount Merapi from the period before and during the eruption of May 11, 2018 support the three-phase model: The volcano first emitted smoke, then seemed to be quiet for a long time until the gas found an escape and shot a fountain of ashes kilometers up into the sky.
“The research results can now be used to more reliably predict eruptions,” says Gilg. “A measurable reduction in outgassing is thus an indication of an imminent eruption.”
Mount Merapi is not the only volcano where outgassing measurements can help in the timely prediction of a pending eruption. Stratovolcanoes are a frequent source of destruction throughout the Pacific. The most famous examples are Mount Pinatubo in the Philippines, Mount St. Helens in the western USA and Mount Fuji in Japan.
Reference:
Michael J. Heap, Valentin R. Troll, Alexandra R. L. Kushnir, H. Albert Gilg, Amy S. D. Collinson, Frances M. Deegan, Herlan Darmawan, Nadhirah Seraphine, Juergen Neuberg, Thomas R. Walter. Hydrothermal alteration of andesitic lava domes can lead to explosive volcanic behaviour. Nature Communications, 2019; 10 (1) DOI: 10.1038/s41467-019-13102-8
The excavation of trench B at the Leigh Lake site. Shown in the photo (from left to right) are Glenn Thackray, Cooper Brossy, and Darren Zellman. Credit: Mark Zellman
Hand-dug trenches around Leigh Lake in Grand Teton National Park in Wyoming reveal evidence for a previously unknown surface-faulting earthquake in along the Teton Fault—one occurring about 10,000 years ago.
Together with evidence from the site of a second earthquake that ruptured around 5,900 years ago, the findings published in the Bulletin of the Seismological Society of America extend the history of Teton Fault earthquakes and may offer some clues as to how segments of the fault have ruptured together in the past, the study authors suggest.
The Teton Fault is one of the fastest-moving normal faults in the western United States, separating the eastern edge of the Teton Range from the Jackson Hole basin. The fault is divided into southern, central and northern segments, with the Leigh Lake site falling within the central segment. A previous study identified two Teton Fault earthquakes that occurred 8,000 years ago and 4,700 to 7,900 years ago on the southern segment at Granite Canyon, one of the most famous hiking spots in the Grand Teton National Park.
The younger earthquake at Leigh Lake may be the same rupture as the youngest Granite Canyon earthquake, confirming that there were at least three earthquakes in Holocene times, and that the most recent activity along the fault occurred about 6,000 years ago, said Mark Zellman of BGC Engineering, Inc., the lead author of the BSSA study.
Although the Leigh Lake study doesn’t provide a definite answer to the question of whether multiple segments of the Teton fault have ruptured at once, Zellman said the findings “do give us a clue that multi-section ruptures are possible. The overlap in age between the youngest Leigh Lake earthquake and the youngest Granite Canyon earthquake “leaves open the possibility that at least the southern and central section of the Teton fault ruptured together during the most recent event.”
Given the Teton fault’s high rate of movement in the past, it has been a surprisingly long time since its last earthquake, said Zellman. “The seemingly regular and relatively short intervals of time between these three events makes the long period of quiescence on the Teton fault even more surprising,” he said. “I was expecting that we would have found evidence for at least one rupture that post-dates the youngest event known from Granite Canyon.”
Zellman and colleagues chose Leigh Lake as a study site because no other paleoseismic studies had been conducted previously on this central segment of the fault, and because the site offered several small and easy to reach scarps for shovel excavations. The researchers excavated at two of three scarps that represent the fault’s movement in postglacial times.
The remoteness of the site and its location within a national park prevented the researchers from using heavy equipment to dig and backfill their shallow trenches. In the future, Zellman said, “it would be nice to identify a location or two where we could excavate a deeper trench to expose a longer record.”
Asked about the older event at Granite Canyon that was not found at Leigh Lake, Zellman said “evidence for that earthquake might be preserved in the third scarp. But we won’t know for sure until we excavate that scarp.”
The researchers examined the coarse exposed sediments in the trenches for signs of past faulting, in some places analyzing the orientation of large rocks clasts within the trench walls to reveal the fault’s presence. The faults were dated using radiocarbon and optically stimulated luminescence methods.
Based on the length of the fault ruptures, Zellman and colleagues estimate the 10,000-year old earthquake may have been a magnitude 6.6 to 7.2 quake, while the 5,900-year old earthquake may have been magnitude 7.0 to 7.2.
Zellman said other studies of sites along the fault’s northern segment, combined with data from studies that look at landslides and other signs of paleoseismic activity contained in deep lake sediments from the region, will help further fill in the history of the Teton Fault.
Researchers doing fieldwork in KwaZulu-Natal, South Africa. Credit: Stuart Gilfillan
The discovery of gases released from deep beneath the Earth’s crust could help to explain Southern Africa’s unusual landscape, a study suggests.
Scientists have long puzzled over why areas such as South Africa’s Highveld region are so elevated and flat, with unexpectedly hot rocks below the surface.
Geologists have revealed that carbon dioxide-rich gases bubbling up through natural springs in South Africa originate from a column of hot, treacle-like material — called a hotspot — located deep inside the Earth.
Hotspots are known to generate volcanic activity in Hawaii, Iceland and Yellowstone National Park. In South Africa, the hotspot pushes the crust upwards, generating the distinctive landscape, which consists mostly of tablelands more than one kilometre above sea level, the researchers say.
This also explains why rocks beneath the region are hotter than expected — a property that could be harnessed to generate geothermal energy.
A team led by scientists from the University of Edinburgh analysed the chemical make-up of gas emerging from a deep crack in the Earth’s crust located in KwaZulu-Natal, South Africa.
They found that variants of the elements helium and neon present in the gas match the composition of a rocky layer 1,000 kilometres below Earth’s surface — called the deep mantle.
The findings provide the first physical evidence that Southern Africa lies on top of a plume of abnormally hot mantle, which had until now only been theorised using computer modelling of seismic data.
The study, published in the journal Nature Communications, was funded by the Engineering and Physical Sciences Research Council and the Natural Environment Research Council.
The research was completed with support from Scottish Carbon Capture and Storage and the UK Carbon Capture and Storage Research Centre. It also involved scientists from the Universities of Aberdeen and Strathclyde, Scottish Universities Environmental Research Centre, British Geological Survey and South Africa Council for Geoscience.
Dr Stuart Gilfillan, of the University of Edinburgh’s School of GeoSciences, who led the study, said: “The high relief and hotter than expected subsurface temperatures of the rocks beneath Southern Africa had been a puzzle for geologists for many years. Our findings confirm that carbon dioxide gas at the surface is from a deep mantle plume, helping to explain the regions unusual landscape.”
Reference:
S. M. V. Gilfillan, D. Györe, S. Flude, G. Johnson, C. E. Bond, N. Hicks, R. Lister, D. G. Jones, Y. Kremer, R. S. Haszeldine, F. M. Stuart. Noble gases confirm plume-related mantle degassing beneath Southern Africa. Nature Communications, 2019; 10 (1) DOI: 10.1038/s41467-019-12944-6
Klaus Reicherter from the University of Aachen examines a boulder that the tsunami carried onto the cliffs. Credit: Gösta Hoffmann/Uni Bonn
15-meter high waves that pushed boulders the weight of a Leopard tank inland: This is more or less how one can imagine the tsunami that hit the coast of today’s Sultanate of Oman about 1,000 years ago, as concluded by a recent study by the universities of Bonn, Jena, Freiburg and RWTH Aachen. The findings also show how urgently the region needs a well-functioning early warning system. But even then, coastal residents would have a maximum of 30 minutes to get to safety in a similar catastrophe. The study will be published in the journal “Marine Geology,” but is already available online.
Oman lies in the east of the Arabian Peninsula. The coasts of the Sultanate are repeatedly struck by tsunamis, most recently in 2013. Even with the most severe of these in recent times, the Makran event in 1945, the damage remained comparatively low. Back then, the tidal wave reached a height of three meters.
The scientists have now discovered evidence of a tsunami which is likely to have been much more powerful, with waves of up to 15 meters. For this purpose, the researchers from Bonn, Jena and Aachen concentrated their terrain investigations on a 200-kilometer coastal strip in northeastern Oman. “There we identified 41 large boulders, which were apparently carried inland by the force of the water,” explains Dr. Gösta Hoffmann from the Institute for Geosciences at the University of Bonn.
Quartz clock in the rock
Some of the boulders were probably formed when the tsunami shattered parts of the cliffs; for one of them, the largest weighing around 100 metric tons, scientists were even able to determine the exact point at which it broke off. Others show traces of marine organisms such as mussels or oysters that cannot survive on land. “Certain methods can be used to determine their time of death,” says the geologist Gösta Hoffmann. “This allowed us to establish when the boulders were washed ashore.”
The quartz crystals in the rock also represent a kind of clock: They provide information about the last time they were exposed to the sun. This allowed the scientists to deduce how long the rocks had been in the place where they were found. The scientists from Freiburg are specialists in this method. “Many of these measurements gave us a value of about 1,000 years,” emphasizes Hoffmann. “This corresponds well with the dating results of clay fragments we found in tsunami sediments. They originate from vessels used by coastal dwellers.”
The Arabian and Eurasian tectonic plates collide in the Arabian Sea. They move towards each other at a speed of about four centimeters per year. During this process, one plate slides beneath the other. Sometimes they get stuck in this subduction zone. This can cause tensions that intensify more and more over years and decades. If they suddenly come loose with a violent jolt, the water column above the plates starts to move. This can lead to the extremely destructive waves that are characteristic of tsunamis.
“So far it has been unclear to what extent the Arabian and Eurasian plates get stuck,” says Hoffmann. At the Makran event of 1945, for example, the effects were locally confined. The current findings, however, suggest that the tensions can also build up and unload on a very large scale — there is no other feasible explanation for the enormous forces at work at the time. “It is therefore extremely important that a tsunami early warning system is put in place for this region,” stresses the geologist.
Nevertheless, even a smaller tsunami would have devastating consequences today: A large part of the vital infrastructure in the Sultanate of Oman has been built near the coast, such as the oil refineries and seawater desalination plants. A well-functioning warning system can, however, at least give residents some time to get to safety. Not very much though: Tsunamis move at the speed of a passenger aircraft; in the best case, the time between the alarm and the wave’s impact would therefore be little more than 30 minutes.
Reference:
Gösta Hoffmann, Christoph Grützner, Bastian Schneider, Frank Preusser, Klaus Reicherter. Large Holocene tsunamis in the northern Arabian Sea. Marine Geology, 2019; 106068 DOI: 10.1016/j.margeo.2019.106068
Mammoth bones are pictured in Tultepec, Mexico in this handout photograph released by Mexico’s National Institute of Anthropology (INAH)
Archaeologists said Wednesday they have made the largest-ever discovery of mammoth remains: a trove of 800 bones from at least 14 of the extinct giants found in central Mexico.
Moreover, they believe they have made the first-ever find of a mammoth trap set by humans, who would have used it to capture the huge herbivores more than 14,000 years ago, said Mexico’s National Institute of Anthropology and History (INAH).
“This is the largest find of its kind ever made,” the institute said in a statement.
The skeletal remains were found in Tultepec, near the site where President Andres Manuel Lopez Obrador’s government is building a new airport for Mexico City.
Some bore signs that the animals had been hunted, leading experts to conclude that they had found “the world’s first mammoth trap,” it said.
“Mammoths lived here for thousands of years. The herds grew, reproduced, died, were hunted… They lived alongside other species, including horses and camels,” archaeologist Luis Cordoba told journalists.
Researchers said at least five mammoth herds lived in the area of the find.
Mexico has been the scene of surprising mammoth discoveries before.
In the 1970s, workers building the Mexico City subway found a mammoth skeleton while digging on the capital’s north side.
Note: The above post is reprinted from materials provided by AFP .
This simplified hydrology model shows the subsurface of Oklahoma. The Arbuckle Group is the area where most wastewater is injected. This layer allows fluid to move easily to distant areas. The added water causes stress as it travels and can cause earthquakes when it encounters pre-existing faults. Credit: University of Oklahoma
University of Oklahoma Mewbourne College of Earth and Energy assistant professor Xiaowei Chen and a group of geoscientists from Arizona State University and the University of California, Berkeley, have created a model to forecast induced earthquake activity from the disposal of wastewater after oil and gas production.
“In this region of the country, for every barrel of oil produced from the ground, usually between eight and nine barrels of water are also extracted from many wells,” said Chen.
The large amount of water leads to a problem for oil producers — what to do with it?
Also called brine, this wastewater contains salt, minerals and trace amounts of oil, making it unusable for consumption or agricultural purposes and cost-prohibitive to treat. It is disposed of by injecting it back into the earth, deep into porous rock formations.
Wastewater injection can cause earthquakes, explained Chen, and while most of the recent earthquakes in Oklahoma have been small, several have been in excess of 3.0 on the Richter scale.
Chen and a team of researchers, led by Guang Zhai and Manoochehr Shirzaei from ASU, and Michael Manga from UC Berkeley, set out to find a way to make induced earthquakes in Oklahoma predictable and small.
Their method, explained Chen, was to “create a model that correlates injected wastewater volume with stress changes on nearby faults and the number of earthquakes in that area.”
Finding the Formula
Forecasting the amount of seismic activity from wastewater injection is difficult because it involves accounting for numerous variables:
How easily brine can move through the rock in a given region
Where and how much brine is injected
The regional stress on those faults
The presence of existing geological faults
The team tackled each issue.
Chen and her fellow researchers studied subsurface hydrology parameters — how fast fluid moves within porous rocks and how quickly introduced fluid changes the stress in the subsurface basement. This is important because the subsurface basement is the location of Oklahoma’s induced earthquakes.
While the ASU team used satellite data to determine subsurface hydrology parameters, Chen focused on space and time distributions of earthquakes, and determined hydrology parameters by looking at how fast earthquakes move away from injection zones. By comparing both sets of data, researchers further increased the accuracy of their model.
As it turns out, the Arbuckle Group, a sedimentary layer that sits on top of the subsurface basement deep within the earth, is especially permeable, allowing brine, and therefor earthquakes, to easily spread.
“When we inject brine into the Arbuckle Group at a depth of 1-3 kilometers, it can transport through the porous rocks, modifying stresses and causing earthquakes on basement faults,” said Chen.
Next, researchers can plug in the amount of fluid into the model. By adding the volume of fluid injected in a particular area into their model, they can determine the stress it will place on that region as it spreads.
With the brine variables accounted for, researchers then added information about pre-existing faults into regional calculations. The more researchers know about a particular area, the more accurate the data will be.
“If we are going to operate in an area where we don’t have any prior seismicity, it will be a little challenging to forecast accurately,” said Chen. “But by operating in a new area and taking real-time parameters, operators and researchers should be able to forecast future behavior.”
Results
Chen hopes that by following the results of the models she helped create, oil operators in the state can create new protocols for how much wastewater to inject and where.
This could help prevent large induced earthquakes in Oklahoma. Chen does not believe forthcoming protocols will end induced seismicity altogether, but rather will help cap earthquake size and rate with restricted injection control. This method can forecast future induced seismicity.
Chen foresees a protocol similar to tornado watches — a window of time where Oklahomans are warned they may feel minor tremors in a region of the state.
According to Chen, this is an area where the close working ties between geoscientists and petroleum engineers will need to be even stronger. So far, her research has garnered interest from both geoscientists and petroleum engineers in industry and academia.
Reference:
Guang Zhai, Manoochehr Shirzaei, Michael Manga, Xiaowei Chen. Pore-pressure diffusion, enhanced by poroelastic stresses, controls induced seismicity in Oklahoma. Proceedings of the National Academy of Sciences, 2019; 116 (33): 16228 DOI: 10.1073/pnas.1819225116
A fossilized mantle of a vampyropod, a relative to the vampire squid. The ink sacis the raised structure in the center, and muscles have a striated appearance. Credit: Rowan Martindale/The University of Texas at Austin Jackson School of Geosciences.
Some of the world’s most exquisite fossil beds were formed millions of years ago during time periods when the Earth’s oceans were largely without oxygen.
That association has led paleontologists to believe that the world’s best-preserved fossil collections come from choked oceans. But research led by The University of Texas at Austin has found that while low oxygen environments set the stage, it takes a breath of air to catalyze the fossilization process.
“The traditional thinking about these exceptionally preserved fossil sites is wrong,” said lead author Drew Muscente. “It is not the absence of oxygen that allows them to be preserved and fossilized. It is the presence of oxygen under the right circumstances.”
The research was published in the journal PALAIOS on November 5.
Muscente conducted the research during a postdoctoral research fellowship at the UT Jackson School of Geosciences. He is currently an assistant professor at Cornell College in Mount Vernon, Iowa. The research co-authors are Jackson School Assistant Professor Rowan Martindale, Jackson School undergraduate students Brooke Bogan and Abby Creighton and University of Missouri Associate Professor James Schiffbauer.
The best-preserved fossil deposits are called “Konservat-lagerstätten.” They are rare and scientifically valuable because they preserve soft tissues along with hard ones — which in turn, preserves a greater variety of life from ancient ecosystems.
“When you look at lagerstätten, what’s so interesting about them is everybody is there,” said Bogan. “You get a more complete picture of the animal and the environment, and those living in it.”
The research examined the fossilization history of an exceptional fossil site located at Ya Ha Tinda Ranch in Canada’s Banff National Park. The site, which Martindale described in a 2017 paper, is known for its cache of delicate marine specimens from the Early Jurassic — such as lobsters and vampire squids with their ink sacks still intact — preserved in slabs of black shale.
During the time of fossilization, about 183 million years ago, high global temperatures sapped oxygen from the oceans. To determine if the fossils did indeed form in an oxygen-deprived environment, the team analyzed minerals in the fossils. Since different minerals form under different chemical conditions, the research could determine if oxygen was present or not.
“The cool thing about this work is that we can now understand the modes of formation of these different minerals as this organism fossilizes,” Martindale said. “A particular pathway can tell you about the oxygen conditions.”
The analysis involved using a scanning electron microscope to detect the mineral makeup.
“You pick points of interest that you think might tell you something about the composition,” said Creighton, who analyzed a number of specimens. “From there you can correlate to the specific minerals.”
The workup revealed that the vast majority of the fossils are made of apatite — a phosphate-based mineral that needs oxygen to form. However, the research also found that the climatic conditions of a low-oxygen environment helped set the stage for fossilization once oxygen became available.
That’s because periods of low ocean oxygen are linked to high global temperatures that raise sea levels and erode rock, which is a rich source of phosphate to help form fossils. If the low oxygen environment persisted, this sediment would simply release its phosphate into the ocean. But with oxygen around, the phosphate stays in the sediment where it could start the fossilization process.
Muscente said that the apatite fossils of Ya Ha Tinda point to this mechanism.
The research team does not know the source of the oxygen. But Muscente wasn’t surprised to find evidence for it because the organisms that were fossilized would have needed to breathe oxygen when they were alive.
The researchers plan to continue their work by analyzing specimens from exceptional fossil sites in Germany and the United Kingdom that were preserved around the same time as the Ya Ha Tinda specimens and compare their fossilization histories.
Reference:
A.D. MUSCENTE, ROWAN C. MARTINDALE, JAMES D. SCHIFFBAUER, ABBY L. CREIGHTON, BROOKE A. BOGAN. TAPHONOMY OF THE LOWER JURASSIC KONSERVAT-LAGERSTÄTTE AT YA HA TINDA (ALBERTA, CANADA) AND ITS SIGNIFICANCE FOR EXCEPTIONAL FOSSIL PRESERVATION DURING OCEANIC ANOXIC EVENTS. PALAIOS, 2019; 34 (11): 515 DOI: 10.2110/palo.2019.050
Extremophiles, such as the thermophiles that give the microbial mats such vivid colors in the hot springs in Yellowstone National Park, are a hot topic of study amongst astrobiologists in the UK. IMAGE CREDIT: JIM PEACO/NATIONAL PARK SERVICE.
Mapping the bonds and vibrational modes of molecules containing sulfur isotopes is helping to shed light on the chemical reactions that took place in Earth’s atmosphere during the Archean era, before the atmosphere became oxygenated about 2.5 billion years ago.
The Archean is a geological eon that lasted from 4 billion years to 2.5 billion years ago. It saw the emergence of the first life on Earth, but these microbes were anaerobic, meaning they did not breath oxygen. In fact, during this time, Earth’s atmosphere did not contain any molecular oxygen. Instead, the atmosphere was rich with the likes of carbon and, particularly, sulfur.
The sulfur in the Archean Earth’s atmosphere was emitted by volcanic activity, and through a process called mass independent fractionation, sulfur’s various isotopes (sulfur atoms containing the same number of protons but different numbers of neutrons) became enriched in a manner that does not correlate with their mass. Evidence that this occurred is found in surface deposits dating back to the Archean, and it was these sulfur isotopes, as part of molecules such as hydrogen sulfide (H2S) and sulfur dioxide (SO2), which microbes metabolized, releasing oxygen in the process and beginning the process of oxygenating Earth’s atmosphere—a development referred to as the Great Oxygenation Event.
Because sulfur is quickly oxidized in an oxygen-rich environment, and then removed from the atmosphere by precipitation and run-off into the ocean, the sulfur chemistry of early Archean life was phased out and lost to time. However, by understanding the mass independent fractionation process, it should be possible to learn more about the atmosphere of the pre-oxygenated Earth and the conditions in which the first life on Earth lived.
The process behind the mass independent fractionation of sulfur remains uncertain, but the two most popular hypotheses are either photolysis (the breaking apart of molecules) by ultraviolet light from the Sun, or reactions between elemental sulfur. “However, the actual phenomenon, reaction or mechanism is still to be identified,” says Dmitri Babikov, a Professor of Physical Chemistry and Molecular Physics at Marquette University in Milwaukee, Wisconsin.
Sulfur’s molecular bonds
Babikov, along with his Marquette colleagues Igor Gayday and Alexander Teplukhin, have published a new paper in the journal Molecular Physics that explores some of the molecular bonds of a sulfur-4 (S4) molecule, and how these bonds affect the vibrational modes of the molecule, which in turn may influence the mass independent fractionation process.
They identified a second, previously unknown, bond that joins together S2 molecules (containing two sulfur atoms) to form S4. “This second bond holds the molecule tight in a [trapezoid-shaped] arrangement and does not allow easy rotation of the two S2 molecules within S4,” says Babikov. In turn, this arrangement of sulfur atoms then determines how they move as the S4 molecule vibrates.
The vibrational states, or frequencies, of the S4 molecule are determined by both the shape of the molecule’s ‘potential energy surface,” which describes the energy of the isotopes in the trapezoid arrangement of the S4 molecule, and how chemical reactions change the potential energy of that system. Not only do the number of vibrational modes, involving stretching and compression of the bonds between the S2 molecules, have a bearing on the reaction rate, but they could also be sensitive to a given isotope, which could help identify the chemical reaction behind mass independent fractionation. “But at this point this is still a hypothesis,” says Babikov.
A better understanding of the role of mass independent fractionation in the sulfur chemistry of Archean Earth not only gives us a picture of the environment on Earth before oxygenation, but it also tells us about the potential biosignatures a similar environment on an exoplanet could create.
“[Sulfur isotopes] could potentially serve as a signature of the environment that created life on Earth,” says Babikov. However, he says, our current level of telescopic technology means it would be very difficult to determine the isotopic composition of an exoplanet’s atmosphere to the required level of detail.
The study, “Computational analysis of vibrational modes in tetra-sulfur using dimensionally reduced potential energy surface,” was published in the journal Molecular Physics. The work was supported in part by NASAAstrobiology through the Exobiology Program.
Reference:
Igor Gayday et al. Computational analysis of vibrational modes in tetra-sulfur using dimensionally reduced potential energy surface, Molecular Physics (2019). DOI: 10.1080/00268976.2019.1574038
The season that an earthquake occurs could affect the extent of ground failure and destruction that the event brings, according to a new look at two historical earthquakes that occurred about 100 years ago near Almaty, Kazakhstan.
In a paper published in Seismological Research Letters, researchers conclude that the June 1887 magnitude 7.3 Verny earthquake and the nearby January 1911 magnitude 7.8 Kemin earthquake likely produced similar shaking. However, the 1911 earthquake caused significantly more ground failure, probably due to a shallow frozen ground layer that was present during the winter months.
The frozen layer may have inhibited the drainage of pore-pressure excess through the surface during the earthquake, causing liquefaction at depth. In effect, the frozen layer extending about one meter below the surface “was a sealant layer that was not allowing the pore pressure to diffuse,” explained Stefano Parolai, a co-author of the paper at the Istituto Nazionale di Oceanografia e di Geofisica Sperimentale in Italy.
The findings suggest seismologists should incorporate potential seasonal differences in soil characteristics “as they are making probabilistic liquefaction or ground failure assessments,” added co-author Denis Sandron, also at the Istituto Nazionale.
The effect of frozen ground on ground deformation is already calculated for some types of infrastructure such as oil pipelines in Alaska, but Parolai said the Kazakhstan study shows the importance of considering these effects in urban areas as well, especially when it can become a seasonal effect.
The Verny (Verny is the former name of Almaty) earthquake destroyed nearly all of the town’s adobe buildings and killed 300 people in 1887. The Kemin earthquake, which took place about 40 kilometers from Verny, caused a surprising amount of widespread ground failure and destruction and 390 deaths.
Parolai and his colleagues reviewed historical records of the two earthquakes as part of a larger project studying site effects and seismic risk in central Asia led by the GFZ German Research Centre for Geosciences. The two Almaty earthquakes, including their secondary effects such as landslides, “were very well documented by expeditions of the Mining Department of Russia and the Russian Mining Society at the time,” Parolai said.
The differences in ground failure between the two earthquakes were perplexing to the researchers. The fact that the two earthquakes had taken place at different times of year prompted Sandron and his colleagues to consider whether frozen ground might have been a factor in ground failure, as previous researchers had noted for the 1964 magnitude 9.2 Great Alaska earthquake.
To explore this idea, the research team created computer simulations of the earthquakes using different models of the soil profile that would affect the velocity of seismic waves passing through them, along with temperature data (more than 100 years of temperature recordings exist for Almaty) to determine whether it would be likely to have a frozen layer of ground at shallow depth during January.
One of the other challenges, said co-author Rami Alshembari ,formerly of the International Centre for Theoretical Physics in Italy and currently at the University of Exeter in the United Kingdom, was finding a way to include appropriate strong motion data recordings in the simulations, since “of course there were no digital recordings of these two earthquakes. We had to choose the most reasonable and robust studies for input of strong motion,” finally settling on data taken from the 1999 magnitude 7.6 Chi-Chi earthquake in Taiwan, appropriately modified, as being most similar to the Almaty earthquakes.
Models that included a one-meter deep frozen layer as a seal against pore pressure draining were the best fit for the ground failure seen in the Kemin earthquake, they concluded. Although the researchers suspected that a frozen layer could be the culprit, Parolai said they were surprised by the strength of the effect.
The findings suggest that other seismologists should consider seasonality in their site effect studies, he noted. “Even in materials where we would not expect this effect, due to local conditions and temperatures it could happen.”
“Without this good documentation, probably we would not have noticed this effect,” said Parolai. “This is telling us that good data taken in the past can be very precious in 100 years.”
Reference:
Rami Alshembari et al. Seasonality in Site Response: An Example from Two Historical Earthquakes in Kazakhstan. Seismological Research Letters (2019) doi.org/10.1785/0220190114
Left panel: Map of the upper section of the Aragón River. The locations of the CANF seismic station and the A271 gauge station are shown using red and yellow stars. Digital elevation model is provided by the Instituto Geográfico Nacional with a 25 m resolution (http://www.ign.es/ign/layoutIn/modeloDigitalTerreno.do). Coordinates are labeled in km (Universal Mercator projection). Right panel: Blow up map and pictures showing the morphology of the river channel in the vicinity of the recording site. Yellow dots show the location of each picture, all of them taken upstream
A team of researchers at Institute of Earth Sciences Jaume Almera of the Spanish National research Council (ICTJA-CSIC) have analysed the seismic signals generated by the variations in water flow of the Aragón river (Central Pyrenees) due to the snow melting in its upper basin. In the study, which has been published recently in the journal PLOS ONE, the researchers describe how they have been able to identify the different snowmelt episodes from the temporal variation patterns in the seismic data.
The authors of the study have used the data recorded from 2013 to 2016 with a seismometer located in the Laboratorio Subterráneo de Canfranc (LSC) in the Central Spanish Pyrenees, at about 400 m of the Aragón river channel.
The researchers calculated the daily spectrograms from the available data sets registered by the seismic broad band station. Spectrograms are graphics where the energy of the signal is represented in function of the frequency.
“During the snowmelt episodes we have been able to identify seismic signals with a characteristic spectrogram which allowed us to differentiate them from other seismic sources that were present in the background of the record”, explains Jordi Díaz, researcher at ICTJA-CIC and first author of the study.
Afterwards, the researchers designed an algorithm to make a hierarchical classification of the signal spectra, aimed to find common patterns. In this way, they could identify the days with snowmelt episodes as well as the intensity of these processes.
The researchers analysed the spectrograms to conclude that, in general, the snowmelt episodes are concentrated along the months of April and May. In some particular cases, such as in 2013, the researchers were even able to identify river rises derived from snowmelt at the beginning of July.
“Our results show a great variability among the different studied years, which is due to the variations in the atmospheric parameters like temperature, heat and precipitations.”, explains Jordi Díaz.
The authors have shown that the seismic data can be used to make automatic daily estimates of snowmelt intensity. The rise in river flow due to snowmelt has a daily cycle that starts at the beginning of the afternoon, after a few hours of insolation. According to this study, when the snow fusion intensity ranges between weak and moderate, the rise in flow features a sensible reduction towards the end of the night hours. During the most intense snowmelt episodes, the river flow is more stable along the day, but is still more intense during the afternoon.
“Under good circumstances, that is, with low noise level caused by human activities, seismic records can be a useful tool to study and monitor this kind of hydrological phenomena in the long-term scale and can contribute, for instance, to understand the outcomes of Climate Change”, concludes Jordi Díaz.
Reference:
Díaz, J., Sánchez-Pastor, P., Ruiz, M. (2019) Hierarchical classifcation of snowmelt episodes i the Pyrenees using seismic data. PLOS ONE. 14(10):e0223644. DOI: 10.1371/journal.pone.0223644
Peaty sedimentary archive from a palm swamp collected with a Russian corer. (Image:Encarni Montoya)
“Mauritia flexuosa” is the most widespread plant in the Orinoco Delta, in north-western Venezuela. This has not always been the case in the past. This palm, locally known as “moriche”, started its domination over the vegetal community of the area 3000 years ago, according to a new research that has reconstructed for the first time the ecological dynamics and evolution of the Orinoco’s Delta for the last 6200 years. The authors of the study, which has been published in Quaternary Science Reviews, have been able to identify 3 different periods characterized by different types of vegetation.
“With this research we have seen the importance of both local and superregional natural drivers in the vegetation dynamics”, says Encarni Montoya, researcher at Institute of Earth Sciences Jaume Almera of the Spanish National Research Council (ICTJA-CSIC) and lead author of the study.
Researchers extracted a 141 cm-long sediment core from a swamp near “caño Tigre”. The sediment samples were analysed by means of paleomagnetic techniques, X Ray diffraction, and stable isotope analysis.
Moreover, scientists analysed pollen samples from the recovered sediment core to know the vegetation type that existed in the area throughout the studied period. A radiocarbon analysis was carried out to date exactly the different layers of the sediments. Charcoal particles were also analysed as a proxy to obtain information about the fires occurred in the region, from which obtain clues about human settlement periods.
researchers notes that, although forested during the last 6200 years, the composition of the forest of the region have greatly varied through the time. Thanks to the fossil pollen samples found in the sediments, researchers could identify three well-distinguished periods depending on the different vegetal species that populated the delta.
According to the study, the first vegetal community, the oldest odf the register, was a mixed rainforest with coastal elements. This community was replaced 5400 years ago by a more inland-mixed-swamp forest community, a shift probably related with the progress of the coastline as a consequence of the sea level stabilization after the deglaciation.
Finally, 3000 years ago, the current vegetal community was established: a swamp dominated by “Mauritia flexuosa” palm”, during a wide unstable climatic period under the influence of the El Niño–Southern Oscillation (ENSO).
The indigenous Warao culture calls “Mauritia flexuosa” “The tree of life”, highlighting the importance of this palm for this human community that live dispersed in an intricate labyrinth of river channels and creeks of the Orinoco Delta.
“Processes like the sea level rise after the last glaciation or the frequency and intensity of climatic phenomena like the ENSO are crucial in determining the type of vegetation that establishes or persists in a new community”, notes Montoya, who is currently professor at University of Liverpool.
According to Encarni Montoya, this research shows “how fast the vegetal community of the delta has responded to the environmental changes throughout the last 6200 years, a process of special interest to understand the possibly future scenery marked by global change”.
“Coastal systems, and specially the deltas are especially vulnerable to the climate changes due to its proximity to the sea”, explains Encarni Montoya. “Given the variety of factors that may disrupt in this areas, the studies about the behaviour and dynamics of the ecosystem are fundamental”, adds the researcher who hopes that this work “awakes the interest of the scientific community and the society for this so magnificent area which is still unknown and which is currently facing some human induced threats, like oil prospection and extraction activities”.
The Orinoco is one of the largest rivers of South America and it discharges into the Atlantic Ocean in the North East of Venezuela, where it forms a big delta shaped by hundreds of little rivers and channels (called “caños”).
Reference:
Montoya, E., Pedra-Méndez, J., García-Falcó, E., Gómez-Paccard, M., Giralt, S., Vegas-Vilarrúbia, T., W. Stauffer, F., Rull, V. (2019) Long-term vegetation dynamics of a tropical megadelta: Mid-Holocene palaeoecology of the Orinoco Delta (NE Venezuela). Quaternary Science Reviews. Volume 221, 105874, DOI: 10.1016/j.quascirev.2019.105874.
An ore is a natural occurrence of rock or sediment which contains enough minerals with economically important elements, typically metals, that can be extracted from the deposit economically. The ores are extracted by mining for a profit from the earth; they are then refined (often by smelting) in order to extract the valuable elements.
The ore quality, and density of a rock or metal ore, as well as its occurrence type, can directly affect the ore mining costs. It is therefore necessary to weigh the extraction cost against the metal value contained in the rock to determine which ore can be processed and which ore is too low a grade to be worth mining.
Metal ores are generally oxides, sulfides, silicates, or native metals (such as native copper) not commonly concentrated in the crust of the Earth, or noble metals (normally not forming compounds) such as gold. To remove the elements of interest from the waste material and the ore crystals, the ores must be extracted. A variety of geological processes form ore bodies. The formation of the ore process is called the genesis of the ore.
Classification of Ore Minerals
Ore Mineral deposits are categorized according to different criteria that have been established through the study of economic geology or mineral genesis. Typical are the classifications below.
Hydrothermal epigenetic deposits
Mesothermal lode gold deposits, typified by the Golden Mile, Kalgoorlie
Archaean conglomerate hosted gold-uranium deposits, typified by Elliot Lake, Ontario,
Canada and Witwatersrand, South Africa
Carlin–type gold deposits, including;
Epithermal stockwork vein deposits
Granite related hydrothermal
IOCG or iron oxide copper gold deposits, typified by the supergiant Olympic Dam Cu-Au-U deposit
Intrusive-related copper-gold +/- (tin-tungsten), typified by the Tombstone, Arizona deposits
Hydromagmatic magnetite iron ore deposits and skarns
Skarn ore deposits of copper, lead, zinc, tungsten, etcetera
Magmatic deposits
Magmatic nickel-copper-iron-PGE deposits including
– Cumulate vanadiferous or platinum-bearing magnetite or chromite
– Cumulate hard-rock titanium (ilmenite) deposits
– Komatiite hosted Ni-Cu-PGE deposits
– Subvolcanic feeder subtype, typified by Noril’sk-Talnakh and the Thompson Belt, Canada
– Intrusive-related Ni-Cu-PGE, typified by Voisey’s Bay, Canada and Jinchuan, China
Lateritic nickel ore deposits, examples include Goro and Acoje, (Philippines) and Ravensthorpe, Western Australia.
Volcanic-related deposits
Volcanic hosted massive sulfide (VHMS) Cu-Pb-Zn including;
Examples include Teutonic Bore and Golden Grove, Western Australia
– Besshi type
– Kuroko type
Metamorphically reworked deposits
Podiform serpentinite-hosted paramagmatic iron oxide-chromite deposits, typified by Savage River, Tasmania iron ore, Coobina chromite deposit
Broken Hill Type Pb-Zn-Ag, considered to be a class of reworked SEDEX deposits
Carbonatite-alkaline igneous related
Phosphorus-tantalite-vermiculite (Phalaborwa South Africa)
Rare earth elements – Mount Weld, Australia and Bayan Obo, Mongolia
Diatreme hosted diamond in kimberlite, lamproite or lamprophyre
Sedimentary deposits
Banded iron formation iron ore deposits, including
– Channel-iron deposits or pisolite type iron ore
Heavy mineral sands ore deposits and other sand dune hosted deposits
Alluvial gold, diamond, tin, platinum or black sand deposits
Alluvial oxide zinc deposit type: sole example Skorpion Zinc
Sedimentary hydrothermal deposits
SEDEX
– Lead-zinc-silver, typified by Red Dog, McArthur River, Mount Isa, etc.
– Stratiform arkose-hosted and shale-hosted copper, typified by the Zambian copperbelt.
– Stratiform tungsten, typified by the Erzgebirge deposits, Czechoslovakia
– Exhalative spilite-chert hosted gold deposits
Mississippi valley type (MVT) zinc-lead deposits
Hematite iron ore deposits of altered banded iron formation
Astrobleme-related ores
Sudbury Basin nickel and copper, Ontario, Canada
Ore Extraction
The basic extraction of ore deposits follows these steps:
Prospecting or exploration to find and then define the extent and value of ore where it is located (“ore body”)
Conduct resource estimation to mathematically estimate the size and grade of the deposit
Conduct a pre-feasibility study to determine the theoretical economics of the ore deposit. This identifies, early on, whether further investment in estimation and engineering studies is warranted and identifies key risks and areas for further work.
Conduct a feasibility study to evaluate the financial viability, technical and financial risks and robustness of the project and make a decision as whether to develop or walk away from a proposed mine project. This includes mine planning to evaluate the economically recoverable portion of the deposit, the metallurgy and ore recoverability, marketability and payability of the ore concentrates, engineering, milling and infrastructure costs, finance and equity requirements and a cradle to grave analysis of the possible mine, from the initial excavation all the way through to reclamation.
Development to create access to an ore body and building of mine plant and equipment
The operation of the mine in an active sense
Reclamation to make land where a mine had been suitable for future use
Examples of Ore Minerals
Acanthite (cooled polymorph of Argentite): Ag2S for production of silver
Barite: BaSO4
Bauxite Al(OH)3 and AlOOH, dried to Al2O3 for production of aluminium
Beryl: Be3Al2(SiO3)6
Bornite: Cu5FeS4
Cassiterite: SnO2
Chalcocite: Cu2S for production of copper
Chalcopyrite: CuFeS2
Chromite: (Fe, Mg)Cr2O4 for production of chromium
Cinnabar: HgS for production of mercury
Cobaltite: (Co, Fe)AsS
Columbite-Tantalite or Coltan: (Fe, Mn)(Nb, Ta)2O6
Researchers at the The University of Western Australia have uncovered evidence of a new type of fossilization that may explain how some of Earth’s oldest microfossils formed and might even help scientists detect evidence of past life on other planets.
Microfossils provide important clues about the early history of life on Earth, however some mystery still surrounds how they were preserved.
It generally thought that many of the oldest microfossils formed when silica grew on their cell walls encasing the microorganism. When the microorganism died, their cells rapidly decayed, leaving behind only traces of carbon in a hollow cavity that molded the shape of the organism.
The scientists worked on the 340-million-year-old Red Dog zinc-lead deposit in northern Alaska, and found the carbon filling of semi-hollow microfossils was not derived from the original organism but from migrated oil.
UWA Professor Birger Rasmussen from the School of Earth Sciences said the team found that oil infiltration of silica-entombed bacteria was responsible for producing the structures, which resembled many of the oldest microfossils preserved in the rock record.
“Using high-resolution electron microscopes, we found microfossils located around oil-carrying fractures were black and filled by a thin film of carbon,” Professor Rasmussen said.
“In contrast, microfossils between the fractures contained little or no internal carbon and were virtually invisible.”
Professor Rasmussen said the formation of carbon-rich microfossils around fractures suggested oil moving through the cracks in the rock had seeped into the semi-hollow molds left after the bacteria died.
“What we have found is a new process of fossilization.” Professor Rasmussen said.
“We are now looking at rock samples from other localities to examine what role oil might have played in the preservation of microfossils on the early Earth.
“The results may have implications for how we assess whether ancient microstructures are signs of life on early Earth and how we might detect biosignatures on Mars and other rocky planets.”
The research was jointly carried out by Professor Birger Rasmussen and Dr. Janet Muhling at The University of Western Australia and is published in the journal Geology.