A team of researchers at Institute of Earth Sciences Jaume Almera of the Spanish National research Council (ICTJA-CSIC) have analysed the seismic signals generated by the variations in water flow of the Aragón river (Central Pyrenees) due to the snow melting in its upper basin. In the study, which has been published recently in the journal PLOS ONE, the researchers describe how they have been able to identify the different snowmelt episodes from the temporal variation patterns in the seismic data.
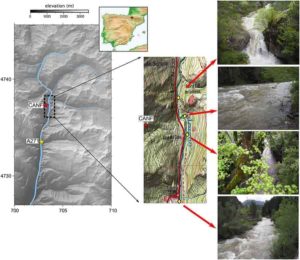
The authors of the study have used the data recorded from 2013 to 2016 with a seismometer located in the Laboratorio Subterráneo de Canfranc (LSC) in the Central Spanish Pyrenees, at about 400 m of the Aragón river channel.
The researchers calculated the daily spectrograms from the available data sets registered by the seismic broad band station. Spectrograms are graphics where the energy of the signal is represented in function of the frequency.
“During the snowmelt episodes we have been able to identify seismic signals with a characteristic spectrogram which allowed us to differentiate them from other seismic sources that were present in the background of the record”, explains Jordi Díaz, researcher at ICTJA-CIC and first author of the study.
Afterwards, the researchers designed an algorithm to make a hierarchical classification of the signal spectra, aimed to find common patterns. In this way, they could identify the days with snowmelt episodes as well as the intensity of these processes.
The researchers analysed the spectrograms to conclude that, in general, the snowmelt episodes are concentrated along the months of April and May. In some particular cases, such as in 2013, the researchers were even able to identify river rises derived from snowmelt at the beginning of July.
“Our results show a great variability among the different studied years, which is due to the variations in the atmospheric parameters like temperature, heat and precipitations.”, explains Jordi Díaz.
The authors have shown that the seismic data can be used to make automatic daily estimates of snowmelt intensity. The rise in river flow due to snowmelt has a daily cycle that starts at the beginning of the afternoon, after a few hours of insolation. According to this study, when the snow fusion intensity ranges between weak and moderate, the rise in flow features a sensible reduction towards the end of the night hours. During the most intense snowmelt episodes, the river flow is more stable along the day, but is still more intense during the afternoon.
“Under good circumstances, that is, with low noise level caused by human activities, seismic records can be a useful tool to study and monitor this kind of hydrological phenomena in the long-term scale and can contribute, for instance, to understand the outcomes of Climate Change”, concludes Jordi Díaz.
Reference:
Díaz, J., Sánchez-Pastor, P., Ruiz, M. (2019) Hierarchical classifcation of snowmelt episodes i the Pyrenees using seismic data. PLOS ONE. 14(10):e0223644. DOI: 10.1371/journal.pone.0223644
Note: The above post is reprinted from materials provided by Institute of Earth Sciences Jaume Almera of the Spanish National Research Council (ICTJA-CSIC). The original article was written by Jordi Díaz.


 have analysed the ..)