New insights into how microbial life was quickly re-established following the mass extinction of the dinosaurs have been detailed for the first time by Curtin University-led research.
The research, published in Geology, analyzed biomarkers, also known as molecular fossils, found in drill core rock samples from the center of the Chicxulub crater located in deep sea waters of the Gulf of Mexico.
The findings suggest that remains from land plants, fungi and coastal microbial mats, like modern stromatolites, were transported into the crater through wave activity during a giant tsunami in the immediate aftermath of the giant asteroid impact credited with causing the extinction of the dinosaurs, 66 million years ago.
Lead author Ph.D. candidate Bettina Schaefer, from the WA-Organic and Isotope Geochemistry Centre (WA-OIGC) in Curtin’s School of Earth and Planetary Sciences, said the research study provided the first molecular evidence of many forms of photosynthetic life present in the Chicxulub crater, demonstrating how resilient microorganisms were after experiencing abnormally hostile conditions following the asteroid’s impact.
“Our research shows that when the dust from the asteroid’s impact settled and sunlight returned to ideal levels, there was a rapid resurgence of land plants, dinoflagellates, cyanobacteria and all forms of anaerobic photosynthetic sulfur bacteria, including those from microbial mats in the crater area,” Ms Schaefer said.
John Curtin Distinguished Professor Kliti Grice, the founding director of WA-OIGC in Curtin’s School of Earth and Planetary Sciences, said the research findings further suggested the phytoplankton communities in the post-impact crater basin continued to produce and evolve at a “rapid” rate.
“The development and productivity of phytoplankton was accompanied by major transitions in nutrient and oxygen supplies that shaped the recovery of microbial life. There was so much going on in such a short time frame, it really was like a post-apocalyptic microbial mayhem was happening in the Chicxulub crater.”
Reference:
Bettina Schaefer et al. Microbial life in the nascent Chicxulub crater, Geology (2020). DOI: 10.1130/G46799.1
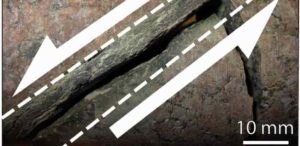
Fault zone with broken rock inside stippled lines and faulting directions of each rock segment outlined by half arrows. Photo credit: Henrik Drake. Illustration: Mikael Tillberg.
Constraining the history of earthquakes produced by bedrock fracturing is important for predicting seismic activity and plate tectonic evolution. In a new study published in the Nature journal Scientific Reports Jan 17, 2020, a team of researchers presents a new microscale technique to determine the age of crystals grown during repeated activation of natural rock fractures over a time range of billions of years.
The dramatic energy release of an earthquake forms as bedrock segments move in relative opposite directions to each other due to the collision or spreading of the tectonic plates that makes up the Earth’s crust. The movement occurs along fault planes where new mineral crystals grow simultaneously.
The bedrock of Scandinavia, up to two billion years old, displays an extensive network of fractures formed at different episodes stretching from the early history of the Scandinavian crust to modern times. In rock samples retrieved from deep boreholes in Sweden, new microscale radioisotopic dating of individual fault crystals reveals the dominant fracturing episodes affecting Scandinavia.
Mikael Tillberg, a doctoral student at the Linnaeus University, Sweden, and first author of the paper, explains, “The ages of our analysed crystals matches several distinct periods of extensive mountain range formation when plate boundaries were directly neighboring Scandinavia. These temporal constraints demonstrate that our newly developed approach is suitable to untangle complex fracturing histories.”
Thomas Zack, of Gothenburg University, Sweden, and a co-author of the study, describes how the dating method works. “Specific minerals contain radiogenic elements where certain isotopes decay over time. The abundances of these isotopes in tiny crystals formed on fracture surfaces are measured with high precision and detailed spatial resolution.”
“The link between crystal growth and the frictional movement of earthquakes is ensured by identifying striation lines formed on fracture surface crystals by the movement. This microscopic investigation precedes age analysis to enable a simple and robust procedure for dating of faulting,” Henrik Drake at Linnaeus University, also a co-author, adds.
Mikael Tillberg summarizes on the significance and possible future applications of this technique:
“Repeated earthquake episodes produce a chaotic array of broken rock and mineral growth even in a single crystal or on a particular fracture surface. Our methodology can resolve these sequences and connect the microscale mechanisms involved in fracturing to continent-wide plate tectonic forces. This allows reconstruction of geological models for diverse applications such as seismicity and infrastructure engineering.”
Reference:
Mikael Tillberg et al. In situ Rb-Sr dating of slickenfibres in deep crystalline basement faults, Scientific Reports (2020). DOI: 10.1038/s41598-019-57262-5
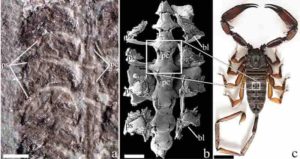
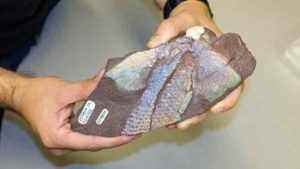
The fossil (left) was unearthed in Wisconsin in 1985. Scientists analyzed it and discovered the ancient animal’s respiratory and circulatory organs (center) were near-identical to those of a modern-day scorpion (right). Credit: Andrew Wendruff
Scientists studying fossils collected 35 years ago have identified them as the oldest-known scorpion species, a prehistoric animal from about 437 million years ago. The researchers found that the animal likely had the capacity to breathe in both ancient oceans and on land.
The discovery provides new information about how animals transitioned from living in the sea to living entirely on land: The scorpion’s respiratory and circulatory systems are almost identical to those of our modern-day scorpions — which spend their lives exclusively on land — and operate similarly to those of a horseshoe crab, which lives mostly in the water, but which is capable of forays onto land for short periods of time.
The researchers named the new scorpion Parioscorpio venator. The genus name means “progenitor scorpion,” and the species name means “hunter.” They outlined their findings in a study published today in the journal Scientific Reports.
“We’re looking at the oldest known scorpion — the oldest known member of the arachnid lineage, which has been one of the most successful land-going creatures in all of Earth history,” said Loren Babcock, an author of the study and a professor of earth sciences at The Ohio State University.
“And beyond that, what is of even greater significance is that we’ve identified a mechanism by which animals made that critical transition from a marine habitat to a terrestrial habitat. It provides a model for other kinds of animals that have made that transition including, potentially, vertebrate animals. It’s a groundbreaking discovery.”
The “hunter scorpion” fossils were unearthed in 1985 from a site in Wisconsin that was once a small pool at the base of an island cliff face. They had remained unstudied in a museum at the University of Wisconsin for more than 30 years when one of Babcock’s doctoral students, Andrew Wendruff — now an adjunct professor at Otterbein University in Westerville — decided to examine the fossils in detail.
Wendruff and Babcock knew almost immediately that the fossils were scorpions. But, initially, they were not sure how close these fossils were to the roots of arachnid evolutionary history. The earliest known scorpion to that point had been found in Scotland and dated to about 434 million years ago. Scorpions, paleontologists knew, were one of the first animals to live on land full-time.
The Wisconsin fossils, the researchers ultimately determined, are between 1 million and 3 million years older than the fossil from Scotland. They figured out how old this scorpion was from other fossils in the same formation. Those fossils came from creatures that scientists think lived between 436.5 and 437.5 million years ago, during the early part of the Silurian period, the third period in the Paleozoic era.
“People often think we use carbon dating to determine the age of fossils, but that doesn’t work for something this old,” Wendruff said. “But we date things with ash beds — and when we don’t have volcanic ash beds, we use these microfossils and correlate the years when those creatures were on Earth. It’s a little bit of comparative dating.”
The Wisconsin fossils — from a formation that contains fossils known as the Waukesha Biota — show features typical of a scorpion, but detailed analysis showed some characteristics that were not previously known in any scorpion, such as additional body segments and a short “tail” region, all of which shed light on the ancestry of this group.
Wendruff examined the fossils under a microscope, and took detailed, high-resolution photographs of the fossils from different angles. Bits of the animal’s internal organs, preserved in the rock, began to emerge. He identified the appendages, a chamber where the animal would have stored its venom, and — most importantly — the remains of its respiratory and circulatory systems.
This scorpion is about 2.5 centimeters long — about the same size as many scorpions in the world today. And, Babcock said, it shows a crucial evolutionary link between the way ancient ancestors of scorpions respired under water, and the way modern-day scorpions breathe on land. Internally, the respiratory-circulatory system has a structure just like that found in today’s scorpions.
“The inner workings of the respiratory-circulatory system in this animal are, shape-wise, identical to those of the arachnids and scorpions that breathe air exclusively,” Babcock said. “But it also is incredibly similar to what we recognize in marine arthropods like horseshoe crabs. So, it looks like this scorpion, this lineage, must have been pre-adapted to life on land, meaning they had the morphologic capability to make that transition, even before they first stepped onto land.”
Paleontologists have for years debated how animals moved from sea to land. Some fossils show walking traces in the sand that may be as old as 560 million years, but these traces may have been made in prehistoric surf — meaning it is difficult to know whether animals were living on land or darting out from their homes in the ancient ocean.
But with these prehistoric scorpions, Wendruff said, there was little doubt that they could survive on land because of the similarities to modern-day scorpions in the respiratory and circulatory systems.
Reference:
Andrew J. Wendruff, Loren E. Babcock, Christian S. Wirkner, Joanne Kluessendorf & Donald G. Mikulic. A Silurian ancestral scorpion with fossilised internal anatomy illustrating a pathway to arachnid terrestrialisation. Scientific Reports, 2020 DOI: 10.1038/s41598-019-56010-z
Note: The above post is reprinted from materials provided by Ohio State University. Original written by Laura Arenschield.
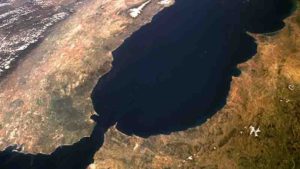
Satellite image of the Gibraltar Arc. Credit: NASA
A new study made by researchers at the Institute of Earth Sciences Jaume Almera of the Spanish National Research Council (ICTJA-CSIC) has been able to describe the effects of the lithospheric structure on the topography of the Strait of Gibraltar area. This new research shows the deep structure of the plate boundary between Africa and Eurasia across the Gibraltar Arc. It describes the distribution of density, temperature and composition of the lithosphere and sublithosphere (up to 400 km deep).
The study, published recently in Journal of Geophysical Research: Solid Earth, estimates that the topography of the Strait of Gibraltar in the orogenic domain of the Betics and the Rif subsides by 1500 meters and is linked to the subduction in the Gibraltar Arc region.
“We’ve been able to describe the lithospheric geometry and to identify sublithospheric anomalies of temperature and density and to link them with their topographic effects on the surface, in the area of the Gibraltar Strait and the Alborán Sea,” said Ivone Jiménez-Munt, a researcher at the ICTJA-CSIC and first author of the study.
“The thickening of the lithosphere beneath the Betics and Rif tectonic domain is linked with the subduction of the Iberian plate, visible in the seismic tomography. We estimate that the weight of this lithospheric slab sinking into the mantle may have pulled down the topography of the Strait of Gibraltar by about 1500 m,” said Jiménez- Munt.
“The latest part of this subsidence could be responsible for the reconnection of the Atlantic Ocean and the Mediterranean Sea, leading to the reflooding of the Mediterranean after the Messinian Salinity Crisis,” researchers stated in the article.
The new model proposed in this study constructs the lithospheric structure along a 945 km long geotransect, a profile that extends from the south of the South Iberian Massif to the Anti-Atlas, crossing the Betics-Rif orogen, the Strait of Gibraltar, and the Atlas Mountains. The study area is the result of the convergence between the African plate, moving towards the north, and the Iberian plate.
The work shows significant variations at the boundary between the lithosphere, the outermost Earth layer that includes the crust and part of the upper mantle, and the asthenosphere, a denser and more fluid layer of the mantle, over which the lithosphere moves. Under the Betics and Rif mountain ranges the boundary between lithosphere and asthenosphere reaches its maximum values, about 220 and 260 km deep, respectively.
The researchers developed this model using the new LitMod2D _2.0 modelling code which integrates petrological (chemical composition of the mantle), geophysical (gravimetry, geoid, heat flow, topography) and existing seismic data.
“While we were developing the model, we found difficulties in fitting all the observables. We detected anomalies in the geoid and gravimetric data,” said Ivone Jiménez- Munt. “The geoid is very sensitive to deep density anomalies,” she added. These mismatches could only be explained by the presence of the subducting slab of the Iberian plate under the Alboran Sea east of the studied profile.
“We think that this colder and heavier sinking plate may have some influence on the detected anomaly of the geoid,” said Jiménez-Munt. Researchers incorporated a body with the same geochemical composition as the Iberian plate and colder than the surrounding asthenosphere into the model. They were then able to fit the observables. “This sublithospheric anomaly incorporated into the model simulates the subducting plate. By estimating its density, we were able to simulate its effect on the surface,” explained Jiménez- Munt.
The studied area is complex. “This is the plate boundary between Africa and Eurasia, but in this area, the boundary is diffused and producing a large deformation area. In the past, this boundary had been jumping between the south of the Iberian Peninsula and the north, in the Pyrenees, and at present is distributed between the Betics and North Africa. Although it is a convergent boundary, there had been periods of extension, and the hypothesis that it is an arcuate subduction is becoming stronger; that is, a subduction characterized by “breaking off ” of the subducting slab from its upper part from east to west,” says Jiménez- Munt.
Montserrat Torné, Manel Fernández, Jaume Verges, Ajay Kumar, Alberto Carballo and Daniel García-Castellanos are the other ICTJA-CSIC researchers involved in this research.
Reference:
I. Jiménez‐Munt et al. Deep Seated Density Anomalies Across the Iberia‐Africa Plate Boundary and Its Topographic Response, Journal of Geophysical Research: Solid Earth (2019). DOI: 10.1029/2019JB018445
Charoite (K(Ca, Na)2Si4O10(OH, F)·H2O) is a rare mineral silicate, first described in 1978 and named for the River Chara. It was recorded only from Aldan Shield, Republic of Sakha, Siberia, Russia. It is located where a Murunskii Massif syenite has intruded into and altered calcareous deposits which create a metasomatite of potassium feldspar.
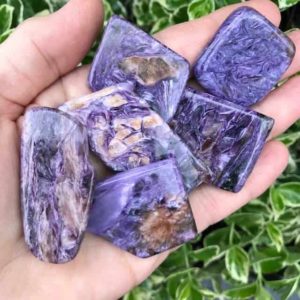
Charoite colors are indeed unmistakable, ranging from light lilac to lavender and from near-violet to medium-deep violet. Within a single specimen, most charoite gemstones show many violet to purple colors, and shape with very unique patterns, often swirling, streaking, or feather-like in nature. The spinning shapes are called a charoite signature characteristic and owed to its interlocking complex fibrous crystal structure.
Charoite was named after the Chary River of Yakutia, the location where it was first discovered, around 1940. Despite the fact that it was first made sometime during the 1940s, it is considered a relatively recent gemstone, as it was not launched until 1978 on a commercial level. To this day the only source of charoite gemstones has been the Murun complex in the Sakha Republic, Siberia.
Charoite forms from calcareous deposits transformed by heat, pressure and injection of special chemicals (alkali-rich intrusions of nephline syenite). This process is known as’ contact metamorphism’ and is thought to be a common phenomenon in geology. Given that the forming mechanism is quite simple, it has never been fully understood why charoite occurrences are uncommon and limited only to the small region from which they are mined.
Charoite mostly appears opaque in clarity but it may seem somewhat transparent in some cases Charoite’s mild to moderate chatoyancy, best seen in species with higher translucency, is one of the most desirable characteristics. The chatoyantness adds pearly luster to the silky. Light-colored inclusions, as well as fibrous and fine-grained parallel inclusions, are very common as they are responsible for the attractive chatoyancy phenomenon (the cat’s eye effect).
Topaz is a silicate aluminum and fluorine mineral with the Al2SiO4(F, OH)2 chemical formula. Topaz crystallizes in the orthorhombic system, and its crystals are mostly pyramidal and other faces terminated with prismatics. It is one of the hardest naturally occurring minerals (Mohs hardness of 8) and is the most difficult of any mineral silicate. This longevity paired with its normal flexibility and changing.
What Color Is Topaz?
Natural topaz is translucent and colourless, just like natural corundum. The wide range of topaz colors available are due either to natural trace impurities or crystal structural defects. Diversity in color is also caused by changes produced by the gemstone industry. Topaz is available in a variety of colors from yellow, orange, gray, purple, blue, black, violet and green.
Colorless topaz is fairly common and is rarely given a dazzling cut and sold as a diamond replacement. Indeed one of the world’s most famous topaz gemstones is a colorless topaz originally thought to be a diamond.
The most common colors of untreated topaz are pale yellow, brown and gray. Pastel shades of light-green, violet and pink are also found. The most popular topaz color is blue. Indeed, blue topaz is the perennial top selling jewelry stone in the USA.
The most valuable topaz colour known as imperial topaz, is an orange to pink colour. The exact color is not well known for imperial topaz, so a wide range of golden orange, peach and pink topaz are offered under this name. Several light-pink topaz gems are the result of treatment with heat.
What is the rarest color of topaz?
Imperial Topaz, also known as Precious Topaz is the rarest and most valuable of the Topaz family, coming in colors ranging from golden yellow to the extremely prized sherry pink color.
What causes color in topaz ?
Tpoaz which is aluminum flurosilicate is normally colorless in the absence of impurities. The main impurity contained in topaz is iron, but iron does not directly impart any color to topaz as chromium impurities do in rubies, which impart the red color. Within rubies the chromium atoms are directly excited by the absorption of visible light photons. As they return to their ground states, the chromium atoms that leap to an excited state emit light in the red region of the visible spectrum. In the case of topaz, the iron atoms create another unstable species in the crystal and this new species moves to an excited state by absorbing a visible photon of light that emits light from different regions of the spectrum, depending on their wavelength, as they return to the earth, giving rise to the variety of colors found in topaz, including the golden yellow or golden brown color
Naturally colored topaz like yellow, orange and brown topaz contain stable to light color centers. If a colorless topaz is irradiated by ultraviolet light, x-rays, gamma rays or high-energy electrons, we can get a color of yellow, orange or gray, but this color is typically unstable and will disappear in light after a few days. But blue topaz created by irradiation creates color centers that are stable like natural blue topaz color centers and therefore do not fade in light. Only heating will kill these color centers, when the topaz is colorless again.
Color varieties are often known simply by the name of the hue— blue topaz, green topaz, and so on — but there are a few special trade names, too. Imperial topaz is a medium to deep-red reddish orange. This is one of the most expensive shades of the stone. Sherry topaz-named after the sherry wine-is a brown to orange color or brownish. Stones are often called precious topaz in this color range to help differentiate them from the closely colored but less costly citrine and smoky quartz.
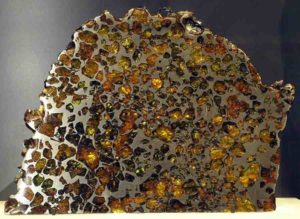
Representative Image: An example of a Pallasite meteorite (from the Esquel fall) on display in the Vale Inco Limited Gallery of Minerals at the Royal Ontario Museum. Credit: Captmondo/Wikimedia
Stars have life cycles. They’re born when bits of dust and gas floating through space find each other and collapse in on each other and heat up. They burn for millions to billions of years, and then they die. When they die, they pitch the particles that formed in their winds out into space, and those bits of stardust eventually form new stars, along with new planets and moons and meteorites. And in a meteorite that fell fifty years ago in Australia, scientists have now discovered stardust that formed 5 to 7 billion years ago — the oldest solid material ever found on Earth.
“This is one of the most exciting studies I’ve worked on,” says Philipp Heck, a curator at the Field Museum, associate professor at the University of Chicago, and lead author of a paper describing the findings in the Proceedings of the National Academy of Sciences. “These are the oldest solid materials ever found, and they tell us about how stars formed in our galaxy.”
The materials Heck and his colleagues examined are called presolar grains-minerals formed before the Sun was born. “They’re solid samples of stars, real stardust,” says Heck. These bits of stardust became trapped in meteorites where they remained unchanged for billions of years, making them time capsules of the time before the solar system..
But presolar grains are hard to come by. They’re rare, found only in about five percent of meteorites that have fallen to Earth, and they’re tiny-a hundred of the biggest ones would fit on the period at the end of this sentence. But the Field Museum has the largest portion of the Murchison meteorite, a treasure trove of presolar grains that fell in Australia in 1969 and that the people of Murchison, Victoria, made available to science. Presolar grains for this study were isolated from the Murchison meteorite for this study about 30 years ago at the University of Chicago.
“It starts with crushing fragments of the meteorite down into a powder ,” explains Jennika Greer, a graduate student at the Field Museum and the University of Chicago and co-author of the study. “Once all the pieces are segregated, it’s a kind of paste, and it has a pungent characteristic-it smells like rotten peanut butter.”
This “rotten-peanut-butter-meteorite paste” was then dissolved with acid, until only the presolar grains remained. “It’s like burning down the haystack to find the needle,” says Heck.
Once the presolar grains were isolated, the researchers figured out from what types of stars they came and how old they were. “We used exposure age data, which basically measures their exposure to cosmic rays, which are high-energy particles that fly through our galaxy and penetrate solid matter,” explains Heck. “Some of these cosmic rays interact with the matter and form new elements. And the longer they get exposed, the more those elements form.
“I compare this with putting out a bucket in a rainstorm. Assuming the rainfall is constant, the amount of water that accumulates in the bucket tells you how long it was exposed,” he adds. By measuring how many of these new cosmic-ray produced elements are present in a presolar grain, we can tell how long it was exposed to cosmic rays, which tells us how old it is.
The researchers learned that some of the presolar grains in their sample were the oldest ever discovered-based on how many cosmic rays they’d soaked up, most of the grains had to be 4.6 to 4.9 billion years old, and some grains were even older than 5.5 billion years. For context, our Sun is 4.6 billion years old, and Earth is 4.5 billion.
But the age of the presolar grains wasn’t the end of the discovery. Since presolar grains are formed when a star dies, they can tell us about the history of stars. And 7 billion years ago, there was apparently a bumper crop of new stars forming-a sort of astral baby boom.
“We have more young grains that we expected,” says Heck. “Our hypothesis is that the majority of those grains, which are 4.9 to 4.6 billion years old, formed in an episode of enhanced star formation. There was a time before the start of the Solar System when more stars formed than normal.”
This finding is ammo in a debate between scientists about whether or not new stars form at a steady rate, or if there are highs and lows in the number of new stars over time. “Some people think that the star formation rate of the galaxy is constant,” says Heck. “But thanks to these grains, we now have direct evidence for a period of enhanced star formation in our galaxy seven billion years ago with samples from meteorites. This is one of the key findings of our study.”
Heck notes that this isn’t the only unexpected thing his team found. As almost a side note to the main research questions, in examining the way that the minerals in the grains interacted with cosmic rays, the researchers also learned that presolar grains often float through space stuck together in large clusters, “like granola,” says Heck. “No one thought this was possible at that scale.”
Heck and his colleagues look forward to all of these discoveries furthering our knowledge of our galaxy. “With this study, we have directly determined the lifetimes of stardust. We hope this will be picked up and studied so that people can use this as input for models of the whole galactic life cycle,” he says.
Heck notes that there are lifetimes’ worth of questions left to answer about presolar grains and the early Solar System. “I wish we had more people working on it to learn more about our home galaxy, the Milky Way,” he says.
“Once learning about this, how do you want to study anything else?” says Greer. “It’s awesome, it’s the most interesting thing in the world.”
“I always wanted to do astronomy with geological samples I can hold in my hand,” says Heck. “It’s so exciting to look at the history of our galaxy. Stardust is the oldest material to reach Earth, and from it, we can learn about our parent stars, the origin of the carbon in our bodies, the origin of the oxygen we breathe. With stardust, we can trace that material back to the time before the Sun.”
“It’s the next best thing to being able to take a sample directly from a star,” says Greer.
This study was contributed to by researchers from the Field Museum, University of Chicago, Lawrence Livermore National Laboratory, Washington University, Harvard Medical School, ETH Zurich, and the Australian National University. Funding was provided by NASA, the TAWANI Foundation, the National Science Foundation, the Department of Energy, the Swiss National Science Foundation, the Brazilian National Council for Scientific and Technological Development and the Field Museum’s Science and Scholarship Funding Committee.
Reference:
Philipp R. Heck, Jennika Greer, Levke Kööp, Reto Trappitsch, Frank Gyngard, Henner Busemann, Colin Maden, Janaína N. Ávila, Andrew M. Davis, Rainer Wieler. Lifetimes of interstellar dust from cosmic ray exposure ages of presolar silicon carbide. Proceedings of the National Academy of Sciences, Jan. 13, 2020; DOI: 10.1073/pnas.1904573117
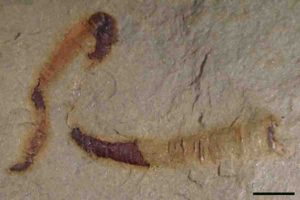
A fossilized cloudinomorph from the Montgomery Mountains near Pahrump, Nevada. This is representative of the fossil that was analyzed in the study.
A 550-million-year-old fossilized digestive tract found in the Nevada desert could be a key find in understanding the early history of animals on Earth.
Over a half-billion years ago, life on Earth was composed of simple ocean organisms unlike anything living in today’s oceans. Then, beginning about 540 million years ago, animal structures changed dramatically.
During this time, ancestors of many animal groups we know today appeared, such as primitive crustaceans and worms, yet for years scientists did not know how these two seemingly unrelated communities of animals were connected, until now. An analysis of tubular fossils by scientists led by Jim Schiffbauer at the University of Missouri provides evidence of a 550 million-year-old digestive tract — one of the oldest known examples of fossilized internal anatomical structures — and reveals what scientists believe is a possible answer to the question of how these animals are connected.
The study was published in Nature Communications, a journal of Nature.
“Not only are these structures the oldest guts yet discovered, but they also help to resolve the long-debated evolutionary positioning of this important fossil group,” said Schiffbauer, an associate professor of geological sciences in the MU College of Arts and Science and director of the X-ray Microanalysis Core facility. “These fossils fit within a very recognizable group of organisms — the cloudinids — that scientists use to identify the last 10 to 15 million years of the Ediacaran Period, or the period of time just before the Cambrian Explosion. We can now say that their anatomical structure appears much more worm-like than coral-like.”
The Cambrian Explosion is widely considered by scientists to be the point in history of life on Earth when the ancestors of many animal groups we know today emerged.
In the study, the scientists used MU’s X-ray Microanalysis Core facility to take a unique analytical approach for geological science — micro-CT imaging — that created a digital 3D image of the fossil. This technique allowed the scientists to view what was inside the fossil structure.
“With CT imaging, we can quickly assess key internal features and then analyze the entire fossil without potentially damaging it,” said co-author Tara Selly, a research assistant professor in the Department of Geological Sciences and assistant director of the X-ray Microanalysis Core facility.
The study, “Discovery of bilaterian-type through-guts in cloudinomorphs from the terminal Ediacaran Period,” was published in Nature Communications. Other authors include Sarah Jacquet from MU; Rachel Merz from Swarthmore College; Michael Strange from the University of Nevada, Las Vegas; Yaoping Cai from Northwest University in Xi’an, China; and Lyle Nelson and Emmy Smith from Johns Hopkins University.
Funding was provided by grants from the NSF Sedimentary Geology and Paleobiology Program (CAREER 1652351) and Instrumentation and Facilities Program (1636643). The content is solely the responsibility of the authors and does not necessarily represent the official views of the funding agencies.
Reference:
James D. Schiffbauer, Tara Selly, Sarah M. Jacquet, Rachel A. Merz, Lyle L. Nelson, Michael A. Strange, Yaoping Cai, Emily F. Smith. Discovery of bilaterian-type through-guts in cloudinomorphs from the terminal Ediacaran Period. Nature Communications, 2020; 11 (1) DOI: 10.1038/s41467-019-13882-z
The fire agate is a semi-precious natural gemstone which has only been discovered in certain areas of central, northern Mexico (New Mexico, Arizona and California) and in the southwestern United States (New Mexicans). These areas were subjected to massive volcanic activity during the Tertiary Period, around 24-36 million years ago.
Fire agate gemstone deposits were formed in these particular regions approximately 24-36 million years ago when the areas were subjected to massive volcanic activity during the Tertiary Period. Geological conditions within these different regions vary which produce differences in the type and style of fire agate found in each region. The agate formation, size, color and fire layer thickness all vary within these different geographic locations.
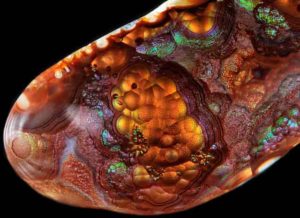
Ithave beautiful iridescent rainbow colors, similar to opal, with a Mohs scale hardness measurement of between 5 and 7 which reduces scratching when polished gemstones are put in jewellery. The vibrant iridescent rainbow colors found in fire agates, created by the Schiller effect as found in mother-of-pearl, are caused by the alternating layers of silica and iron oxide, which diffract and allow light to pass through and form a color interference within the stone’s microstructure layering causing the fire effect for which it is named.
Mohs scale hardness: 6 – 7 Color: Blue to yellow to red Formula mass: 60 g / mol Luster: Waxy, vitreous, dull, greasy, silky Crystal system: Trigonal, monoclinic
How fire agate is formed?
It is a type of chalcedony (SiO2) which contains multiple, extremely thin layers of the iron oxide minerals of Goethite (FeO(OH)) and Limonite (FeO(OH)·nH20) imbedded within, and commonly completely enclosed by, semi-transparent to translucent layers of cryptocrystalline chalcedony. When cut and polished down to the layers containing the iron oxides, the stone displays a metallic, shimmering iridescence known as the Schiller Effect, where light is reflected and refracted off the various layers containing the Goethite and Limonite iron oxides to give the exquisite play of colors—or “fire”—for which the gemstone is named. Colors displayed by the “fire” vary greatly, the most common being shades of orangish brown, but also all shades and tones of yellow, orange, red, and green, and more rarely, purples and blues.
Is fire agate rare?
It is by far more rare than diamonds, emeralds or rubies. Gem quality which has been found only in the past sixty years in parts of California, Arizona and Mexico, making it the rarest, most colorful gem in the world.
Where is fire agate found?
The fire agate is a semi-precious natural gemstone which has only been discovered in certain areas of central, northern Mexico (New Mexico, Arizona and California)
The following is a list of some different minerals Sites . Some of these sites are open for public rockhounding and other are private mining claims or are situated on a restricted public country where any form of mineral collection is forbidden.
Black Hills, Arizona – BLM Public Rockhounding Site
Oatman, Arizona – Cuesta Fire Agate Mine
Opal Hill, California – Opal Hill Fire Agate Mine
Round Mountain, Arizona – BLM Public Rockhounding Site
Saddle Mountain, Arizona – Outdoor Recreation and Fire Agate Rockhounding Site
Deer Creek, Arizona, Fire Agate Location
Slaughter Mountain, Arizona – San Carlos Apache Fire Agate Mine
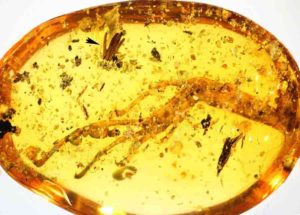
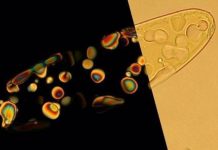
100 million-year-old amber piece with lizard leg and mycomycete (arrow). Credit: Alexander Schmidt, University of Göttingen and Scientific Reports
Most people associate the idea of creatures trapped in amber with insects or spiders, which are preserved lifelike in fossil tree resin. An international research team of palaeontologists and biologists from the Universities of Göttingen and Helsinki, and the American Museum of Natural History in New York has now discovered the oldest slime mould identified to date. The fossil is about 100 million years old and is exquisitely preserved in amber from Myanmar. The results have been published in the journal Scientific Reports.
Slime moulds, also called myxomycetes, belong to a group known as “Amoebozoa.” These are microscopic organisms that live most of the time as single mobile cells hidden in the soil or in rotting wood, where they eat bacteria. However, they can join together to form complex, beautiful and delicate fruiting bodies, which serve to make and spread spores.
Since fossil slime moulds are extremely rare, studying their evolutionary history has been very difficult. So far, there have only been two confirmed reports of fossils of fruiting bodies and these are just 35 to 40 million years old. The discovery of fossil myxomycetes is very unlikely because their fruiting bodies are extremely short-lived. The researchers are therefore astounded by the chain of events that must have led to the preservation of this newly identified fossil.
“The fragile fruiting bodies were most likely torn from the tree bark by a lizard, which was also caught in the sticky tree resin, and finally embedded in it together with the reptile,” says Professor Jouko Rikkinen from the University of Helsinki. The lizard detached the fruiting bodies at a relatively early stage when the spores had not yet been released, which now reveals valuable information about the evolutionary history of these fascinating organisms.
The researchers were surprised by the discovery that the slime mould can easily be assigned to a genus still living today. “The fossil provides unique insights into the longevity of the ecological adaptations of myxomycetes,” explains palaeontologist Professor Alexander Schmidt from the University of Göttingen, lead author of the study.
“We interpret this as evidence of strong environmental selection. It seems that slime moulds that spread very small spores using the wind had an advantage,” says Rikkinen. The ability of slime moulds to develop long-lasting resting stages in their life cycle, which can last for years, probably also contributes to the remarkable similarity of the fossil to its closest present-day relatives.
Reference:
Jouko Rikkinen et al, Morphological stasis in the first myxomycete from the Mesozoic, and the likely role of cryptobiosis, Scientific Reports (2019). DOI: 10.1038/s41598-019-55622-9
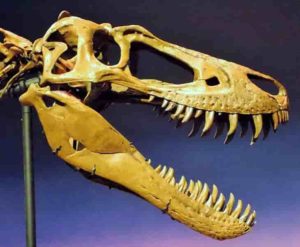
The skull of the juvenile T. rex, “Jane”, was slender with knife-like teeth, having not yet grown big enough to crush bone. Credit to Scott A. Williams
Without a doubt, Tyrannosaurus rex is the most famous dinosaur in the world. The 40-foot-long predator with bone crushing teeth inside a five-foot long head are the stuff of legend. Now, a look within the bones of two mid-sized, immature T. rex allow scientists to learn about the tyrant king’s terrible teens as well.
In the early 2000s, the fossil skeletons of two comparatively small T. rex were collected from Carter County, Montana, by Burpee Museum of Natural History in Rockford, Illinois. Nicknamed “Jane” and “Petey,” the tyrannosaurs would have been slightly taller than a draft horse and twice as long.
The team led by Holly Woodward, Ph.D., from Oklahoma State University Center for Health Sciences studied Jane and Petey to better understand T. rex life history.
The study “Growing up Tyrannosaurus rex: histology refutes pygmy ‘Nanotyrannus’ and supports ontogenetic niche partitioning in juvenile Tyrannosaurus” appears in the peer-reviewed journal Science Advances.
Co-authors include Jack Horner, presidential fellow at Chapman University; Nathan Myhrvold, founder and CEO of Intellectual Ventures; Katie Tremaine, graduate student at Montana State University; Scott Williams, paleontology lab and field specialist at Museum of the Rockies; and Lindsay Zanno, division head of paleontology at the North Carolina Museum of Natural Sciences. Supplemental histological work was conducted at the Diane Gabriel Histology Labs at Museum of the Rockies/Montana State University.
“Historically, many museums would collect the biggest, most impressive fossils of a dinosaur species for display and ignore the others,” said Woodward. “The problem is that those smaller fossils may be from younger animals. So, for a long while we’ve had large gaps in our understanding of how dinosaurs grew up, and T. rex is no exception.”
The smaller size of Jane and Petey is what make them so incredibly important. Not only can scientists now study how the bones and proportions changed as T. rex matured, but they can also utilize paleohistology — the study of fossil bone microstructure — to learn about juvenile growth rates and ages. Woodward and her team removed thin slices from the leg bones of Jane and Petey and examined them at high magnification.
“To me, it’s always amazing to find that if you have something like a huge fossilized dinosaur bone, it’s fossilized on the microscopic level as well,” Woodward said. “And by comparing these fossilized microstructures to similar features found in modern bone, we know they provide clues to metabolism, growth rate, and age.”
The team determined that the small T. rex were growing as fast as modern-day warm-blooded animals such as mammals and birds. Woodward and her colleagues also found that by counting the annual rings within the bone, much like counting tree rings, Jane and Petey were teenaged T.rex when they died; 13 and 15 years old, respectively.
There had been speculation that the two small skeletons weren’t T. rex at all, but a smaller pygmy relative Nanotyrannus. Study of the bones using histology led the researchers to the conclusion that the skeletons were juvenile T. rex and not a new pygmy species.
Instead, Woodward points out, because it took T. rex up to twenty years to reach adult size, the tyrant king probably underwent drastic changes as it matured. Juveniles such as Jane and Petey were fast, fleet footed, and had knife-like teeth for cutting, whereas adults were lumbering bone crushers. Not only that, but Woodward’s team discovered that growing T. rex could do a neat trick: if its food source was scarce during a particular year, it just didn’t grow as much. And if food was plentiful, it grew a lot.
“The spacing between annual growth rings record how much an individual grows from one year to the next. The spacing between the rings within Jane, Petey, and even older individuals is inconsistent — some years the spacing is close together, and other years it’s spread apart,” said Woodward.
The research by Woodward and her team writes a new chapter in the early years of the world’s most famous dinosaur, providing evidence that it assumed the crown of tyrant king long before it reached adult size.
Reference:
Holly N. Woodward, Katie Tremaine, Scott A. Williams, Lindsay E. Zanno, John R. Horner, Nathan Myhrvold. Growing up Tyrannosaurus rex: Osteohistology refutes the pygmy “Nanotyrannus” and supports ontogenetic niche partitioning in juvenile Tyrannosaurus. Science Advances, 2020; 6 (1): eaax6250 DOI: 10.1126/sciadv.aax6250
Fossil cast of a fin from a juvenile Sauripterus taylori, a late Devonian fish with primitive features of tetrapods. (Image: Matt Wood)
Research on fossilized fish from the late Devonian period, roughly 375 million years ago, details the evolution of fins as they began to transition into limbs fit for walking on land.
The new study by paleontologists from the University of Chicago, published this week in the Proceedings of the National Academy of Sciences, uses CT scanning to examine the shape and structure of fin rays while still encased in surrounding rock. The imaging tools allowed the researchers to construct digital 3D models of the entire fin of the fishapod Tiktaalik roseae and its relatives in the fossil record for the first time. They could then use these models to infer how the fins worked and changed as they evolved into limbs.
Much of the research on fins during this key transitional stage focuses on the large, distinct bones and pieces of cartilage that correspond to those of our upper arm, forearm, wrist, and digits. Known as the “endoskeleton,” researchers trace how these bones changed to become recognizable arms, legs and fingers in tetrapods, or four-legged creatures.
The delicate rays and spines of a fish’s fins form a second, no less important “dermal” skeleton, which was also undergoing evolutionary changes in this period. These pieces are often overlooked because they can fall apart when the animals are fossilized or because they are removed intentionally by fossil preparators to reveal the larger bones of the endoskeleton. Dermal rays form most of the surface area of many fish fins but were completely lost in the earliest creatures with limbs.
“We’re trying to understand the general trends and evolution of the dermal skeleton before all those other changes happened and fully-fledged limbs evolved,” said Thomas Stewart, PhD, a postdoctoral researcher who led the new study. “If you want to understand how animals were evolving to use their fins in this part of history, this is an important data set.”
Seeing ancient fins in 3D
Stewart and his colleagues worked with three late Devonian fishes with primitive features of tetrapods: Sauripterus taylori, Eusthenopteron foordi and Tiktaalik roseae, which was discovered in 2006 by a team led by UChicago paleontologist Neil Shubin, PhD, the senior author of the new study. Sauripterus and Eusthenopteron were believed to have been fully aquatic and used their pectoral fins for swimming, although they may have been able to prop themselves up on the bottom of lakes and streams. Tiktaalik may have been able to support most of its weight with its fins and perhaps even used them to venture out of the water for short trips across shallows and mudflats.
“By seeing the entire fin of Tiktaalik we gain a clearer picture of how it propped itself up and moved about. The fin had a kind of palm that could lie flush against the muddy bottoms of rivers and streams,” Shubin said.
Stewart and Shubin worked with undergraduate student Ihna Yoo and Justin Lemberg, PhD, another researcher in Shubin’s lab, to scan specimens of these fossils while they were still encased in rock. Using imaging software, they then reconstructed 3D models that allowed them to move, rotate and visualize the dermal skeleton as if it were completely extracted from the surrounding material.
The models showed that the fin rays of these animals were simplified, and the overall size of the fin web was smaller than that of their fishier predecessors. Surprisingly, they also saw that the top and bottom of the fins were becoming asymmetric. Fin rays are actually formed by pairs of bones. In Eusthenopteron, for example, the dorsal, or top, fin ray was slightly larger and longer than the ventral, or bottom one. Tiktaalik’s dorsal rays were several times larger than its ventral rays, suggesting that it had muscles that extended on the underside of its fins, like the fleshy base of the palm, to help support its weight.
“This provides further information that allows us to understand how an animal like Tiktaalik was using its fins in this transition,” Stewart said. “Animals went from swimming freely and using their fins to control the flow of water around them, to becoming adapted to pushing off against the surface at the bottom of the water.”
Stewart and his colleagues also compared the dermal skeletons of living fish like sturgeon and lungfish to understand the patterns they were seeing in the fossils. They saw some of the same asymmetrical differences between the top and bottom of the fins, suggesting that those changes played a larger role in the evolution of fishes.
“That gives us more confidence and another data set to say these patterns are real, widespread and important for fishes, not just in the fossil record as it relates to the fin-to-limb transition, but the function of fins broadly.”
The study, “Dorsoventral asymmetry in the dermal rays of tetrapodomorph paired fins,” was supported by the Brinson Foundation, the Academy of Natural Sciences, the University of Chicago Biological Sciences Division and the National Science Foundation. Additional authors include Natalia Taft from the University of Wisconsin — Parkside and Edward Daeschler from Drexel University.
Reference:
Thomas A. Stewart, Justin B. Lemberg, Natalia K. Taft, Ihna Yoo, Edward B. Daeschler, Neil H. Shubin. Fin ray patterns at the fin-to-limb transition. Proceedings of the National Academy of Sciences, 2019; 201915983 DOI: 10.1073/pnas.1915983117
The cruise is led by Ursula Röhl of MARUM (left) and Debbie Thomas of Texas A&M University (right). They are supported by the Expedition Project Manager Laurel Childress. Photo: SIEM offshore
The Earth’s Cenozoic Era began 66 million years ago with a bang—and with the last mass extinction event on Earth until now. The meteorite impact that marked the end of the Cretaceous Period and the beginning of the Cenozoic Era was followed by a number of dramatic global events, including a heat pulse 56 million years ago. Only after this remarkable boundary did mammals develop the diversity that we know today. The climate had cooled continuously over a long period of time. During this time the environmental conditions, ocean temperatures, ocean circulation, and wind patterns also changed fundamentally. In order to better understand each of these climatic events and the overall development of climate, it is necessary to have records of the Earth’s climate that are as complete and high-resolving as possible. It is especially important that these records include locations that play a key role in understanding the environmental conditions, ocean circulation and wind patterns at higher latitudes.
Zooming in on climate development
This is where the objectives of the upcoming Expedition 378 in the Southwest Pacific by the drilling vessel JOIDES RESOLUTION within the framework of the International Ocean Discovery Program (IODP) will have a significant impact. Using the deposits on the seafloor, the expedition team will produce detailed reconstructions of how the climate changed during the Cenozoic. This will include, for example, how the elevated global temperatures and the heat transport to the polar regions could be sustained 56 million years ago. It was warm all over the Earth; compared to the situation today, there was practically no temperature difference between the polar regions and the tropics, even though the solar radiation was no more intense than it is today.
The cruise is being led by Dr. Ursula Röhl of MARUM, the Center for Marine Environmental Sciences of the University of Bremen and Dr. Debbie Thomas of Texas A&M University (USA). It begins in January, will last almost five weeks, and ends in Papeete on Tahiti in February.
Return to the source of the first temperature curve
The primary goal, according to the expedition plan, is to drill several holes at a site from the predecessor program of IODP that was drilled in March 1973 at a water depth of 1,200 meters, but which only retrieved spot cores. “The temperature curve that was produced from this hole was one of the first ever constructed and, despite the sparse sampling, was able to illustrate for the first time characteristic climate fluctuations in the Cenozoic,” explains Ursula Röhl. Over the past 47 years, however, both the drilling techniques and the analytic methods have improved. “Returning to this location means that we can link to the source of this very first temperature curve for the Cenozoic Era.” This time there will be contiguous coring in an even deeper hole. A depth of up to 670 meters into the seafloor has been approved. By this depth the scientists hope to be able to verify all of the climatic events of the Cenozoic. Says Ursula Röhl, “We want to obtain as complete and high-quality a record as possible.”
Precise ages of the sediment deposits will be determined directly on board based on microfossils. This allows researchers to identify the meteorite impact at the Cretaceous-Paleogene boundary as well as the transitions from the Paleocene to the Eocene (Paleocene-Eocene Thermal Maximum—PETM) with an age of 56 million years and from the Eocene to Oligocene at 33.9 million years ago. The PETM is characterized by an abrupt release of large amounts of carbon that triggered a rapid temperature rise—a massive global heat pulse. The transition from the Eocene to Oligocene reflects strong global cooling and initiation of the permanent ice cover in Antarctica, and is therefore another important time interval in the Earth’s climate history.
The drill cores should improve our understanding of the climate events of the Cenozoic, especially in the subpolar region, including the structure of the ocean and the biogeochemical cycle. The shells of microfossils in the sediments contain chemical signatures of past climate conditions that are as unique as fingerprints. Based on the new information, researchers will be able to draw conclusions about the strength of oceanic upwelling and winds throughout millions of years, and make more precise statements about atmospheric and oceanic subsystems of the Earth’s climate.
“The sediments that we obtain will provide crucial data on ocean temperatures and the carbon cycle for the vast region of the southwestern Pacific. This new knowledge will lead to great advances in our understanding of climate dynamics during the warm periods,” adds co-chief scientist Debbie Thomas.
Due to a last-minute mechanical issue that developed shortly before departure, the expedition duration was shortened from nine to five weeks. This means that it will not be possible to drill at Point Nemo, the Pacific pole of inaccessibility, as originally planned. But at the same time, this will provide the team of researchers from twelve countries with the possibility to retrieve a complete sequence of sediments through the drilling of additional holes.
The magnitude of the Great Lisbon Earthquake event, a historic and devastating earthquake and tsunami that struck Portugal on All Saints’ Day in 1755, may not be as high as previously estimated.
In his study published in the Bulletin of the Seismological Society of America, Joao F. B. D. Fonseca at the Universidade de Lisboa used macroseismic data—contemporaneous reports of shaking and damage—from Portugal, Spain and Morocco to calculate the earthquake’s magnitude at 7.7. Previous estimates placed the earthquake at magnitude 8.5 to 9.0.
Fonseca’s analysis also locates the epicenter of the 1755 earthquake offshore of the southwestern Iberian Peninsula, and suggests the rupture was a complicated one that may have involved faulting onshore as well. This re-evaluation could have implications for the seismic hazard map of the region, he said.
The current maps are based on the assumption that most of the region’s crustal deformation is contained in large offshore earthquakes, without a significant onshore component. “While the current official map assigns the highest level of hazard to the south of Portugal, gradually diminishing toward the north, the interpretation now put forward concentrates the hazard in the Greater Lisbon area,” said Fonseca.
The 1755 Lisbon earthquake and tsunami event, along with the fires it caused that burned for hours in the city, is considered one of the deadliest earthquake events in history, leading to the deaths of about 12,000 people. The devastation had a significant impact on Portugal’s economy and its political power within Europe, and its philosophical and theological implications were widely discussed by Enlightenment scholars from Voltaire to Immanuel Kant.
The widespread devastation led earlier seismologists to estimate a high magnitude for the earthquake. With modern modeling techniques and a better understanding of the region’s tectonics, Fonseca thought it important to revisit the estimate. The 1755 earthquake is unusual in that it produced extreme damage hundreds of kilometers from its epicenter without any of the accompanying geological conditions—like amplification of seismic waves in a loose sedimentary basin, for instance—that normally cause such severe site effects.
“Explanations put forward for the extreme damage in Lisbon tend to invoke abnormally low attenuation of seismic energy as the waves move away from the epicenter, something that is not to be observed anywhere else in the globe,” Fonseca explained. “Current attempts to harmonize seismic hazard assessment across Europe are faced with large discrepancies in this region, which need to be investigated and resolved for a better mitigation and management of the risk through building codes and land use planning.”
Fonseca used 1206 points of macroseismic data to reassess the 1755 earthquake’s magnitude and epicenter. The analysis and modeling also indicate that some of the very high earthquake intensities reported in the region’s nearby Lower Tagus Valley and the Algarve may have been due to two separate onshore earthquakes in these locations. These earthquakes, which took place a few minutes after the offshore rupture, may have been triggered by the first earthquake, Fonseca suggests.
The new magnitude estimate for the 1755 earthquake is similar to that of another large regional earthquake, the 1969 magnitude 7.8 Gorringe Bank quake. However, the damage from the Gorringe Bank earthquake was much less severe, possibly in part because the onshore faults had not accumulated enough stress to make them “ripe to rupture,” Fonseca says. “The Lower Tagus Fault, near Lisbon, ruptured in 1909, in 1531 and likely in 1344. It is plausible that it was good to go in 1755, but still halfway through the process of accumulating stress in 1969.”
Fonseca also suggests that the destructive size of the 1755 accompanying tsunami might be due more to the presence of a large sedimentary body produced by past subduction, called an accretionary wedge, on the ocean bottom in the Gulf of Cadiz. When a fault rupture moves through this wedge, it can generate a tsunami even without an extreme magnitude rupture, he said.
Reference:
Joao F. B. D. Fonseca. A Reassessment of the Magnitude of the 1755 Lisbon Earthquake. Bulletin of the Seismological Society of America (2020) DOI: 10.1785/0120190198
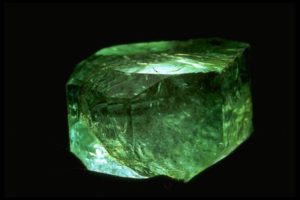
Gachala Emerald. Photo by Chip Clark/Smithsonian Institution
The Gachala Emerald was discovered in 1967 in the mine called Vega de San Juan, located in Gachala, a town in Colombia, 142 km (88 mi) from Bogota. It is one of the most precious and popular emeralds in the world. Gachalá Chibcha means “Gacha’s spot.” Today, the emerald is in the United States, where the New York City jeweler, Harry Winston, donated it to the Smithsonian Institution.
The more pure green color the emerald displays, the more valuable it is. Its color is caused by impurity atoms of either chromium or vanadium, which are incorporated into beryl crystals as they grow.
The emerald was named in honor of Gachalá, the municipality of Cundinamarca where it was found
Characteristics of Gachalá Emerald
Shape: Emerald
Color: Intense green
Carats: 858 Carats
Weight: 172 grams
Size: 5 centimeters
Year of extraction: 1967
The “Gachala Emerald” is a thin hexagonal prism with a height of 5 cm and a diameter of almost the same length, which conforms to the normal crystal habit of the emeralds. At the upper end of the crystal, the hexagonal form of the crystal is more apparent, but it is not a regular hexagon with two opposite sides of the hexagon shorter than the other four sides. Even on the sides of the crystal, the six sides of the crystal can be marked, although from the sides the crystal appears more cubical than hexagonal. The crystal color is a pure dark green, and it appears that the crystal is opaque. We may not be able to say anything about the gemstone’s diaphaneity unless the crystal is polished. Nevertheless, it is well known that with enhanced brightness, most Gachala emeralds have strong clarity and shine. One of the world’s largest gem-quality emerald crystals, the “Gachala Emerald.”
Where was the Gachala emerald found?
In 1967, the 858ct Gachala Emerald crystal was discovered in Gachala, Colombia, at the Vega de San Juan mine. These scale and superb color emerald crystals are rarely preserved; they are usually cut into gems. Harry Winston gave the Smithsonian the Gachala Emerald in 1969.
Gachala Emeralds Special Features
Generally speaking, gachala emeralds are finer, with less defects and inclusions than emeralds from other Colombian mines like Muzo, Coscuez and Chivor. For strong visibility, transparency and brightness, the emeralds are usually “brow clean.” Their color is typically pale green, though. The darker vivid green colors, despite the presence of inclusions, command the highest prices compared to the pale green but much cleaner stones, is a crucial factor in emerald color that defines their value. Sadly, the best green colors tend to be the most included in the emeralds.
The Gachala Emerald exhibited at the Tucson Show of February 2003
At the 49th Tucson Gem & Mineral Society exhibition in February 2003, the “Gachala Emerald” was displayed. Michael Scott, former president of Apple Computer Company, who is also a collector and connoisseur of gemstones and minerals, opened the show from 13 to 17 February with an evening reception and chat. The theme of the 2003 exhibition was the “Minerals of the Andes.” The display was attended by several private collectors and museums, which displayed a great collection of specimens of Andes origin as well as from other sources.
The exhibition was a spectacular success, with one of the best ever being said to be the variety of exhibits shown. The exhibition was attended by about two dozen museums and pulled out their best exhibits. The Star attraction among the displays shown by the Smithsonian Institution’s National Museum of Natural History was the 858-carat “Gachala Emerald,” of Andean origin, which was exhibited in tandem with the famous Marjorie Merriweather Post emerald necklace, also of Colombian origin, with 24 baroque polished round emeralds. Two proustites, a Bolivian phosphophyllite crystal accompanied by a faceted diamond of 26.9 carats, and other unusual specimens such as franckeite, andorite, helvite, and canfieldite were among the other mineral specimens of Andean origin displayed by the Smithsonian Institution.
Michael Scott, Gene and Roz Meieran, Bill Larson, Rock Currier, Steve and Clara Smale and W were among the private collectors who showed impressive exhibits that gained much attention. There’s R. Danner.
The Gachala Emerald is exhibited at the Smithsonian’s NMNH
As part of the National Gem Collection, the “Gachala Emerald” is now on display at the Janet, Annenberg Hooker Hall of Geology, Gems and Minerals, the Smithsonian National Museum of Natural History, along with other famous emeralds such as the Mackay Emerald Necklace, the Hooker Emerald Brooch, the Chalk Emerald Ring, the Maximilian Emerald Ring, the Spanish Inquisition Necklace and others.
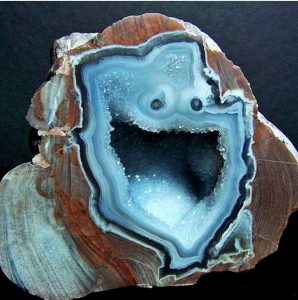
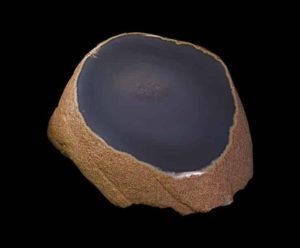
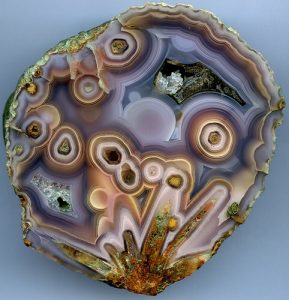
Agate is a gemstone used in different pieces of decoration and jewelry. It’s made of silica and chalcedony. The silica crystals, mostly Chalcedony, form a brightly colored grainy stone known by the people as Agate. It was given the name “Agate” after the river “Achates” where it was first found once. In southwestern Sicily, Achates is situated.
It’s found mostly in volcanic rocks or lavas. Agate is powerful in filling the cracks in volcanic rocks once the lava bursts from them. When agate is transversally sweet, it depicts a parallel line network. Such lines appear slightly on the surface and tend to divide agate into various sections. Agate is known as banded agate with such lines.
Types of Agate
Onyx Agate
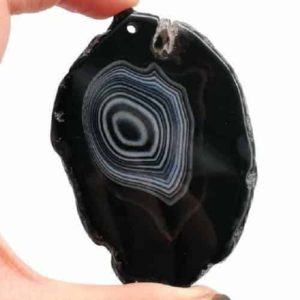
Black Onyx Agate Stone Slab Slice 4
Onyx specifically refers to silicate mineral chalcedony’s parallel banded form. Agate and onyx are both layered chalcedony varieties which differ only in band form: agate has curved bands and onyx has parallel bands. His bands ‘ colors range from black to nearly any color. Onyx specimens usually contain bands of black and/or white. Onyx has also been applied as a descriptive term to parallel banded alabaster, marble, obsidian and opal types, and misleadingly to contorted banding materials such as “Cave Onyx” and “Mexican Onyx.”
Onyx comes through Latin (of the same spelling), from the Greek ὄνυξ, meaning “claw” or “fingernail”. Onyx with flesh-colored and white bands can sometimes resemble a fingernail. The English word “nail” is cognate with the Greek word.
Onyx is formed of bands of chalcedony in alternating colors. It is cryptocrystalline, consisting of fine intergrowths of the silica minerals quartz and moganite. Its bands are parallel to one another, as opposed to the more chaotic banding that often occurs in agates.
Sardonyx Agate
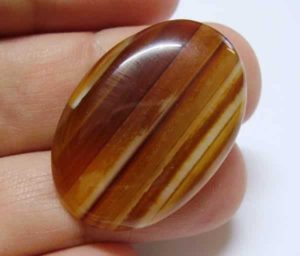
Agate Sardonyx Chalcedony Quartz Cabochon Lucky Stone 39.00ct
It is a variant in which the colored bands are sard (shades of red) rather than black. Black onyx is perhaps the most famous variety, but is not as common as onyx with colored bands. Artificial treatments have been used since ancient times to produce both the black color in “black onyx” and the reds and yellows in sardonyx. Most “black onyx” on the market is artificially colored.
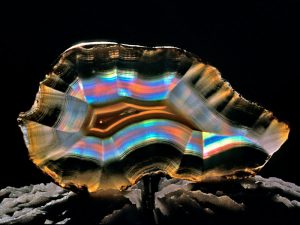
It looks very beautiful and delicate in banding, as the name suggests. Iris doesn’t mean it looks like the human iris. The name was given to her because of the colors of the rainbow. Iris is used in the rainbow as well. It is finely banded with a vibrant color display. You will see it reflecting the light while you hold it opposite to the sun. The light touches and reflects the thin bands within it.
Crazy Lace Agate
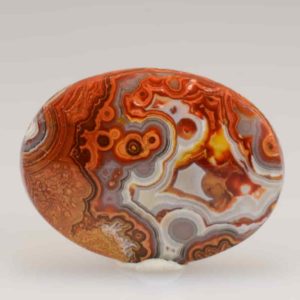
Crazy Lace Agate, Sierra Santa lucia, Ejido Benito Juarez, Chihuahua, Mexico, Size : 29 x 5 x 39mm. Credit: Kristalle
Crazy lace agate (also known as Mexican Agate) is a banded chalcedony (microcrystalline quartz) that’s infused with iron and aluminum and is often brightly colored and complexly patterned. This produces the creamy browns, blacks, greys and golds (and occasional pinks or reds) swirled together in this stone.
The white-colored banded Chalcedony makes it more attractive. Other layers can be brown, cream, black or gray in different colors. Some Crazy Lace Agate comes in colored bands of yellow, orange, golden and red. Occasionally, because of its multiple colors and light reflecting nature, the jewelers call it “Earth rainbow.”
Thunder-egg
Thunder Egg
A Thunder Egg “Thunderegg” is a nodule-like rock, similar to a filled geode, that is formed within rhyolitic volcanic ash layers. Thundereggs are rough spheres, most about the size of a baseball—though they can range from less than an inch to over a meter across. They usually contain centres of chalcedony which may have been fractured followed by deposition of agate, jasper or opal, either uniquely or in combination. Also frequently encountered are quartz and gypsum crystals, as well as various other mineral growths and inclusions.
Thundereggs usually look like ordinary rocks on the outside, but slicing them in half and polishing them may reveal intricate patterns and colours. A characteristic feature of thundereggs is that (like other agates) the individual beds they come from can vary in appearance, though they can maintain a certain specific identity within them.
Enhydro Agate
Enhydro Agate. Locality : Brasil. Size 13.5×11.6 cm. Credit: Didier Descouens
Enhydro agates are nodules, agates, or geodes with inside their cavity trapped in water. Enhydros are closely related to the inclusion of fluids, but consist of chalcedony. Enhydros formation remains an ongoing process, with specimens from the Eocene Epoch. We are frequently found in volcanic rock areas.
Enhydro agates are made up of banded microcrystalline or cryptocrystalline quartz. The agate has a hollow center, partially containing water. Enhydro agates can also contain debris or petroleum. Because the cavity is not full, the agate can produce sound from being shaken. Agates vary in size. The largest recorded agate was found in Fuxin City, China, with a diameter of 63 cm and weighing 310 kg.
Enhydros are formed when water rich in silica percolates through volcanic rock, forming layers of deposited mineral. As layers build up, the mineral forms a cavity in which the water becomes trapped. The cavity is then layered with the silica-rich water, forming its shell. Unlike fluid inclusions, the chalcedony shell is porous, allowing water to enter and exit the cavity very slowly. The water inside of an enhydro agate is most times not the same water as when the formation occurred. During the formation of an enhydro agate, debris can get trapped in the cavity. Types of debris varies in every agate.
Polyhedroid Agate
Polyhedroid Agates from Pariaba, Brazil
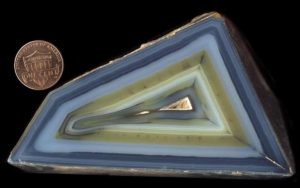
This type of agate has flat sides and is very similar to polyhedron in the color scheme. The layers of condensed polygons can be seen inside when cut from the middle. It is usually found in the state of Paraiba, Brazil. The crystals inside, when held against the sun, reflect the light and discharge beautiful rays.
Moss Agate
Moss Agate. Locality: TRENGGALEK, INDONESIA. SIZE : 25X17X6 mm. Credit: gem rock auctions
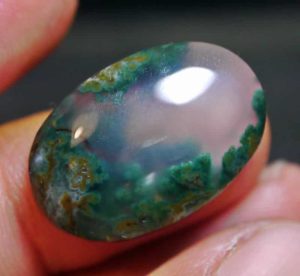
Moss agate is a semi-precious gemstone formed from silicon dioxide. It is a form of chalcedony which includes minerals of a green colour embedded in the stone, forming filaments and other patterns suggestive of moss. The field is a clear or milky-white quartz, and the included minerals are mainly oxides of manganese or iron. It is not a true form of agate, as it lacks agate’s defining feature of concentric banding. Moss agate is of the white variety with green inclusions that resemble moss. It occurs in many locations. The colors are formed due to trace amounts of metal present as an impurity, such as chrome or iron. The metals can make different colors depending on their valence (oxidation state).
Despite its name, moss agate does not contain organic matter and is usually formed from weathered volcanic rocks.
Montana moss agate is found in the alluvial gravels of the Yellowstone River and its tributaries between Sidney and Billings, Montana. It was originally formed in the Yellowstone National Park area of Wyoming as a result of volcanic activity. In Montana moss agate the red color is the result of iron oxide and the black color is the result of manganese oxide.
The Lake Superior Agate
The Lake Superior Agate. Photo by Lech Darski
The Lake Superior agate is a type of agate stained by iron and found on the shores of Lake Superior. Its wide distribution and iron-rich bands of color reflect the gemstone’s geologic history in Minnesota, Wisconsin, and Michigan. In 1969 the Lake Superior agate was designated by the Minnesota Legislature as the official state gemstone.
The Lake Superior agate was selected because the agate reflects many aspects of Minnesota. It was formed during lava eruptions that occurred in Minnesota about a billion years ago. The stone’s predominant red color comes from iron, a major Minnesota industrial mineral found extensively throughout the Iron Range region. Finally, the Lake Superior agate can be found in many regions of Minnesota as it was distributed by glacial movement across Minnesota 10,000 to 15,000 years ago.
Condor Agate
Condor Agate. Credit: Captain Tenneal
Condor agate was discovered and named by Luis de los Santos in 1993. It is found in the mountains near San Rafael, in Mendoza Province, Argentina. This agate exhibits colorful bands and patterns, and has become a popular stone among collectors and jewelry designers.
n the early days of condor agate collecting, a typical month of effort would yield 1 ton of good agates. Currently, excavation is required to find the agates, so an extra effort is needed to supply the ever growing demand for these gems. Initially, the agates were found scattered loose over the landscape and were readily harvested in quantity. Today, surface collecting is no longer prolific, so these agates are collected from shallow diggings in the cold agate fields in Mendoza province, Argentina.
Sagenite Agate
Golden Sagenite Needles in Very Clear Agate Mexico. Credit: ROBERT / VIKKI
It is formed by mixing Chalcedony with various minerals. The golden hair-like pointed lines make it more attractive and distinctive in its style.
Fortification Agate
Fortification Agate
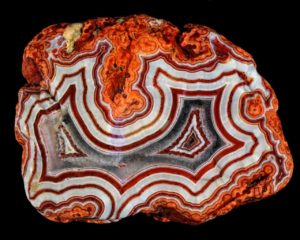
The name was given to it due to its sharp-edged bands. These bands resemble with a fortified castle with sharp angles. The array of white, light brown, orange, red and purple colors make it worthwhile.
Fairburn Agate
Fairburn Agate. Locality: South Dakota, USA. Credit: Captain Tenneal
It is a rare, but very beautiful type of agate found in Fairburn, Custer Co., South Dakota, USA. It is considered to be the state jewel of South Dakota, USA. That’s why when you break into two pieces you can see the beautiful patterns of colors and designs. When found naturally, the surface is rough.
Botswana Agate
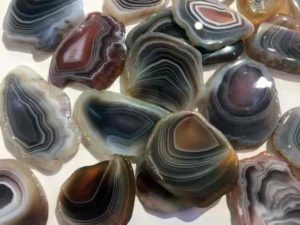
Botswana Agate
It is a unique agate available in dark and light gray and pink shades. However, some layers come with muted brown color.
Dendritic Agate
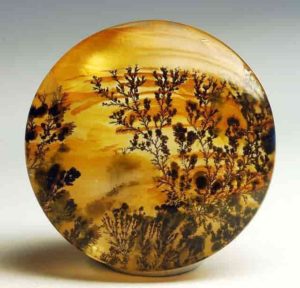
Dendritic Agate
It’s called the Plentitude Stone. It is considered to be the most valuable form of agate. Dendritic agate is associated with the ancient dryads of Greece. This type of agate is, therefore, a sign of good luck and the farmers use it to bury it in their fields to get the good crops.
Something like this goes through the formational process. First crystals grow in the gas cavity left in the volcanic andesite rock (in the case of the Coyamito Agate, these crystals are assumed to be aragonite). The agate then begins to form, cover the crystals and the cavity’s within. The more agate the coating on the crystals forms the thicker. This process can continue until the gas cavity is filled or, more often than not, the nodule leaves a hollow portion. Quartz or agate can, like all nodular agates, move from one to the other.
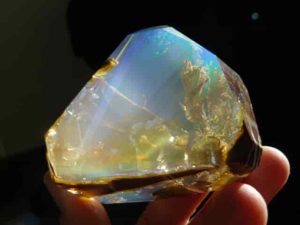
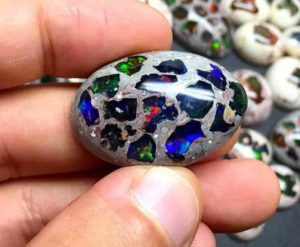
Opals are made out of rhyolite, basalt, sandstone, marl and rhyolite. A common source of opals are rhyolite geodes. The rocks, which means they have no properties of crystals, are known as mineraloids. It’s a silicon dioxide crystal-like product that is placed in cracks and cracks in rock at a somewhat low temperature.
Opals are also a gel high in a liquid content ranging from 3 to 30 percent water, but the opal gel acts as a solid. They’re essentially a silica spray! They can be quite cool and fragile, making it hard to hold them for jewelry after mounting.
Types of opals include: common and precious opals. Oregon opals include the types, rainbow, ryalite, contra luz, hydrophane, crystal, fire, blue, and dendritic.
Where to Find Opals in Oregon?
Baker County
Conner Creek Mining District “Baker Co.”
Swayze Creek “Baker Co.”
Clackamas County
Clackamas River localities “Clackamas Co.”
Oak Grove Fork “Clackamas Co.”
Columbia County
Neer Road, Goble “Columbia Co.”
Crook County
Howard Mining District (Ochoco Mining District; Bolivar Mining District) “Crook Co.”
Deschutes County
Newberry Caldera, East Lake “Deschutes Co.”
Harney County
Pueblo Mining District (Denio Mining District) “Harney Co.”
Hood River County
Pucci drillhole “Hood River Co.”
Jackson County
Ashland Mining District “Jackson Co.”
Butte Creek Mining District “Jackson Co.”
Evans Creek Mining District “Jackson Co.”
Meadows Mining District “Jackson Co.”
Jefferson County
Richardson Ranch (Priday Ranch), Madras “Jefferson Co.”
Klamath County
Oregon Technical Institute Occurrence “Klamath Co.”
Summit Rock “Klamath Co.”
Lake County
Christmas Valley pit, Christmas Valley “Lake Co.”
Hart Mountain “Lake Co.”
Juniper Ridge Opal Mine “Lake Co.”
Oregon Sunstone public collection area, Plush “Lake Co.”
Spectrum Mine, Plush “Lake Co.”
Madera Occurrence, Quartz Mountain “Lake Co.”
Quartz Mountain Gold Deposit (Fremont; Quartz Mountain Property), Quartz Mountain “Lake Co.”
School Creek Prospect “Lake Co.”
Malheur County
Brandon Occurrence (Quartz Mtn.; Glassy Butte) “Malheur Co.”
Owyhee Dam, Lake Owyhee State Park “Malheur Co.”
Aurora Uranium Prospect, Opalite District (McDermitt District) “Malheur Co.”
Rome Zeolite Occurrence “Malheur Co.”
Sheaville Zeolite Occurrence “Malheur Co.”
Succor Creek “Malheur Co.”
Marion County
Breitenbush Hot Springs Cinnabar Occurrence, Santiam District (Elkhorn District) “Marion Co.”
Morrow County
Opal Butte “Morrow Co.”
Opals are found nearly everywhere in the world, but how are we going to get to Oregon and find those deep wonders? The Juniper Ridge Opal mine is the site of a major opal discovery and development that has been going on for 30 years before being abandoned. After spending two years discovering and taking over the abandoned claim in 1998, a father and son team, Ken and Chuck Oldham, formed a group of lapidaries and miners. They opened it for a form of mining called “fee dig” mining after mining the claim for years.
Fee Dig mining is simple! Pay a small fee, get a little training and a spot to mine, and take away whatever you find!
Opal Butte is a mountain top close to Hepner City in Morrow County, Oregon. There is a working mine in operation since 1988, but it has been known since the 1800s, when opals were not regarded as important. There is a mine in the West Coast Mining Company, marketing opals through its outlets.
Klamath County, Oregon hosts Opal Creekand Klamath Falls, where opals have been found. The Favell museum in Klamath falls actually boasts an arrowhead made of fire opal!
Cantera opal is a type of Fire opals that do not show play of color are sometimes referred to as jelly opals. Cantera means “quarry,” and such stones come from quarries at Magdalena, Queretaro and possibly other Mexican locations. Mexican opals are sometimes cut in their rhyolitic host material if it is hard enough to allow cutting and polishing. This type of Mexican opal is referred to as a Cantera opal. Also, a type of opal from Mexico, referred to as Mexican water opal, is a colorless opal which exhibits either a bluish or golden internal sheen.
How is Opal Formed?
Opal is formed by a silicon dioxide and water solution. When water runs down the earth, it takes silica from sandstone and brings it into cracks and voids, created by natural faults or decomposing fossils. This leaves behind a layer of silica as the water evaporates.
How Cantera Opal is formed ?
Cantera Opal is a gemstone formed from the “Rhyolite”. Rhyolite is a kind of “Igneous Rock”
These are only found in Mexico and type the same as the Australian boulder opals, but the host rock is ryolite rather than ironstone.
Where are Mexican fire opals mined?
Mexican opal is mined in the Mexican states of Queretaro, Hidalgo, Guerrero, Michoacan, Julisio, Chihuahua and San Luis Potosi.
Obsidian is a natural volcanic glass that is formed as an igneous rock that is extrusive.
Obsidian is formed by rapidly cooling felsic lava extruded from a volcano with limited growth in crystals. It is commonly found in the margins of rhyolitic lava flows known as obsidian flows, where the chemical composition (high silica content) creates a high viscosity resulting in the production of natural glass from the lava after rapid cooling. This highly viscous lava’s inhibition of atomic diffusion explains the lack of crystal growth. Obsidian is rough, fragile, and amorphous, with very sharp edges breaking. It was used in the past for the manufacture of cutting and slicing equipment and was used experimentally as surgical scalpel blades.
Obsidian is mineral-like, but not a true mineral because it is not crystalline as a glass; however, it is too complex to be categorized as a mineral. It is classified as a mineraloid sometimes. While obsidian is usually dark in colour, similar to basalt-like mafic rocks, the composition of obsidian is extremely felsic. Obsidian mainly consists of SiO2 (silicon dioxide), typically 70% or more. With a similar composition, crystalline rocks include granite and rhyolite. Because obsidian is metastable on the surface of the Earth (the glass forms fine-grained mineral crystals over time), no obsidian older than the Cretaceous period has been found. The existence of water speeds up this process of obsidian. Although the newly formed obsidian has a low water content, usually less than 1 percent by weight, it is slowly hydrated to form perlite when exposed to groundwater.
How to Identify Obsidian?
How can you identify obsidian ? The lack of a crystalline structure indicates that obsidian is not a true mineral and causes extreme sharpness of the fracture surfaces. Since prehistoric times, obsidian has been used in cutting tools and is still used today in surgical scalpels.
Explore obsidian where cooling is rapid in the margins of lava flows. Glass Buttes in central Oregon is one of the best places to find obsidian in the U.S. Pieces of fist size can be found on the surface in abundance here.
Examine the obsidian’s general presence. It has a distinctive appearance of smooth glass. Obsidian is a frozen liquid that contains small amounts of mineral impurities.
See the color Because pure obsidian is usually dark, on rare occasions it may also be almost white.
Consider the effect of impurities on the obsidian color For examples, iron and magnesium may make obsidian dark green. Hematite or limonite add a red or brown color to the obsidian. A lot of microscopic rock and mineral particles usually cause the jet black color most closely associated with obsidian.
Looking at the obsidian’s visual effects of small gas bubbles. It can cause the obsidian to have a gold or silver shine if the bubbles were spread almost flat.
What does Obsidian feel like?
Obsidian has a strong conchoidal fracture and luster. It means that the top of the fracture is curving smoothly (like a seashell). Obsidian appears to be black. Minute inclusions and tiny crystals in the glass create it hue.
What are the characteristics of obsidian?
Obsidian breaks with a typical “conchoidal” fracture, like all glass and some other forms of natural rocks. Due to the near absence of mineral crystals in the glass, this smooth, curved form of fracture surface occurs. Conchoidal fracture surface intersections may be sharper than a knife.
What is the texture of obsidian?
Obsidian, igneous rock that occurs as a natural glass produced by the rapid refreshment of viscous volcanic lava. Obsidian is extremely silica-rich (around 65 to 80 percent), low in water, and has a rhyolite-like chemical composition. Obsidian has a luster of glass and is somewhat stronger than window glass.
Caves come in all sizes, shapes, and colors. Easy caves are typically defined by high ceilings and smooth floors. Credit: Jesse Barden
Lava Beds National Monument in Siskiyou and Modoc County is located in north east California. This monument is located at the northeast edge of Medicine Lake Volcano and is the largest volcano in the Cascade region.
The region in and around Lava Beds National Monument lies at the junction of the Sierra-Klamath, Cascade, and the Great Basin physiographic provinces. The monument was established as a national monument on November 21, 1925, and includes more than 46,000 acres (190 km2).
Lava Beds National Monument contains numerous lava tubes, 25 of which have marked entrances and established public access and exploration trails. The monument also provides paths through the xeric desert landscape of the high Great Basin and through the volcanic zone. The Modoc War was waged in 1872 and 1873, with a band commanded by Captain Jack (Kintpuash). The area in his memory was called Captain Jack’s Stronghold.
Lava Beds National Monument is geologically significant because of its wide variety of volcanic formations, including lava tubes, fumaroles, cinder cones, spatter cones, pit craters, hornitos, maars, lava flows, and volcanic fields.
Volcanic eruptions on the Medicine Lake shield volcano have created an incredibly rugged landscape punctuated by these many landforms of volcanism.
2. The Ice Age Flood Trail, Washington, Oregon and Idaho
The National Geologic Trail or Ice Age Floods Trail is known as the United States ‘ first National Geologic Trail. It will consist of a network of linking routes that will provide explanation of the geological effects of the last glacial period’s Glacial Lake Missoula floods that started around 110,000 years ago.
The National Park Service (NPS) commissioned an Environmental Assessment that found that Option 3 — setting up a “National Geological Trail — designating National Park Service Floods Pathways, with an Interagency Technical Committee including federal, tribal and state agencies and a Trail Advisory Committee to assist trail managers and staff” was the preferred optium. As a result, the Ice Age Floods Trail was created by the 2009 Omnibus Public Land Management Act, which allowed Congress to create the Ice Age Floods National Geologic Trail in parts of the states of Montana, Idaho, Washington, and Oregon, and formed the Trail’s NPS administration.
3. Mammoth Cave National Park, Kentucky
Mammoth Cave National Park, Kentucky
Mammoth Cave National Park is an American national park located in central Kentucky that includes parts of Mammoth Cave, the world’s longest known cave system. The system’s official name has been the Mammoth–Flint Ridge Cave System since the 1972 merger of Mammoth Cave with the even-longer system under Flint Ridge to the north. The park was established on 1 July 1941 as a national park, on 27 October 1981 as a World Heritage Site, and on 26 September 1990 as an international biosphere reserve.
The 52,830-acre park (21,380 ha) is mainly located in Edmonson County, with small areas spreading eastward to the counties of Hart and Barren. The Green River runs through the park, flowing into the Green just inside the park by a tributary named the Nolin River. Mammoth Cave is the longest known cave system in the world with more than 400 miles (640 km) of surveyed caves, which is almost twice as long as Mexico’s second-longest cave system, the Sac Actun underwater cave.
4. San Andreas Fault at the Carrizo Plain, California
Aerial photo of the San Andreas Fault in the Carrizo Plain, northwest of Los Angeles. Credit: Wikipedia.
In the southeast of San Luis Obispo County, California, about 100 miles (160 km) northwest of Los Angeles, the Carrizo Plain is a large enclosed grassland plain, about 50 miles (80 km) wide and up to 15 miles (24 km) across. It includes the Carrizo Plain National Monument of 246,812 acres (99,881 ha) and is California’s largest single native grassland. It includes Painted Rock in the Carrizo Plain Rock Art Discontiguous District, which is listed on the National Register of Historic Places. In 2012 it was further designated a National Historic Landmark due to its archeological value. The San Andreas Fault cuts across the plain.
The Carrizo Plain extends northwest from the town of Maricopa, following the San Andreas Fault. Bordering the plain to the northeast is the Temblor Range, on the other side of which is California’s Central Valley. Bordering the plain to the southwest is the Caliente Range. The community of California Valley is in the northern part of the plain. The average elevation of the plain is about 2,200 feet (670.6 m). Soda Lake, a 3,000-acre (12 km2) alkaline lake, is in the center of the plain with the popular Painted Rock containing Chumash and Yokut rock art nearby. As the central depression in an enclosed basin, Soda Lake receives all of the runoff from both sides of the plain. At 5,106 feet (1,556 m), Caliente Mountain, southwest of the plain, stands as the highest point in San Luis Obispo County. The climate type of the Carrizo Plain is semi-arid grassland. No trees grow there and the annual rainfall is around 9 inches (230 mm) per year.
5. La Brea Tar Pits, California
The pit of oozing oil in downtown Los Angeles has been trapping animals and preserving their skeletons for at least 40,000 years. The museum at the tar pits displays the skeletons. Credit: (Catherine Karnow / Corbis)
La Brea Tar Pits are a group of tar pits around which Hancock Park was built in Los Angeles urban area. Natural asphalt (also called asphalt, bitumen, pitch, or tar-brea in Spanish) has for tens of thousands of years sprung up from the ground in this area. Often the tar is coated with dirt, leaves, or water. The tar has preserved the bones of trapped animals for many years. The George C. Page Museum is devoted to exploring the tar pits and exhibiting the animals that died there. La Brea Tar Pits is a National Natural Landmark listed.
Tar pits are composed of heavy oil fractions called gilsonite, which seeped from the Earth as oil. In Hancock Park, crude oil seeps up along the 6th Street Fault from the Salt Lake Oil Field, which underlies much of the Fairfax District north of the park.[2] The oil reaches the surface and forms pools at several locations in the park, becoming asphalt as the lighter fractions of the petroleum biodegrade or evaporate.
The tar pits visible today are actually from a human excavation. The lake pit was originally an asphalt mine. The other pits visible today were produced between 1913 and 1915 when over 100 pits were excavated in search of large mammal bones. Various combinations of asphaltum, dust, leaves, and water have since filled in these holes. Normally, the asphalt appears in vents, hardening as it oozes out, to form stubby mounds. These can be seen in several areas of the park.
For hundreds of thousands of years, this seepage has been occurring. For time to time, asphalt formed a crust that was dense enough to trap wildlife, and layers of mud, dust, or leaves would cover the surface. Animals are going to walk in, get stuck and eventually die. Predators would enter and caught to eat the trapped animals. The asphalt soaks inside as the dead animals ‘ bones sink, turning them into a dark-brown or black hue. Lighter fractions of petroleum evaporate from the asphalt, leaving a more solid substance, which encases the bones. Dramatic fossils of large mammals have been extricated from the tar, but the asphalt also preserves microfossils: wood and plant remnants, rodent bones, insects, mollusks, dust, seeds, leaves, and even pollen grains. Examples of some of these are on display in the George C. Page Museum. Radiometric dating of preserved wood and bones has given an age of 38,000 years for the oldest known material from the La Brea seeps. The pits still ensnare organisms today, so most of the pits are fenced to protect humans and animals.
6. Mount St. Helens National Volcanic Monument, Washington
The visitor center near the top of Mount St. Helens is named for David Johnston, the geologist who predicted that the volcano would explode not upward but sideways. Credit: (Steve Terrill / Corbis)
The National Volcanic Monument of Mount St. Helens is a U.S. National Monument, which covers the landscape surrounding Washington’s Mount St. Helens. It was created by the U.S. on August 27, 1982. After the eruption of 1980, President Ronald Reagan. The National Volcanic Monument of 110,000 acres (445 km2) has been set aside for science, tourism and education. The ecosystem within the Monument is left to respond to the disturbance naturally.
Mount St. Helens National Volcanic Monument was the first such monument operated by the United States of America. Service to the wood. Max Peterson, head of the USFS, said at dedication ceremonies on May 18, 1983, “we can be proud to have preserved the special episode of natural history for future generations.” Since then, several trails, viewpoints, information stations, campgrounds and picnic areas have been set up to accommodate the increasing number of visitors every year.
Beginning in 1983, visitors have been able to drive to Windy Ridge, only 4 miles (6.4 km) northeast of the crater.
Mountain climbing to the summit of the volcano has been allowed since 1986.
7. Meteor Crater, Arizona
Meteor Crater in Arizona is 4,000 feet wide and almost 600 feet deep. Credit: (iStockphoto)
The crater was created about 50,000 years ago during the Pleistocene epoch, when the local climate on the Colorado Plateau was much cooler and damper. The area was an open grassland dotted with woodlands inhabited by mammoths and giant ground sloths.
Meteor Crater is about 37 miles (60 km) east of Flagstaff and 18 miles (29 km) west of Winslow in the United States ‘ northern Arizona desert. Since the U.S. Geographic Names Board generally honors names of natural features originating from the nearest post office, the feature obtained the name “Meteor Crater” from the local post office called Meteor. Formerly known as the Canyon Diablo Crater, the site is officially called the Canyon Diablo Meteorite, and parts of the meteorite.
The crater is referred to by scientists as Barringer Crater in honor of Daniel Barringer, who first claimed that it was created by meteorite impact. The crater is owned by the Barringer family privately through its Barringer Crater Company, which claims to be the “best preserved meteorite crater on Earth.” The crater is not protected as a national monument, given its significance as a geological site, a designation that would entail federal ownership. In November 1967, it was designated as a National Natural Landmark.
Meteor Crater is located at an elevation above sea level of 5,640 ft (1,719 m). It is approximately 3,900 ft (1,200 m) in diameter, approximately 560 ft (170 m) deep, and is surrounded by a 148 ft (45 m) rim above the surrounding plains. The crater center is filled with rubble lying above crater bedrock with 690–790 ft (210–240 m). One of the crater’s interesting features is its squared-off outline, which is thought to be caused by existing regional joints (cracks) at the impact site in the strata.
8. Niagara Falls, New York
Niagara Falls, New York
Niagara Falls is a town in the county of Niagara, New York, USA. The city had a total population of 50,193 as of the 2010 census, down from the 55,593 reported in the census of 2000. It is adjacent to the Niagara River, across the Niagara Falls city, Ontario, and named after the famous Niagara Falls that they share. The city is located within the Metropolitan Statistical Area of Buffalo–Niagara Falls and the West New York region.
While the city was formerly occupied by Native Americans, in the mid-17th century, Europeans who migrated to the Niagara Falls began to open businesses and develop infrastructure. Scientists and entrepreneurs later started to harness the power of the Niagara River for electricity in the 18th and 19th centuries, and the city began to attract factories and other companies drawn by the prospect of inexpensive hydroelectric power. Nevertheless, after an attempt at urban renewal under then-Mayor Lackey, the city and region experienced an economic decline after the 1960s. When manufacturing left the city, old line affluent families moved to nearby suburbs and out of town, in line with the rest of the Rust Belt.
Despite the decline in heavy industry, Niagara Falls State Park and the downtown area closest to the falls continue to thrive as a result of tourism. The population, however, has continued to decline from a peak of 102,394 in the 1960s due to the loss of manufacturing jobs in the area.
9. Yellowstone National Park, Idaho, Montana and Wyoming
Yellowstone National Park is an American national park located in Wyoming, Montana, and Idaho.
Yellowstone National Park is an American national park with small sections in Montana and Idaho, mainly located in Wyoming. It was set up by the U.S. Congress and President Ulysses S. Grant signed it into law on March 1, 1872. Yellowstone was the first national park in the U.S. and the first national park in the world is also widely held. The park is known for its wildlife and various geothermal features, including Old Faithful Geyser, one of its most popular features. It has many habitat types, but the most common is the subalpine forest. It is part of the South Central Rockies forests ecoregion.
Native Americans have existed for at least 11,000 years in the Yellowstone area. During the early-to-mid-19th century, apart from visits by mountain men, organized exploration did not begin until the late 1860s. Initially, the management and regulation of the park was under the authority of the Interior Secretary, the first being Columbus Delano. But the U.S. Subsequently, the Army was commissioned to oversee Yellowstone management for a period of 30 years from 1886 to 1916. In 1917, the park administration was moved to the National Park Service established the year before. Hundreds of structures have been built and are protected for their architectural and historical significance, and researchers have examined more than a thousand archaeological sites.
Yellowstone National Park covers an area of 8,983 km2 (3,468.4 square miles), and includes lakes, canyons, rivers and mountain ranges. Yellowstone Lake is one of North America’s largest high-altitude lakes, centered above the Yellowstone Caldera, the continent’s largest supervolcano. The caldera is a volcano that is dormant. Over the past two million years, it has exploded many times with tremendous force. Half of the geysers and hydrothermal properties of the planet are in Yellowstone, caused by this ongoing volcanism. Lava flows and volcanic eruptions rocks cover most of Yellowstone’s land area. The park is at the heart of the Greater Yellowstone Ecosystem, the largest remaining near-intact ecosystem in the northern temperate zone of the Earth. Yellowstone was declared a UNESCO World Heritage Site in 1978.
10. Grand Canyon, Arizona
Grand Canyon, Arizona
The Grand Canyon is a steep-sided canyon carved by the Colorado River in Arizona, United States. The Grand Canyon is 277 miles (446 km) long, up to 18 miles (29 km) wide and attains a depth of over a mile (6,093 feet or 1,857 meters).
Grand Canyon National Park, Kaibab National Forest, Grand Canyon-Parashant National Monument, Hualapai Indian Reservation, Havasupai Indian Reservation, and Navajo Nation contain the canyon and surrounding rim. President Theodore Roosevelt was a major supporter of protecting the Grand Canyon region, visiting it many times to hunt and enjoy the scenery.
Nearly two billion years of the geological history of Earth became uncovered as the Colorado River and its tributaries carved their channels through layer after layer of rock while the Colorado Plateau was elevated. While geologists are discussing some aspects of the canyon’s incision history, several recent studies support the hypothesis that the Colorado River set its course through the area about 5 to 6 million years ago. The Colorado River has since driven down the tributaries and the cliffs ‘ withdrawal, gradually deepening and widening the canyon.
The area has been inhabited continuously by Native Americans for thousands of years, who established villages within the canyon and its numerous caves. The inhabitants of the Pueblo saw the Grand Canyon as a sacred place and made pilgrimages to it. García López de Cárdenas, who arrived in 1540, was the first European known to have seen the Grand Canyon.