Home Blog Page 55

Top Ten Spectacular Geological Sites in the USA

1. Lava Beds National Monument, California

Caves come in all sizes, shapes, and colors. Easy caves are typically defined by high ceilings and smooth floors. Credit: Jesse Barden

Lava Beds National Monument in Siskiyou and Modoc County is located in north east California. This monument is located at the northeast edge of Medicine Lake Volcano and is the largest volcano in the Cascade region.

The region in and around Lava Beds National Monument lies at the junction of the Sierra-Klamath, Cascade, and the Great Basin physiographic provinces. The monument was established as a national monument on November 21, 1925, and includes more than 46,000 acres (190 km2).

Lava Beds National Monument contains numerous lava tubes, 25 of which have marked entrances and established public access and exploration trails. The monument also provides paths through the xeric desert landscape of the high Great Basin and through the volcanic zone. The Modoc War was waged in 1872 and 1873, with a band commanded by Captain Jack (Kintpuash). The area in his memory was called Captain Jack’s Stronghold.

Lava Beds National Monument is geologically significant because of its wide variety of volcanic formations, including lava tubes, fumaroles, cinder cones, spatter cones, pit craters, hornitos, maars, lava flows, and volcanic fields.

Volcanic eruptions on the Medicine Lake shield volcano have created an incredibly rugged landscape punctuated by these many landforms of volcanism.

2. The Ice Age Flood Trail, Washington, Oregon and Idaho

The National Geologic Trail or Ice Age Floods Trail is known as the United States ‘ first National Geologic Trail. It will consist of a network of linking routes that will provide explanation of the geological effects of the last glacial period’s Glacial Lake Missoula floods that started around 110,000 years ago.

The National Park Service (NPS) commissioned an Environmental Assessment that found that Option 3 — setting up a “National Geological Trail — designating National Park Service Floods Pathways, with an Interagency Technical Committee including federal, tribal and state agencies and a Trail Advisory Committee to assist trail managers and staff” was the preferred optium. As a result, the Ice Age Floods Trail was created by the 2009 Omnibus Public Land Management Act, which allowed Congress to create the Ice Age Floods National Geologic Trail in parts of the states of Montana, Idaho, Washington, and Oregon, and formed the Trail’s NPS administration.

3. Mammoth Cave National Park, Kentucky

Mammoth Cave National Park, Kentucky

Mammoth Cave National Park is an American national park located in central Kentucky that includes parts of Mammoth Cave, the world’s longest known cave system. The system’s official name has been the Mammoth–Flint Ridge Cave System since the 1972 merger of Mammoth Cave with the even-longer system under Flint Ridge to the north. The park was established on 1 July 1941 as a national park, on 27 October 1981 as a World Heritage Site, and on 26 September 1990 as an international biosphere reserve.

The 52,830-acre park (21,380 ha) is mainly located in Edmonson County, with small areas spreading eastward to the counties of Hart and Barren. The Green River runs through the park, flowing into the Green just inside the park by a tributary named the Nolin River. Mammoth Cave is the longest known cave system in the world with more than 400 miles (640 km) of surveyed caves, which is almost twice as long as Mexico’s second-longest cave system, the Sac Actun underwater cave.

4. San Andreas Fault at the Carrizo Plain, California

San Andreas Fault
Aerial photo of the San Andreas Fault in the Carrizo Plain, northwest of Los Angeles.
Credit: Wikipedia.

In the southeast of San Luis Obispo County, California, about 100 miles (160 km) northwest of Los Angeles, the Carrizo Plain is a large enclosed grassland plain, about 50 miles (80 km) wide and up to 15 miles (24 km) across. It includes the Carrizo Plain National Monument of 246,812 acres (99,881 ha) and is California’s largest single native grassland. It includes Painted Rock in the Carrizo Plain Rock Art Discontiguous District, which is listed on the National Register of Historic Places. In 2012 it was further designated a National Historic Landmark due to its archeological value. The San Andreas Fault cuts across the plain.

The Carrizo Plain extends northwest from the town of Maricopa, following the San Andreas Fault. Bordering the plain to the northeast is the Temblor Range, on the other side of which is California’s Central Valley. Bordering the plain to the southwest is the Caliente Range. The community of California Valley is in the northern part of the plain. The average elevation of the plain is about 2,200 feet (670.6 m). Soda Lake, a 3,000-acre (12 km2) alkaline lake, is in the center of the plain with the popular Painted Rock containing Chumash and Yokut rock art nearby. As the central depression in an enclosed basin, Soda Lake receives all of the runoff from both sides of the plain. At 5,106 feet (1,556 m), Caliente Mountain, southwest of the plain, stands as the highest point in San Luis Obispo County. The climate type of the Carrizo Plain is semi-arid grassland. No trees grow there and the annual rainfall is around 9 inches (230 mm) per year.

5. La Brea Tar Pits, California

The pit of oozing oil in downtown Los Angeles has been trapping animals and preserving their skeletons for at least 40,000 years. The museum at the tar pits displays the skeletons.
The pit of oozing oil in downtown Los Angeles has been trapping animals and preserving their skeletons for at least 40,000 years. The museum at the tar pits displays the skeletons. Credit: (Catherine Karnow / Corbis)

La Brea Tar Pits are a group of tar pits around which Hancock Park was built in Los Angeles urban area. Natural asphalt (also called asphalt, bitumen, pitch, or tar-brea in Spanish) has for tens of thousands of years sprung up from the ground in this area. Often the tar is coated with dirt, leaves, or water. The tar has preserved the bones of trapped animals for many years. The George C. Page Museum is devoted to exploring the tar pits and exhibiting the animals that died there. La Brea Tar Pits is a National Natural Landmark listed.

Tar pits are composed of heavy oil fractions called gilsonite, which seeped from the Earth as oil. In Hancock Park, crude oil seeps up along the 6th Street Fault from the Salt Lake Oil Field, which underlies much of the Fairfax District north of the park.[2] The oil reaches the surface and forms pools at several locations in the park, becoming asphalt as the lighter fractions of the petroleum biodegrade or evaporate.

The tar pits visible today are actually from a human excavation. The lake pit was originally an asphalt mine. The other pits visible today were produced between 1913 and 1915 when over 100 pits were excavated in search of large mammal bones. Various combinations of asphaltum, dust, leaves, and water have since filled in these holes. Normally, the asphalt appears in vents, hardening as it oozes out, to form stubby mounds. These can be seen in several areas of the park.

For hundreds of thousands of years, this seepage has been occurring. For time to time, asphalt formed a crust that was dense enough to trap wildlife, and layers of mud, dust, or leaves would cover the surface. Animals are going to walk in, get stuck and eventually die. Predators would enter and caught to eat the trapped animals. The asphalt soaks inside as the dead animals ‘ bones sink, turning them into a dark-brown or black hue. Lighter fractions of petroleum evaporate from the asphalt, leaving a more solid substance, which encases the bones. Dramatic fossils of large mammals have been extricated from the tar, but the asphalt also preserves microfossils: wood and plant remnants, rodent bones, insects, mollusks, dust, seeds, leaves, and even pollen grains. Examples of some of these are on display in the George C. Page Museum. Radiometric dating of preserved wood and bones has given an age of 38,000 years for the oldest known material from the La Brea seeps. The pits still ensnare organisms today, so most of the pits are fenced to protect humans and animals.

6. Mount St. Helens National Volcanic Monument, Washington

The visitor center near the top of Mount St. Helens is named for David Johnston, the geologist who predicted that the volcano would explode not upward but sideways.
The visitor center near the top of Mount St. Helens is named for David Johnston, the geologist who predicted that the volcano would explode not upward but sideways. Credit: (Steve Terrill / Corbis)

The National Volcanic Monument of Mount St. Helens is a U.S. National Monument, which covers the landscape surrounding Washington’s Mount St. Helens. It was created by the U.S. on August 27, 1982. After the eruption of 1980, President Ronald Reagan. The National Volcanic Monument of 110,000 acres (445 km2) has been set aside for science, tourism and education. The ecosystem within the Monument is left to respond to the disturbance naturally.

Mount St. Helens National Volcanic Monument was the first such monument operated by the United States of America. Service to the wood. Max Peterson, head of the USFS, said at dedication ceremonies on May 18, 1983, “we can be proud to have preserved the special episode of natural history for future generations.” Since then, several trails, viewpoints, information stations, campgrounds and picnic areas have been set up to accommodate the increasing number of visitors every year.

Beginning in 1983, visitors have been able to drive to Windy Ridge, only 4 miles (6.4 km) northeast of the crater.

Mountain climbing to the summit of the volcano has been allowed since 1986.

7. Meteor Crater, Arizona

Meteor Crater in Arizona is 4,000 feet wide and almost 600 feet deep. Credit: (iStockphoto)

The crater was created about 50,000 years ago during the Pleistocene epoch, when the local climate on the Colorado Plateau was much cooler and damper. The area was an open grassland dotted with woodlands inhabited by mammoths and giant ground sloths.

Meteor Crater is about 37 miles (60 km) east of Flagstaff and 18 miles (29 km) west of Winslow in the United States ‘ northern Arizona desert. Since the U.S. Geographic Names Board generally honors names of natural features originating from the nearest post office, the feature obtained the name “Meteor Crater” from the local post office called Meteor. Formerly known as the Canyon Diablo Crater, the site is officially called the Canyon Diablo Meteorite, and parts of the meteorite.

The crater is referred to by scientists as Barringer Crater in honor of Daniel Barringer, who first claimed that it was created by meteorite impact. The crater is owned by the Barringer family privately through its Barringer Crater Company, which claims to be the “best preserved meteorite crater on Earth.” The crater is not protected as a national monument, given its significance as a geological site, a designation that would entail federal ownership. In November 1967, it was designated as a National Natural Landmark.

Meteor Crater is located at an elevation above sea level of 5,640 ft (1,719 m). It is approximately 3,900 ft (1,200 m) in diameter, approximately 560 ft (170 m) deep, and is surrounded by a 148 ft (45 m) rim above the surrounding plains. The crater center is filled with rubble lying above crater bedrock with 690–790 ft (210–240 m). One of the crater’s interesting features is its squared-off outline, which is thought to be caused by existing regional joints (cracks) at the impact site in the strata.

8. Niagara Falls, New York

Niagara Falls, New York

Niagara Falls is a town in the county of Niagara, New York, USA. The city had a total population of 50,193 as of the 2010 census, down from the 55,593 reported in the census of 2000. It is adjacent to the Niagara River, across the Niagara Falls city, Ontario, and named after the famous Niagara Falls that they share. The city is located within the Metropolitan Statistical Area of Buffalo–Niagara Falls and the West New York region.

While the city was formerly occupied by Native Americans, in the mid-17th century, Europeans who migrated to the Niagara Falls began to open businesses and develop infrastructure. Scientists and entrepreneurs later started to harness the power of the Niagara River for electricity in the 18th and 19th centuries, and the city began to attract factories and other companies drawn by the prospect of inexpensive hydroelectric power. Nevertheless, after an attempt at urban renewal under then-Mayor Lackey, the city and region experienced an economic decline after the 1960s. When manufacturing left the city, old line affluent families moved to nearby suburbs and out of town, in line with the rest of the Rust Belt.

Despite the decline in heavy industry, Niagara Falls State Park and the downtown area closest to the falls continue to thrive as a result of tourism. The population, however, has continued to decline from a peak of 102,394 in the 1960s due to the loss of manufacturing jobs in the area.

9. Yellowstone National Park, Idaho, Montana and Wyoming

Yellowstone National Park is an American national park located in Wyoming, Montana, and Idaho.

Yellowstone National Park is an American national park with small sections in Montana and Idaho, mainly located in Wyoming. It was set up by the U.S. Congress and President Ulysses S. Grant signed it into law on March 1, 1872. Yellowstone was the first national park in the U.S. and the first national park in the world is also widely held. The park is known for its wildlife and various geothermal features, including Old Faithful Geyser, one of its most popular features. It has many habitat types, but the most common is the subalpine forest. It is part of the South Central Rockies forests ecoregion.

Native Americans have existed for at least 11,000 years in the Yellowstone area. During the early-to-mid-19th century, apart from visits by mountain men, organized exploration did not begin until the late 1860s. Initially, the management and regulation of the park was under the authority of the Interior Secretary, the first being Columbus Delano. But the U.S. Subsequently, the Army was commissioned to oversee Yellowstone management for a period of 30 years from 1886 to 1916. In 1917, the park administration was moved to the National Park Service established the year before. Hundreds of structures have been built and are protected for their architectural and historical significance, and researchers have examined more than a thousand archaeological sites.

Yellowstone National Park covers an area of 8,983 km2 (3,468.4 square miles), and includes lakes, canyons, rivers and mountain ranges. Yellowstone Lake is one of North America’s largest high-altitude lakes, centered above the Yellowstone Caldera, the continent’s largest supervolcano. The caldera is a volcano that is dormant. Over the past two million years, it has exploded many times with tremendous force. Half of the geysers and hydrothermal properties of the planet are in Yellowstone, caused by this ongoing volcanism. Lava flows and volcanic eruptions rocks cover most of Yellowstone’s land area. The park is at the heart of the Greater Yellowstone Ecosystem, the largest remaining near-intact ecosystem in the northern temperate zone of the Earth. Yellowstone was declared a UNESCO World Heritage Site in 1978.

10. Grand Canyon, Arizona

Grand Canyon, Arizona

The Grand Canyon is a steep-sided canyon carved by the Colorado River in Arizona, United States. The Grand Canyon is 277 miles (446 km) long, up to 18 miles (29 km) wide and attains a depth of over a mile (6,093 feet or 1,857 meters).

Grand Canyon National Park, Kaibab National Forest, Grand Canyon-Parashant National Monument, Hualapai Indian Reservation, Havasupai Indian Reservation, and Navajo Nation contain the canyon and surrounding rim. President Theodore Roosevelt was a major supporter of protecting the Grand Canyon region, visiting it many times to hunt and enjoy the scenery.

Nearly two billion years of the geological history of Earth became uncovered as the Colorado River and its tributaries carved their channels through layer after layer of rock while the Colorado Plateau was elevated. While geologists are discussing some aspects of the canyon’s incision history, several recent studies support the hypothesis that the Colorado River set its course through the area about 5 to 6 million years ago. The Colorado River has since driven down the tributaries and the cliffs ‘ withdrawal, gradually deepening and widening the canyon.

The area has been inhabited continuously by Native Americans for thousands of years, who established villages within the canyon and its numerous caves. The inhabitants of the Pueblo saw the Grand Canyon as a sacred place and made pilgrimages to it. García López de Cárdenas, who arrived in 1540, was the first European known to have seen the Grand Canyon.


Scientists Find Iron ‘Snow’ in Earth’s Core

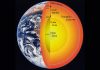
Structure layers of the earth.

The Earth’s inner core is hot, under immense pressure and snow-capped, according to new research that could help scientists better understand forces that affect the entire planet.

The snow is made of tiny particles of iron—much heavier than any snowflake on Earth’s surface—that fall from the molten outer core and pile on top of the inner core, creating piles up to 200 miles thick that cover the inner core.

The image may sound like an alien winter wonderland. But the scientists who led the research said it is akin to how rocks form inside volcanoes.

“The Earth’s metallic core works like a magma chamber that we know better of in the crust,” said Jung-Fu Lin, a professor in the Jackson School of Geosciences at The University of Texas at Austin and a co-author of the study.

The study is available online and will be published in the print edition of the journal JGR Solid Earth on December 23.

Youjun Zhang, an associate professor at Sichuan University in China, led the study. The other co-authors include Jackson School graduate student Peter Nelson; and Nick Dygert, an assistant professor at the University of Tennessee who conducted the research during a postdoctoral fellowship at the Jackson School.

The Earth’s core can’t be sampled, so scientists study it by recording and analyzing signals from seismic waves (a type of energy wave) as they pass through the Earth.

However, aberrations between recent seismic wave data and the values that would be expected based on the current model of the Earth’s core have raised questions. The waves move more slowly than expected as they passed through the base of the outer core, and they move faster than expected when moving through the eastern hemisphere of the top inner core.

The study proposes the iron snow-capped core as an explanation for these aberrations. The scientist S.I. Braginkskii proposed in the early 1960s that a slurry layer exists between the inner and outer core, but prevailing knowledge about heat and pressure conditions in the core environment quashed that theory. However, new data from experiments on core-like materials conducted by Zhang and pulled from more recent scientific literature found that crystallization was possible and that about 15% of the lowermost outer core could be made of iron-based crystals that eventually fall down the liquid outer core and settle on top of the solid inner core.

“It’s sort of a bizarre thing to think about,” Dygert said. “You have crystals within the outer core snowing down onto the inner core over a distance of several hundred kilometers.”

The researchers point to the accumulated snow pack as the cause of the seismic aberrations. The slurry-like composition slows the seismic waves. The variation in snow pile size—thinner in the eastern hemisphere and thicker in the western—explains the change in speed.

“The inner-core boundary is not a simple and smooth surface, which may affect the thermal conduction and the convections of the core,” Zhang said.

The paper compares the snowing of iron particles with a process that happens inside magma chambers closer to the Earth’s surface, which involves minerals crystalizing out of the melt and glomming together. In magma chambers, the compaction of the minerals creates what’s known as “cumulate rock.” In the Earth’s core, the compaction of the iron contributes to the growth of the inner core and shrinking of the outer core.

And given the core’s influence over phenomena that affects the entire planet, from generating its magnetic field to radiating the heat that drives the movement of tectonic plates, understanding more about its composition and behavior could help in understanding how these larger processes work.

Bruce Buffet, a geosciences professor at the University of California, Berkley who studies planet interiors and who was not involved in the study, said that the research confronts longstanding questions about the Earth’s interior and could even help reveal more about how the Earth’s core came to be.

“Relating the model predictions to the anomalous observations allows us to draw inferences about the possible compositions of the liquid core and maybe connect this information to the conditions that prevailed at the time the planet was formed,” he said. “The starting condition is an important factor in Earth becoming the planet we know.”

Reference:
Youjun Zhang et al, Fe Alloy Slurry and a Compacting Cumulate Pile Across Earth’s Inner‐Core Boundary, Journal of Geophysical Research: Solid Earth (2019). DOI: 10.1029/2019JB017792

Note: The above post is reprinted from materials provided by University of Texas at Austin.

Survey reveals low awareness of volcanic hazards in Australia

Whakaari/White Island, New Zealand. On December 9, 2019, several Australians were among the dozens of tourists who were killed, injured, or went missing when the volcano erupted. Credit: Rfleming/public domain.

Heather Handley pointed out two large photos on her poster at AGU Fall Meeting last week: a bouncing kangaroo and a dreamy beach scene, two things commonly associated with Australia, where Handley is an associate professor in volcanology at Macquarie University. But Handley wasn’t advertising Australia’s most loved assets. The photos were a lead up to an introduction of one of her country’s lesser known features: volcanoes.

On December 9, several Australians were among the dozens of tourists who were killed, injured, or went missing after a deadly eruption on Whakaari/White Island in New Zealand. Whakaari/White Island has seen more volcanic activity in the past 10 years than neighboring Australia has seen for 5,000, but according to volcanologists like Handley, the country is not free from the risks of a potential eruption. And according to a new survey conducted by Handley and her colleagues, Australian citizens are mostly unaware of their country’s potential volcanic hazards.

Handley and colleagues came up with a series of questions for a survey, sent out just last month through social media and flyers, to find out just how much Australians understand the volcanic hazards and risk in their homeland.

At Fall Meeting, Handley presented the preliminary results from survey responses of over 100 Australians. She found that over 90 percent of respondents are unaware of any preparedness, emergency management plans, or warning systems in Australia for volcanic hazards.

Over 25 percent of survey takers said they weren’t sure when the last volcanic eruption in mainland Australia occurred (Mt. Gambier, around 5,000 years ago). Additionally, for the statement “I am well aware of the procedures I need to follow in the event of an emergency related to a volcanic eruption,” over 70 percent disagreed, and 60 percent strongly disagreed.

The survey participants did, however, seem to know that Australia could be impacted by volcanic activity in other countries, with nearly 80 percent agreeing with the statement.

A 2011 eruption in Chile may be partially responsible for this awareness, Handley said. Volcanic ash produced by that eruption entered Australian airspace, grounding planes and affecting over 100,000 passengers. Australia is also surrounded by several volcanically active countries: New Zealand, Indonesia, Papua New Guinea, and Tonga.

A more surprising result for Handley came from the question regarding various levels of concern for natural hazards in their country. For volcanic hazards, about 65 percent of people answered “not at all concerned” and zero people responded “extremely concerned.”

In the same way the Chile eruption could have contributed to recent understanding of how volcanoes in other countries could impact Australia, Handley attributes the lack of concern for local volcanoes to timescales: the last eruption on the mainland occurred before Europeans colonized Australia.

But indigenous populations occupied Australia for around 65,000 years before European colonizers arrived, and they were aware of the volcanic hazards. “They did witness eruptions, and they did pass on that knowledge through oral traditions,” Handley said. She’s also looking at combining scientific data with indigenous knowledge to better improve scientists’ understanding of volcanic activity in Australia.

Handley is just at the start of her surveying and anticipates a shift in future survey responses after the recent eruption on Whakaari/White Island. “It’s probably triggering a few people to think about Australia—what is the risk to us from an eruption that might not be easy to predict,” she said.

Handley studies the Newer Volcanics Province, a 400-kilometer swath of land stretching from Melbourne to South Australia, home to more than 400 small, previously active volcanoes. Predicting another eruption across such a wide area is tricky, because an eruption could happen anywhere, she said. Handley suspects the Newer Volcanics Province could see another eruption, based on chemical and geophysical signals pointing to magma in Earth’s mantle beneath the Province.

Handley is also studying how quickly magma travels, which may help predict warning times if volcanic activity starts to increase. But prediction won’t matter much if the public isn’t aware of the risk, or if there is no plan in place in the case of an event in the Newer Volcanics Province, she said.

Handley hopes her research will help emergency management officials create tools and literature related to volcanic hazards preparedness.

Note: The above post is reprinted from materials provided by American Geophysical Union.

Baby dinosaurs found in Australia

Artist’s depiction of an ornithopod dinosaur tending its nest.
Artist’s depiction of an ornithopod dinosaur tending its nest. Credit: University of New England

Researchers have uncovered the first baby dinosaurs from Australia. The bones were discovered at several sites along the south coast of Victoria and near the outback town of Lightning Ridge in New South Wales. Some of the bones are so tiny, they likely come from animals that had died while they were still in their eggs. Slightly larger bones from Victoria come from animals that had recently hatched but were probably nest-bound.

The research was carried out by palaeontologists from the Palaeoscience Research Centre at the University of New England and the Australian Opal Centre in Lightning Ridge.

The bones come from small-bodied ornithopod dinosaurs—two legged herbivores that weighed roughly 20kg when full grown—similar to Weewarrasaurus, which was recently discovered by members of the same team at Lightning Ridge. By comparison, the baby dinosaurs were only about 200g when they died, less that the weight of a cup of water.

While the eggs themselves were not found, researchers used growth rings in the bones, similar to the rings in a tree trunk, to estimate the animal’s age. “Age is usually estimated by counting growth rings, but we couldn’t do this with our two smallest specimens, which had lost their internal detail,” says Justin Kitchener, a Ph.D. student at the University of New England, who also led the study. “To get around this, we compared the size of these bones with the size of growth rings from the Victorian dinosaurs. This comparison confidently places them at an early growth stage, probably prior to, or around the point of hatching.”

100 million years ago, when these animals were being born, Australia was much closer to the poles. Southeastern Australia would have been between 60°S and 70°S, equivalent to modern day Greenland. Although the climate at these latitudes was relatively warmer than they are today, like some Antarctic penguins, these dinosaurs would have endured long dark winters and possibly burrowed or hibernated to survive.

Because they are so delicate, egg shell and tiny bones rarely survive to become fossils. “We have examples of hatchling-sized dinosaurs from close to the North Pole, but this is the first time we’ve seen this kind of thing anywhere in the Southern Hemisphere,” says Dr. Phil Bell, a University of New England palaeontologist who recognised the significance of the tiny bones from Lightning Ridge. “It’s the first clue we’ve had about where these animals were breeding and raising their young.”

The study was published today in the journal Scientific Reports.

Note: The above post is reprinted from materials provided by University of New England.

New insights into the formation of Earth’s crust

Earth's layers
Representative Image : The Earth’s layers, showing the Inner and Outer Core, the Mantle, and Crust

New research from Mauricio Ibanez-Mejia, an assistant professor of Earth and environmental sciences at the University of Rochester, gives scientists better insight into the geological processes responsible for the formation of Earth’s crust.

In a paper published in the journal Science Advances, Ibanez-Mejia and his colleague Francois Tissot, an assistant professor of geochemistry at the California Institute of Technology, studied the isotopes of the element zirconium.

Most elements in the periodic table have multiple isotopes; that is, different atoms of the same element can have different masses due to the varying number of sub-atomic particles in their nuclei. Researchers have traditionally assumed that processes occurring within the solid Earth, particularly in high-temperature environments such as those found in volcanoes and magma chambers, do not have the ability to ‘fractionate’—distribute unevenly—isotopes of the heavy elements amongst solids and liquids because of the isotopes’ minute differences in mass.

In the study, the researchers showed that stable isotopes of the element zirconium, a heavy transition metal, can be fractionated by magnitudes much larger than those previously thought and predicted by theory.

“This changes our view of how this element behaves in the solid Earth,” Ibanez-Mejia says. “By recognizing this variability, we developed a tool that can help us gain further insights into the changing chemistry of magmas as they crystallize within Earth’s crust.”

Reference:
Mauricio Ibañez-Mejia et al, Extreme Zr stable isotope fractionation during magmatic fractional crystallization, Science Advances (2019). DOI: 10.1126/sciadv.aax8648

Note: The above post is reprinted from materials provided by University of Rochester.

Study explores the density of the tectonic plates and why they sink in the Earth’s mantle

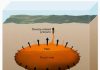
A schematic summary of the effect of the convergence rate. Upper image shows a slow convergence rate allows thermal difussion and a derived reduction of slab's density (positive buoyancy). Lower image shows how a faster convergence rate increases the slab's density promoting the negative buoyancy. Credit: Kittiphon Boonma, Scientific Reports
A schematic summary of the effect of the convergence rate. Upper image shows a slow convergence rate allows thermal difussion and a derived reduction of slab’s density (positive buoyancy). Lower image shows how a faster convergence rate increases the slab’s density promoting the negative buoyancy. Credit: Kittiphon Boonma, Scientific Reports

A fast collision rate between tectonic plates and a young age (millions of years) are two factors that favour the sinking of the lithosphere in the mantle, according to a new study made by researchers at the Institute of Earth Sciences Jaume Almera of the Spanish National Research Council (ICTJA-CSIC). The study has been published recently in Scientific Reports.

The authors of the study developed a new numerical model to study the effects of the convergence rate between tectonic plates and its composition on the lithospheric mantle density promoting or avoiding its sinking during subduction or delaminating processes.

“The model designed in this study provides a methodological framework for understanding the stability of the lithosphere during the convergence of the tectonic plates,” said Kittiphon Boonma, Ph.D. student of the SUBITOP project at ICTJA-CSIC and first author of the study.

The lithosphere is the Earth’s rigid outermost layer that comprises the crust and uppermost mantle, forming the tectonic plates. These plates float and move over the asthenosphere, a denser and more viscous layer of the sublithospheric mantle. In the areas where plates converge, one of the plates sinks below the other, thrusting into the sublithospheric mantle. This would be the typical case of the oceanic lithosphere subduction zones. Another possibility is that, in continental collision zones, the lithospheric mantle of one of the plates separates from (“peels off”) the crust and sinks into the asthenosphere in a process known as delamination. Both processes are sensitive to the lithospheric mantle density which, at the same time, depends on the pressure, temperature and chemical composition or, which is the same, of the convergence rate and the age of the lithosphere.

“Our simulations combine lithospheric composition for different plate ages with a wide spectrum of plate collision rates to understand what determines the positive or negative buoyancy of the lithosphere,” said Daniel García-Castellanos, researcher at ICTJA-CSIC and co-author of the study.

“The main advance of our work is the analysis of the dependence of lithospheric mantle buoyancy on density variations resulting from the advection-diffusion balance considering a wide range of tectonic convergence rates and different lithospheric mantle chemical compositions,” said Kittiphon Boonma.

Researchers performed several simulations with the new model considering three different types of continental lithosphere, with an age range between 2.5 Ga and 1 Ga year, and two oceanic lithospheres aged 120 and 30 milion year old. They considered six different convergence rates between 1 and 80 mm/year. Simulations were aimed to observe the effect of the different collision rates and compositions on the lithospheric mantle density.

“In subduction or continental collision processes, there are two opposite effects that affect the mantle density. Density increases due to pressure increases but, at the same time, it tends to decrease due to the temperature increase produced by the depth. The predominance of one of these two effects will depend on the convergence velocity. Moreover, the mantle density depends also on its own chemical composition and it has been observed that it decreases with the age,” explains Manel Fernández, co-author of the study.

The model outcomes showed that the oldest and thickest continental lithospheric mantle (Archon) was less dense than the asthenosphere and avoided the sinking. At low and moderate convergence rates, researchers found that the two other types of continental lithospheric mantle shifted from sinking to stay stables due to their thinner thicknesses and to the loss of density induced by the temperature increases due to the depth. Last, the two different types oceanic lithosphere always sank, whatever the applied convergence rate was, due to their bigger density derived from it composition.

“According to these results, the faster the convergence rate between two continents, the bigger the probability that one of them delaminates or sinks towards the mantle,” explains Daniel García-Castellanos.

“Results suggest an explanation on why the young plates often sinks easily into the mantle, being recycled in the mantle while cratons (oldest continental regions) seem to resist better the changes in tectonic forces during Earth’s evolution and they are less prone to subduct or delaminate,” said García-Castellanos.

Reference:
K. Boonma et al. Lithospheric mantle buoyancy: the role of tectonic convergence and mantle composition, Scientific Reports (2019). DOI: 10.1038/s41598-019-54374-w

Note: The above post is reprinted from materials provided by Institue of Earth Sciences Jaume Almera.

A ‘Jackalope’ of an ancient spider fossil deemed a hoax, unmasked as a crayfish

The specimen will be stripped of the scientific name Mongolarachne chaoyangensis and rechristened as a crayfish
The specimen will be stripped of the scientific name Mongolarachne chaoyangensis and rechristened as a crayfish. Credit: Selden et al.

Earlier this year, a remarkable new fossil specimen was unearthed in the Lower Cretaceous Yixian Formation of China by area fossil hunters — possibly a huge ancient spider species, as yet unknown to science.

The locals sold the fossil to scientists at the Dalian Natural History Museum in Liaoning, China, who published a description of the fossil species in Acta Geologica Sinica, the peer-reviewed journal of the Geological Society of China. The Chinese team gave the spider the scientific name Mongolarachne chaoyangensis.

But other scientists in Beijing, upon seeing the paper, had suspicions. The spider fossil was huge and strange looking. Concerned, they contacted a U.S. colleague who specializes in ancient spider fossils: Paul Selden, distinguished professor of invertebrate paleontology in the Department of Geology at the University of Kansas.

“I was obviously very skeptical,” Selden said. “The paper had very few details, so my colleagues in Beijing borrowed the specimen from the people in the Southern University, and I got to look at it. Immediately, I realized there was something wrong with it — it clearly wasn’t a spider. It was missing various parts, had too many segments in its six legs, and huge eyes. I puzzled and puzzled over it until my colleague in Beijing, Chungkun Shih, said, ‘Well, you know, there’s quite a lot of crayfish in this particular locality. Maybe it’s one of those.’ So, I realized what happened was I got a very badly preserved crayfish onto which someone had painted on some legs.”

Selden and his colleagues at KU and in China (including the lead author of the paper originally describing the fossil) recently published an account of their detective work in the peer-reviewed journal Palaeoentomology.

“These things are dug up by local farmers mostly, and they see what money they can get for them,” Selden said. “They obviously picked up this thing and thought, ‘Well, you know, it looks a bit like a spider.’ And so, they thought they’d paint on some legs — but it’s done rather skillfully. So, at first glance, or from a distance, it looks pretty good. It’s not till you get down to the microscope and look in detail that you realize they’re clearly things wrong with it. And, of course, the people who described it are perfectly good paleontologists — they’re just not experts on spiders. So, they were taken in.”

In possession of the original fossil specimen at KU, Selden teamed up with his graduate student Matt Downen and with Alison Olcott, associate professor of geology. The team used fluorescence microscopy to analyze the supposed spider and differentiate what parts of the specimen were fossilized organism, and which parts were potentially doctored.

“Fluorescence microscopy is a nice way of distinguishing what’s painted on from what’s real,” Selden said. “So, we put it under the fluorescence microscope and, of course, being a huge specimen it’s far too big for the microscope. We had to do it in bits. But we were able to show the bits that were painted and distinguish those from the rock and from the actual, real fossil.”

The team’s application of fluorescence microscopy on the fossil specimen showed four distinct responses: regions that appear bright white, bright blue, bright yellow, and ones that are dull red. According to the paper, the bright white areas are probably a mended crack. The bright blue is likely from mineral composition of the host rock. The yellow fluorescence could indicate an aliphatic carbon from oil-based paint used to alter the crayfish fossil. Finally, the red fluorescence probably indicates the remnants of the original crayfish exoskeleton.

“We produced this little paper showing how people could be very good at faking what was clearly a rather poor fossil — it wasn’t going to bring in a lot of money — and turning it into something which somebody bought for quite a lot of money, I imagine, but it clearly was a fake,” the KU researcher said.

Selden said in the world of fossils fakery is commonplace, as impoverished fossil hunters are apt to doctor fossils for monetary gain.

What’s less common, he said, was a fake fossil spider, or a forgery making its way into an academic journal. However, he acknowledged the difficulty of verifying a fossil and admitted he’d been fooled in the past.

“I mean, I’ve seen lots of forgeries, and in fact I’ve even been taken in by fossils in a very dark room in Brazil,” he said. “It looked interesting until you get to in the daylight the next day realize it’s been it’s been enhanced, let’s say, for sale. I have not seen it with Chinese invertebrates before. It’s very common with, you know, really expensive dinosaurs and that sort of stuff. Maybe they get two fossils and join them together, this kind of thing. Normally, there’s not enough to gain from that kind of trouble with an invertebrate.

“But somebody obviously thought it wasn’t such a big deal to stick a few legs onto this, because a giant spider looks very nice. I’m not sure the people who sell them necessarily think they’re trying to dupe scientists. You tend to come across these things framed — they look very pretty. They’re not necessarily going to be bought by scientists, but by tourists.”

Selden’s coauthors on the paper were Olcott and Downen of KU, along with Shih of Capital Normal University in Beijing, and Dong Ren of Capital Normal University and the Smithsonian Institution, and Ciaodong Cheng of Dalian Natural History Museum.

Selden didn’t know the eventual fate of the enhanced spider fossil, which he likened to the famed “jackalope.”

He said he thought it would go back to China where it could be put on display as a cautionary tale. One thing is for certain: it will be stripped of the scientific name Mongolarachne chaoyangensis and rechristened as a crayfish. Because of the fossil’s alterations and state of preservation, Selden said it was hard to pin down its exact species. The team tentatively placed the fossil in Cricoidoscelosus aethus, “because this is marginally the commoner of the two crayfish recorded from the Yixian Formation.”

Note: The above post is reprinted from materials provided by University of Kansas.

Opalized “Petrified” Wood

 Rough Koroit opal " Opalized wood " from Victoria, Australia.
Rough Koroit opal ” Opalized wood ” from Victoria, Australia. Photo Credit: Gene McDevitt

What is Opalized Wood “Wood opal”?

Wood opal is a form of petrified wood which has developed an opalescent sheen or, more rarely, where the wood has been completely replaced by opal. Other names for this opalized sheen-like wood are opalized wood and opalized petrified wood. It is often used as a gemstone.

How Does Opalized Wood Form?

Due to a series of rhyolite volcanic flows, resulting in a large basin enclosed by low hills. This basin contained a succession of lakes and forests of spruce, hemlock, birch, chestnut and even sequoia which were periodically buried by volcanic ash hundreds of feet thick. A large lake formed within the basin which deposited large amounts of diatomite, a biogenic form of silica. Seepage of super-heated water percolated through the ash layers, carrying silica to the long-buried trees.

Replacement of carbon in the wood by hydrated silica resulted in perfect opalized replicas of the original wood structure. It is the alignment of the hydrated silica spheres which ultimately results in the rainbow effect of precious opal, the result of deflection and diffraction of light as it passes through the planes of hydrated silica molecules. The size of the spheres impacts the colors seen, with smaller spheres resulting in blues and larger spheres in reds. While common opal is abundant in the region, the conditions required for formation of precious opal as seen here was far more rare, a combination of a stable and undisturbed environment. While much of the world precious opal is found in Austarlia, deposits such as those in the Virgin Valley are also mined for these treasures of a bygone world.

How Does Petrified Wood Form?

As the internal structure of our plant gradually breaks down, it replaces its organic material (wood fibers) with silica and other minerals. Those minerals will crystallize over a period of a few million years. The end result is a rock that takes over our original tree’s shape and structure.

The petrifaction process occurs underground, when wood becomes buried in water saturated sediment or volcanic ash. The presence of water reduces the availability of oxygen which inhibits aerobic decomposition by bacteria and fungi. Mineral-laden water flowing through the sediments may lead to permineralization, which occurs when minerals precipitate out of solution filling the interiors of cells and other empty spaces. During replacement, the plant’s cell walls act as a template for mineralization.

There needs to be a balance between the decay of cellulose and lignin and mineral templating for cellular detail to be preserved with fidelity. Most of the organic matter often decomposes, however some of the lignin may remain. Silica in the form of Opal-A, can encrust and permeate wood relatively quickly in hot spring environments. However, petrified wood is most commonly associated with trees that were buried in fine grained sediments of deltas and floodplains or volcanic lahars and ash beds. A forest where such material has petrified becomes known as a petrified forest.

Is petrified wood valuable?

“Small pieces of petrified wood are quite common and not worth very much.

Earth was stressed before dinosaur extinction

A fossilized snail shell, ready to be analyzed in the laboratory
A fossilized snail shell, ready to be analyzed in the laboratory. Credit: Northwestern University

New evidence gleaned from Antarctic seashells confirms that Earth was already unstable before the asteroid impact that wiped out the dinosaurs.

The study, led by researchers at Northwestern University, is the first to measure the calcium isotope composition of fossilized clam and snail shells, which date back to the Cretaceous-Paleogene mass extinction event. The researchers found that — in the run-up to the extinction event — the shells’ chemistry shifted in response to a surge of carbon in the oceans.

This carbon influx was likely due to long-term eruptions from the Deccan Traps, a 200,000-square-mile volcanic province located in modern India. During the years leading up to the asteroid impact, the Deccan Traps spewed massive amounts of carbon dioxide (CO2) into the atmosphere. The concentration of CO2 acidified the oceans, directly affecting the organisms living there.

“Our data suggest that the environment was changing before the asteroid impact,” said Benjamin Linzmeier, the study’s first author. “Those changes appear to correlate with the eruption of the Deccan Traps.”

“The Earth was clearly under stress before the major mass extinction event,” said Andrew D. Jacobson, a senior author of the paper. “The asteroid impact coincides with pre-existing carbon cycle instability. But that doesn’t mean we have answers to what actually caused the extinction.”

The study will be published in the January 2020 issue of the journal Geology, which comes out later this month.

Jacobson is a professor of Earth and planetary sciences in Northwestern’s Weinberg College of Arts and Sciences. Linzmeier was a postdoctoral researcher with the Ubben Program for Climate and Carbon Science at the Institute for Sustainability and Energy at Northwestern when the research was conducted. He is now a postdoctoral fellow at the University of Wisconsin-Madison in the Department of Geoscience.

‘Each shell is a snapshot’

Previous studies have explored the potential effects of the Deccan Traps eruptions on the mass extinction event, but many have examined bulk sediments and used different chemical tracers. By focusing on a specific organism, the researchers gained a more precise, higher-resolution record of the ocean’s chemistry.

“Shells grow quickly and change with water chemistry,” Linzmeier said. “Because they live for such a short period of time, each shell is a short, preserved snapshot of the ocean’s chemistry.”

Seashells mostly are composed of calcium carbonate, the same mineral found in chalk, limestone and some antacid tablets. Carbon dioxide in water dissolves calcium carbonate. During the formation of the shells, CO2 likely affects shell composition even without dissolving them.

For this study, the researchers examined shells collected from the Lopez de Bertodano Formation, a well-preserved, fossil-rich area on the west side of Seymour Island in Antarctica. They analyzed the shells’ calcium isotope compositions using a state-of-the-art technique developed in Jacobson’s laboratory at Northwestern. The method involves dissolving shell samples to separate calcium from various other elements, followed by analysis with a mass spectrometer.

“We can measure calcium isotope variations with high precision,” Jacobson said. “And those isotope variations are like fingerprints to help us understand what happened.”

Using this method, the team found surprising information.

“We expected to see some changes in the shells’ composition, but we were surprised by how quickly the changes occurred,” Linzmeier said. “We also were surprised that we didn’t see more change associated with the extinction horizon itself.”

A future warning

The researchers said that understanding how the Earth responded to past extreme warming and CO2 input can help us prepare for how the planet will respond to current, human-caused climate change.

“To some degree, we think that ancient ocean acidification events are good analogs for what’s happening now with anthropogenic CO2 emissions,” Jacobson said. “Perhaps we can use this work as a tool to better predict what might happen in the future. We can’t ignore the rock record. The Earth system is sensitive to large and rapid additions of CO2. Current emissions will have environmental consequences.”

Brad Sageman and Matthew Hurtgen, both professors of Earth and planetary sciences at Northwestern, are co-senior authors of the paper.

The study, “Calcium isotope evidence for environmental variability before and across the Cretaceous-Paleogene mass extinction,” was supported by the Ubben Program for Climate and Carbon Science at Northwestern University, the David and Lucile Packard Foundation (award number 2007-31757) and the National Science Foundation (award numbers EAR-0723151, ANT-1341729, ANT-0739541 and ANT-0739432.

Reference:
Benjamin J. Linzmeier, Andrew D. Jacobson, Bradley B. Sageman, Matthew T. Hurtgen, Meagan E. Ankney, Sierra V. Petersen, Thomas S. Tobin, Gabriella D. Kitch, Jiuyuan Wang. Calcium isotope evidence for environmental variability before and across the Cretaceous-Paleogene mass extinction. Geology, 2019; DOI: 10.1130/G46431.1

Note: The above post is reprinted from materials provided by Northwestern University. Original written by Amanda Morris.

When flowers reached Australia

Rocks containing microscopic fossil pollen were collected to determine the age of fossil leaves from Castle Cove, Otway Ranges, Victoria.
Rocks containing microscopic fossil pollen were collected to determine the age of fossil leaves from Castle Cove, Otway Ranges, Victoria. Credit: Vera Korasidis

New research has revealed that Australia’s oldest flowering plants are 126 million years old and may have resembled modern magnolias, buttercups and laurels.

Undertaken by University of Melbourne palynologist, Dr Vera Korasidis, the study also found that Australia’s first blooms got their foothold in ‘high southern latitude’ regions like the Otway and Gippsland ranges.

Dr Korasidis’ research, “The rise of flowering plants in the high southern latitudes of Australia,” reconstructed our earliest flower-bearing forests, from 126-100 million years ago, to conclude that climate change prevented or slowed the expansion of flowers into Australasia with the temperatures at the high southern latitudes too cold to support the earliest flowering plants.

The research also established that the first flowers related to 72 per cent of today’s living angiosperm species that first appeared in southern Australia about 108 million years ago — 17 million years after the first flowers evolved in equatorial regions.

The world’s oldest flower, Montsechia, is 130 million years old and was discovered in Spain.

“Our research, completed on dinosaur-bearing rocks throughout Victoria,suggests that warming temperatures allowed the first flowering plants to migrate to the cooler regions at the earth’s poles,” said Dr Korasidis.

“The true diversity of primitive flowers in southern near-polar settings has only just been discovered because ‘sieving’ practices resulted in pollen grains, produced by the earlier flowers, being ‘rinsed down the sink’ for over 50 years.”

Dr Korasidis said the study would help to “piece together Australia’s paleoclimate record and understand the interaction between climate, CO2 and the evolution of faunas and floras.”

The age of southern Australia’s polar vertebrates, including dinosaurs, has also now been determined and is 126-110 million years old based on this study and new research by fellow University of Melbourne palynologist and co-author, Dr Barbara Wagstaff.

Angiosperm pollen produced by the oldest flowers was recovered from numerous sites across Victoria indicating the large areal extent of flowers during the Early Cretaceous period. All material is housed in the Palaeontology collection at Museum Victoria in Melbourne.

Reference:
Vera A. Korasidis, Barbara E. Wagstaff. The rise of flowering plants in the high southern latitudes of Australia. Review of Palaeobotany and Palynology, 2020; 272: 104126 DOI: 10.1016/j.revpalbo.2019.104126

Note: The above post is reprinted from materials provided by University of Melbourne.

Experiments in evolution

An intimidating sight: Asfaltovenator vialidadi. Source: Gabriel Lio

A new find from Patagonia sheds light on the evolution of large predatory dinosaurs. Features of the 8-meter-long specimen from the Middle Jurassic suggest that it records a phase of rapid diversification and evolutionary experimentation.

In life, it must have been an intimidating sight. The dimensions of the newly discovered dinosaur fossil suggest that this individual was up to 8 meters long, and its skull alone measured 80 centimeters from front to back. The specimen was uncovered by the Munich paleontologist Oliver Rauhut in Patagonia, and can be assigned to the tetanurans—the most prominent group of bipedal dinosaurs, which includes such iconic representatives as Allosaurus, Tyrannosaurus and Velociraptor. This is also the group from which modern birds are derived. The new find is the most complete dinosaur skeleton yet discovered from the early phase of the Middle Jurassic, and is between 174 and 168 million years old. The specimen represents a previously unknown genus, and Rauhut and his Argentinian colleague Diego Pol have named it Asfaltovenator vialidadi. The genus name includes both Greek and Latin components (including the Latin term for hunter), while also referring to the nature of the deposits in which the fossil was found and the species name honours the road maintance of Chubut, who helped in the recovery of the specimen.

Almost the entire skull is preserved, together with the complete vertebral column including parts of the pelvis, all the bones of both anterior extremities and parts of the legs. “The fossil displays a very unusual combination of skeletal characters, which is difficult to reconcile with the currently accepted picture of the relationships between the three large groups that comprise the tetanurans—Megalosauria, Allosauria and Coelurosauria,” says Rauhut, who is Professor of Palaeontology in the Department of Earth and Environmental Sciences at LMU and Senior Curator of the Bavarian State Collection for Paleontology and Geology. He and his co-author Diego Pol, who is based in the Museo Paleontológico Egidio Feruglio in Trelew (Argentina), describe the find in a paper that appears in the online journal Scientific Reports. According to the authors, A. vialidadi exhibits a diverse set of skeletal traits, which combines characters that have so far been found to be specific for various other species of dinosaurs.

The unusual mixture of morphological features displayed by A. vialidadi prompted the authors to carry out a comparative analysis with other tetanurans. They noted that around the period to which the new find can be assigned, the geographical range of this group was rapidly expanding, while the different species developed very similar sets of skeletal features.

Rauhut links the explosive evolution of the group with an episode of mass extinction that had occurred in the late stage of the Lower Jurassic, about 180 million years ago. The two researchers therefore interpret the parallel development of similar external traits in different species as an example of evolutionary experimentation during the subsequent rapid expansion and diversification of the tetanurans. The prior extinction of potential competitors will have opened up new ecological niches for the groups that survived, and the tetanurans were apparently among those that benefited.

“This is a pattern that we also observe in many other groups of animals in the aftermath of mass extinctions. It holds, for example, for the expansion and diversification of both mammals and birds following the extinction of the dinosaurs at the end of the Cretaceous 66 million years ago,” says Rauhut. It could also explain why it is so difficult to unravel the phylogenetic relationships close to the origin of many highly diversified animal groups.

Reference:
Oliver W. M. Rauhut et al. Probable basal allosauroid from the early Middle Jurassic Cañadón Asfalto Formation of Argentina highlights phylogenetic uncertainty in tetanuran theropod dinosaurs, Scientific Reports (2019). DOI: 10.1038/s41598-019-53672-7

Note: The above post is reprinted from materials provided by Ludwig Maximilian University of Munich.

Mass extinction of land and sea biodiversity 250 million years ago not simultaneous

The Great Escarpment in Karoo National Park, South Africa, looking across the Lower Karoo. Credit: Wikimedia Commons

Some 250 million years ago, simultaneous mass extinctions of marine and terrestrial life occurred in an event known as the End-Permian. Or so scientists believed.

New research led by Colby College geologist Robert Gastaldo has revealed the most definitive proof to date that the extinctions did not occur at the same time. The findings, published in the journal PALAIOS, have implications for the impact of a possible future biodiversity crisis driven by climate change and a warming planet.

The NSF-funded research shows that the vertebrate fossil record reported in earlier studies—which has been used as the standard in interpreting Earth’s largest known mass extinction—is inaccurate and not sufficient to substantiate the long-held belief that marine species and terrestrial vertebrates perished together.

The findings, which resulted from 15 years of research in South Africa’s Karoo Basin, show that an event 250 million years ago devastated marine life but didn’t affect life on land. Terrestrial change happened hundreds of thousands of years earlier and very gradually, the scientists found.

“While the initial goal was to corroborate conclusions of earlier studies about what is known as the End-Permian event, our data have consistently been at odds with what has been reported,” said Gastaldo. “Purportedly extinct creatures were actually roaming around the Karoo hundreds of thousands of years later than the time scientists had written them off. And their successors were alive before they were supposed to have evolved.”

Gastaldo and colleagues came to these conclusions after examining the placement of fossil remains in the rock layers of the Karoo Basin.

“This study provides a new perspective on the largest mass extinction event in Earth’s history,” said Dena Smith, a program director in NSF’s Division of Earth Sciences. “Studies like this help us learn about past events, and can help us understand the potential effects of modern climate shifts.”

Note: The above post is reprinted from materials provided by National Science Foundation.

Sailing stone track discovered ‘hiding in plain sight’ in dinosaur fossil

This slab of sandstone has been on display since 1896, showing off the scaly footprints of a prosauropod dinosaur. Scientists only recently realized that the deep grooves on the left may be the track of a sailing stone. Credit: Lull, R.S., 1915

A sandstone slab prized for its detailed dinosaur footprints may also contain the track of a sailing stone or “walking rock.” Paleontologist Paul Olsen from Lamont-Doherty Earth Observatory announced this discovery in a presentation at the meeting of the American Geophysical Union on Monday. He and his colleagues think the trail of the walking rock is evidence of a brief freezing event in the tropics some 200 million years ago—the first evidence that volcanic winters reached into the humid tropics during the dawn of the dinosaur age.

The slab has been on display since 1896—most recently at Dinosaur State Park in Connecticut, the state where it was originally discovered. It shows off the scaly footprints of a Brontosaurus predecessor that lived in the tropics during the Early Jurassic period. But nobody noticed the sailing stone track until Olsen and his colleagues came along in 2017.

Sailing stones are rocks and boulders move across flat landscapes without the help of gravity, people, or animals, carving tracks as they go. How do they move? Scientists know of two ways: by sliding on thick, slimy microbial mats, and when they’re pushed by thin ice sheets that form temporarily over shallow lakes.

The researchers can’t say for sure whether it was one sailing stone or several that scraped this particular surface, but whatever it was, it was heavy enough to dig significant grooves in the ancient mud. A heavy object requires a thick microbial mat to lubricate its movement, but if such a thick mat was present, it would have prevented the detailed dinosaur footprints from forming.

“When the microbial mat gets thick, it actually shields the mud from the details of the foot,” explains Olsen. Furthermore, he adds, the surface doesn’t bear any of the usual markings of a thick microbial mat.

That left the other explanation: that the object was pushed by ice. That was surprising, because the track was laid down back when Connecticut was located at around the same latitude as the modern-day Yucatan peninsula. The site was at a relatively low elevation that would have experienced a tropical climate, and through most of the beginning of the Age of Dinosaurs, many of the animals and plants in the region were frost-intolerant. “There are no reasons to think that freezing would be a normal situation there,” says Olsen.

However, he and his colleagues have a potential explanation. The sandstone was deposited during the last of a series of eruptions that caused a mass extinction. The eruptions also blasted huge amounts of sulfur aerosols into the atmosphere that likely produced brief periods of global cooling, by shielding the Earth from receiving a normal amount of sunlight. However, paleoclimatologists don’t know how much sulfur was dumped into the atmosphere or how much cooling occurred. The new finding suggests that the planet may have cooled to such an extent that even the tropics froze.

“This may be evidence of the cooling caused by the volcanic winter,” says Olsen.

If the massive cooling event did reach the tropics, it is possible that the dinosaurs’ feathers provided insulation that helped them to survive the cold.

At the global scale, the freezing conditions during this time wiped out large non-insulated reptiles on land, opening up ecological space for insulated dinosaurs to dominant the planet.

Olsen cautions that the volcanic winter interpretation is “is not iron-clad,” because the team can’t entirely rule out the possibility that microbial mats allowed the rocks to sail.

Fortunately, there is a way to solve the mystery: If there were thin ice sheets in this region, then they likely moved other rocks as well. “If you could find them moving in synchrony, that would really indicate that it was ice, without a question,” says Olsen.

The team also discovered the footprints of a primitive mammal in the same sandstone slab, which had similarly gone unnoticed for more than 100 years. The mammal, sailing stone, and dinosaur likely passed by the same spot within a few days or weeks of each other.

Note: The above post is reprinted from materials provided by Earth Institute, Columbia University.

Volcano F is the Origin of the Floating Stones

Volcano F. Credit: GEOMAR

Stones do not float in water. This is a truism. But there is hardly a rule without exception. In fact, some volcanic eruptions produce a very porous type of rock with a density so low that it does float: Pumice. An unusually large amount of it is currently drifting in the Southwest Pacific towards Australia. When it was first sighted in the waters of the island state of Tonga at the beginning of August, it almost formed a coherent layer on the ocean’s surface. The “pumice raft” made it into headlines all over the world.

Various underwater volcanoes were discussed at that time as the potential source. But a direct proof for the exact origin of the pumice was missing so far. Researchers at the GEOMAR Helmholtz Centre for Ocean Research Kiel (Germany), together with colleagues from Canada and Australia, are now publishing evidence in the Journal of Volcanology and Geothermal Research that clearly identifies the culprit. It is a so far nameless underwater volcano just 50 kilometres northwest of the Tongan island of Vava’u. “In the international scientific literature, it appears so far only under the number 243091 or as Volcano F,” says Dr. Philipp Brandl of GEOMAR, first author of the study.

Only in January of this year Dr. Brandl and several of his co-authors were working in the region on the German research vessel SONNE. The expedition, named ARCHIMEDES, aimed at studying the formation of new crust in the geologically extremely dynamic region between Fiji and Tonga. “When I then saw the reports on the pumice raft in the media in the summer, I became curious and started researching with my colleagues,” says the geologist.

The team found what they were looking for on of freely accessible satellite images. On an image of the ESA satellite Copernicus Sentinel-2 taken on 6 August 2019, clear traces of an active underwater eruption can be seen on the water surface. Since the images are exactly georeferenced, they could be compared with corresponding bathymetric maps of the seafloor. “The eruption traces fit exactly to Volcano F,” says Dr. Brandl.

To be on the safe side, the researchers also compared this position with information from stations of the global seismic network that recorded signals from the eruption. “Unfortunately, the density of such stations in the region is very low. There were only two stations that recorded seismic signals of a volcanic eruption. However, their data is consistent with Volcano F as the origin,” says Dr. Brandl.

Pumice can form during volcanic eruptions when viscous lava is foamed by volcanic gases such as water vapour and carbon dioxide. This creates so many pores in the cooling rock that its density is lower than that of water. “During an underwater eruption, the probability to generate pumice is particularly high,” explains Dr. Brandl.

With the help of additional satellite images, the team traced the drift and dispersal of the pumice raft until mid-August. It slowly drifted west and reached an area of up to 167 square kilometres. This is about twice the size of Manhattan. The team was also able to constrain the magnitude of the underwater eruption. It corresponded to a volcanic eruption index of 2 or 3, which is similar to recent eruptions of Mount Stromboli, for example.

With the current direction and speed, the pumice raft is expected to hit the Great Barrier Reef off the eastern coast of Australia at the end of January or beginning of February. Biologists, in particular, are eagerly awaiting this event because pumice rafts may play an important role in the dispersion of fauna in the vastness of the Pacific Ocean. The Kiel team of geologists would like to examine samples of the pumice in order to determine the geochemistry of Volcano F more precisely. “Maybe our Australian colleagues will send us a few samples next year,” says Dr. Brandl.

Reference:
Philipp A. Brandl, Florian Schmid, Nico Augustin, Ingo Grevemeyer, Richard J. Arculus, Colin W. Devey, Sven Petersen, Margaret Stewart, Heidrun Kopp, Mark D. Hannington. The 6–8 Aug 2019 eruption of ‘Volcano F’ in the Tofua Arc, Tonga. Journal of Volcanology and Geothermal Research, 2019; 106695 DOI: 10.1016/j.jvolgeores.2019.106695

Note: The above post is reprinted from materials provided by Helmholtz Centre for Ocean Research Kiel (GEOMAR).

Researchers discover a new, young volcano in the Pacific

A new petit-spot volcano at the oldest section of the Pacific Plate Credit: Tohoku University

Researchers from Tohoku University have discovered a new petit-spot volcano at the oldest section of the Pacific Plate. The research team, led by Associate Professor Naoto Hirano of the Center for Northeast Asian Studies, published their discovery in the in the journal Deep-Sea Research Part I.

Petit-spot volcanoes are a relatively new phenomenon on Earth. They are young, small volcanoes that come about along fissures from the base of tectonic plates. As the tectonic plates sink deeper into the Earth’s upper mantle, fissures occur where the plate begins to bend causing small volcanoes to erupt. The first discovery of petit-spot volcanoes was made in 2006 near the Japan Trench, located to the northeast of Japan.

Rock samples collected from previous studies of petit-spot volcanoes signify that the magma emitted stems directly from the asthenosphere—the uppermost part of Earth’s mantle which drives the movement of tectonic plates. Studying petit-spot volcanoes provides a window into the largely unknown asthenosphere giving scientists a greater understanding of plate tectonics, the kind of rocks existing there, and the melting process undergone below the tectonic plates.

The volcano was discovered in the western part of the Pacific Ocean, near Minamitorishima Island, Japan’s easternmost point, also known as Marcus Island. The volcano is thought to have erupted less than 3 million years ago due to the subduction of the Pacific Plate deeper into the mantle of the Marina Trench. Previously, this area is thought to have contained only seamounts and islands formed 70-140 million years ago.

The research team initially suspected the presence of a small volcano after observing bathymetric data collected by the Japan Coast Guard. They then analyzed rock samples collected by the Shnkai6500, a manned submersible that can dive to depths of 6,500 meters, which observed the presence of volcano.

“The discovery of this new Volcano provides and exciting opportunity for us to explore this area further, and hopefully reveal further petit-spot volcano,” says Professor Hirano. He adds, “This will tell us more about the true nature of the asthenosphere.” Professor Hirano and his team will continue to explore the site for similar volcanoes since mapping data demonstrates that the discovered volcano is part of a cluster.

Reference:
Naoto Hirano et al. Petit-spot volcanoes on the oldest portion of the Pacific plate, Deep Sea Research Part I: Oceanographic Research Papers (2019). DOI: 10.1016/j.dsr.2019.103142

Note: The above post is reprinted from materials provided by Tohoku University.

480 million year old fossils reveal sea lilies’ ancient roots

A modern-day sea lily in the Marianas region. Credit: (c) NOAA Ocean Research and Exploration

Sea lilies, despite their name, aren’t plants. They’re animals related to starfish and sea urchins, with long feathery arms resting atop a stalk that keeps them anchored to the ocean floor. Sea lilies have been around for at least 480 million years—they first evolved hundreds of millions of years before the dinosaurs. For nearly two centuries, scientists have thought about how modern sea lilies evolved from their ancient ancestors. In a new study in the Journal of Paleontology, researchers are rewriting the sea lily family tree, aided by newly-discovered fossils that help show how these animals’ arms evolved.

“These early fossils provide new key evidence showing that what we had thought about the origin of sea lilies since 1846 is wrong,” says Tom Guensburg, the paper’s lead author and a research associate at the Field Museum in Chicago. “It’s not very often that we’re challenging ideas that are almost two hundred years old.”

Sea lilies are more formally known as crinoids, but they’ve earned their nickname—they really do look like flowers growing at the bottom of the ocean. They spend their adult lives stuck in one place, with stem-like stalks that attach them to the sea floor. At the top of these stalks are a cluster of arms, maybe the size of the palm of your hand. These arms trap tiny plankton floating through the water, which the sea lily then eats.

“Some people actually consider sea lilies and their relatives, the feather stars, the most beautiful animals. They come in any color—purple, bright red, green,” says Guensburg. “They look plant-like, but when you actually look at their bodies, you find all the usual anatomy of complex animals like a digestive tract and nervous system—they’re closer to vertebrates, and us, than almost any other invertebrate animals.”

In the new paper, Guensburg and his colleagues describe a new kind of fossil sea lily they named Athenacrinus broweri, after the Greek goddess Athena. “Athena is often depicted with rangy, almost gangly limbs on ancient Greek vases; this fossil’s arms are long and thin too,” explains Guensburg. And, he adds, “Athena is the goddess of wisdom, and this fossil tells us something important about the origin of this group. This fossil has great significance.”

This discovery has been a long time coming. In 1846, scientists were putting together the family tree of the echinoderms—animals like sea lilies, starfish, sand dollars, sea urchins, sea cucumbers, and a host of extinct groups. In the fossil record, they found ancient animals that look like modern sea lilies, with stalks ending in a bunch of delicate arms, called cystoids. They figured that both of these ancient animals must be closely related. But beginning in the 1950s, some scientists expressed doubts that cystoids belonged with the sea lilies—that similarities were superficial only. Still, evidence used to argue that crinoids and cystoids were only distantly related has been criticized to this day by those favoring the old traditional idea of crinoid origin.

Arm structure of Athenacrinus turned out to be key to figuring out how sea lilies evolved from earliest-known echinoderms, some of these up to 515 million years old. These earliest echinoderms didn’t have arms yet, but they did have plates in their bodies similar to those found in earliest crinoid arms. So some of the plates in earliest crinoid arms preceded the origin of arms themselves. These plates are nowhere to be found in sea lilies beginning 450 million years ago. And while modern sea lilies have different arm plating, they have tissues that are remnants inherited from this ancient pattern. The new paper in the Journal of Paleontology shows that early sea lilies from 480 million years ago are the missing link between the earliest sea lily ancestors and what we see in living crinoids.

Cystoids, meanwhile have different arms structures that, says Guensburg, indicate that cystoids don’t even belong to the same class of animals as sea lilies. “These new fossils provide for the first time an accurate picture of what the earliest crinoid arms were like, and they are unlike any cystoid in important ways,” says Guensburg; “No cystoid has such anatomy.” That means, Guensburg says, that crinoids and cystoids are related only at the deepest, most primitive level in echinoderm history. “One of the most fascinating branches of the tree of life, echinoderms, needs rearranging,” he notes. “That’s a big deal.”

And, he says, piecing together how sea lilies evolved helps broadens our understanding of all life: “What makes humans different from other animals is that we’re curious about understanding our place in the universe and understanding our place in the history of life. This is a piece of that—it’s what makes life interesting.”

Note: The above post is reprinted from materials provided by Field Museum.

The Antarctic: Data about the structure of the icy continent

The deep structure of the continent Antarctica. Credit: Planetary Visions (credit: ESA/Planetary Visions)

The Antarctic is one of the parts of earth that we know the least about. Due to the massive ice shield, the collection of geophysical information on site is extremely difficult and expensive. Satellite data from the European Space Agency (ESA) has now been used as the basis for new insights on the deep structure of the continent. Scientists from Kiel University (CAU) recently published their discoveries in the Journal of Geophysical Research: Solid Earth in cooperation with scientists from the British Antarctic Survey, Great Britain, and Delft University of Technology in the Netherlands.

Looking into the deep from space

The newly evaluated data from the ESA’s GOCE satellite mission dedicated to the earth’s gravitational field, combined with seismological models, enables unprecedented insights into the lithosphere, which consists of the crust and the earth’s upper mantle below the frozen continent. To do so, Folker Pappa, doctoral researcher at Kiel University and lead author of the study, along with Jörg Ebbing, Professor for Geophysics at Kiel University, used special gradient data of the satellite, among other information: “This allows a much greater level of detail when analysing deep earth structures,” says Pappa. It enables the researchers to draw conclusions about such things as the depth of the transition from crust to mantle — and these measurements are dramatically different over the 14 million square kilometre region. “Under West Antarctica, which is geologically young, the earth’s crust is comparatively thin with about 25 kilometres, and the earth’s mantle is viscous at a depth of less than 100 kilometres. East Antarctica, on the other hand, is an old cratonic shield and more than one billion years old. Here, the mantle rocks still have solid properties at a depth of more than 200 kilometres.”

Representation of the deep 3D structure of the Antarctic now also permits new findings about the so-called glacial-isostatic adjustment, explains co-author Professor Wouter van der Wal from Delft University of Technology: “This is a key process that determines how the continent responds to current and past ice sheet thinning. We found large variations in mantle temperature beneath the continent, which lead to the uplifting and subsiding of the ground with very different speeds across the continent. These new constraints on crustal and lithosphere thickness are also pivotal in the quest to estimate Antarctic geothermal heat flux and how it affects subglacial melting and ice sheet flow.”

“These are natural interactions between the ice and the solid earth. Until now, it was not possible to examine these processes more closely in the Antarctic in detail due to a lack of earth models,” added Pappa. His personal highlight are the Gamburtsev Subglacial Mountains that are still barely explored and over three thousand metres high: “The solid earth is the thickest here, at around 260 kilometres. This is an exciting structure, and we don’t know exactly what it looks like because the mountain range is completely covered with ice shields.”

Antarctica as a 3D model and its connection to other continents

The research was funded by the European Space Agency within the projects GOCE+Antarctica and 3D Earth. The international consortium of both projects consists of nine institutions in six European countries. “3D Earth offers us tantalising new geophysical findings about the deep structure and development of Antarctica. These new models showing the thickness of the crust and the lithosphere are crucial to understanding the fundamental composition and tectonic architecture of the Antarctic, for example,” emphasises Dr Fausto Ferraccioli, head geophysicist at the British Antarctic Survey and co-author of the study. “Further findings that we can derive from the study concern are the former connections between Antarctica and other continents such as Australia, Africa and India,” said Ferraccioli.

“We are finally getting to know the Antarctic properly,” says Ebbing. In addition to the temperature distribution, the researchers have also determined other properties of the solid earth, such as the composition and the rock density.

Part of the project is an impressive 3D model of the Antarctic, created by the ESA. ESA’s Roger Haagmans noted: “These are important findings also in the context of understanding sea-level change as a consequence of ice loss from Antarctica. When ice mass is lost, the solid Earth rebounds and this effect needs to be accounted for in ice volume changes. This can be better determined once the structure and composition of the Earth interior are better understood.”

Reference:
F. Pappa, J. Ebbing, F. Ferraccioli, W. Wal. Modeling Satellite Gravity Gradient Data to Derive Density, Temperature, and Viscosity Structure of the Antarctic Lithosphere. Journal of Geophysical Research: Solid Earth, 2019; DOI: 10.1029/2019JB017997

Note: The above post is reprinted from materials provided by Kiel University.

When penguins ruled after dinosaurs died

Illustration of the newly described Kupoupou stilwelli by Jacob Blokland, Flinders University. Credit: Jacob Blokland, Flinders University

What waddled on land but swam supremely in subtropical seas more than 60 million years ago, after the dinosaurs were wiped out on sea and land?

Fossil records show giant human-sized penguins flew through Southern Hemisphere waters—along side smaller forms, similar in size to some species that live in Antarctica today.

Now the newly described Kupoupou stilwelli has been found on the geographically remote Chatham Islands in the southern Pacific near New Zealand’s South Island. It appears to be the oldest penguin known with proportions close to its modern relatives.

It lived between 62.5 million and 60 million years ago at a time when there was no ice cap at the South Pole and the seas around New Zealand were tropical or subtropical.

Flinders University Ph.D. palaeontology candidate and University of Canterbury graduate Jacob Blokland made the discovery after studying fossil skeletons collected from Chatham Island between 2006 and 2011.

He helped build a picture of an ancient penguin that bridges a gap between extinct giant penguins and their modern relatives.

“Next to its colossal human-sized cousins, including the recently described monster penguin Crossvallia waiparensis, Kupoupou was comparatively small—no bigger than modern King Penguins which stand just under 1.1 metres tall,” says Mr Blokland, who worked with Professor Paul Scofield and Associate Professor Catherine Reid, as well as Flinders palaeontologist Associate Professor Trevor Worthy on the discovery.

“Kupoupou also had proportionally shorter legs than some other early fossil penguins. In this respect, it was more like the penguins of today, meaning it would have waddled on land.

“This penguin is the first that has modern proportions both in terms of its size and in its hind limb and foot bones (the tarsometatarsus) or foot shape.”

As published in the US journal Palaeontologica Electronica, the animal’s scientific name acknowledges the Indigenous Moriori people of the Chatham Island (Rēkohu), with Kupoupou meaning ‘diving bird’ in Te Re Moriori.

The discovery may even link the origins of penguins themselves to the eastern region of New Zealand—from the Chatham Island archipelago to the eastern coast of the South Island, where other most ancient penguin fossils have been found, 800km away.

University of Canterbury adjunct Professor Scofield, Senior Curator of Natural History at the Canterbury Museum in Christchurch, says the paper provides further support for the theory that penguins rapidly evolved shortly after the period when dinosaurs still walked the land and giant marine reptiles swam in the sea.

“We think it’s likely that the ancestors of penguins diverged from the lineage leading to their closest living relatives—such as albatross and petrels—during the Late Cretaceous period, and then many different species sprang up after the dinosaurs were wiped out,” Professor Scofield says

“It’s not impossible that penguins lost the ability to fly and gained the ability to swim after the extinction event of 66 million years ago, implying the birds underwent huge changes in a very short time. If we ever find a penguin fossil from the Cretaceous period, we’ll know for sure.”

Reference:
Chatham Island Paleocene fossils provide insight into the palaeobiology, evolution, and diversity of early penguins (Aves, Sphenisciformes) , Palaeontologia Electronica 22.3.78 1-92 doi.org/10.26879/1009

Note: The above post is reprinted from materials provided by Flinders University.

The ‘slow earthquakes’ that we cannot feel may help protect against the devastating ones

Unlike regular earthquakes, which can cause visible damage, slow earthquakes cannot be felt at the Earth's surface. Credit: Pixabay/ marcellomigliosi1956, licensed under pixabay license
Unlike regular earthquakes, which can cause visible damage, slow earthquakes cannot be felt at the Earth’s surface. Credit: Pixabay/ marcellomigliosi1956, licensed under pixabay license

Earthquakes are sudden and their shaking can be devastating. But about 20 years ago, a new type of earthquake was discovered. We cannot feel them, and geologists still know very little about them, such as how often they occur.

Regular earthquakes occur when rock underground breaks along a fault—a crack in the Earth’s crust that commonly forms a boundary between tectonic plates—and slips at a speed of about a metre per second.

Previously, it was thought that unless there’s an earthquake, faults move very slowly, at fingernail growth rate. Then, better earthquake-detection instruments revealed that there is a whole range of slip speeds in between. These are known as slow earthquakes and can last days, months or sometimes even years.

“Earth movement accelerates but it doesn’t accelerate to the point where it makes an earthquake that can be felt on the surface,” said Dr. Ake Fagereng, a geologist at Cardiff University in the UK.

There are still many questions to be answered about slow earthquakes though. How they happen, for example, still isn’t clear, as well as what the repercussions might be.

Dr. Fagereng and his colleagues are especially interested in slow earthquakes’ relationship to regular ones and the conditions that give rise to these events, which they are investigating as part of a project called MICA. “If we can figure that out, then we can hopefully also get at whether those conditions can change so that an earthquake speeds up,” said Dr. Fagereng.

In addition to drilling into an offshore area in New Zealand that experiences slow earthquakes, the team has been visiting regions in Japan, Namibia, Cyprus and the UK that would have experienced them in the past. Since they occur deep below the surface of the Earth, which is hard to study, the researchers have chosen areas that were once at the appropriate depths and conditions but have been brought to the surface over time due to erosion and uplift.

“We are looking for structures that formed (as a result of slow earthquakes) and what they tell us about how the rocks accommodated that slip,” said Dr. Fagereng.

Creep

Their theory is that slow earthquakes occur when creep—tiny, continuous movements in a fault—accelerates throughout the fault zone, which can be several kilometres thick. Their field observations showed that a fault can be made up of different rock types of varying strength, such as solid basalt and granite and weaker clay-rich sediment. They suspected that stronger rocks start to fracture as creep speeds up due to weaker rocks moving around them but couldn’t explain exactly why.

Using information from their fieldwork, they’ve now developed a mathematical model to reproduce their theory and describe some of the physics behind it. A mixture of rocks with different deformation styles—such as breaking or bending—seems to be key. A proportion of creeping weak rock is required, as well as locally high enough pressure to cause some rock to rupture.

“A possibility for these slow earthquakes is that you have a thick creeping zone with embedded stronger (rock) bits,” said Dr. Fagereng.

The team is planning to follow up with more field observations to refine their model. They still can’t explain why slow earthquakes occur at particular locations, for example, and why they are much more predictable than regular earthquakes, often occurring at set intervals.

Dr. Fagereng thinks that findings from the project could help improve earthquake and tsunami forecasting. Last year, researchers found the first evidence of a slow earthquake preceding a regular earthquake in an area west of Fairbanks, Alaska, in the US. But the link between the two types of tremors isn’t well understood. In some cases, slow earthquakes could also alleviate stress that would otherwise build up and cause a larger earthquake.

“We’re hoping to get somewhere on what the relation is between slow earthquakes and regular earthquakes,” said Dr. Fagereng. “And then that could potentially feed into models for what size earthquake you can get in different regions.”

Lab experiments could also shed light on the physics of slow earthquakes. Dr. Nicolas Brantut from University College London in the UK and his colleagues are using bespoke machines that can deform rock samples at high pressures and temperatures to mimic conditions deep below the surface of the Earth.

Brittle-plastic transition

His team is particularly interested in the brittle-plastic transition, a region about 10 to 15 kilometres below the surface where the behaviour of rocks changes. Above this zone they are brittle, whereas beneath it they flow due to the high temperature and pressure which increase with depth. “The brittle part is where you have earthquakes,” said Dr. Brantut.

However, slow earthquakes seem to occur in the brittle-plastic zone, based on seismological observations. In many cases, they also take place at the same temperature and pressure conditions found in this region. But so far, slow slip events have typically been modelled based on the frictional forces at a fault without taking into account the peculiarities of the brittle-plastic transition zone where rocks start to flow.

“The interactions between friction mechanisms and plastic flow mechanisms are not understood well enough to rule them out as mechanisms for slow earthquakes,” said Dr. Brantut.

As part of the RockDEaF project, Dr. Brantut and his team are investigating the motion of rocks at the brittle-plastic transition. They are replicating the conditions in this region on pieces of rock centimetres long to see whether they fracture or flow. “We want to understand how these mechanisms compete with each other,” said Dr. Brantut.

Simulating

So far, the team has examined the brittle-plastic transition by simulating a fault in the Earth’s crust in a block of marble. They investigated the behaviour of the rock at different pressures and were expecting to find a sharp transition between brittle and plastic behaviour.

However, they were surprised to find that both behaviours occurred simultaneously under a wide range of pressure conditions. “This is something that I think nobody has realised before,” said Dr. Brantut. “The fact that we can have both friction and deformation in a continuum at the same time.”

Dr. Brantut thinks that results from the project could help pin down where slow earthquakes could occur by determining the conditions and properties of rock that are required.

But they could also provide new clues about the depths at which regular earthquakes originate. Temperature below the surface of the Earth increases as a function of depth, which is typically an increase of 10°C to 40°C per kilometre in the crust. An earthquake’s lowest point of origin is thought to coincide with depths that reach 600°C, since rocks become supple when they surpass this temperature and therefore can’t fracture and generate an earthquake. However better understanding of the transition in rock behaviour should help determine if temperature is the deciding factor.

“We should understand more about what really controls how deep we can expect earthquakes to propagate,” said Dr. Brantut.

Note: The above post is reprinted from materials provided by Horizon: The EU Research & Innovation Magazine.

Analyzing seismic patterns to forecast the magnitude of the largest earthquake aftershocks

Seismogram
Seismogram being recorded by a seismograph at the Weston Observatory in Massachusetts, USA. Credit: Wikipedia

Earthquakes can have devastating impacts on communities all around the world. They strike without warning, often resulting in large fatalities. Since the aftershocks that follow the initial earthquake often prove to be more catastrophic than the mainshock, being able to accurately predict the intensity of future aftershocks can help to save lives. Associate Professor Jiancang Zhuang and Emeritus Professor Yosihiko Ogata from The Institute of Statistical Mathematics (ISM) in Japan, in collaboration with colleagues, have developed a method that can forecast the probability of when and where aftershocks are likely to occur, and how strong the largest of these will be.

Their findings were published on September 6th, 2019 in Nature Communications.

Earthquakes can trigger movement within the Earth’s crust, causing instability that can result in more powerful tremors. An earthquake is seldom an isolated event, but rather accompanied with a sequence of events, often referred to as clusters. Each sequence is typically dominated by an event that has a larger magnitude than all the other events within the sequence. This event is known as the mainshock, while the events that precede and/or follow are known as foreshocks and aftershocks respectively. Aftershocks occur in the same region as the mainshock but are of smaller magnitude. When an aftershock is larger than the mainshock, the original mainshock is redesignated as a foreshock, and the larger aftershock is recognized as the mainshock.

“Many strong earthquakes are followed by a subsequent large earthquake, of magnitude similar to the initial quake or even stronger. Repeating earthquakes cause accumulated damage on already weakened buildings and infrastructures; therefore, forecasting their occurrence is a challenging task from the viewpoint of civil protection to prevent the continuous loss of lives,” said the authors. “The probabilities of the largest earthquake following a large earthquake can be evaluated by learning from other earthquake sequences—a statistical method known as Bayesian inference—and from a very short record of the earthquake sequence,” Zhuang explained.

The authors have introduced a new method for predicting the magnitude of the largest aftershock within a future time interval, in real-time, from the history of the earthquake sequence. This method analyzes the data patterns from the particular earthquake by combining two statistical methods (Bayesian statistics and extreme value theory) and incorporating the data into the Epidemic Type Aftershock-Sequence (ETAS) model—a point process representing the time-related activity of earthquakes in a certain geophysical region—in order to quickly and accurately compute and forecast the probability and severity of aftershocks. The method, which was successfully used to analyze the earthquake sequences from the 2016 earthquake in Kumamoto, Japan, and retrospectively predicted the likelihood of large subsequent earthquakes following the mainshock, provides a useful tool for mitigating earthquake hazard.

“We understand that it is impossible to make precise predictions of when and where a damaging earthquake will occur due to the inherent randomness in earthquake occurrence and our limited observations of the underground process. But earthquake occurrence is not completely random either,” said Zhuang. “This work is done by making use of our understanding of earthquake clustering, which is the most predictable component in seismicity. Our goal is to find as many predictable components in the earthquake process as possible so that we can reduce the randomness in our forecasts.”

This research follows on from a related research result co-authored by Ogata that was published in Scientific Reports in 2013, which used the Omori formula to forecast large aftershocks within one day after the main shock.

“The difference between the two papers,” says Zhuang, “is that the former is based on the Omori formula, which only applies in the case of a single mainshock, and implies the frequency of aftershocks decreases quickly with time. Whereas our paper is based on the ETAS model, a more advanced model that applies to multiple major earthquakes, such as in the Kumamoto case,” he said. “The model used in the 2013 study aims to correct the biases caused by missing data, while the new model helps to obtain stable results as quickly as possible by using prior knowledge.”

Furthermore, the model described in the 2013 paper “forecasts the rate of earthquake in the future, and only considers the largest magnitude in a fixed time interval in the future,” said Zhuang, adding: “The results of the two papers compensate each other rather than conflict one another. It is difficult to compare them directly through their outputs.”

“One of the important advantages of the implemented method is that it fully incorporates the uncertainties of the model parameters into the analysis and the clustering structure of seismicity,” the authors write, concluding that “complex triggering including foreshocks and/or higher-order aftershocks cannot be neglected for purposes of earthquake/aftershock forecasting.”

According to Zhuang, the next step is to be able to compute this in real-time, so that once the record of earthquakes is updated, the probability forecast is updated immediately.

Reference:
Robert Shcherbakov et al, Forecasting the magnitude of the largest expected earthquake, Nature Communications (2019). DOI: 10.1038/s41467-019-11958-4

Note: The above post is reprinted from materials provided by Research Organization of Information and Systems.

Related Articles