Artist’s impression of Spinosaurus. Credit: Davide Bonadonna
A discovery of more than a thousand dinosaur teeth, by a team of researchers from the University of Portsmouth, proves beyond reasonable doubt that Spinosaurus, the giant predator made famous by the movie Jurassic Park III as well as the BBC documentary Planet Dinosaur was an enormous river-monster.
Research published today in the journal Cretaceous Research proves that Spinosaurus aegyptiacus, a 15 metre long, six-tonne beast was in fact the most commonly found creature in the Kem Kem river system, which flowed through the Sahara Desert 100 million years ago.
Until recently it was believed that dinosaurs lived exclusively on land. However, research published earlier this year showed that Spinosaurus was well adapted to an aquatic lifestyle, due to its newly discovered tail. This latest research of 1,200 teeth found in the same region further supports this theory.
Scientists from the University of Portsmouth collected the fossilised remains from the site of an ancient river bed in Morocco. After analysing all of them it was discovered there was an abundance of Spinosaurus teeth, which are distinct and easily identifiable.
David Martill, Professor of Palaeobiology at the University of Portsmouth, said:
“The huge number of teeth we collected in the prehistoric river bed reveals that Spinosaurus was there in huge numbers, accounting for 45 per cent of the total dental remains. We know of no other location where such a mass of dinosaur teeth have been found in bone-bearing rock.
“The enhanced abundance of Spinosaurus teeth, relative to other dinosaurs, is a reflection of their aquatic lifestyle. An animal living much of its life in water is much more likely to contribute teeth to the river deposit than those dinosaurs that perhaps only visited the river for drinking and feeding along its banks.
“From this research we are able to confirm this location as the place where this gigantic dinosaur not only lived but also died. The results are fully consistent with the idea of a truly water-dwelling, “river monster.” ”
Professor Martill worked alongside two students studying for their Masters Degree in Paleontology at the University of Portsmouth.
Thomas Beevor said: “The Kem Kem river beds are an amazing source of Spinosaurus remains. They also preserve the remains of many other Cretaceous creatures including sawfish, coelacanths, crocodiles, flying reptiles and other land-living dinosaurs. With such an abundance of Spinosaurus teeth, it is highly likely that this animal was living mostly within the river rather than along its banks.”
Aaron Quigley, explained the process of sorting through the teeth: “After preparing all the fossils, we then assessed each one in turn. The teeth of Spinosaurus have a distinct surface. They have a smooth round cross section which glints when held up to the light. We sorted all 1200 teeth into species and then literally counted them all up. Forty-five per cent of our total find were Spinosaurus teeth.”
Reference:
Thomas Beevor, Aaron Quigley, Roy E. Smith, Robert S.H. Smyth, Nizar Ibrahim, Samir Zouhri, David M. Martill. Taphonomic evidence supports an aquatic lifestyle for Spinosaurus. Cretaceous Research, 2021; 117: 104627 DOI: 10.1016/j.cretres.2020.104627
Earthquakes can be abrupt bursts of home-crumbling, ground-buckling energy when slices of the planet’s crust long held in place by friction suddenly slip and lurch.
“We typically think of the plates on either side of a fault moving, deforming, building up stresses and then: Boom, an earthquake happens,” said Stanford University geophysicist Eric Dunham.
But deeper down, these blocks of rock can slide steadily past one another, creeping along cracks in Earth’s crust at about the rate that your fingernails grow.
A boundary exists between the lower, creeping part of the fault, and the upper portion that may stand locked for centuries at a stretch. For decades, scientists have puzzled over what controls this boundary, its movements and its relationship with big earthquakes. Chief among the unknowns is how fluid and pressure migrate along faults, and how that causes faults to slip.
A new physics-based fault simulator developed by Dunham and colleagues provides some answers. The model shows how fluids ascending by fits and starts gradually weaken the fault. In the decades leading up to big earthquakes, they seem to propel the boundary, or locking depth, a mile or two upward.
Migrating swarms
The research, published Sept. 24 in Nature Communications, also suggests that as pulses of high-pressure fluids draw closer to the surface, they can trigger earthquake swarms — strings of quakes clustered in a local area, usually over a week or so. Shaking from these seismic swarms is often too subtle for people to notice, but not always: A swarm near the southern end of the San Andreas Fault in California in August 2020, for example, produced a magnitude-4.6 quake strong enough to rattle surrounding cities.
Each of the earthquakes in a swarm has its own aftershock sequence, as opposed to one large mainshock followed by many aftershocks. “An earthquake swarm often involves migration of these events along a fault in some direction, horizontally or vertically,” explained Dunham, senior author of the paper and an associate professor of geophysics at Stanford’s School of Earth, Energy & Environmental Sciences (Stanford Earth).
The simulator maps out how this migration works. Whereas much of the advanced earthquake modeling of the last 20 years has focused on the role of friction in unlocking faults, the new work accounts for interactions between fluid and pressure in the fault zone using a simplified, two-dimensional model of a fault that cuts vertically through Earth’s entire crust, similar to the San Andreas Fault in California.
“Through computational modeling, we were able to tease out some of the root causes for fault behavior,” said lead author Weiqiang Zhu, a graduate student in geophysics at Stanford. “We found the ebb and flow of pressure around a fault may play an even bigger role than friction in dictating its strength.”
Underground valves
Faults in Earth’s crust are always saturated with fluids — mostly water, but water in a state that blurs distinctions between liquid and gas. Some of these fluids originate in Earth’s belly and migrate upwards; some come from above when rainfall seeps in or energy developers inject fluids as part of oil, gas or geothermal projects. “Increases in the pressure of that fluid can push out on the walls of the fault, and make it easier for the fault to slide,” Dunham said. “Or, if the pressure decreases, that creates a suction that pulls the walls together and inhibits sliding.”
For decades, studies of rocks unearthed from fault zones have revealed telltale cracks, mineral-filled veins and other signs that pressure can fluctuate wildly during and between big quakes, leading geologists to theorize that water and other fluids play an important role in triggering earthquakes and influencing when the biggest temblors strike. “The rocks themselves are telling us this is an important process,” Dunham said.
More recently, scientists have documented that fluid injection related to energy operations can lead to earthquake swarms. Seismologists have linked oil and gas wastewater disposal wells, for example, to a dramatic increase in earthquakes in parts of Oklahoma starting around 2009. And they’ve found that earthquake swarms migrate along faults faster or slower in different environments, whether it’s underneath a volcano, around a geothermal operation or within oil and gas reservoirs, possibly because of wide variation in fluid production rates, Dunham explained. But modeling had yet to untangle the web of physical mechanisms behind the observed patterns.
Dunham and Zhu’s work builds on a concept of faults as valves, which geologists first put forth in the 1990s. “The idea is that fluids ascend along faults intermittently, even if those fluids are being released or injected at a steady, constant rate,” Dunham explained. In the decades to thousands of years between large earthquakes, mineral deposition and other chemical processes seal the fault zone.
With the fault valve closed, fluid accumulates and pressure builds, weakening the fault and forcing it to slip. Sometimes this movement is too slight to generate ground shaking, but it’s enough to fracture the rock and open the valve, allowing fluids to resume their ascent.
The new modeling shows for the first time that as these pulses travel upward along the fault, they can create earthquake swarms. “The concept of a fault valve, and intermittent release of fluids, is an old idea,” Dunham said. “But the occurrence of earthquake swarms in our simulations of fault valving was completely unexpected.”
Predictions, and their limits
The model makes quantitative predictions about how quickly a pulse of high-pressure fluids migrates along the fault, opens up pores, causes the fault to slip and triggers certain phenomena: changes in the locking depth, in some cases, and imperceptibly slow fault movements or clusters of small earthquakes in others. Those predictions can then be tested against the actual seismicity along a fault — in other words, when and where small or slow-motion earthquakes end up occurring.
For instance, one set of simulations, in which the fault was set to seal up and halt fluid migration within three or four months, predicted a little more than an inch of slip along the fault right around the locking depth over the course of a year, with the cycle repeating every few years. This particular simulation closely matches patterns of so-called slow-slip events observed in New Zealand and Japan — a sign that the underlying processes and mathematical relationships built into the algorithm are on target. Meanwhile, simulations with sealing dragged out over years caused the locking depth to rise as pressure pulses climbed upward.
Changes in the locking depth can be estimated from GPS measurements of the deformation of Earth’s surface. Yet the technology is not an earthquake predictor, Dunham said. That would require more complete knowledge of the processes that influence fault slip, as well as information about the particular fault’s geometry, stress, rock composition and fluid pressure, he explained, “at a level of detail that is simply impossible, given that most of the action is happening many miles underground.”
Rather, the model offers a way to understand processes: how changes in fluid pressure cause faults to slip; how sliding and slip of a fault breaks up the rock and makes it more permeable; and how that increased porosity allows fluids to flow more easily.
In the future, this understanding could help to inform assessments of risk related to injecting fluids into the Earth. According to Dunham, “The lessons that we learn about how fluid flow couples with frictional sliding are applicable to naturally occurring earthquakes as well as induced earthquakes that are happening in oil and gas reservoirs.”
This research was supported by the National Science Foundation and the Southern California Earthquake Center.
Reference:
Weiqiang Zhu, Kali L. Allison, Eric M. Dunham, Yuyun Yang. Fault valving and pore pressure evolution in simulations of earthquake sequences and aseismic slip. Nature Communications, 2020; 11 (1) DOI: 10.1038/s41467-020-18598-z
Note: The above post is reprinted from materials provided by Stanford University. Original written by Josie Garthwaite.
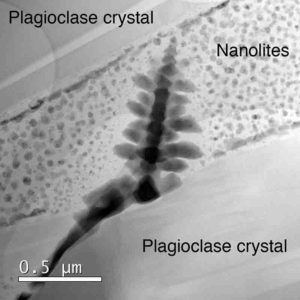
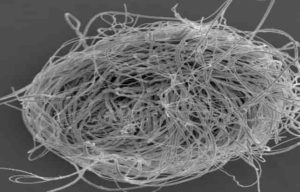
Nanolite ‘snow’ surrounding an iron oxide microlite ‘Christmas tree’. Even these small 50 nm spheres are actually made up of even smaller nanolites aggregated into clumps. Christmas has come early this year for these researchers. Credit: Brooker/Griffiths/Heard/Cherns
In a new study of volcanic processes, Bristol scientists have demonstrated the role nanolites play in the creation of violent eruptions at otherwise ‘calm’ and predictable volcanoes.
The study, published in Science Advances, describes how nano-sized crystals (nanolites), 10,000 times smaller than the width of a human hair, can have a significant impact of the viscosity of erupting magma, resulting in previously unexplained and explosive eruptions.
“This discovery provides an eloquent explanation for violent eruptions at volcanos that are generally well behaved but occasionally present us with a deadly surprise, such as the 122 BC eruption of Mount Etna,” said Dr Danilo Di Genova from the University of Bristol’s School of Earth Sciences.
“Volcanoes with low silica magma compositions have very low viscosity, which usually allows the gas to gently escape. However, we’ve shown that nanolites can increase the viscosity for a limited time, which would trap gas in the sticky liquid, leading to a sudden switch in behaviour that was previously difficult to explain.”
Dr Richard Brooker also from Earth Sciences, said: “We demonstrated the surprising effect of nanolites on magma viscosity, and thereby volcanic eruptions, using cutting-edge nano-imaging and Raman spectroscopy to hunt for evidence of these almost invisible particles in ash erupted during very violent eruptions.”
“The next stage was to re-melt these rocks in the laboratory and recreate the correct cooling rate to produce nanolites in the molten magma. Using the scattering of extremely bright synchrotron source radiation (10 billion times brighter than the sun) we were able to document nanolite growth.”
“We then produced a nanolite-bearing basaltic foam (pumice) under laboratory conditions, also demonstrating how these nanolites can be produced by undercooling as volatiles are exsolved from magma, lowering the liquidus.”
Professor Heidy Mader added: “By conducting new experiments on analogue synthetic materials, at low shear rates relative to volcanic systems, we were able to demonstrate the possibility of extreme viscosities for nanolite-bearing magma, extending our understanding of the unusual (non-Newtonian) behaviour of nanofluids, which have remained enigmatic since the term was coined 25 years ago.”
The next stage for this research is to model this dangerous, unpredictable volcanic behaviour in actual volcanic situations. This is the focus of a Natural Environment Research Council (UK) and National Science Foundation (US) grant ‘Quantifying Disequilibrium Processes in Basaltic Volcanism’ awarded to Bristol and a consortium of colleagues in Manchester, Durham, Cambridge and Arizona State University.
Reference:
Danilo Di Genova, Richard A. Brooker, Heidy M. Mader, James W. E. Drewitt, Alessandro Longo, Joachim Deubener, Daniel R. Neuville, Sara Fanara, Olga Shebanova, Simone Anzellini, Fabio Arzilli, Emily C. Bamber, Louis Hennet, Giuseppe La Spina, Nobuyoshi Miyajima. In situ observation of nanolite growth in volcanic melt: A driving force for explosive eruptions. Science Advances, 2020; 6 (39): eabb0413 DOI: 10.1126/sciadv.abb0413
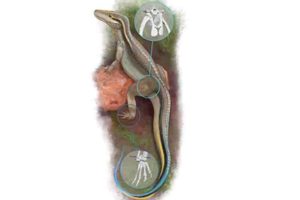
Life reconstruction of Euparkeria highlighting the body parts investigated in this study. Credit: Oliver Demuth
Scientists from the University of Bristol and the Royal Veterinary College (RVC) used three-dimensional computer modelling to investigate the hindlimb of Euparkeria capensis–a small reptile that lived in the Triassic Period 245 million years ago–and inferred that it had a “mosaic” of functions in locomotion.
The study, which was published today in Scientific Reports, was led by researcher Oliver Demuth, joined by Professors Emily Rayfield (Bristol) and John Hutchinson (RVC). Their new micro-computed tomography scans of multiple specimens revealed unprecedented information about the previously hidden shape of the hip bones and structure of the foot and ankle joint.
Euparkeria has been known from numerous fossil specimens since the early 1900s and was found to be a close relative of the last common ancestor of both crocodiles and birds. While birds and crocodiles show different locomotion strategies, two-legged birds with an upright (erect) posture, shared with two and four-legged dinosaurs, and crocodiles having a four-legged (quadrupedal) sprawling posture, their ancestor once shared a common mode of locomotion and Euparkeria can provide vital insight into how these differences came to be.
The authors’ new reconstruction of the hip structure showed that Euparkeria had a distinctive bony rim on the pelvis, called a supra-acetabular rim, covering the top of the hip joint. This feature was previously known only from later archosaurs on the line to crocodiles and often was used to infer a more erect posture for these animals; reversed in crocodiles as they became more amphibious. The hooded rim allowed the pelvis to cover the top of the thigh bone and support the body with the limbs in a columnar arrangement; hence this type of joint is called ‘pillar-erect’. Euparkeria is so far the earliest reptile with this structure preserved. Could it therefore have assumed a more erect, rather than more sprawling, posture as well?
To test how the hindlimb could or could not have moved in life, the team estimated how far the thigh bone could have rotated until it collided with the hip bones, and their models addressed how the ankle joint could have been posed, too. The computer simulations suggested that while the thigh bone could have been held in an erect posture, the foot could not have been placed steadily on the ground due to the way the foot rotates around the ankle joint, implying a more sprawling posture. However, the bony rim covering the hip joint restricted the movement of the thigh bone in a way that is unknown in any living animal capable of a more sprawling gait, hinting at a more upright posture.
The team’s simulations thus revealed seemingly contradictory patterns in the hip and ankle joint. While Euparkeria is so far the earliest reptile with this peculiar hip structure, an ankle joint allowing a more erect posture appeared later on in Triassic archosaurs. Dr. John Hutchinson, professor of evolutionary biomechanics at the RVC, said, “The mosaic of structures present in Euparkeria, then, can be seen as a central stepping-stone in the evolution of locomotion in archosaurs.”
First author Oliver Demuth, research technician at the RVC and former Masters student at the University of Bristol, said, “The hip structure of Euparkeria was extremely surprising, especially as it functionally contradicts the ankle joint. Previously it was thought that both were linked and evolved synchronously. However, we were able to demonstrate that these traits were in fact decoupled and evolved in a step-wise fashion.”
Dr. Emily Rayfield, professor of palaeobiology at the University of Bristol, said, “This approach is exciting because Using CT scan datasets and computer models of how the bones and joints fitted together has allowed us to test long-standing ideas of how these ancient animals moved and how the limbs of the earliest ancestors of birds, crocodiles and dinosaurs may have evolved”
Reference:
Oliver E. Demuth et al. 3D hindlimb joint mobility of the stem-archosaur Euparkeria capensis with implications for postural evolution within Archosauria, Scientific Reports (2020). DOI: 10.1038/s41598-020-70175-y
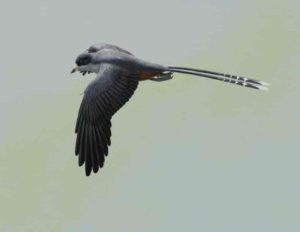
Life reconstruction of the fossil bird Confuciusornis, one of the first beaked birds. Confuciusornis was roughly the size of a crow. It is known from hundreds of beautifully-preserved fossils, found in Early Cretaceous rocks from northeastern China. Credit: Gabriel Ugueto
Confuciusornis was a crow-like fossil bird that lived in the Cretaceous ~120 million years ago. It was one of the first birds to evolve a beak. Early beak evolution remains understudied. Using an imaging technique called Laser-Stimulated Fluorescence, researchers at the University of Hong Kong (HKU) address this by revealing just how different the beak and jaw of Confuciusornis were compared to birds we see today.
Laser-Stimulated Fluorescence (LSF) is an imaging technique co-developed at HKU that involves shining a laser onto a target. It is well-known in palaeontology for making fossil bones and the soft tissues preserved alongside them glow-in-the-dark. LSF has revealed fine skin details and other previously-invisible soft tissue in a wide range of fossils, especially those of early birds and other feathered dinosaurs.
HKU PhD student Case Vincent Miller and his supervisor Research Assistant Professor Dr. Michael Pittman (Vertebrate Palaeontology Laboratory, Division of Earth and Planetary Science & Department of Earth Sciences) led this study with Thomas G. Kaye of the Foundation for Scientific Advancement (Arizona, USA) and colleagues at the Shandong Tianyu Museum of Nature (Pingyi, China). Under LSF, which was co-developed by Dr. Pittman and Mr. Kaye, the team revealed the fingernail-like ‘soft beak’ of Confuciusornis, a feature that covers the beak of every bird and is called the rhamphotheca. The example the team found in Confuciusornis was preserved detached from the bony part of the beak. “Fossilised rhamphothecae have been reported in fossil birds before,” said Dr. Pittman, “but no one has really asked what they tell us about the earliest beaked birds.”
The international research team reconstructed what the beak looked like in life, and used this to consolidate knowledge of the beak of Confucusornis across all known specimens. In highlighting that the rhamphotheca was easily-detachable and by performing the first test of jaw strength in a dinosaur-era bird, the team suggested that this early beaked bird was suited to eating soft foods. Finally, the team highlight differences in how the beak is assembled to show that despite looking like living birds, the early beaks of Confuciusornis and its close relatives are fundamentally different structures to those seen in modern birds.
Regarding future plans, Mr. Miller said, “Our research has raised a lot of interesting questions going forward. We know so little about fossil rhamphothecae and plan on using LSF to study even more fossils to find more of these hidden gems. I am particularly interested in seeing whether beak attachment strength in living birds has any correlation with the overall strength of their jaw. This might help us to better understand fossil birds. This study is only the first glimpse into this interesting and new line of study into early beaks, so I am very excited.”
Reference:
Case Vincent Miller, Michael Pittman, Thomas G. Kaye, Xiaoli Wang, Jen A. Bright, Xiaoting Zheng. Disassociated rhamphotheca of fossil bird Confuciusornis informs early beak reconstruction, stress regime, and developmental patterns. Communications Biology, 2020; 3 (1) DOI: 10.1038/s42003-020-01252-1
A bundle of giant sperm of the present-day ostracod crustacean Cyclocypris serena. Photo credit: R. Matzke-Karasz.
An international collaboration between researchers at Queen Mary University of London and the Chinese Academy of Science in Nanjing has led to the discovery of world’s oldest animal sperm inside a tiny crustacean trapped in amber around 100 million years ago in Myanmar.
A rare find
The research team, led by Dr He Wang of the Chinese Academy of Science in Nanjing, found the sperm in a new species of crustacean they named Myanmarcypris hui. They predict that the animals had sex just before their entrapment in the piece of amber (tree resin), which formed in the Cretaceous period.
Fossilised sperms are exceptionally rare; previously the oldest known examples were only 17 million years old. The study, published in Royal Society Proceedings B, has implications for understanding the evolutionary history of an unusual mode of sexual reproduction involving “giant sperm”.
The crustacean is an ostracod, a kind of invertebrate animal that has existed for 500 million years and is represented today by thousands of species living in oceans, lakes and rivers. Their fossil shells are common and abundant but finding specimens preserved in ancient amber with their appendages and internal organs intact provides a rare and exciting opportunity to learn more about their evolution.
Professor Dave Horne, of Queen Mary University of London’s School of Geography and a co-author of this study, explains: “Analyses of fossil ostracod shells are hugely informative about past environments and climates, as well as shedding light on evolutionary puzzles, but exceptional occurrences of fossilised soft parts like this lead to remarkable advances in our understanding”. During the Cretaceous period in what is now Myanmar the ostracods were probably living in a coastal lagoon fringed by trees where they became trapped in a blob of tree resin.
Furthering understandings of ecology
The Kachin amber of Myanmar has previously yielded outstanding finds including frogs, snakes and a feathered dinosaur tail. “Hundreds of new species have been described in the past five years, and many of them have made evolutionary biologists re-consider long-standing hypotheses on how certain lineages developed and how ecological relationships evolved” reports co-author Bo Wang, also of the Chinese Academy of Science in Nanjing.
Ostracods may be extremely small (typically less than one millimetre long) but in one sense they are giants. Males of most animals (including humans) typically produce tens of millions of really small sperm in very large quantities, but there are exceptions. Some tiny fruit flies (insects) and ostracods (crustaceans) are famous for investing in quality rather than quantity: relatively small numbers of “giant” sperm longer than the animal itself, a by-product of evolutionary competition for reproductive success. The new find from Myanmar had already evolved giant sperm, and the specially-adapted organs to transfer them from male to female, 100 million years ago.
Using X-ray microscopy the team made computer-aided 3D reconstructions of the ostracods embedded in the amber, revealing incredible detail. “The results were amazing – not only did we find their tiny appendages to be preserved inside their shells, we could also see their reproductive organs” reports Dr He Wang. “But when we identified the sperms inside the female, and knowing the age of the amber, it was one of those special Eureka-moments in a researcher’s life”.
Traits of evolution
Wang’s team found adult males and females but it was a female specimen that contained the sperm, indicating that it must have had sex shortly before becoming trapped in the amber. The reconstructions also revealed the distinctive muscular sperm pumps and penises (two of each) that male ostracods use to inseminate the females, who store them in bag-like receptacles until eggs are ready to be fertilised.
Such extensive adaptation raises the question of whether reproduction with giant sperms can be an evolutionarily-stable character. “To show that using giant sperms in reproduction is not an extinction-doomed extravagance of evolution, but a serious long-term advantage for the survival of a species, we need to know when they first appeared” says co-author Dr Renate Matzke-Karasz of Ludwig-Maximilians-University in Munich.
This new evidence of the persistence of reproduction with giant sperm for a hundred million years shows it to be a highly successful reproductive strategy that evolved only once in this group – quite impressive for a trait that demands such a substantial investment from both males and females, especially when you consider that many ostracods can reproduce asexually, without needing males at all. “Sexual reproduction with giant sperm must be very advantageous” says Matzke-Karasz.
Dr He Wang of the Chinese Academy of Science in Nanjing, previously spent a year of his PhD studies working with Professor Dave Horne in the School of Geography at Queen Mary University of London, and the pair have already published several joint studies of fossil ostracods.
Reference:
He Wang, Renate Matzke-Karasz, David J. Horne, Xiangdong Zhao, Meizhen Cao, Haichun Zhang, Bo Wang. Exceptional preservation of reproductive organs and giant sperm in Cretaceous ostracods. Proceedings of the Royal Society B: Biological Sciences, 2020; 287 (1935): 20201661 DOI: 10.1098/rspb.2020.1661
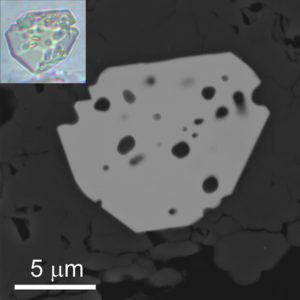
Larger: A back-scattered electron image of a microscopic crystal of priscillagrewite-(Y) enclosed in fluorapatite. Inset: An optical image of the same crystal. Credit: American Mineralogist / Irina Galuskina et al.
The greatest Christmas present Priscilla Grew received last year was an email.
Priscilla and husband Ed were vacationing in Hawaii, escaping the respective winter climes of Nebraska and Maine, when it arrived in late December.
It came from another married couple, Irina Galuskina and Evgeny Galuskin, whom Priscilla and Ed first met in 2010 at a meeting in Budapest. And it contained a surprise: “We found a new garnet and would like to name it ‘prisgrewite.’ We hope that Priscilla will agree!”
“I was just totally thrilled and overwhelmed,” said Grew, professor emeritus of Earth and atmospheric sciences and director emeritus of the University of Nebraska State Museum. “There are only about 5,600 (known) minerals, and only about a hundred are named for women.”
Though the Galuskins call her by the Russian nickname “Pris,” the International Mineralogical Association preferred her full name for the recently announced mineral: priscillagrewite-(Y). The mineral is a member of the so-called garnet supergroup, making it the equivalent of a semi-distant relative to more conventional garnet species. What sets it apart from all but one of its garnet brethren—it contains the element yttrium—is also what puts the “Y” in its name.
The Galuskins have honored Grew with their discovery partly as a tribute to one of her own, which she notched in 1966 while conducting doctoral research at the University of California, Berkeley. Alone in a lab at around 2 in the morning, Grew was analyzing a California garnet with a then-state-of-the-art instrument known as an electron microprobe, which fires a beam of electrons at a sample and records the resulting X-rays to identify the elements in it.
“This little picture, like a Polaroid, came out,” Grew said of the black-and-white output. “And there was this geometric pattern of light and dark zones.”
That angular pattern resembled the concentric rings of a tree trunk, she said, with the light zones representing higher levels of the element manganese. The phenomenon, what geologists call oscillatory zoning, indicated that the amount of nearby manganese had oscillated—high, then low, then high again, and so on—as the garnet had grown and crystallized over time.
Grew realized she was the first to observe those manganese zones in a garnet. Then and there, in the middle of the night and Berkeley’s empty Earth sciences building, she celebrated.
“I actually went out in the hall, and I ran up and down the hall, sort of skipping, shouting, ‘Yay!’ It’s the only time in my life that I’ve had a real first-ever-seen-by-human moment.”
It was a major geological achievement in a career that would come to be defined by them. But even before that moment, Grew’s colleagues at Berkeley had taken to calling her the “garnet lady.” Grew said the title has since passed to Galuskina, who, with the co-discovery of priscillagrewite-(Y), has now unearthed and named eight approved garnet species.
The Galuskins named two other minerals, edgrewite and hydroxyledgrewite, for Priscilla’s husband in 2011. Ed “lucked out,” Priscilla said, because the former mineral was already named by the time the researchers discovered the latter, whose similarity in atomic structure and composition ensured it would receive the same root name.
“Since he already had the one, they didn’t have a choice,” she joked. “People are kind of jealous, because you’re only supposed to get one mineral name per person.”
Official samples of Ed’s minerals reside at the Fersman Mineralogical Museum of the Russian Academy of Sciences in Moscow, where a specimen of priscillagrewite-(Y) will soon join them.
The Galuskins and colleague Yevgeny Vapnik collected the so-called Daba Marble rock containing priscillagrewite-(Y) in 2015, at a quarry near the Tulūl al Ḩammām region of Jordan. The quarry resides just east of the historic Hejaz Railway, which was once attacked by Arab raiders led by T.E. Lawrence and later immortalized in the film “Lawrence of Arabia.”
After finishing lab work that revealed the existence of priscillagrewite-(Y), the Galuskins proceeded to search the scientific literature—and found that the same garnet had been independently synthesized, also in 2015, by researchers at China’s Lanzhou University.
“I am so thrilled that my new mineral was discovered in Jordan,” Grew said. “My father was a minister, and as a child, we used to look together at the colored maps in the back of the Bible. I have always been fascinated by the Middle East.”
The mineral, specifically its name, has another connection to history. In September 1620—400 years ago to the month—the Pilgrim ancestor for whom Grew was named, Priscilla Mullins Alden, was aboard the Mayflower as it departed England for America.
But its ties to the past potentially stretch back even further. Another of Galuskina’s recently discovered garnets turned up in a meteorite and is thought to have crystallized from the solar nebula—the same cloud of gas and dust that would eventually form the planets of the solar system. Given its similarity to that “solar garnet,” there’s a reasonable chance priscillagrewite-(Y) is one, too.
And that’s not all. Priscillagrewite-(Y) grows in microscopic crystals about 10% the diameter of a human hair and is found inside another mineral, green fluorapatite, that itself is housed in Daba Marble. Archeologists have excavated beads and pendants made from green and red Daba Marble at sites that date back to before 6,000 B.C.
“It’s the most extraordinary-looking stone. In the Middle East, these Daba Marble ornaments are some of the oldest known stone ornaments that were ever made in this area,” Grew said. “I was so lucky to get a mineral like this, because I could have gotten one that just had no lore.”
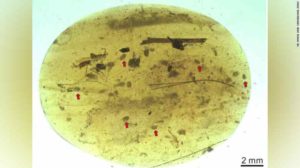
Ostracod crustaceans were entrapped in this tiny piece of Cretaceous amber found in Myanmar.
An international team of paleontologists has discovered giant sperm cells in a 100-million year-old female ostracod preserved in a sample of amber. Clearly, the tiny crustacean had mated shortly before being entombed in a drop of tree resin.
In another fascinating snapshot from deep time, an international team of paleontologists has reported the discovery of specimens of a minuscule crustacean that dates back to the Cretaceous (about 100 million years ago), conserved in samples of amber from Myanmar. The most spectacular find is a single female, which turns out on closer examination to contain giant sperm cells in its reproductive tract. In fact, this is the oldest fossil in which sperm cells have been conclusively identified. Moreover, the specimen represents a previously unknown species of crustacean, which has been named Myanmarcypris hui. M. hui was an ostracod, as clearly indicated by the paired calcareous valves that form the carapace, whose form recalls that of a mussel shell. Ostracods have been around for 500 million years, and thousands of modern species have been described. They are found in the oceans and in freshwater lakes and rivers. Fossilized shells of these crustaceans are by no means rare, but the specimens preserved in Burmese amber reveal details of their internal organs, including those involved in reproduction. “The finds gave us an extremely rare opportunity to learn more about the evolution of these organs,” says Ludwig-Maximilians-Universitaet (LMU) in Munich geobiologist Renate Matzke-Karasz, who played a major role in the morphological analysis of the fossils.
During the Cretaceous period, ostracods must have lived in the coastal and inland waters of what is now Myanmar, which were fringed by forests dominated by trees that produced huge quantities of resin. The newly described specimens are among the many organisms that were trapped in the oozing blobs of the gooey substance. In recent years, the amber found in the province of Kachin has yielded a spectacular trove of fossils, including frogs and snakes, as well as part of a putative dinosaur (according to new evidence, that specimen may actually represent an unusual lizard). Over the past 5 years, hundreds of previously unknown species have been described based on these inclusions. Indeed, many of them have forced evolutionary biologists to reconsider conventional hypotheses concerning phylogenetic and ecological relationships.
The new ostracod specimens were analyzed with the aid of computer-assisted 3D X-ray reconstructions. The images revealed astonishing details of the anatomy of these animals, ranging from their tiny limbs to their reproductive organs. — And in one female specimen, Matzke-Karasz and her colleagues discovered ripe sperm. The cells were discovered in the paired sperm receptacles in which they were stored after copulation, ready for release when the female’s eggs matured. “This female must have mated shortly before being encased in the resin,” says He Wang of the Chinese Academy of Sciences in Nanjing. The X-ray images also revealed the sperm pumps and the pair of penises that male ostracods insert into the twin gonopores of the females.
The finds in Burmese amber provide unprecedented insights into an unexpectedly ancient and advanced instance of evolutionary specialization. “The complexity of the reproductive system in these specimens raises the question of whether the investment in giant sperm cells might represent an evolutionarily stable strategy, says Matzke-Karasz. The males of most animal species (including humans) produce very large numbers of very small sperm. Comparatively few animals, including some fruit flies — and of course, ostracods — have opted for a different approach. They make a relatively small numbers of oversized sperm, whose motile tails are several times longer than the animal itself.
“In order to prove that the use of giant sperm is not an extravagant whim on the part of evolution, but a viable strategy that can confer an enduring advantage that enables species to survive for long periods of time, we must establish when this mode of reproduction first appeared,” says Matzke-Karasz. Examples of fossilized sperm cells are extremely rare. The oldest known ostracod sperm (prior to the new discovery) are 17 million years old, and the previous record age, 50 Myr, was held by a species of worm. The new evidence extends that age by a factor of at least two. The fact that animals had already developed giant sperm 100 million years ago implies that this reproductive strategy can indeed be successful in the (very) long term, Matzke-Karasz points out. “That’s a pretty impressive record for a trait that requires a considerable investment from both the males and females of the species. From an evolutionary point of view, sexual reproduction with the aid of giant sperm must therefore be a thoroughly profitable strategy.”
Reference:
He Wang, Renate Matzke-Karasz, David J. Horne, Xiangdong Zhao, Meizhen Cao, Haichun Zhang, Bo Wang. Exceptional preservation of reproductive organs and giant sperm in Cretaceous ostracods. Proceedings of the Royal Society B: Biological Sciences, 2020; 287 (1935): 20201661 DOI: 10.1098/rspb.2020.1661
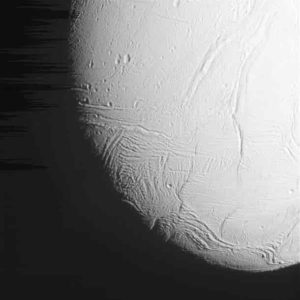
This image of Saturn’s icy, geologically active moon Enceladus was acquired by NASA’s Cassini spacecraft during its October 2015 flyby. Enceladus hides a global ocean of liquid salty water beneath its crust and might also have hydrothermal vents not unlike the hydrothermal vents that dot the ocean floor here on Earth. NASA/JPL-Caltech/Space Science Institute
New research led by the American Museum of Natural History and funded by NASA identifies a process that might have been key in producing the first organic molecules on Earth about 4 billion years ago, before the origin of life. The process, which is similar to what might have occurred in some ancient underwater hydrothermal vents, may also have relevance to the search for life elsewhere in the universe. Details of the study are published this week in the journal Proceedings of the National Academy of Sciences.
All life on Earth is built of organic molecules — compounds made of carbon atoms bound to atoms of other elements such as hydrogen, nitrogen and oxygen. In modern life, most of these organic molecules originate from the reduction of carbon dioxide (CO2) through several “carbon-fixation” pathways (such as photosynthesis in plants). But most of these pathways either require energy from the cell in order to work, or were thought to have evolved relatively late. So how did the first organic molecules arise, before the origin of life?
To tackle this question, Museum Gerstner Scholar Victor Sojo and Reuben Hudson from the College of the Atlantic in Maine devised a novel setup based on microfluidic reactors, tiny self-contained laboratories that allow scientists to study the behavior of fluids — and in this case, gases as well — on the microscale. Previous versions of the reactor attempted to mix bubbles of hydrogen gas and CO2 in liquid but no reduction occurred, possibly because the highly volatile hydrogen gas escaped before it had a chance to react. The solution came in discussions between Sojo and Hudson, who shared a lab bench at the RIKEN Center for Sustainable Resource Science in Saitama, Japan. The final reactor was built in Hudson’s laboratory in Maine.
“Instead of bubbling the gases within the fluids before the reaction, the main innovation of the new reactor is that the fluids are driven by the gases themselves, so there is very little chance for them to escape,” Hudson said.
The researchers used their design to combine hydrogen with CO2 to produce an organic molecule called formic acid (HCOOH). This synthetic process resembles the only known CO2-fixation pathway that does not require a supply of energy overall, called the Wood-Ljungdahl acetyl-CoA pathway. In turn, this process resembles reactions that might have taken place in ancient oceanic hydrothermal vents.
“The consequences extend far beyond our own biosphere,” Sojo said. “Similar hydrothermal systems might exist today elsewhere in the solar system, most noticeably in Enceladus and Europa — moons of Saturn and Jupiter, respectively — and so predictably in other water-rocky worlds throughout the universe.”
“Understanding how carbon dioxide can be reduced under mild geological conditions is important for evaluating the possibility of an origin of life on other worlds, which feeds into understanding how common or rare life may be in the universe,” added Laurie Barge from NASA’s Jet Propulsion Laboratory, an author on the study.
The researchers turned CO2 into organic molecules using relatively mild conditions, which means the findings may also have relevance for environmental chemistry. In the face of the ongoing climate crisis, there is an ongoing search for new methods of CO2 reduction.
“The results of this paper touch on multiple themes: from understanding the origins of metabolism, to the geochemistry that underpins the hydrogen and carbon cycles on Earth, and also to green chemistry applications, where the bio-geo-inspired work can help promote chemical reactions under mild conditions,” added Shawn E. McGlynn, also an author of the study, based at the Tokyo Institute of Technology.
Other authors on this study include Ruvan de Graaf and Mari Strandoo Rodin from the College of the Atlantic, Aya Ohno from the RIKEN Center for Sustainable Resource Science in Japan, Nick Lane from University College London, Yoichi M.A. Yamada from RIKEN, Ryuhei Nakamura from RIKEN and Tokyo Institute of Technology, and Dieter Braun from Ludwig-Maximilians University in Munich.
This work was supported in part by NASA’s Maine Space Grant Consortium (SG-19-14 and SG-20-19), the U.S. National Science Foundation (1415189 and 1724300), the Japan Society for the Promotion of Science (FY2016-PE-16047 and FY2016-PE-16721), the National Institutes of Health’s National Institute of General Medical Sciences (P20GM103423), the European Molecular Biology Organization (ALTF- 725 1455-2015), the Institute for Advanced Study in Berlin, and the Gerstner Family Foundation.
Reference:
Reuben Hudson, Ruvan de Graaf, Mari Strandoo Rodin, Aya Ohno, Nick Lane, Shawn E. McGlynn, Yoichi M. A. Yamada, Ryuhei Nakamura, Laura M. Barge, Dieter Braun, Victor Sojo. CO2 reduction driven by a pH gradient. Proceedings of the National Academy of Sciences, 2020; 202002659 DOI: 10.1073/pnas.2002659117
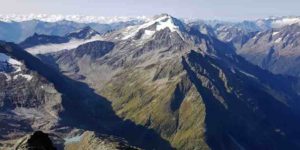
Central Alps of Switzerland have been lifted to today’s height. Credit: ETH Zurich The Central Alps – in the middle of the picture the Oberalpstock – were not piled up in a bulldozer like manner but had been lifted to their present height. Credit: Peter Rüegg
For a long time, geoscientists have assumed that the Alps were formed when the Adriatic plate from the south collided with the Eurasian plate in the north. According to the textbooks, the Adriatic plate behaved like a bulldozer, thrusting rock material up in front of it into piles that formed the mountains. Supposedly, their weight subsequently pushed the underlying continental plate downwards, resulting in the formation of a sedimentary basin in the north adjacent to the mountains — the Swiss Molasse Plateau. Over time, while the mountains grew higher the basin floor sank deeper and deeper with the rest of the plate.
A few years ago, however, new geophysical and geological data led ETH geophysicist Edi Kissling and Fritz Schlunegger, a sediment specialist from the University of Bern, to express doubts about this theory. In light of the new information, the researchers postulated an alternative mechanism for the formation of the Alps.
Altitude of the Alps has barely changed
Kissling and Schlunegger pointed out that the topography and altitude of the Alps have barely changed over the past 30 million years, and yet the trench at the site of the Swiss Plateau has continued to sink and the basin extended further north. This leads the researchers to believe that the formation of the Central Alps and the sinking of the trench are not connected as previously assumed.
They argue that if the Alps and the trench indeed had formed from the impact of two plates pressing together, there would be clear indications that the Alps were steadily growing. That’s because, based on the earlier understanding of how the Alps formed, the collision of the plates, the formation of the trench and the height of the mountain range are all linked.
Furthermore, seismicity observed during the past 40 years within the Swiss Alps and their northern foreland clearly documents extension across the mountain ranges rather than the compression expected for the bulldozing Adria model.
The behaviour of the Eurasian plate provides a possible new explanation. Since about 60 Ma ago, the former oceanic part of the Eurasian plate sinks beneath the continental Adriatic microplate in the south. By about 30 Ma ago, this process of subduction is so far advanced that all oceanic lithosphere has been consumed and the continental part of the Eurasian plate enters the subduction zone.
This denotes the begin of the so-called continent-continent collision with the Adriatic microplate and the European upper, lighter crust separates from the heavier, underlying lithospheric mantle. Because it weighs less, the Earth’s crust surges upwards, literally creating the Alps for the first time around 30 Ma ago. While this is happening, the lithospheric mantle sinks further into the Earth’s mantle, thus pulling the adjacent part of the plate downwards.
This theory is plausible because the Alps are mainly made up of gneiss and granite and their sedimentary cover rocks like limestone. These crustal rocks are significantly lighter than the Earth’s mantle — into which the lower layer of the plate, the lithospheric mantle, plunges after the detachment of the two layers that form the continental plate. “In turn, this creates strong upward forces that lift the Alps out of the ground,” Kissling explains. “It was these upward forces that caused the Alps to form, not the bulldozer effect as a result of two continental plates colliding,” he says.
New model confirms lift hypothesis
To investigate the lift hypothesis, Luca Dal Zilio, former doctoral student in ETH geophysics professor Taras Gerya’s group, has now teamed up with Kissling and other ETH researchers to develop a new model. Dal Zilio simulated the subduction zone under the Alps: the plate tectonic processes, which took place over millions of years, and the associated earthquakes.
“The big challenge with this model was bridging the time scales. It takes into account lightning-fast shifts that manifest themselves in the form of earthquakes, as well as deformations of the crust and lithospheric mantle over thousands of years,” says Dal Zilio, lead author of the study recently published in the journal Geophysical Research Letters.
According to Kissling, the model is an excellent way to simulate the uplifting processes that he and his colleague are postulating. “Our model is dynamic, which gives it a huge advantage,” he says, explaining that previous models took a rather rigid or mechanical approach that did not take into account changes in plate behaviour. “All of our previous observations agree with this model,” he says.
The model is based on physical laws. For instance, the Eurasian plate would appear to subduct southwards. In contrast to the normal model of subduction, however, it doesn’t actually move in this direction because the position of the continent remains stable. This forces the subducting lithosphere to retreat northwards, causing the Eurasian plate to exert a suction effect on the relatively small Adriatic plate.
Kissling likens the action to a sinking ship. The resulting suction effect is very strong, he explains. Strong enough to draw in the smaller Adriatic microplate so that it collides with the crust of the Eurasian plate. “So, the mechanism that sets the plates in motion is not in fact a pushing effect but a pulling one,” he says, concluding that the driving force behind it is simply the pull of gravity on the subducting plate.
Rethinking seismicity
In addition, the model simulates the occurrence of earthquakes, or seismicity, in the Central Alps, the Swiss Plateau and below the Po Valley. “Our model is the first earthquake simulator for the Swiss Central Alps,” says Dal Zilio. The advantage of this earthquake simulator is that it covers a very long period of time, meaning that it can also simulate very strong earthquakes that occur extremely rarely.
“Current seismic models are based on statistics,” Dal Zilio says, “whereas our model uses geophysical laws and therefore also takes into account earthquakes that occur only once every few hundreds of years.” Current earthquake statistics tend to underestimate such earthquakes. The new simulations therefore improve the assessment of earthquake risk in Switzerland.
Reference:
Luca Dal Zilio, Edi Kissling, Taras Gerya, Ylona Dinther. Slab Rollback Orogeny Model: A Test of Concept. Geophysical Research Letters, 2020; 47 (18) DOI: 10.1029/2020GL089917
Note: The above post is reprinted from materials provided by ETH Zurich. Original written by Peter Rüegg.
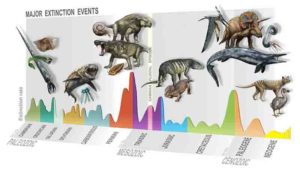
Summary of major extinction events through time, highlighting the new, Carnian Pluvial Episode at 233 million years ago. Credit: D. Bonadonna/ MUSE, Trento
It’s not often a new mass extinction is identified; after all, such events were so devastating they really stand out in the fossil record. In a new paper, published today in Science Advances, an international team has identified a major extinction of life 233 million years ago that triggered the dinosaur takeover of the world. The crisis has been called the Carnian Pluvial Episode.
The team of 17 researchers, led by Jacopo Dal Corso of the China University of Geosciences at Wuhan and Mike Benton of the University of Bristol’s School of Earth Sciences, reviewed all the geological and palaeontological evidence and determined what had happened.
The cause was most likely massive volcanic eruptions in the Wrangellia Province of western Canada, where huge volumes of volcanic basalt was poured out and forms much of the western coast of North America.
“The eruptions peaked in the Carnian,” says Jacopo Dal Corso. “I was studying the geochemical signature of the eruptions a few years ago and identified some massive effects on the atmosphere worldwide. The eruptions were so huge, they pumped vast amounts of greenhouse gases like carbon dioxide, and there were spikes of global warming”.The warming was associated with increased rainfall, and this had been detected back in the 1980s by geologists Mike Simms and Alastair Ruffell as a humid episode lasting about 1 million years in all. The climate change caused major biodiversity loss in the ocean and on land, but just after the extinction event new groups took over, forming more modern-like ecosystems. The shifts in climate encouraged growth of plant life, and the expansion of modern conifer forests.
“The new floras probably provided slim pickings for the surviving herbivorous reptiles,” said Professor Mike Benton. “I had noted a floral switch and ecological catastrophe among the herbivores back in 1983 when I completed my Ph.D. We now know that dinosaurs originated some 20 million years before this event, but they remained quite rare and unimportant until the Carnian Pluvial Episode hit. It was the sudden arid conditions after the humid episode that gave dinosaurs their chance.”
It wasn’t just dinosaurs, but also many modern groups of plants and animals also appeared at this time, including some of the first turtles, crocodiles, lizards, and the first mammals.
The Carnian Pluvial Episode also had an impact on ocean life. It marks the start of modern-style coral reefs, as well as many of the modern groups of plankton, suggesting profound changes in the ocean chemistry and carbonate cycle.
“So far, palaeontologists had identified five “big” mass extinctions in the past 500 million years of the history of life,” says Jacopo Dal Corso. “Each of these had a profound effect on the evolution of the Earth and of life. We have identified another great extinction event, and it evidently had a major role in helping to reset life on land and in the oceans, marking the origins of modern ecosystems.”
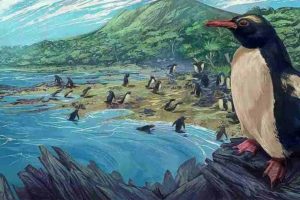
The dawn crested penguin Eudyptes atatu in New Zealand, three million years ago. Image by Simone Giovanardi. Permission for use of the image for a press release is granted by the artist. Credit: Massey University
New Zealand is surrounded by highly productive oceans that attract seabirds from around the world, forming a global hotspot for seabird diversity. Establishing how and when this hotspot formed has been challenged by a lack of fossil discoveries connecting New Zealand’s living seabirds to their ancient relatives.
Researchers from Massey University, Bruce Museum (CT, U.S.), Canterbury Museum, Museum of New Zealand Te Papa Tongarewa, and Iowa State University (IA, U.S.) have analyzed fossil bones from an ancient penguin discovered in coastal Taranaki in the North Island of New Zealand. Museum curators Alan Tennyson and Paul Scofield recognized the importance of fossil bones being found by local collectors and assembled collections to begin the investigation.
The newly described three-million-year old dawn crested penguin Eudyptes atatu from Taranaki now provides a crucial connection to the past, confirming crested penguins, and perhaps other types of seabird, have been living in Zealandia, or the New Zealand continent Te Riu-a-Māui, for millions of years.
“This has been an exciting research collaboration to be part of,” Daniel Thomas from the School of Natural and Computational Sciences at Massey University says.
“It’s given us an important into the evolution of crown penguins and re-enforces the importance of the New Zealand continent for seabird evolution. Our growing fossil record suggests that Zealandia was an incubator of penguin diversity in which the first penguins likely evolved and later dispersed throughout the Southern Hemisphere. The name of the newly described penguin species Eudyptes atatu comes from a contraction of ata tū, which is ‘dawn’ in Te Reo Maori. Dawn references the fact that this species is the beginning of our knowledge for crested penguins in New Zealand.”
The research is detailed further in a paper titled “Ancient crested penguin constrains timing of recruitment into seabird hotspot” published in the Proceedings of the Royal Society B. The study concludes that the ancestor of all penguins lived in Zealandia over 60 million years ago, and that the ancestor of crested penguins may have originated in Zealandia before its descendants dispersed throughout the Southern Hemisphere.
Reference:
Daniel B. Thomas et al. Ancient crested penguin constrains timing of recruitment into seabird hotspot, Proceedings of the Royal Society B: Biological Sciences (2020). DOI: 10.1098/rspb.2020.1497
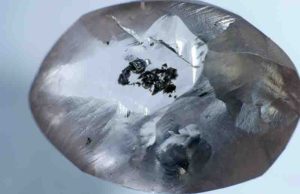
A rough diamond from Kankan, Guinea, that was analyzed in a new study led by a PhD student at the U of A. The imperfections inside the diamond are small inclusions of a mineral called ferropericlase, which is from the lower mantle. Credit: Anetta Banas
In a new study led by a University of Alberta Ph.D. student, researchers used diamonds as breadcrumbs to provide insight into some of Earth’s deepest geologic mechanisms.
“Geologists have recently come to the realization that some of the largest, most valuable diamonds are from the deepest portions of our planet,” said Margo Regier, a Ph.D. student in the Faculty of Science under the supervision of Graham Pearson and Thomas Stachel. “While we are not yet certain why diamonds can grow to larger sizes at these depths, we propose a model where these ‘superdeep’ diamonds crystallize from carbon-rich magmas, which may be critical for them to grow to their large sizes.”
Beyond their beauty and industrial applications, diamonds provide unique windows into the deep Earth, allowing scientists to examine the transport of carbon through the mantle.
“The vast majority of Earth’s carbon is actually stored in its silicate mantle, not in the atmosphere,” Regier explained. “If we are to fully understand Earth’s whole carbon cycle, we need to understand this vast reservoir of carbon deep underground.”
The study revealed that the carbon-rich oceanic crust that sinks into the deep mantle releases most of its carbon before it gets to the deepest portion of the mantle. That means most carbon is recycled back to the surface, and only small amounts are stored in the deep mantle—which has significant implications for how scientists understand the Earth’s carbon cycle.
The mechanism is important to understand for a number of reasons, Regier noted.
“The movement of carbon between the surface and mantle affects Earth’s climate, the composition of its atmosphere and the production of magma from volcanoes,” said Regier.
“We do not yet understand if this carbon cycle has changed over time, nor do we know how much carbon is stored in the deepest parts of our planet. If we want to understand why our planet has evolved into its habitable state today and how the surfaces and atmospheres of other planets may be shaped by their interior processes, we need to better understand these variables.”
The study was made possible through a collaboration between researchers at the U of A and the University of Glasgow, including Jeff Harris, who collected the diamond samples. Support through federal funding from the Natural Sciences and Engineering Research Council of Canada, through the Diamond Exploration Research Training School at the U of A, was also integral in enabling the research.
The study, “The Lithospheric to Lower Mantle Carbon Cycle Recorded in Superdeep Diamonds,” was published in Nature.
Reference:
The lithospheric-to-lower-mantle carbon cycle recorded in superdeep diamonds. Nature (2020). doi.org/10.1038/s41586-020-2676-z
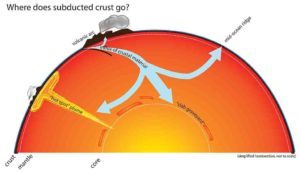
The pale blue arrows indicate the ultimate destiny of crustal material that is subducted into the mantle. The material may be incorporated into mantle plumes, recycled into overlying volcanic arcs, descend wholly to the core-mantle boundary (a proposed “slab graveyard”) or absorbed into the mantle proper, mingling with the “crystal mush” and eventually being incorporated into mantle-characterized igneous rocks (like those at a mid-ocean ridge). Credit: Erin Walde – Transferred from en.wikipedia to Commons., CC BY-SA 3.0
New geologic findings about the makeup of the Earth’s mantle are helping scientists better understand long-term climate stability and even how seismic waves move through the planet’s layers.
The research by a team including Case Western Reserve University scientists focused on the “deep carbon cycle,” part of the overall cycle by which carbon moves through the Earth’s various systems.
In simplest terms, the deep carbon cycle involves two steps:
Surface carbon, mostly in the form of carbonates, is brought into the deep mantle by subducting oceanic plates at ocean trenches.
That carbon is then returned to the atmosphere as carbon dioxide (CO2) through mantle melting and magma degassing processes at volcanoes
Scientists have long suspected that partially melted chunks of this carbon are broadly distributed throughout the Earth’s solid mantle.
What they haven’t fully understood is how far down into the mantle they might be found, or how the geologically slow movement of the material contributes to the carbon cycle at the surface, which is necessary for life itself.
Deep carbon and climate change connection
“Cycling of carbon between the surface and deep interior is critical to maintaining Earth’s climate in the habitable zone over the long term — meaning hundreds of millions of years,” said James Van Orman, a professor of geochemistry and mineral physics in the College of Arts and Sciences at Case Western Reserve and an author on the study, recently published in the Proceedings of the National Academy of Sciences.
“Right now, we have a good understanding of the surface reservoirs of carbon, but know much less about carbon storage in the deep interior, which is also critical to its cycling.”
Van Orman said this new research showed — based on experimental measurements of the acoustic properties of carbonate melts, and comparison of these results to seismological data — that a small fraction (less than one-tenth of 1%) of carbonate melt is likely to be present throughout the mantle at depths of about 180-330 km.
“Based on this inference, we can now estimate the carbon concentration in the deep upper mantle and infer that this reservoir holds a large mass of carbon, more than 10,000 times the mass of carbon in Earth’s atmosphere,” Van Orman said.
That’s important, Van Orman said, because gradual changes in the amount of carbon stored in this large reservoir, due to exchange with the atmosphere, could have a corresponding effect on CO2 in the atmosphere — and therefore, on long-term climate change.
The first author of the article is Man Xu, who did much of the work as a PhD student at Case Western Reserve and is now a postdoctoral scholar at the University of Chicago.
Others on the project were from Florida State University, the University of Chicago and Southern University of Science and Technology (SUSTech) in Shenzhen, China.
Explaining seismic wave speed differences
The research also sheds light on seismology, especially deep earth research.
One way geologists better understand the deep interior is by measuring how seismic waves generated by earthquakes — fast-moving compressional waves and slower shear waves — move through the Earth’s layers.
Scientists have long wondered why the speed difference between the two types of seismic waves — P-waves and S-waves — peaked at depths of around 180 to 330 kilometers into the Earth.
Carbon-rich melts seem to answer that question: small quantities of these melts could be dispersed throughout the deep upper mantle and would explain the speed change, as the waves move differently through the melts.
Reference:
Man Xu, Zhicheng Jing, Suraj K. Bajgain, Mainak Mookherjee, James A. Van Orman, Tony Yu, Yanbin Wang. High-pressure elastic properties of dolomite melt supporting carbonate-induced melting in deep upper mantle. Proceedings of the National Academy of Sciences, 2020; 117 (31): 18285 DOI: 10.1073/pnas.2004347117
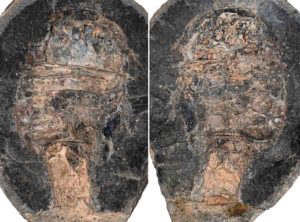
Eurypterid specimen image: Images of the eurypterid specimen fossil that led to Lamsdell’s discovery. Credit: Melanie Hopkins Photo
Scientists have long debated the respiratory workings of sea scorpions, but a new discovery by a West Virginia University geologist concludes that these largely aquatic extinct arthropods breathed air on land.
James Lamsdell dug into the curious case of a 340 million-year-old sea scorpion, or eurypterid, originally from France that had been preserved at a Glasgow, Scotland museum for the last 30 years.
An assistant professor of geology in the Eberly College of Arts and Sciences, Lamsdell had read about the “strange specimen” 25 years ago while conducting his doctoral studies. Existing research suggested it would occasionally go on land.
Yet nothing was known on whether it could breathe air. The closest living relative to the eurypterid is the horseshoe crab, which lays eggs on land but is unable to breathe above water.
These details puzzled Lamsdell through the years until he reached out to a colleague, Victoria McCoy at the University of Wisconsin-Milwaukee, and asked, “Do you have access to a CT scanner?”
“We wondered if we could apply new technology to look further into what was preserved of this specimen,” said Lamsdell, who heads a paleobiology lab at WVU. “I like the science and detective work that goes into research. And this was a cold case where we knew there was potential evidence.”
Through computed tomography (CT) imaging, Lamsdell and his team found that evidence, which is published in Current Biology.
Researchers managed to study the respiratory organs of the three-dimensional eurypterid, leading to two findings that stood out to Lamsdell. First, he noticed that each gill on the sea scorpion was composed of a series of plates. But the back contained fewer plates than the front, prompting researchers to question how it could even breathe.
Then they zeroed in on pillars connecting the different plates of the gill, which are seen in modern scorpions and spiders, Lamsdell said. These pillars, or small beams of tissue, are called trabeculae.
“That props the gills apart so they don’t collapse when out of water,” Lamsdell explained. “It’s something that modern arachnids still have. Finding that was the final indication.
“The reason we think they were coming onto land was to move between pools of water. They could also lay eggs in more sheltered, safer environments and migrate back into the open water.”
The discovery of air-breathing structures in the eurypterids indicate that terrestrial characteristics occurred in the arachnid stem lineage, the researchers wrote, suggesting that the ancestor of arachnids were semi-terrestrial.
In addition to Lamsdell and McCoy, co-authors include Opal Perron-Feller of Oberlin College and Melanie Hopkins of the American Museum of Natural History.
Now that Lamsdell has cracked the case living in the back of his head for 20-plus years, he believes there’s more to unearth from the fossil. He noted that the sea scorpion’s back legs expand into a paddle shape, which he suspects would have been used to swim. The bases of their legs also had spikes that ground up food for them that they maneuvered into their mouths, Lamsdell added.
“One of the things that would be really cool to do is to flesh out this model and try to reconstruct exactly how the legs could move and how they were positioned,” Lamsdell said, “like reconstructing the fossil as a living animal.”
Reference:
James C. Lamsdell, Victoria E. McCoy, Opal A. Perron-Feller, Melanie J. Hopkins. Air Breathing in an Exceptionally Preserved 340-Million-Year-Old Sea Scorpion. Current Biology, 2020; DOI: 10.1016/j.cub.2020.08.034
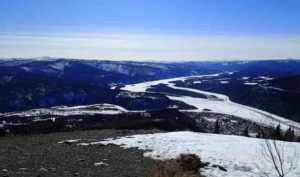
Researchers collected and analyzed permafrost from four sites in the Yukon to develop a new technique to tease ancient DNA from soil, pulling the genomes of hundreds of extinct animals and thousands of plants from less than a gram of sediment. Credit: Tyler Murchie/ McMaster University
Researchers at McMaster University have developed a new technique to tease ancient DNA from soil, pulling the genomes of hundreds of animals and thousands of plants — many of them long extinct — from less than a gram of sediment.
The DNA extraction method, outlined in the journal Quarternary Research, allows scientists to reconstruct the most advanced picture ever of environments that existed thousands of years ago.
The researchers analyzed permafrost samples from four sites in the Yukon, each representing different points in the Pleistocene–Holocene transition, which occurred approximately 11,000 years ago.
This transition featured the extinction of a large number of animal species such as mammoths, mastodons and ground sloths, and the new process has yielded some surprising new information about the way events unfolded, say the researchers. They suggest, for example, that the woolly mammoth survived far longer than originally believed.
In the Yukon samples, they found the genetic remnants of a vast array of animals, including mammoths, horses, bison, reindeer and thousands of varieties of plants, all from as little as 0.2 grams of sediment.
The scientists determined that woolly mammoths and horses were likely still present in the Yukon’s Klondike region as recently as 9,700 years ago, thousands of years later than previous research using fossilized remains had suggested.
“That a few grams of soil contains the DNA of giant extinct animals and plants from another time and place, enables a new kind of detective work to uncover our frozen past,” says evolutionary geneticist Hendrik Poinar, a lead author on the paper and director of the McMaster Ancient DNA Centre. “This research allows us to maximize DNA retention and fine-tune our understanding of change through time, which includes climate events and human migration patterns, without preserved remains.”
The technique resolves a longstanding problem for scientists, who must separate DNA from other substances mixed in with sediment. The process has typically required harsh treatments that actually destroyed much of the usable DNA they were looking for. But by using the new combination of extraction strategies, the McMaster researchers have demonstrated it is possible to preserve much more DNA than ever.
“All of the DNA from those animals and plants is bound up in a tiny speck of dirt,” explains Tyler Murchie, a PhD candidate in the Department of Anthropology and a lead author of the study.
“Organisms are constantly shedding cells throughout their lives. Humans, for example, shed some half a billion skin cells every day. Much of this genetic material is quickly degraded, but some small fraction is safeguarded for millenia through sedimentary mineral-binding and is out there waiting for us to recover and study it. Now, we can conduct some remarkable research by recovering an immense diversity of environmental DNA from very small amounts of sediment, and in the total absence of any surviving biological tissues.”
Reference:
Tyler J. Murchie, Melanie Kuch, Ana T. Duggan, Marissa L. Ledger, Kévin Roche, Jennifer Klunk, Emil Karpinski, Dirk Hackenberger, Tara Sadoway, Ross MacPhee, Duane Froese, Hendrik Poinar. Optimizing extraction and targeted capture of ancient environmental DNA for reconstructing past environments using the PalaeoChip Arctic-1.0 bait-set. Quaternary Research, 2020; 1 DOI: 10.1017/qua.2020.59
Note: The above post is reprinted from materials provided by McMaster University. Original written by Michelle Donovan.
A plume of ash and dust rises from Pavlof Volcano on the Alaskan Peninsula in 2013. Credit: NASA
When volcanoes erupt, these geologic monsters produce tremendous clouds of ash and dust — plumes that can blacken the sky, shut down air traffic and reach heights of roughly 25 miles above Earth’s surface.
A new study led by the University of Colorado Boulder suggests that such volcanic ash may also have a larger influence on the planet’s climate than scientists previously suspected.
The new research, published in the journal Nature Communications, examines the eruption of Mount Kelut (or Kelud) on the Indonesian island of Java in 2014. Drawing on real-world observations of this event and advanced computer simulations, the team discovered that volcanic ash seems to be prone to loitering — remaining in the air for months or even longer after a major eruption.
“What we found for this eruption is that the volcanic ash can persist for a long time,” said Yunqian Zhu, lead author of the new study and a research scientist at the Laboratory for Atmospheric and Space Physics (LASP) at CU Boulder.
Lingering ash
The discovery began with a chance observation: Members of the research team had been flying an unmanned aircraft near the site of the Mount Kelut eruption — an event that covered large portions of Java in ash and drove people from their homes. In the process, the aircraft spotted something that shouldn’t have been there.
“They saw some large particles floating around in the atmosphere a month after the eruption,” Zhu said. “It looked like ash.”
She explained that scientists have long known that volcanic eruptions can take a toll on the planet’s climate. These events blast huge amounts of sulfur-rich particles high into Earth’s atmosphere where they can block sunlight from reaching the ground.
Researchers haven’t thought, however, that ash could play much of a role in that cooling effect. These chunks of rocky debris, scientists reasoned, are so heavy that most of them likely fall out of volcanic clouds not long after an eruption.
Zhu’s team wanted to find out why that wasn’t the case with Kelut. Drawing on aircraft and satellite observations of the unfolding disaster, the group discovered that the volcano’s plume seemed to be rife with small and lightweight particles of ash — tiny particles that were likely capable of floating in the air for long periods of time, much like dandelion fluff.
“Researchers have assumed that ash is similar to volcanic glass,” Zhu said. “But what we’ve found is that these floating ones have a density that’s more like pumice.”
Disappearing molecules
Study coauthor Brian Toon added that these pumice-like particles also seem to shift the chemistry of the entire volcanic plume.
Toon, a professor in LASP and the Department of Atmospheric and Oceanic Sciences at CU Boulder, explained that erupting volcanoes spew out a large amount of sulfur dioxide. Many researchers previously assumed that those molecules interact with others in the air and convert into sulfuric acid — a series of chemical reactions that, theoretically, could take weeks to complete. Observations of real-life eruptions, however, suggest that it happens a lot faster than that.
“There has been a puzzle of why these reactions occur so fast,” Toon said.
He and his colleagues think they’ve discovered the answer: Those molecules of sulfur dioxide seem to stick to the particles of ash floating in the air. In the process, they may undergo chemical reactions on the surface of the ash itself — potentially pulling around 43% more sulfur dioxide out of the air.
Ash, in other words, may hasten the transformation of volcanic gases in the atmosphere.
Just what the impact of those clouds of ash are on the climate isn’t clear. Long-lasting particles in the atmosphere could, potentially, darken and even help to cool the planet after an eruption. Floating ash might also blow all the way from sites like Kelut to the planet’s poles. There, it could kickstart chemical reactions that would damage Earth’s all-important ozone layer.
But the researchers say that one thing is clear: When a volcano blows, it may be time to pay a lot more attention to all that ash and its true impact on Earth’s climate.
“I think we’ve discovered something important here,” Toon said. “It’s subtle, but it could make a big difference.”
Reference:
Yunqian Zhu, Owen B. Toon, Eric J. Jensen, Charles G. Bardeen, Michael J. Mills, Margaret A. Tolbert, Pengfei Yu, Sarah Woods. Persisting volcanic ash particles impact stratospheric SO2 lifetime and aerosol optical properties. Nature Communications, 2020; 11 (1) DOI: 10.1038/s41467-020-18352-5
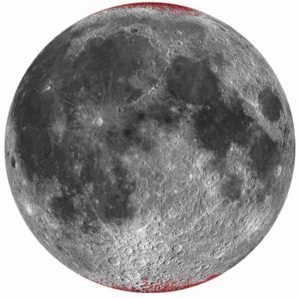
Enhanced map of hematite (red) on Moon using a spheric projection (nearside only). Credit: Shuai Li
To the surprise of many planetary scientists, the oxidized iron mineral hematite has been discovered at high latitudes on the Moon, according to a study published today in Science Advances led by Shuai Li, assistant researcher at the Hawai’i Institute of Geophysics and Planetology (HIGP) in the UH Mānoa School of Ocean and Earth Science and Technology (SOEST).
Iron is highly reactive with oxygen — forming reddish rust commonly seen on Earth. The lunar surface and interior, however, are virtually devoid of oxygen, so pristine metallic iron is prevalent on the Moon and highly oxidized iron has not been confirmed in samples returned from the Apollo missions. In addition, hydrogen in solar wind blasts the lunar surface, which acts in opposition to oxidation. So, the presence of highly oxidized iron-bearing minerals, such as hematite, on the Moon is an unexpected discovery.
“Our hypothesis is that lunar hematite is formed through oxidation of lunar surface iron by the oxygen from the Earth’s upper atmosphere that has been continuously blown to the lunar surface by solar wind when the Moon is in Earth’s magnetotail during the past several billion years,” said Li.
To make this discovery, Li, HIGP professor Paul Lucey and co-authors from NASA’s Jet Propulsion Laboratory (JPL) and elsewhere analyzed the hyperspectral reflectance data acquired by the Moon Mineralogy Mapper (M3) designed by NASA JPL onboard India’s Chandrayaan-1 mission.
This new research was inspired by Li’s previous discovery of water ice in the Moon’s polar regions in 2018.
“When I examined the M3 data at the polar regions, I found some spectral features and patterns are different from those we see at the lower latitudes or the Apollo samples,” said Li. “I was curious whether it is possible that there are water-rock reactions on the Moon. After months investigation, I figured out I was seeing the signature of hematite.”
The team found the locations where hematite is present are strongly correlated with water content at high latitude Li and others found previously and are more concentrated on the nearside, which always faces the Earth.
“More hematite on the lunar nearside suggested that it may be related to Earth,” said Li. “This reminded me a discovery by the Japanese Kaguya mission that oxygen from the Earth’s upper atmosphere can be blown to the lunar surface by solar wind when the Moon is in the Earth’s magnetotail. So, Earth’s atmospheric oxygen could be the major oxidant to produce hematite. Water and interplanetary dust impact may also have played critical roles”
“Interestingly, hematite is not absolutely absent from the far-side of the Moon where Earth’s oxygen may have never reached, although much fewer exposures were seen,” said Li. “The tiny amount of water (< ~0.1 wt.%) observed at lunar high latitudes may have been substantially involved in the hematite formation process on the lunar far-side, which has important implications for interpreting the observed hematite on some water poor S-type asteroids.”
“This discovery will reshape our knowledge about the Moon’s polar regions,” said Li. “Earth may have played an important role on the evolution of the Moon’s surface.”
The research team hopes the NASA’s ARTEMIS missions can return hematite samples from the polar regions. The chemical signatures of those samples can confirm their hypothesis whether the lunar hematite is oxidized by Earth’s oxygen and may help reveal the evolution of the Earth’s atmosphere in the past billions of years.
Reference:
Shuai Li, Paul G. Lucey, Abigail A. Fraeman, Andrew R. Poppe, Vivian Z. Sun, Dana M. Hurley and Peter H. Schultz. Widespread hematite at high latitudes of the Moon. Science Advances, 2020 DOI: 10.1126/sciadv.aba1940
Rock-melting forces occurring much deeper in the Earth than previously understood appear to drive tremors along a notorious segment of California’s San Andreas Fault, according to new USC research that helps explain how quakes happen.
The study from the emergent field of earthquake physics looks at temblor mechanics from the bottom up, rather than from the top down, with a focus on underground rocks, friction and fluids. On the segment of the San Andreas Fault near Parkfield, Calif., underground excitations — beyond the depths where quakes are typically monitored — lead to instability that ruptures in a quake.
“Most of California seismicity originates from the first 10 miles of the crust, but some tremors on the San Andreas Fault take place much deeper,” said Sylvain Barbot, assistant professor of Earth sciences at the USC Dornsife College of Letters, Arts and Sciences. “Why and how this happens is largely unknown. We show that a deep section of the San Andreas Fault breaks frequently and melts the host rocks, generating these anomalous seismic waves.” The newly published study appears in Science Advances. Barbot, the corresponding author, collaborated with Lifeng Wang of the China Earthquake Administration in China.
The findings are significant because they help advance the long-term goal of understanding how and where earthquakes are likely to occur, along with the forces that trigger temblors. Better scientific understanding helps inform building codes, public policy and emergency preparedness in quake-ridden areas like California. The findings may also be important in engineering applications where the temperature of rocks is changed rapidly, such as by hydraulic fracturing.
Parkfield was chosen because it is one of the most intensively monitored epicenters in the world. The San Andreas Fault slices past the town, and it’s regularly ruptured with significant quakes. Quakes of magnitude 6 have shaken the Parkfield section of the fault at fairly regular intervals in 1857, 1881, 1901, 1922, 1934, 1966 and 2004, according to the U.S. Geological Survey. At greater depths, smaller temblors occur every few months. So what’s happening deep in the Earth to explain the rapid quake recurrence?
Using mathematical models and laboratory experiments with rocks, the scientists conducted simulations based on evidence gathered from the section of the San Andreas Fault extending up to 36 miles north of — and 16 miles beneath — Parkfield. They simulated the dynamics of fault activity in the deep Earth spanning 300 years to study a wide range of rupture sizes and behaviors.
The researchers observed that, after a big quake ends, the tectonic plates that meet at the fault boundary settle into a go-along, get-along phase. For a spell, they glide past each other, a slow slip that causes little disturbance to the surface.
But this harmony belies trouble brewing. Gradually, motion across chunks of granite and quartz, the Earth’s bedrock, generates heat due to friction. As the heat intensifies, the blocks of rock begin to change. When friction pushes temperatures above 650 degrees Fahrenheit, the rock blocks grow less solid and more fluid-like. They start to slide more, generating more friction, more heat and more fluids until they slip past each other rapidly — triggering an earthquake.
“Just like rubbing our hands together in cold weather to heat them up, faults heat up when they slide. The fault movements can be caused by large changes in temperature,” Barbot said. “This can create a positive feedback that makes them slide even faster, eventually generating an earthquake.”
It’s a different way of looking at the San Andreas Fault. Scientists typically focus on movement in the top of Earth’s crust, anticipating that its motion in turn rejiggers the rocks deep below. For this study, the scientists looked at the problem from the bottom up.
“It’s difficult to make predictions,” Barbot added, “so instead of predicting just earthquakes, we’re trying to explain all of the different types of motion seen in the ground.”
The study was supported by grants from the National Natural Science Foundation of China (NSFC-41674067 and NSFC-U1839211) and the U.S. National Science Foundation (EAR-1848192).
Reference:
Lifeng Wang, Sylvain Barbot. Excitation of San Andreas tremors by thermal instabilities below the seismogenic zone. Science Advances, 2020; 6 (36): eabb2057 DOI: 10.1126/sciadv.abb2057
Bezymianny is an active stratovolcano on the Kamchatka peninsula in eastern Russia. Credit: GFZ
Volcanoes are born and die — and then grow again on their own remains. The decay of a volcano in particular is often accompanied by catastrophic consequences, as was the most recent case for Anak Krakatau in 2018. The flank of the volcano had collapsed sliding into the sea. The resulting tsunami killed several hundred people on Indonesia’s coast.
Continued volcanic activity after a collapse has not been documented in detail so far. Now and for the first time, researchers from the German Research Center for Geosciences GFZ and Russian volcanologists are presenting the results of a photogrammetric data series spanning seven decades for the Bezymianny volcano, Kamchatka, in the journal Nature Communications Earth and Environment. First author Alina Shevchenko from GFZ says, “thanks to the German-Russian cooperation we were able to analyze and reinterpret a unique data set.”
Bezymianny had a collapse of its eastern sector in 1956. Photographs of helicopter overflights from Soviet times in combination with more recent satellite drone data have now been analyzed at GFZ Potsdam using state-of-the-art methods. The images show the rebirth of the volcano after its collapse. The initial re-growth began at different vents about 400 meters apart. After about two decades, the activity increased and the vents slowly moved together. After about fifty years, the activity concentrated on a single vent, which allowed the growth of a new and steep cone.
The authors of the study determined an average growth rate of 26,400 cubic meters per day — equivalent to about a thousand large dump trucks. The results make it possible to predict when the volcanic building may once again reach a critical height, so that it may collapse again under its own weight. The numerical modeling also explains the changes in stress within the volcanic rock and thus the migration of the eruption vents. Thomas Walter, volcanologist at the GFZ and co-author of the study, summarizes: “Our results show that the decay and re-growth of a volcano has a major impact on the pathways of the magma in the depth. Thus, disintegrated and newly grown volcanoes show a kind of memory of their altered field of stress.” For future prognosis, this means that the history of birth and collapse must be included to be able to give estimates about possible eruptions or imminent collapses.
Reference:
Alina V. Shevchenko, Viktor N. Dvigalo, Thomas R. Walter, Rene Mania, Francesco Maccaferri, Ilya Yu. Svirid, Alexander B. Belousov, Marina G. Belousova. The rebirth and evolution of Bezymianny volcano, Kamchatka after the 1956 sector collapse. Communications Earth & Environment, 2020; 1 (1) DOI: 10.1038/s43247-020-00014-5