Home Blog Page 240

Gravity data show that Antarctic ice sheet is melting increasingly faster

Princeton University researchers “weighed” Antarctica’s ice sheet using gravitational satellite data and found that from 2003 to 2014, the ice sheet lost 92 billion tons of ice per year. Credit: Image by Christopher Harig, Department of Geosciences

During the past decade, Antarctica’s massive ice sheet lost twice the amount of ice in its western portion compared with what it accumulated in the east, according to Princeton University researchers who came to one overall conclusion — the southern continent’s ice cap is melting ever faster.

The researchers “weighed” Antarctica’s ice sheet using gravitational satellite data and found that from 2003 to 2014, the ice sheet lost 92 billion tons of ice per year, the researchers report in the journal Earth and Planetary Science Letters. If stacked on the island of Manhattan, that amount of ice would be more than a mile high — more than five times the height of the Empire State Building.

The vast majority of that loss was from West Antarctica, which is the smaller of the continent’s two main regions and abuts the Antarctic Peninsula that winds up toward South America. Since 2008, ice loss from West Antarctica’s unstable glaciers doubled from an average annual loss of 121 billion tons of ice to twice that by 2014, the researchers found. The ice sheet on East Antarctica, the continent’s much larger and overall more stable region, thickened during that same time, but only accumulated half the amount of ice lost from the west, the researchers reported.

“We have a solution that is very solid, very detailed and unambiguous,” said co-author Frederik Simons, a Princeton associate professor of geosciences. “A decade of gravity analysis alone cannot force you to take a position on this ice loss being due to anthropogenic global warming. All we have done is take the balance of the ice on Antarctica and found that it is melting — there is no doubt. But with the rapidly accelerating rates at which the ice is melting, and in the light of all the other, well-publicized lines of evidence, most scientists would be hard pressed to find mechanisms that do not include human-made climate change.”

Compared to other types of data, the Princeton study shows that ice is melting from West Antarctica at a far greater rate than was previously known and that the western ice sheet is much more unstable compared to other regions of the continent, said first author Christopher Harig, a Princeton postdoctoral research associate in geosciences. Overall, ice-loss rates from all of Antarctica increased by 6 billion tons per year each year during the 11-year period the researchers examined. The melting rate from West Antarctica, however, grew by 18 billion tons per year every year, Harig and Simons found. Accelerations in ice loss are measured in tons per year, per year, or tons per year squared.

Of most concern, Harig said, is that this massive and accelerating loss occurred along West Antarctica’s Amundsen Sea, particularly Pine Island and the Thwaites Glacier, where heavy losses had already been recorded. An iceberg more than 2,000 square miles in size broke off from the Thwaites Glacier in 2002.

In Antarctica, it’s the ocean currents rather than air temperatures that melt the ice, and melted land ice contributes to higher sea levels in a way that melting icebergs don’t, Harig said. As the ocean warms, floating ice shelves melt and can no longer hold back the land ice.

“The fact that West Antarctic ice-melt is still accelerating is a big deal because it’s increasing its contribution to sea-level rise,” Harig said. “It really has potential to be a runaway problem. It has come to the point that if we continue losing mass in those areas, the loss can generate a self-reinforcing feedback whereby we will be losing more and more ice, ultimately raising sea levels by tens of feet.”

The Princeton study differs from existing approaches to measuring Antarctic ice loss in that it derives from the only satellite data that measure the mass of ice rather than its volume, which is more typical, Simons explained. He and Harig included monthly data from GRACE, or the Gravity Recovery and Climate Experiment, a dual-satellite joint mission between NASA and the German Aerospace Center. GRACE measures gravity changes to determine the time-variable behavior of various components in the Earth’s mass system such as ocean currents, earthquake-induced changes and melting ice. Launched in 2002, the GRACE satellites are expected to be retired by 2016 with the first of two anticipated replacement missions scheduled for 2017.

While the volume of an ice sheet — or how much space it takes up — is also crucial information, it can change without affecting the amount of ice that is present, Simons explained. Snow and ice, for instance, compact under their own weight so that to the lasers that are bounced off the ice’s surface to determine volume, there appears to be a reduction in the amount of ice, Simons said. Mass or weight, on the other hand, changes when ice is actually redistributed and lost.

Simons equated the difference between measuring ice volume and mass to a person weighing himself by only looking in the mirror instead of standing on a scale.

“You shouldn’t only look at the ice volume — you should also weigh it to find the mass changes,” Simons said. “But there isn’t going to be a whole lot of research of this type coming up because the GRACE satellites are on their last legs. This could be the last statement of this kind on these kinds of data for a long time. There may be a significant data gap during which the only monitoring available will not be by ‘weighing’ but by ‘looking’ via laser or radar altimetry, photogrammetry or field studies.”

Harig and Simons developed a unique data-analysis method that allowed them to separate GRACE data by specific Antarctic regions. Because the ice sheet behaves differently in different areas, a continent-wide view would provide a general sense of how all of the ice mass, taken together, has changed, but exclude finer-scale geographical detail and temporal fluctuations. They recently published a paper about their computational methods in the magazine EOS, Transactions of the American Geophysical Union, and used a similar method for a 2012 paper published in the Proceedings of the National Academy of Sciences that revealed sharper-than-ever details about Greenland’s accelerating loss of its massive ice sheet.

Robert Kopp, a Rutgers University associate professor of earth and planetary sciences and associate director of the Rutgers Energy Institute, said the analysis method Harig and Simons developed allowed them to capture a view of regional Antarctic ice loss “more accurately than previous approaches.” Beyond the recent paper, Harig and Simons’ method could be important for testing models of Antarctic ice-sheet stability developed by other researchers, he said.

“The notable feature of this research is the power of their method to resolve regions geographically in gravity data,” Kopp said. “I expect that [their] technique will be an important part of monitoring future changes in the ice sheet and testing such models.”

Reference:
Christopher Harig, Frederik J. Simons. Accelerated West Antarctic ice mass loss continues to outpace East Antarctic gains. Earth and Planetary Science Letters, 2015; 415: 134 DOI: 10.1016/j.epsl.2015.01.029

Note: The above story is based on materials provided by Princeton University. The original article was written by Morgan Kelly.

Unique fish fossils identified

Kenyaichthys. Credit: M. Altner, LMU

A team of Ludwig-Maximilians-Universitaet (LMU) in Munich has identified the first fossil specimens of a major group of killifishes that is widely distributed in freshwater habitats today. The 6-million-year-old material sheds new light on the evolution of the bony fishes.

Killifish are true survivors. These colorful little fish are perfectly adapted to the demands of their ephemeral habitats. They spend their short lives in temporary freshwater pools that form during the rainy season, and owe their long-term survival to the fact that their eggs are resistant to desiccation. Although they are a species-rich group, and are widely distributed in the tropics and subtropics, their fossil record is sparse. But now LMU palaeontologists Professor Bettina Reichenbacher and Melanie Altner have identified the first fossil representatives of one of the two extant suborders of killifish. “The specimens are exceptionally well preserved, date from about 6 million years ago, and were discovered in Kenya by French palaeoanthropologists,” says Reichenbacher. “Our studies have now shown that they are members of a previously unknown genus that is now extinct, which we have named Kenyaichthys – the fish from Kenya.”

A cache that includes 77 complete specimens

The fossils originate from a site located in the Tugen Hills, which lie in the Eastern arm of the East African Rift Valley. During the Late Miocene – about six million years ago – the site formed part of a lake, and the newly described specimens, each 2 to 4 cm long, were preserved in the sediment beds that accumulated on the lake bottom. “The sample comprises a total of 169 individuals, and 77 of these are complete,” says Altner. The anatomical details discernible in the impressions left in the sediments enabled the two researchers to conclusively identify all of these individuals as killifishes. “Analysis of the structures of the tailfin, the pelvic fins and the bones in the skull, in particular, yielded crucial information that convinced us that this material constituted the first fossils attributable to the killifish Suborder Aplocheiloidei. This group also encompasses modern African killifishes, such as Pachypanchax from Madagascar, the striped panchaxes of Southeast Asia and the rivulids of South America,” Altner explains.

In addition to the fossil aplocheiloids, only a few other freshwater forms were found at the site. Reichenbacher and Altner assume that the prevailing environmental conditions were too extreme for less specialized species. During the Late Miocene, the climate got drier and extensive areas of savannah developed. “We believe that, like modern killifish species, Kenyaichthys was well equipped to survive long periods of drought, and could cope better with such conditions than other species of fish,” says Reichenbacher.

A unique combination of traits

Since many killifish species are short-lived they are used to study aging processes. But the group is also of interest to evolutionary biologists because they offer useful models for the study of speciation – and in this context some of the characters displayed by Kenyaichthys are especially intriguing: “Our fossils exhibit morphological traits that are found in extant African species of killifish. But they also possess one specific trait that is typical for contemporary rivulids from South America. This combination is very unusual, and may indicate that Kenyaichthys is closely related to forms that are now restricted to South America. Alternatively, this particular character may have been lost in the lineage that gave rise to modern African aprocheiloids,” Altner explains.

Furthermore, many features of the new fossils – including elements of the tailfin and the dorsal fins, and the relative sizes of the different body parts – vary markedly from one individual to the next. As the closest surviving relatives of Kenyaichthys do not display such a wide range of variability, the fossil material from the Tugen Hills appears to document a particularly fascinating evolutionary process – the diversification of a so-called species flock. The term ‘species flock’ refers to a group of closely related species that have evolved from a single progenitor species in an isolated population and developed distinct specializations that enable them to coexist. Darwin’s finches, which occupy different ecological niches on the Galapagos, are perhaps the best known example of a species flock. “So, this is an exciting find in many respects, which provides wholly new insights into the evolutionary history of the killifishes and their relatives,” says Reichenbacher.

Reference:
“Kenyaichthyidae fam. nov. and Kenyaichthys gen. nov. – First Record of a Fossil Aplocheiloid Killifish (Teleostei, Cyprinodontiformes).” PLoS ONE 10(4): e0123056. DOI: 10.1371/journal.pone.0123056

Note : The above story is based on materials provided by Ludwig Maximilian University of Munich.

Rupture along the Himalayan Front

* Credit: Morell et al. and Lithosphere

In their article for Lithosphere on 12 March, authors Kristin Morell and colleagues write, “The ∼700-km-long ‘central seismic gap’ is the most prominent segment of the Himalayan front not to have ruptured in a major earthquake during the last 200-500 years. This prolonged seismic quiescence has led to the proposition that this region, with a population of more 10 million, is overdue for a great earthquake. Despite the region’s recognized seismic risk, the geometry of faults likely to host large earthquakes remains poorly understood.”
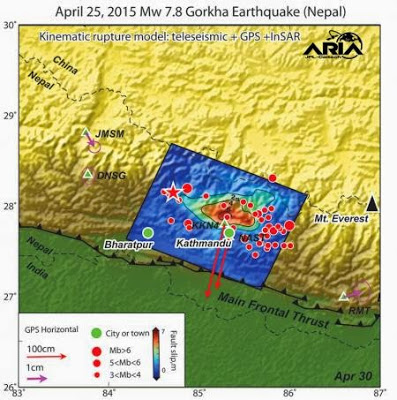
A little more than a month on, the area experience a magnitude 7.8 earthquake, centered in Nepal (25 Apr. 2015).

In their study, Morell and colleagues use a series of complementary geomorphic and erosion rate data to define the ramp-flat geometry of the active detachment fault that is likely to host a large earthquake within the hinterland of the northwest Himalaya. Their analysis indicates that this detachment is sufficiently large to host another great earthquake in the western half of the central Himalayan seismic gap.

Specifically, their data sets point to a distinctive physiographic transition at the base of the high Himalaya in the state of Uttarakhand, India, characterized by abrupt strike-normal increases in channel steepness and a tenfold increase in erosion rates.

When combined with previously published geophysical imaging and seismicity data sets, Morell and colleagues interpret the observed spatial distribution of erosion rates and channel steepness to reflect the landscape response to spatially variable rock uplift due to a structurally coherent ramp-flat system of the Main Himalayan Thrust. They write, “Although it remains unresolved whether the kinematics of the Main Himalayan Thrust ramp involve an emergent fault or duplex, the landscape and erosion rate patterns suggest that the décollement beneath the state of Uttarakhand provides a sufficiently large and coherent fault segment capable of hosting a great earthquake.”

In conclusion, they note, “While this hypothesis remains speculative, it is supported by independent records of historical seismicity.”

*Photo Caption:
Figure 1. (A) Date and rupture patches for large historical Himalayan earthquakes (Rajendran and Rajendran, 2005; Kumar et al., 2006) with reference to the Uttarakhand region of the central seismic gap, and the physiographic transition 2 of Uttarakhand (UPT2 ) and Nepal (NPT2 ) (Wobus et al., 2006a). (B) Simplified geologic map for area shown in A (Célérier et al., 2009a; Webb et al., 2011). Focal mechanisms of all earthquakes within the recording period (Mw 5-7) are shown with location as white circle. Earthquake locations are based on Ni and Baranzangi (1984) and the National Earthquake Information Center (NEIC) catalog (earthquake.usgs.gov). Focal mechanisms are based on Ni and Baranzangi (1984) or the Global Centroid-Moment-Tensor (CMT) catalog (globalcmt.org). STD–South Tibetan Detachment; THS–Tethyan Himalayan Sequence; MCT–Main Central Thrust; GHS–Greater Himalayan Sequence; LHS–Lesser Himalayan Sequence; MBT–Main Boundary Thrust; MFT–Main Frontal Thrust.

Reference:
Geomorphology reveals active decollement geometry in the central Himalayan seismic gap
K.D. Morell et al., University of Melbourne, Melbourne, Victoria, Australia. Published online ahead of print on 12 Mar. 2015; DOI: 10.1130/L407.1.

Note : The above story is based on materials provided by Geological Society of America.

Fossils help identify marine life at high risk of extinction today

Ocean areas predicted to be at high risk of extinction (red) are overlaid with areas most impacted by humans (black outline) and regions experiencing a high rate of climate change (crosshatch). Credit: Finnegan et al, Science.

A detailed study of marine animals that died out over the past 23 million years can help identify which animals and ocean ecosystems may be most at risk of extinction today, according to an international team of paleontologists and ecologists.

In a paper to be published in the May 1 issue of the journal Science, researchers from the University of California, Berkeley, and other institutions report that worldwide patterns of extinction remained remarkably similar over this period, with the same groups of animals showing similar rates of extinction throughout and with a consistent set of characteristics associated with elevated extinction risk.

The researchers then used these past global extinction patterns as a baseline to predict which ocean areas and marine organisms would be most at risk today without the added threat of human-caused habitat destruction, overfishing, pollution and ocean acidification.

Finally, the authors combined this natural or ‘intrinsic’ extinction risk with current threats from humans and climate change to obtain a global map of potential future hotspots of extinction risk.

“Our goal was to diagnose which species are vulnerable in the modern world, using the past as a guide,” said lead author Seth Finnegan, an assistant professor of integrative biology at UC Berkeley. “We believe the past can inform the way we plan our conservation efforts. However, there is a lot more work that needs to be done to understand the causes underlying these patterns and their policy implications.”

“It’s very difficult to detect extinctions in the modern oceans, but fossils can help fill in the gaps,” added co-author and conservation biologist Sean Anderson, a postdoctoral researcher at Simon Fraser University in Burnaby, British Columbia. “Our findings can help prioritize areas and species that might be at greater risk of extinction and that might require extra attention, conservation or management.”

Marine extinctions with and without humans

The study found that animals with small geographic ranges are most at risk of extinction, Finnegan said. In addition, some groups tend to be more extinction-prone than others. For example, in the fossil record, whales, dolphins and seals show higher risk of extinction than sharks or invertebrates such as corals. Clams and mussels — so-called bivalves — had about one-tenth the extinction risk of mammals.

The authors used these patterns from the fossil record to assess the natural extinction risk of animals living in the oceans today. Comparing these patterns with areas where human activities such as fishing impact the oceans revealed areas that may be particularly sensitive. These areas included high- biodiversity regions of the tropics such as the Indo-Pacific and the Caribbean, as well as regions such as Antarctica that harbor many unique species.

“The implications of these patterns for the future of coastal marine ecosystems will depend on how natural risk and current threats interact,” said co-author Paul Harnik, an assistant professor of geosciences at Franklin and Marshall College in Lancaster, Pennsylvania. “”By understanding these patterns in the past, we hope to provide a framework for understanding global change.”

Bridging the gap

The analysis grew out of a series of meetings at the National Evolutionary Synthesis Center in Durham, North Carolina, which is funded by the National Science Foundation. The team agreed on the need to bridge the gap between the fossil record of marine animal extinction and what modern-day biologists are finding as they explore living ocean ecosystems.

The group focused on the past 23 million years when the planet looked largely the same as today: The continents were arranged similarly, and most of the same major taxonomic groups, from whales and seals to clams, snails and sea urchins, existed. However, this time interval encompassed dramatic changes in Earth’s climate. The group determined that patterns of extinction risk were consistent despite this variability — suggesting that the fossil record can provide a valuable pre-human baseline for considering current threats to marine biodiversity.

“Climate change and human activities are impacting groups of animals that have a long history, and studying that history can help us condition our expectations for how they might respond today,” Finnegan said.

Note : The above story is based on materials provided by University of California – Berkeley.

Lack of oxygen in the groundwater

Airports use de-icing agents during the winter. These chemicals have a negative impact on groundwater quality, according to a new study of geoscientists from the Friedrich Schiller University Jena. Credit: Jan-Peter Kasper

Jena (Germany) Spring has arrived in Europe with mild temperatures and sunshine. Where just a few weeks ago the ground was frozen and partly covered in snow and ice, it is now thawing. This doesn’t only have an impact on the flora and fauna. Thawing results in soil and the groundwater at airports being impacted by chemicals, which are contained in melt water. The reason: Airports have to use de-icing agents during the winter, which end up on unpaved areas and infiltrate into the soils during snowmelt.

“Admittedly, airport operators in EU-countries are compelled to sustain a good condition of the groundwater or at least to avoid detrimental concentrations of pollutants in the groundwater,” says PD Dr. Markus Wehrer from the Friedrich Schiller University Jena (Germany). “However, it is common practice that along the runways huge amounts of de-icing fluids infiltrate into the ground,” the Hydrogeologist adds. It does indeed make sense to use the natural self cleaning capacities of the soil. However, the de-icing chemicals have a negative impact on groundwater quality and the functions of the soil. This was shown in a new study of a team of researchers around Prof. Dr. Kai Uwe Totsche at the Jena Chair of Hydrogeology.

In the science magazine “Environmental Science and Pollution Research” the scientists of the University Jena wrote that chemicals like propylene glycol and potassium formate are being degraded by micro-organisms living in the soil and therefore don’t get into the groundwater – at least not straight away (DOI: 10.1007/s11356-014-3506-3). “On the other hand, heavy pollution through these substances leads to a dramatic decrease of oxygen content in soils and groundwater,” Heidi Lissner, the first author of the study explains: This is because the microbes use oxygen to degrade the pollutants. “The more of these substances they have to metabolize, the more oxygen they use for this,” says the geoscientist, who developed the results – which are now published in the study – within the framework of her PhD thesis. As a consequence iron and manganese oxides, which stabilize the intergranular cement of the structure of the soil, dissolve.

For their study the Jena team of researchers analyzed the soil around the airport of the Norwegian capital Oslo. There, every winter about 1,000-1,500 tons of de-icing agents are used. “At the same time, the airport is situated directly next to the largest superficial aquifer in Norway, the Romerike-Aquifer,” explains Dr. Wehrer, who supervised Heidi Lissner’s work together with Prof. Dr. Totsche. The geoscientists took soil core samples close to the runway of the airport and examined them. “We wanted to find out, how the de-icing agents affect the condition of the soil and the percolating water,” Heidi Lissner explains. In order to do so, the young scientist loaded soil cores with water that contained de-icing chemicals and thus simulated a “thawing event”. She collected the seepage water after it passed through the soil cores, followed by an examination for de-icing chemicals as well as the oxygen content and additional parameters.

According to the Jena scientists, their exemplary results can be transferred to the situation at other airports. “Chemicals for de-icing aircrafts as well as runways are used wherever there is snow and ice in winter,” Dr. Wehrer says. He stresses that, additionally, measures to reduce the oxygen content in the soil around airports could be deducted from the new scientific results. Apart from installing specific areas, which allow the thawing water to seep away in a controlled manner, a controlled use of bacteria in the soil, which are specialized in the degradation of these chemicals, is conceivable. This requires an additionally improved oxygen supply in the soil. Also, alternative substances, which can be used for the degradation of pollutants similar to the way in which oxygen works, may be supplied. Moreover, the texture of the soil could be shaped in a way that delays the seepage of the polluted soil water. Through a longer interval, which is then available for the degradation of the substances, a lack of oxygen could be avoided, because atmospheric oxygen is transferred slowly but continuously into the soil.

Reference:
Lissner H. et al. Constraints of propylene glycol degradation at low temperatures and saturated flow conditions. Environ Sci Pollut Res (2015) 22:3158-3174, DOI: 10.1007/s11356-014-3506-3

Note : The above story is based on materials provided by Friedrich-Schiller-Universitaet Jena.

Fossils inform marine conservation

Exposures of Pleistocene sediments containing marine fossils in Jamaica. Data from fossil localities around the globe were analyzed by Finnegan and coauthors in their study of extinction risk in the oceans. Credit: Aaron O’Dea

The fossil record helps to predict which kinds of animals are more likely to go extinct. When combined with information about hotspots of human impacts and climate-change predictions, Smithsonian scientists and colleagues pinpoint animal groups and geographic areas of highest concern for marine conservation in the May 1 issue of Science magazine.

“Just as some groups of people are more prone to health problems like diabetes or heart disease, we can tell from the fossil record which groups of animals are naturally more likely to go extinct,” said Aaron O’Dea, paleontologist at the Smithsonian Tropical Research Institute. “Our calculations suggest that the animal’s geographic range and the group they belong to are the best predictors of extinction risk,” said Carl Simpson, coauthor and post-doctoral researcher at the Smithsonian’s National Museum of Natural History. The study reveals that marine mammals, sharks and corals are animals that have naturally high risks of extinction.

Plotting this data globally, the study suggests that the Tropical West Atlantic and Tropical West Pacific are at potentially greatest risk to naturally high levels of extinction. Unfortunately these areas are also predicted to experience the fastest rates of climate change and greatest future human impact, such as habitat destruction, overfishing and pollution.

“There is a lot to be refined, but life in tropical seas appears to be naturally prone to extinction and is under increasing stress from human activities,” O’Dea said. “It’s a daunting combination that suggests the great diversity of tropical seas might need much greater protection than it has previously received.”

Reference:
Finnegan, S., Anderson, S.C., Harnik, P.G., Simpson, C., Tittensor, D.P., Byrnes, J.E., Finkel, Z.V., Lindberg, D.R., Liow, L.H., Lockwood, R., Lotze, H.K., McClain, C.M., McGuire, J.L., O’Dea, A. and Pandolfi, J.M., 2015. Paleontological baselines for evaluating extinction risk in the modern oceans. Science

Note : The above story is based on materials provided by Smithsonian Tropical Research Institute.

A new dinosaur: Flying without feathers

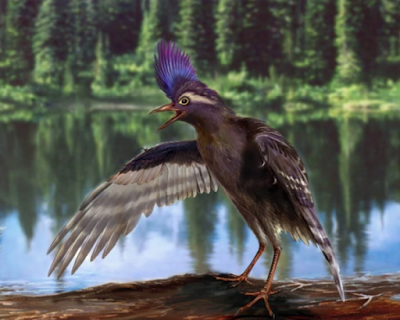
Artist’s impression of the new dinosaur Yi qi. Credit: Dinostar Co. Ltd

The discovery of a pigeon-sized dinosaur with bat-like wings has exposed bizarre twists in the early evolution of birds, said scientists in China Wednesday whose conclusions were immediately challenged.

Named Yi qi, for “Strange Wing” in Mandarin, the creature was an odd and unexpected addition to a long list of failed evolutionary experiments in flight—having sported wings of membrane rather than feathers, they said.

“It is definitely an example showing how much experimentation occurred,” said palaeontologist Xu Xing of the Chinese Academy of Sciences in Beijing, who co-authored a study in the journal Nature.

“Close to the origin of birds (from dinosaurs)… many lineages tried in a different way to get into the air, but finally only one group succeeded.”

Xu and his team described Yi qi as “bizarre” in the title of their study, an unusual adjective in the dry, scientific world of science publishing.

Yi qi was not a direct ancestor of birds, but a close relative from an extinct line.

Bearing the shortest name ever given to a dinosaur, Yi qi belonged to a family of tiny creatures called Scansoriopterygids, which had feathers and exceptionally long finger-like digits that may have been used for climbing trees or catching insects

Known only from fossils found in China, Scansoriopterygids were closely related to primitive bird types like Archaeopteryx, considered a transitional species between non-avian dinosaurs and birds.

But they were not thought to have been fliers. Until now.

Yi qi, the newest addition to the group, weighed about 380 grammes (13.4 ounces) as an adult, and had tiny teeth set in a four centimetre-long (1.6-inch) skull.

It had feathers considered too flimsy to be useful in flight.

But what really sets Yi qi apart is a bony rod, about 13 centimetres (five inches) long, jutting from each wrist.

“To be honest it took a long time for us to figure out” what it was, Xu said in a podcast recorded by Nature.

Then eureka! While never before seen in dinosaurs, the team realised the feature is similar to one sported by modern-day airborne mammals—think bats and flying squirrels.

“We realised that it is a structure very, very important finally for flight,” said Xu.

Sure enough, the team also found remnants of “membranous tissue” preserved with the bones.

‘From strange to bizarre’

Yi qi is known from a sole fossil discovered by a farmer near Beijing in 160-million-year-old rock from the Jurassic period.

Nothing below the ribcage was preserved, so the critter’s pelvis, hind legs and tail had to be surmised from what is known of other Scansoriopterygids.

Not everyone is convinced by the role ascribed to the bony protrusions, each curved at either end.

“Things have just gone from the strange to the bizarre,” University of California biologist Kevin Padian said of the findings in a comment carried by Nature.

“To fly actively, an animal must be able to execute a flight stroke that can generate a vortex wake that propels it forward,” he said.

“No evidence presented so far suggest that Yi qi had this ability,” added Padian, and suggested “we can shelve the possibility that this dinosaur flapped”.

As for gliding, the jury is out, he said, given that little is known of the tiny animal’s posterior, and thus its centre of gravity.

“We are left in a quandary: an animal with a strange structure that looks as if it could have been used in flight, borne by an animal that otherwise shows no such tendencies,” Padian wrote.

For Nature editor Henry Gee, a palaeontologist and evolutionary biologist, a feathered dinosaur with a wing membrane “is not something anyone would ever have expected to find”, adding the paper “will cause a great deal of flap, dare one say.”

Xu insisted the evidence “supports the inference that it is a gliding or flying animal.”

“To be honest, I just couldn’t imagine if this structure were not used in flight what else it could function in,” he said.

“But of course, it is open. I definitely welcome other scientists to do some analyses and have their opinion of this structure.”

Video

Reference:
A bizarre Jurassic maniraptoran theropod with preserved evidence of membranous wings, DOI: 10.1038/nature14423

Note: Note : The above story is based on materials provided by AFP.

Nepal earthquake on the radar

Combining two Sentinel-1A radar scans from 17 and 29 April 2015, this interferogram shows changes on the ground that occurred during the 25 April earthquake that struck Nepal. An overall area of 120×100 km has moved – half of that uplifted and the other half, north of Kathmandu subsided. Vertical accuracy is a few cm. Credit: Copernicus data (2015)/ESA/Norut/PPO.labs/COMET–ESA SEOM INSARAP study

On 25 April, a 7.8-magnitude earthquake struck Nepal, claiming over 5000 lives and affecting millions of people. Satellite images are being used to support emergency aid organisations, while geo-scientists are using satellite measurements to analyse the effects of the earthquake on the land.

Radar imagery from the Sentinel-1A satellite shows that the maximum land deformation is only 17 km from Nepal’s capital, Kathmandu, which explains the extremely high damage experienced in this area.

By combining Sentinel-1A imagery acquired before and after the quake, changes on the ground that occurred between the two acquisition dates lead to rainbow-coloured interference patterns in the combined image, known as an ‘interferogram’, enabling scientists to quantify the ground movement.

Sentinel-1A’s swath width of 250 km over land surfaces has allowed for an unprecedented area size to be analysed from a single scan. The entire area will be covered under the same geometry every 12 days, allowing for the wider region to be regularly monitored and fully analysed for land deformation with the powerful ‘interferometry’ technique.

Products ensuring a full coverage of the affected area prior to the earthquake were available to all scientists under the Copernicus free and open data policy, and will continue to be available.

Sentinel-1A is the first satellite for the Copernicus environment-monitoring programme led by the European Commission. Its all-weather, day-or-night radar imagery is particularly suited to support impact assessment for many types of geohazards. The satellite is planned to provide systematic observations of tectonic and volcanic areas at global level.

Imagery from the Sentinels and other Copernicus contributing missions are coordinated by ESA to be used by the Copernicus Emergency Management Service (EMS), which supports all phases of the emergency management cycle.

The Copernicus EMS was activated on the day the earthquake struck, prompting ESA to begin collecting satellite imagery, which is being made available to support relief efforts.

In parallel, the International Charter Space and Major Disasters was activated by India, China and the UN. Partner Agencies of this initiative have been providing data and products over the area to relief organisations.

Under the Copernicus Emergency Management Service, ESA has been coordinating the collection of optical satellite imagery following the earthquake that struck Nepal on 25 April 2015. The satellite imagery is then used to create maps to support relief efforts, such as this ‘grading map’ of Kathmandu showing topographic features and crisis information. The map is based on imagery from the WorldView-3 satellite acquired on 28 April. Credit: DigitalGlobe/European Commission

Note : The above story is based on materials provided by European Space Agency.

Erosion, landslides and monsoon across the Himalayas

High discharge and suspended sediment concentration during the second highest discharge event of the 2014 monsoon season, in the Kali Gandaki River at Tatopani in Nepal. Credit: Christoff Andermann, GFZ

In these days, it was again tragically demonstrated that the Himalayas are one of the most active geodynamic regions of the world. Landslides belong to the most important geohazards. Besides earthquakes they are triggered mainly by strong rainfall events. A team of scientists from Nepal, Switzerland and Germany was now able to show how erosion processes caused by the monsoon are mirrored in the sediment load of a river crossing the Himalaya.

The geoscientists used data from two stations along the Kali Gandaki, a river that traverses the Himalaya from North to South through the deepest valley on Earth. The Kali Gandaki flows between the peaks of the Annapurna and Dhaulagiri, both reaching above 8000 m in height, and joins the Ganges in India. One of the stations is located at the transition from the Tibetan plateau and the high Himalayas, the other one lies in the middle Himalaya, south of the high peaks.

The size of particles transported transported by the river ranges from fine dust to boulders. Important information about erosion mechanisms in the river catchment can be obtained from these sizes, since they are determined by the rocks that are supplied from hillslopes and moved into the river by landsliding.

“For the first time we were able to obtain a time series of measurements from two different locations along a single river”, says Christoff Andermann from the GFZ German Research Centre for Geosciences. “In this way we can differentiate between sediments: which material came from Tibet and were transported through the Himalaya, and which were produced in the Himalayas themselves?” The key to the answer for these questions lies in the size of the transported particles, the grain size.

Although the Tibetan material always shows the same size, the Himalayan sediment is bigger during the summer monsoon. GFZ scientist Andermann: “The comparison with the timing of landslides shows the relationship between the erosion of the mountains and the monsoon, since most landslides are caused by heavy rain.”

The study raises interesting questions about geo-archives: the erosional history of mountains can be reconstructed from their deposits. However, sediments in the Gulf of Bengal, commonly associated with the Himalaya, contain mainly fine material. The coarse material of the Himalaya seem to have been lost somewhere on the way to the ocean. Thus, the question arises where the sediments in the Gulf of Bengal originated from and what stories they can tell.

Reference:
Martin Struck, Christoff Andermann, Niels Hovius, Oliver Korup, Jens M. Turowski, Raj Bista, Hari P. Pandit and Ranjan K. Dahal: “Monsoonal hillslope processes determine grain size-specific suspended sediment fluxes in a trans-Himalayan river”, Geophysical Research Letters, Vol. 42, Nr. 7, April 2015, pp. 2302-2308 DOI: 10.1002/2015GL063360

Note : The above story is based on materials provided by Helmholtz Association of German Research Centres.

Building Better Skull Models For Ancient Carnivores

This image shows the skulls of the different species the researchers studied along with biomechanical profiles, which were made by mapping each animal’s bite force against skull stiffness. They found that ancestry has a strong influence on the models, with closely related animals like leopards and mongooses grouping together, but also that predications about diet can be made based on the shape of the individual biomechanical profiles. Credit: Copyright AMNH/Z.-J. Tseng

When paleontologists put together a life history for a long-extinct animal, they try to understand its diet by looking at modern animals with similar skull shapes and tooth patterns. But this practice is far from foolproof. New modeling and tests based on living species conducted by scientists at the American Museum of Natural History show that the link between animal diets and skull biomechanics is complex, with a stronger influence from ancestry than previously thought.

“Traditionally, when we looked at a fossilized skull with pointy piercing teeth and sharp slicing blades, we assumed that it was primarily a meat eater, but that simplistic line of thinking doesn’t always hold true,” said John J. Flynn, the Museum’s Frick Curator of Fossil Mammals and a co-author on the new work published today in the journal PLOS ONE. “We’ve found that diet can be linked to a number of factors—skull size, biomechanical attributes, and often, most importantly, the species’ position in the tree of life.”

Dr. Flynn and Z. Jack Tseng, a National Science Foundation and Frick Postdoctoral Fellow in the Museum’s Division of Paleontology, looked at the relationship between skull shape and function of five different modern carnivore species: “hypercarnivores” like wolves and leopards whose diet is more than 70 percent meat and more omnivorous “generalists” such as mongooses, skunks, and raccoons. The initial modeling, which mapped bite force against the stiffness of the animal’s skull, yielded a surprise.

“Animals with the same diets and biomechanical demands, like wolves and leopards—both hypercarnivores—were not linking together,” Dr. Tseng said. “Instead, we saw a strong signal driven mostly by ancestry, where, for example, the leopard and the mongoose bind together because they’re more closely related in an evolutionary context, although they have very different dietary preferences and feeding strategies.”

But once Tseng and Flynn accounted for the strong effects of ancestry and skull size on the models, hypercarnivores and generalists still could be distinguished based on biomechanics, in particular by looking at where along the tooth row the skull is strongest. The skulls of heavy meat eaters tend to be stiff near the front teeth for hunting, and the back teeth for crushing bones and slicing meat. In contrast, generalist skulls get slightly stiffer from the front row of teeth to the back row.

With an improved shape-function computer model in hand, Flynn and Tseng applied the research to a pair of extinct species: Thinocyon velox, a predatory mammal that was part of the now-extinct Creodont group, and Oodectes herpestoides, an early fossil predecessor of modern carnivores. The results suggested that T. velox likely had a unique hypercarnivorous feeding style that emphasized prey capture with its front teeth and powerful slicing and crushing with its back teeth, while O. herpestoides was a generalist.

“Beyond feeding adaptations of extinct species, we also want to decipher how adaptations evolved using reconstructed ancestors of living and fossil forms,” Tseng said. “We are applying similar types of skull shape and biomechanical analyses to reconstructed hypothetical ancestor skulls of Carnivora and their relatives to map out and better understand the long history of feeding adaptation of living top predators.”

Reference:
Zhijie Jack Tseng , John J. Flynn. Are Cranial Biomechanical Simulation Data Linked to Known Diets in Extant Taxa? A Method for Applying Diet-Biomechanics Linkage Models to Infer Feeding Capability of Extinct Species. PLoS One, 2015 DOI: 10.1371/journal.pone.0124020

Note: The above story is based on materials provided by American Museum of Natural History.

Research team discovers plant fossils previously unknown to Antarctica

Erik Gulbranson, a visiting professor at the University of Wisconsin-Milwaukee, working in the Antarctic. Credit: Peter Rejcek, NSF

Erik Gulbranson, a visiting professor at the University of Wisconsin-Milwaukee, trudges up a steep ridge overlooking his field camp of mountain tents and pyramid-shaped Scott tents in Antarctica’s McMurdo Dry Valleys. A brief hike nearly to the top of a shorter ridge ends at the quarry, where picks and hammers have chopped out a ledge of sorts in the slate-grey hillside.

Sometime about 220 million years ago, a meandering stream flowed here and plants grew along its banks. Something, as yet unknown, caused sediment to flood the area rapidly, which helped preserve the plants. Gulbranson splits open a grey slab of siltstone in the quarry to reveal amazingly well-preserved Triassic plant fossils, as if the leaves and stems had been freshly pressed into the rock only yesterday.

“It’s a mixture of plants that don’t exist anymore,” he says, “but we have some plants in these fossil ecosystems that we might know today, like ginkgo.”

On the one end are fossils from an extinct genus of fork-leaved seed ferns called Dicroidium that dominated during the Triassic, a geologic period that lasted from about 252 to 200 million years ago. Other plants frozen in time on this remote hillside include species in the extant cycad family, which today favor subtropical and tropical climates.

Even better are the fossilized specimens no one can yet identify.

“They’re brand new to Antarctica,” said Gulbranson, who is co-principal investigator on a project investigating the evolution of ancient plants in Antarctica and the high-latitude environments in which they grew.

Also new to Antarctica: A Triassic-age fossil forest of 37 tree stumps, located less than a couple of kilometers almost directly south from the quarry. These were discovered about a week after Gulbranson and a team of paleontology experts in plants, fungi and other areas arrived at Allan Hills by helicopter and Twin Otter aircraft.

It is only the second fossil forest from the Triassic ever found in Antarctica. It’s about a third the size of a site in Gordon Valley near the Beardmore Glacier in the Transantarctic Mountains. The Gordon Valley fossil forest, discovered in 2003, contains 99 preserved seed-fern tree trunks. The trees are estimated to have grown about 20 meters in height along what were likely the banks of an ancient river system.

The newly discovered Allan Hills fossil forest, at the base of the 1,800-meter-high Roscolyn Tor, represents the second largest fossil forest in Antarctica, according to Gulbranson. About a dozen fossil forests have been found from an even earlier time period called the Permian, which extends roughly between 298 and 252 million years ago.

“It’s an important find,” said Gulbranson, whose expertise as a sedimentologist and geochemist allows him to reconstruct the environment that existed when these trees, shrubs and forests flourished. He does this by using various techniques, including grinding down small samples of the fossil growth rings to see variations in how the ancient flora once grew.

Video

Paleobotanists discover new plant fossils in Antarctica.
Credit: Peter Rejcek and Ralph Maestas/NSF

Note : The above story is based on materials provided by National Science Foundation.

How earthquake safety measures could have saved thousands of lives in Nepal

Poorly built houses were destroyed in the Credit: Domenico/flickr, CC BY-SA

Earthquake engineers often say earthquakes don’t kill people, collapsing buildings do. The tragic loss of life that followed the huge earthquake in Nepal on April 25 occurred despite the fact that the country is among the world’s leaders in community-based efforts to reduce disaster risk. But poverty, corruption, and poor governance have all led to a failure to enforce building codes – as has a shortage of skilled engineers, planners and architects.

Sadly the country was on its way to deploying knowledge and skills to tackle its long-term vulnerability just as the ground shook.

So why aren’t more buildings designed to withstand shaking – even extreme shaking.

To keep buildings standing, it is essential to have adequate building and planning codes, as well as proper training and certification for professionals such as engineers, architects, and planners. But having certification and codes on paper does not ensure implementation or compliance. Nepal does, after all, have some of these things. Laws and regulations must also be monitored and enforced. That is not easy in a country such as Nepal, which has isolated villages, a history of conflict and many governance difficulties.

Vast vulnerability

Financial as well as social resources are needed to set up earthquake resistant buildings. Governments at all levels need to be functioning and competent in order to engage with processes such as urban planning and earthquake-resistant construction. Citizens must trust and have the opportunity to work with their governments, including the law enforcement and judicial sectors.

It’s not just about buildings. Many non-structural measures are needed to ensure survivability in earthquakes. Appliances such as televisions, microwaves, hot water boilers, and refrigerators (which do not always exist in Nepalese homes) must be securely fastened to the floors and the walls. Otherwise, they move and topple, killing as readily as building collapse. Even in affluent earthquake-prone locations such as New Zealand and California, we see shockingly low rates of households enacting these basic measures.

But Nepal is not New Zealand or California. It has been wracked by conflict and troubled by unstable governments, not to mention the governance issues caused by being sandwiched between China and India. It has long had high poverty and low formal education rates.

Despite recent improvements, Nepal still lags behind other countries when it comes to human development and it is still seen as highly corrupt. It also scores badly on child health and gender equality measurements.

When families struggle daily for enough food to keep their children healthy, they are not likely to spend time thinking about making their home earthquake resistant.

And when children are malnourished and stunted, they perform worse in school. That leads to long-term education inadequacies that prevent them from developing into adults with the skills to lobby for adequate and enforced building codes. What’s more, when women lack the same opportunities as men, half the population is excluded from demanding and enacting good governance.

All these factors contribute to the country’s vulnerability. All these factors have led to housing and infrastructure prone to collapse in an earthquake.

Rebuilding a nation

None of these things can be solved overnight. Tackling vulnerability is a long-term process, yet earthquakes strike and bring down buildings in seconds and minutes.

As the earthquake struck, Nepalese people were working hard to overcome these vulnerability conditions. My friends and colleagues from the country have taught me plenty about retrofitting buildings and constructing earthquake-resistant homes.

They travelled to communities with small shake tables, which are used to simulate earthquakes by shaking model houses or building components, showing the difference between an earthquake-resistant house and a non-earthquake resistant house. They made many schools safe. They taught school children and their parents about earthquake-safe behaviour.

These efforts saved hundreds of lives, if not more, during the recent tremors. With a few more decades, a mere instant in geological time, they could have made Nepal comparatively safe from earthquake disasters despite earthquakes. In that time, so many more buildings would have been retrofitted, we might have had adequate building code enforcement, and most importantly, an earthquake-educated and vulnerability-educated generation would have started to take power.

Nepal must now continue these efforts in order to avoid similar future devastation. We can be optimistic. Education is happening – for boys and girls. Women are increasingly being given equal opportunities as men. This means the Nepalese people are taking charge of their own health, their own environment, and their own sustainability. That is vulnerability reduction over the long-term.

Note : The above story is based on materials provided by The Conversation.
This story is published courtesy of The Conversation (under Creative Commons-Attribution/No derivatives).

Rare whale fossil found in Panama clarifies evolution of sperm whale

This is the evolutionary tree of sperm whales, showing the relationships of extinct and living species, and when reduction of the spermaceti organ took place. Credit: Natural History Museum of Los Angeles County

Almost since the time of Melville’s epic hunt, scientists have been fascinated by the remarkable attributes of the sperm whale and its kin, the smaller pigmy and dwarf whales. Capable of diving to great depths and gifted with an acute sense of echolocation, these animals have remained inseparable from maritime lore.
An international team of scientists, led by the Natural History Museum of Los Angeles County’s Curator of Marine Mammals Dr. Jorge Velez-Juarbe, has discovered a new species of an extinct pigmy sperm whale from Panama that clarifies key aspects of the evolution of these magnificent animals. The report published in the journal PLOS ONE  reveals an unexpected level of complexity in the evolution of the spermaceti of these whales, an organ located within the head that plays a key role in the generation of sound and in the whale’s capacity for echolocation.

Whales, dolphins, and porpoises have a long fossil record, which documents the evolutionary journey from terrestrial ancestors to the fully marine organisms of today. Such a record has enabled scientists to better understand how changes in climate and continental distribution have transformed the marine ecosystems and the diversity life forms that they host. Yet, the poor fossil record of the smaller relatives of the well-known sperm whale, the 8- to 12-foot-long pigmy and dwarf sperm whales, has limited our understanding of the evolution of these mysterious animals.

Discovered and studied by a team of scientists from the NHM, Iowa State University, and the Smithsonian Tropical Research Institute, the new Panamanian fossil whale affords fresh evidence to this old problem.

“The new discovery gives us a better understanding of the ancient distribution of these poorly known relatives of the sperm whale,” said Dr. Velez-Juarbe. “Previously we knew of similarly-aged pigmy and dwarf whales from Baja California and Peru, but this new fossil fills in an important geographic gap in the group’s ancient distribution.”

The new whale species, named Nanokogia isthmia after the Isthmus of Panama, is known from the well-preserved skulls of two individuals, which remains were unearthed at a sea cliff along the Caribbean coast of Panama and from rock layers dated to about 7 million years ago. “Our study is part of a larger scientific effort aimed at understanding the changes in the marine habitats that resulted from the complete closure of the Isthmus of Panama,” said Dr. Velez-Juarbe, referring to the separation between the eastern Pacific Ocean and the Caribbean Sea that took place sometime within the last 10 million years.

These rare fossils are among a handful other fossil whales known from Panama, where fossil hunting is often difficult due to the dense vegetation and thick soils that often covers the surface. Resurrected from their million-year-old entombment, the new fossils tell us that the evolution of characteristics related to sound emission and echolocation was far more complex than previously envisioned. The new study shows that at one time, these small sperm whales had a much larger spermaceti organ, which got downsized at least twice during the evolutionary history of these animals (including the evolutionary event that gave origin to the living pigmy and dwarf sperm whales). The reasons of this size reduction remain unclear; scientists would have to find more complete skeletons of Nanokogia and other closely related species to untangle the question. For now, Dr. Velez-Juarbe continues to explore the prehistoric seas of Central America–Captain Ahab would have been proud.

Reference:
Jorge Velez-Juarbe , Aaron R. Wood, Carlos De Gracia, Austin J. W. Hendy. Evolutionary Patterns among Living and Fossil Kogiid Sperm Whales: Evidence from the Neogene of Central America. PLoS One, 2015 DOI: 10.1371/journal.pone.0123909

Note: The above story is based on materials provided by Natural History Museum of Los Angeles County.

How cracking explains underwater volcanoes and the Hawaiian bend

Na Pali Coast on Kauai island (stock image). It has long been accepted that as Earth’s plates move over fixed hot spots in its underlying mantle, resulting eruptions create chains of now extinct underwater volcanoes or ‘seamounts’. One of the most famous is the Hawaiian-Emperor chain in the northern Pacific Ocean. The seamounts of that chain are composed mainly of ocean island basalts — the type of lava that erupts above hot spots. Credit: © SergiyN / Fotolia

University of Sydney geoscientists have helped prove that some of the ocean’s underwater volcanoes did not erupt from hot spots in Earth’s mantle but instead formed from cracks or fractures in the oceanic crust.

The discovery helps explain the spectacular bend in the famous underwater range, the Hawaiian-Emperor seamount chain, where the bottom half kinks at a sixty degree angle to the east of its top half.

“There has been speculation among geoscientists for decades that some underwater volcanoes form because of fracturing,” said Professor Dietmar Muller, from the University of Sydney’s School of Geosciences in Australia and an author on the research findings published in Nature Geoscience.

“But this is the first comprehensive analysis of the rocks that form in this setting that confirms their origins.”

It has long been accepted that as Earth’s plates move over fixed hot spots in its underlying mantle, resulting eruptions create chains of now extinct underwater volcanoes or ‘seamounts’.

One of the most famous is the Hawaiian-Emperor chain in the northern Pacific Ocean. The seamounts of that chain are composed mainly of ocean island basalts — the type of lava that erupts above hot spots.

But north of the Hawaiian chain, in a formation called the Musicians Ridge, researchers found samples from seamounts that were not made up of the ocean island basalts you would expect from plates moving over a hot spot.

“The oldest part of the Musicians Ridge formed approximately 90 million years ago from hot spots but these new samples are only about 50 million years old and have a different geochemistry,” said Professor Muller.

“They did not form because of a hot spot but because of plates cracking open at their weakest point, allowing new magma to rise to the seabed and restart the formation of underwater volcanoes. They are near extinct hot spot volcanoes because that hot spot action millions of years earlier helped weaken the crust (the layer directly above the mantle) where new volcanoes now form.”

Vulnerable spots in Earth’s plates crack when they are stressed, in this case due to movement of the Pacific Plate which started to dive or submerge back into Earth’s crust at its northern and western edges around 50 million years ago.

The formation of these younger seamounts caused by the deformation of the Pacific Plate at its margins suggests a link to the unique bend in the Hawaiian-Emperor chain.

“We believe tectonic changes along the margins of the Pacific Plate around 50 million years ago put the weakest points of the Pacific Ocean crust under tension and created the youngest Musicians Ridge seamounts,” said Professor Muller.

“It also caused the flow in the slowly convecting mantle under the Pacific to change dramatically, to the point that the Hawaiian hot spot in Earth’s mantle changed its position.

“The resulting seamounts along the Hawaii-Emperor chain changed their position accordingly and the bend was born.”

This work provides a solid foundation for understanding other ‘non-hot spot’ volcanism seen elsewhere, for example the Puka Puka Ridge in the South Pacific.

Reference:
John M. O’Connor, Kaj Hoernle, R. Dietmar Müller, Jason P. Morgan, Nathaniel P. Butterworth, Folkmar Hauff, David T. Sandwell, Wilfried Jokat, Jan R. Wijbrans, Peter Stoffers. Deformation-related volcanism in the Pacific Ocean linked to the Hawaiian–Emperor bend. Nature Geoscience, 2015; DOI: 10.1038/ngeo2416

Note: The above story is based on materials provided by University of Sydney.

Perspectives on the Nepal earthquake

Preliminary landslide susceptibility map created by Dr Tom Robinson (University of Canterbury). Susceptibility ranges from 0 to 1 with higher numbers indicating a greater chance of landslides occurring. Earthquake epicentre shown with a star. Langtang Valley is circled.

As the death toll continues to rise in Nepal, Senior Lecturer Dr Ian Willis, and PhD student Evan Miles, from the Scott Polar Research Institute contemplate the fate of people in a remote part of the country, where they have been doing research for the past two years.

As many agencies are now reporting, the death toll associated with the 7.9 magnitude earthquake that hit Nepal on Saturday is likely to rise considerably over the coming days and weeks. On Tuesday it stands at over 4,000 but the Nepalese Prime Minister, Sushil Koirala, announced that it might reach 10,000. The UN declared that 8 million people have been affected, with 1.4 million people urgently needing aid.

The full scale of the damage will become clear as contact is made with remote settlements away from the capital, which are now largely cut off from communication and supply. In Kathmandu and other urban centres, the greatest cause of injury and death was collapsing buildings.

But in more isolated, mountainous regions, further problems arose from the shaking ground triggering a range of natural hazards. One such region is the Langtang Valley, 60km north of Kathmandu, where we have been doing research for the last two years.

A recent analysis shows the entire valley would have been particularly susceptible to landslides following the earthquake due to its proximity to the epicentre and the topography of the mountain slopes there.

We are exceptionally fortunate not to have been in the area when the earthquake struck. We were in Kathmandu for an International Glaciology Society Symposium in early March.

One of us (Ian Willis) stayed on to do glaciological fieldwork with two other scientists from Cambridge (Dr Hamish Pritchard and PhD student Mike McCarthy) towards the top of the Langtang Valley, returning very recently.

In fact Hamish Pritchard is still in Kathmandu, safe and now helping the UN effort.

The other of us (Evan Miles) was due to fly to Nepal on Sunday and walk to the head of the Langtang Valley this week, but of course his trip was cancelled.

For the past two years, we have been working there with science colleagues from Switzerland, Netherlands and Nepal and aided by a professional Nepali team of guides, porters and cooks.

The overall aim of the research project has been to better understand the climate of the region, and to investigate how the changing climate is affecting the glaciers and the discharge of water in the streams.

This is of huge societal importance, as the people of the valley rely on ground and stream water for their livelihoods – drinking, washing and irrigating crops.

In addition, a small hydro-electric plant was due to be built later this year at the uppermost village in the valley, Kyanjin Gompa, but this will presumably now be put on hold.

Our specific work focuses on improving knowledge about the glaciers of the region. And it is while undertaking our research that we have come to appreciate many of the natural hazards that occur in the area.

Many of the glaciers in Nepal and elsewhere across High Mountain Asia are covered by debris, which may inhibit the rate of ice melting underneath.

The debris gets onto the glaciers through rockfalls, debris avalanches and mudflows. These are continuous processes, but would have been orders of magnitude more severe during the recent earthquake than anything we ever saw.

Many of the glaciers across the Himalaya and surrounding mountains are nourished by snow avalanches.

Again, these occur regularly (we have both been caught in snow avalanches sweeping down the glacier we work on) but the energy they contain is typically dissipated by the time they reach the valley bottoms.

As the recent footage from the Everest region shows, however, snow avalanches can be particularly large and devastating when triggered by an earthquake.

Finally, many glaciers in the region are associated with lakes – these form on the glacier surface where they are dammed by ice, or in front of the glacier where they are blocked by moraines (large ridges of sediment ‘bulldozed’ by a formerly more extensive glacier).

The rapid draining of such lakes provides another hazard, causing floods or mudflows to downstream regions. Again, the flooding and mudflows associated with lake dams rupturing is likely to have had a significant impact during the recent earthquake.

Our field research is on hold at present while we wait to hear the fate of the people of the Langtang Valley and other remote regions of Nepal. But initial reports from Langtang sound very bleak. Eye witness accounts state “From where we were, there was nothing you could see. All the villages were gone,” and “the whole valley has been destroyed”.

Helicopter-based photographs seem to confirm that Langtang village has been wiped out by a large landslide. We are busy scouring satellite data to identify zones of the worst impact, but Nepal has been shrouded in heavy clouds and rain since the earthquake inhibiting our efforts.

DEC Nepal Earthquake Appeal

Video

Note : The above story is based on materials provided by University of Cambridge.

Landslides, mudslides likely to remain a significant threat in Nepal for months

Map of landslide and landslide dam hazard potential. Credit: Marin Clark, Nathan Niemi and Sean Gallen

The threat of landslides and mudslides remains high across much of Nepal’s high country, and the risk is likely to increase when the monsoon rains arrive this summer, according to a University of Michigan researcher.

U-M geomorphologist Marin Clark and two colleagues have assessed the landslide hazard in Nepal following Saturday’s magnitude-7.8 earthquake. They looked for locations where landslides likely occurred during the earthquake, as well as places that are at high risk in the coming weeks and months.

The analysis revealed tens of thousands of locations at high risk, Clark said.

“The majority of them, we expect, have already happened and came down all at once with the shaking on Saturday,” she said. “But there will still be slopes that have not yet failed but were weakened. So there will be a continued risk during aftershocks and with the recent rainfall, and again when the monsoon rains arrive this summer.”

Information from the U-M-led study has been shared with the U.S Geological Survey, NASA, the U.S. Agency for International Development and other responding agencies. It is being used help prioritize both satellite observations and the analysis of data from those satellites, said Clark, an associate professor in the U-M Department of Earth and Environmental Sciences.

“The satellites looked first at places where lots of people live, including Kathmandu and the foothills areas to the south,” Clark said. “Those areas do not look significantly impacted by landsliding, but we’re worried about the high country,” she said.

The region at highest risk for landslides and mudslides is the mountainous area along the Nepal-Tibet border, north of Kathmandu and west of Mount Everest, directly above the fault rupture. The highest-risk zone is at elevations above 8,200 feet in a region that covers 17,550 square miles, which is roughly twice the size of Massachusetts.

Cloud cover has blocked observation of much of that region since Saturday’s earthquake. But news stories and social media reports of landslides in Nepal’s Gorka District and Langtang Valley are consistent with the Clark team’s assessment, which showed that those areas are at high risk, she said.

Remote villages are scattered throughout the high-risk zone, which also contains the main highway that connects Kathmandu and Tibet. The area is popular with trekkers and mountaineers, as well.

“Many small Nepalese villages throughout this region have likely been cut off from the rescue operation,” Clark said. “This is also high season for trekking and mountaineering, so I expect there are a large number of foreign tourists there, as well.”

The Clark team’s assessment of the landslide risk was based on a computer analysis that looked at earthquake shaking, slope steepness and the strength of various rock types.

Their initial analysis was completed Saturday afternoon and was shared with the U.S. Geological Survey and other agencies on Saturday evening. It was revised Sunday morning and distributed through the National Earthquake Hazards Reduction Program on Sunday afternoon.

More than 200,000 landslides occurred following a magnitude-7.9 earthquake in a mountainous region of Sichuan Province, China, in 2008, according to Clark. Many of those landslides blocked roads, which slowed response and recovery efforts. The final death toll for that quake was about 70,000.

Landsliding is a general term for slowly to very rapidly descending rock and debris. A mudslide or mudflow is a fluid mix of mud and debris that moves down a slope.

Landslides in mountainous regions can also block river valleys, creating a significant flooding hazard. Water builds up behind those dam-like structures, creating the potential for catastrophic flooding if the dams are overtopped and then fail.

“With the satellite images, we’ll be looking first at the highest-risk landslide areas that are close to big rivers,” Clark said. “Those locations are high priorities.”

Clark’s collaborators on the landslide hazard assessment are U-M’s Nathan Niemi and Sean Gallen, a former U-M postdoctoral researcher under Clark who recently accepted a position at ETH Zurich in Switzerland.

Note: The above story is based on materials provided by University of Michigan.

Engineering a better future for the Mississippi Delta

This image shows Mississippi River Delta, 2001. Credit: Image courtesy NASA

River deltas, low-lying landforms that host critical and diverse ecosystems as well as high concentrations of human population, face an uncertain future. Even as some deltas experience decreased sediment supply from damming, others will see increased sediment discharge from land-use changes. Accurate estimates of the current rate of subsidence in the Mississippi Delta (southern USA) are important for planning wetland restoration and predictions of storm surge flooding.
Parts of coastal Louisiana (southern USA) are undergoing accelerated land loss due to the combined effects of sea-level rise and land subsidence. In the Mississippi Delta, where rates of land loss are especially severe, subsidence of the land surface reflects natural processes, such as sediment compaction and crustal loading, but this is exacerbated by anthropogenic withdrawal of fluids (water, oil, natural gas).

In this study for Geology, Makan Karegar and colleagues use precise Global Positioning System (GPS) data to measure subsidence rates of the Mississippi Delta. They also use tide gauge records to better understand the relationship between subsidence and sea-level rise in southern Louisiana.

The authors show that while the majority of the delta is relatively stable, parts of the delta may not be viable in the long term. The southern portion of the delta continues to experience high rates of subsidence (5 to 6 mm per year). The current rate of relative sea-level rise (the combined effect of land subsidence and sea-level rise) along parts of the coastal delta is nearly 8 to 9 mm per year.

Given stable sea level and sediment deposition, a delta will tend toward an equilibrium state where subsidence is more or less balanced by sediment deposition. In the Mississippi River system, however, a series of dams on various upstream tributaries have reduced sediment supply to the delta, while levees on the lower part of the river have artificially channelized the flow, forcing sediments to be deposited beyond the delta in the deeper Gulf of Mexico.

The data presented by Karegar and colleagues have implications for land reclamation and wetland restoration in the region. Mitigation efforts may include river diversion to encourage resedimentation, and pumping of offshore sands to restore barrier islands.

Reference:
M. A. Karegar, T. H. Dixon, R. Malservisi. A three-dimensional surface velocity field for the Mississippi Delta: Implications for coastal restoration and flood potential. Geology, 2015; DOI: 10.1130/G36598.1

Note: The above story is based on materials provided by Geological Society of America.

DNA suggests all early eskimos migrated from Alaska’s North Slope

Landsat 7 false-color image of the North Slope. Credit: NASA

Genetic testing of Iñupiat people currently living in Alaska’s North Slope is helping Northwestern University scientists fill in the blanks on questions about the migration patterns and ancestral pool of the people who populated the North American Arctic over the last 5,000 years.

“This is the first evidence that genetically ties all of the Iñupiat and Inuit populations from Alaska, Canada and Greenland back to the Alaskan North Slope,” said Northwestern’s M. Geoffrey Hayes, senior author of the new study to be published April 29, 2015, in the American Journal of Physical Anthropology.

In this study, all mitochondrial DNA haplogroups previously found in the ancient remains of Neo- and Paleo-Eskimos and living Inuit peoples from across the North American Arctic were found within the people living in North Slope villages.

These findings support the archaeological model that the “peopling of the eastern Arctic” began in the North Slope, in an eastward migration from Alaska to Greenland. It also provides new evidence to support the hypothesis that there were two major migrations to the east from the North Slope at two different times in history.

“There has never been a clear biological link found in the DNA of the Paleo-Eskimos, the first people to spread from Alaska into the eastern North American arctic, and the DNA of Neo-Eskimos, a more technologically sophisticated group that later spread very quickly from Alaska and the Bering Strait region to Greenland and seemed to replace the Paleo-Eskimo,” Hayes said.

“Our study suggests that the Alaskan North Slope serves as the homeland for both of those groups, during two different migrations. We found DNA haplogroups of both ancient Paleo-Eskimos and Neo-Eskimos in Iñupiat people living in the North Slope today.”

Hayes is an assistant professor of endocrinology at Northwestern University Feinberg School of Medicine and an assistant professor of anthropology at Northwestern’s Weinberg College of Arts and Sciences. He has been studying population genetics of the Arctic for more than a decade.

At the request of Iñupiat elders from Barrow, Alaska, who are interested in using scientific methods to learn more about the history of their people, Hayes and a team of scientists extracted DNA from saliva samples given by 151 volunteers living in eight different North Slope communities. This is the first genetic study of modern-day Iñupiat people.

For this paper, the scientists sequenced and analyzed only mitochondrial DNA. Mitochondrial DNA is passed down from mother to child, with few changes from generation to generation.

Ninety-eight percent of the maternal linages in this group were of Arctic descent. The scientists found all known Arctic-specific haplogroups present in these North Slope communities. The haplogroups are: A2a, A2b, D4b1a and D2.

D2 is the known haplogroup of ancient Paleo-Eskimos. Until this study D2 had only been found in the remains of ancient Paleo-Eskimos.

D4b1a is a known haplogroup of the ancient Neo-Eskimos, the much more technologically sophisticated group that came after the Paleo-Eskimos and seemed to replace them and populate a large part of the Arctic in a short amount of time.

“We think the presence of these two haplotypes in villages of the North Slope means that the Paleo-Eskimos and the Neo-Eskimos were both ancestors of the contemporary Iñupiat people,” said Jennifer A. Raff, first author of the study and a post-doctoral fellow in Hayes’ lab at the Feinberg School when the research was being done. “We will be exploring these connections in the future with additional genetic markers.”

Another haplogroup that surfaced in this study was C4. This is typically only seen in Native Americans much farther south. Its geographic distribution suggests that it might have been one of the haplogroups carried by the earliest peoples to enter the Americas. The researchers think it could be seen in the North Slope because of recent marriages between Athapascan and Iñupiat families or because it is a remnant of a much more ancient contact between these groups.

One more surprise in this study was evidence there may have been some migrations of Greenlandic Inuit back to the Alaska North Slope. The scientists plan to explore this in the future with additional genetic markers, too.

This work is part of the Genetics of the Alaskan North Slope project, funded by a grant from the National Science Foundation’s Office of Polar Programs. The goal of the project is to reconstruct the human genetic history along the North Slope. The scientists hope the project will be a model for research partnerships between geneticists and indigenous peoples.

While this study revealed exciting new evidence about the history and prehistory of Iñupiat women, it also confirms local history about the close-knit ties of the North Slope villages.

“We found that there were many lineages shared between villages along the coast, suggesting that women traveled frequently between these communities,” Hayes said. “In fact, when we compared the genetic composition of all the communities in the North Slope, we found that they were all so closely related that they could be considered one single population. This fits well with what the elders and other community members have told us about Iñupiat history.”

Future work will analyze genetic markers on the Y-chromosomes from men in the North Slope, taking a closer look at the population history of men, as well as how contact with outsiders in the 19th century affected the Iñupiat peoples.

Note : The above story is based on materials provided by Northwestern University.

Ancient connection between the Americas enhanced extreme biodiversity

Scientists think that salamanders from North America arrived in South America before the accepted date for the closure of the Isthmian land bridge 3 million years ago, supporting Bacon et al’s assertion that the Isthmus closed at an earlier date. Credit: STRI Archives

Species exchange between North and South America created one of the most biologically diverse regions on Earth. A new study by Smithsonian scientists and colleagues published this week in the Proceedings of the National Academy of Sciences shows that species migrations across the Isthmus of Panama began about 20 million years ago, some six times earlier than commonly assumed. These biological results corroborate advances in geology, rejecting the long-held assumption that the Isthmus is only about 3 million years old.
“Even organisms that need very specific conditions to survive, such as salamanders and freshwater fishes, crossed the Isthmus of Panama over 6 million years ago,” said lead author, Christine Bacon, former post-doctoral fellow in staff scientist Carlos Jaramillo’s group at the Smithsonian Tropical Research Institute. “These early migrations impact our understanding of how and when biodiversity in the Americas took shape.”

The Isthmus of Panama, which links North and South America, plays a crucial role in the planet’s atmospheric and oceanic circulation, climate and biodiversity. Despite its importance across multiple disciplines, the timing of the formation and emergence of the Isthmus and the effect it had on those continents’ biodiversity is controversial.

In the new study, Bacon, now at the University of Gothenburg in Sweden, examines a large number of molecular studies and fossils, including land and aquatic organisms.

Models based on molecular genetic data indicate that rather than one great migration following a set closure time, there were several periods in which animals and plants moved across the intercontinental land bridge. There are shifts in the rate of movement of animal fossils moving from North America to South America at 23 million and within the past 10 million years.

Authors also compare the proportion of immigrants in each direction to sea level and global mean temperature, showing that migrations may have coincided with low sea levels.

A known date for the rise of the Isthmus is important to evolutionary biologists who want to understand how species of marine organisms diverged and when species of terrestrial organisms moved from one continent to another. The date is also critical in understanding ancient climate change patterns. The 3 million year date was established by the Panama Paleontology Project, headed by Jeremy Jackson and Anthony Coates, also at the Smithsonian Tropical Research Institute.

Reference:
Bacon, C.D., D. Silvestro, C.A. Jaramillo, B. Tilston Smith, P. Chakrabarty, A. Antonelli. Biological evidence shows earlier emergence of the Isthmus of Panama. PNAS, 2015 DOI: 10.1073/pnas.1423853112

Note: The above story is based on materials provided by Smithsonian Tropical Research Institute.

Researchers find evidence of groundwater in Antarctica’s Dry Valleys

A helicopter flies the AEM sensor over Blood Falls and the Taylor Glacier, Antarctica Photo credit: L. Jansan

Using a novel, helicopter-borne sensor to penetrate below the surface of large swathes of terrain, a team of researchers supported by the National Science Foundation, or NSF, has gathered compelling evidence that beneath the Antarctica ice-free McMurdo Dry Valleys lies a salty aquifer that may support previously unknown microbial ecosystems and retain evidence of ancient climate change.

The team, which includes LSU hydrogeologist Peter Doran and researchers from the University of Tennessee; University of California-Santa Cruz; Dartmouth College; University of Illinois at Chicago; University of Wisconsin; Aarhus University in Denmark; and Sorbonne Universités, UPMC University in France, found that brines, or salty water, form extensive aquifers below glaciers, lakes and within permanently frozen soils. Their discovery will be featured in the April 28 edition of the open-access journal Nature Communications.

“These unfrozen materials appear to be relics of past surface ecosystems, and our findings provide compelling evidence that they now provide deep subsurface habitats for microbial life despite extreme environmental conditions,” said the study’s lead author Jill Mikucki, an assistant professor of microbiology at the University of Tennessee Knoxville. “We believe the application of novel below-ground visualization technologies can not only reveal hidden microbial habitats, but can also provide insight on glacial dynamics and how Antarctica responds to climate change.”

In addition to providing answers about the biological adaptations of previously unknown ecosystems that persist in the extreme cold and dark of the Antarctic winter, the new information could also help scientists understand whether similar conditions might exist elsewhere in the solar system, specifically beneath the surface of Mars, which has many similarities to the dry valleys.

“Over billions of years of evolution, microbes seem to have adapted to conditions in almost all surface and near-surface environments on Earth. Tiny pore spaces filled with hyper-saline brine staying liquid down to -15 Celsius, or 5 degrees Fahrenheit, may pose one of the greatest challenges to microbes,” said Slawek Tulacyzk, a glaciologist and coauthor at the University of California, Santa Cruz. “Our electromagnetic data indicates that margins of Antarctica may shelter a vast microbial habitat, in which limits of life are tested by difficult physical and chemical conditions.”

The team also found evidence that brines flow towards the Antarctic coast from roughly 11 miles inland, eventually discharging into the Southern Ocean. It is possible that nutrients from microbial weathering in these deep brines are released, effecting near-shore biological productivity. However, the vast majority of Antarctica’s coastal margins remain unexplored. This new survey highlights the importance of these sensitive interfaces.

The Division of Polar Programs in NSF’s Geoscience’s Directorate supported the AEM sensor project through a collaborative award to Mikucki, Tulacyzk and Ross Virginia, a biogeochemist at Dartmouth College. The division manages the U.S. Antarctic Program, through which it coordinates all U.S. scientific research on the Southernmost Continent and provides the logistical support to that research.

The researchers used a transient electromagnetic AEM sensor called SkyTEM, mounted to a helicopter, to produce extensive imagery of the subsurface of the coldest, driest desert on our planet, the McMurdo Dry Valleys. Using a helicopter to make the observations allowed large areas of rugged terrain to be efficiently surveyed.

The results shed new light on the history and evolution of the dry valley landscape, which, uniquely in the Antarctic is ice-free and which during the height of the southern summer has free-flowing rivers and streams. The dry valleys are also home to briny lakes at the surface and beneath at least one of the glaciers that intrude into the Valleys.

“Prior to this discovery, we considered the lakes to all be isolated from one another and the ocean, but this new data suggests that there is a connection between the lakes and the ocean, which is very interesting and potentially a game changer in how we view the geochemistry and history of the lakes,” said Doran, LSU professor of geology & geophysics and John Franks Endowed Chair.

Doran, the first to hold the John Franks Endowed Chair in geology & geophysics, is a natural fit for this research team in that the ground water system examined in this study is closely associated with the perennially ice covered lakes in the region that he has been studying for more than 20 years.

Doran joined the research team after the data was collected and assisted with the data interpretation.

“The first phase of this research was a proof of concept study and we definitely proved the concept,” he said, adding that the team is in the process of writing a new proposal to NSF to continue their work.

Overall, the dry valleys ecosystem — cold, vegetation-free and home only to microscopic animal and plant life — resembles, during the Antarctic summer, conditions on the surface on Mars.

In addition to many other studies, the dry valleys are home to projects that are investigating how climate has changed over geologic time.

“This project is studying the past and present climate to, in part, understand how climate change in the future will affect biodiversity and ecosystem processes,” said Virginia. “This fantastic new view beneath the surface will help us sort out competing ideas and theories about how the dry valleys have changed with time and how this history influences what we see today.”

The AEM sensor, which was developed at Aarhus University in Denmark, was flown over the Taylor Glacier, one of the best-studied glaciers in the world, in November 2011. The glacier has a unique feature known as Blood Falls, where iron-rich brine from the subsurface is released at the front of the glacier. Blood Falls is known to harbor an active microbial community, where organisms use iron and sulfur compounds for energy and growth and in the process facilitate rock weathering.

The AEM team believes that the newly discovered brines harbor similar microbial communities persisting in the deep, cold dark aquifers. AEM instrumentation lead Esben Auken has flown the sensor all over the world, but this was the first time they tackled Antarctica.

“Antarctica is by far the most challenging place we have been.” Auken said. “It was all worth it when we saw the raw data as it was offloaded from the helicopter. It clearly showed we were on to some extraordinary results, which no one had been able to produce before. We were excited because we knew this would change the way scientists in the future would view the hydrological cycle in the dry valleys. For us, the project was the result of many years of developing the best mapping technology in the world, and now we were able to collaborate with scientists who had worked in the Antarctic environment for decades and were willing to take the risk of letting us prove this could be done with success.”

Video

Note : The above story is based on materials provided by Louisiana State University.

Related Articles