Bizarre ‘platypus’ dinosaur discovered

Although closely related to the notorious carnivore Tyrannosaurus rex, a new lineage of dinosaur discovered in Chile is proving to be an evolutionary jigsaw puzzle, as it preferred to graze upon plants.
Palaeontologists are referring to Chilesaurus diegosuarezi as a ‘platypus’ dinosaur because of its bizarre combination of characters that resemble different dinosaur groups. For example, Chilesaurus boasted a proportionally small skull, hands with two fingers like Tyrannosaurus rex and feet more akin to primitive long-neck dinosaurs.
Chilesaurus diegosuarezi is nested within the theropod group of dinosaurs, the dinosaurian group that gathers the famous meat eaters Velociraptor, Carnotaurus and Tyrannosaurus, and from which birds today evolved. The presence of herbivorous theropods was up until now only known in close relatives of birds, but Chilesaurus shows that a meat-free diet was acquired much earlier than thought.
Chilesaurus diegosuarezi is named after the country where it was collected, as well as honouring Diego Suárez, the seven year old boy who discovered the bones. He discovered the fossil remains of this creature at the Toqui Formation in Aysén, south of Chilean Patagonia, in rocks deposited at the end of the Jurassic Period, approximately 145 million years ago.
Diego was in the region with his parents, Chilean geologists Manuel Suarez and Rita de la Cruz, who were studying rocks in the Chilean Patagonia, with the aim to better understand the formation of the Andes mountain range. Diego stumbled across the fossils while him and his sister, Macarena, were looking for decorative stones.
Due to Chilesaurus’ unusual combination of characters, it was initially thought that Diego had uncovered several species. However, since Diego’s find, more than a dozen Chilesaurus specimens have been excavated, including four complete skeletons — a first for the Jurassic Period in Chile — and they demonstrate that this dinosaur certainly combined a variety of unique anatomical traits.
Most of the specimens are the size of a turkey, but some isolated bones reveal that the maximum size of Chilesaurus was around three metres long. Chilean and Argentinian palaeontologists from institutions including the University of Birmingham, along with Diego’s parents, have been studying these skeletons, with the findings published in full in Nature on April 27th.
Other features present in very different groups of dinosaurs Chilesaurus adopted were robust forelimbs similar to Jurassic theropods such as Allosaurus, although its hands were provided with two blunt fingers, unlike the sharp claws of fellow theropod Velociraptor. Chilesaurus’ pelvic girdle resembles that of the ornithischian dinosaurs, whereas it is actually classified in the other basic dinosaur division — Saurischia.
The different parts of the body of Chilesaurus were adapted to a particular diet and way of life, which was similar to other groups of dinosaurs. As a result of these similar habits, different regions of the body of Chilesaurus evolved resembling those present in other, unrelated groups of dinosaurs, which is a phenomenon called evolutionary convergence.
Chilesaurus represents one of the most extreme cases of mosaic convergent evolution recorded in the history of life. For example, the teeth of Chilesaurus are very similar to those of primitive long-neck dinosaurs because they were selected over millions of years as a result of a similar diet between these two lineages of dinosaurs.
Martín Ezcurra, Researcher, School of Geography, Earth and Environmental Sciences, University of Birmingham said: ‘Chilesaurus can be considered a ‘platypus’ dinosaur because different parts of its body resemble those of other dinosaur groups due to mosaic convergent evolution. In this process, a region or regions of an organism resemble others of unrelated species because of a similar mode of life and evolutionary pressures. Chilesaurus provides a good example of how evolution works in deep time and it is one of the most interesting cases of convergent evolution documented in the history of life.
‘Chilesaurus shows how much data is still completely unknown about the early diversification of major dinosaur groups. This study will force palaeontologists to take more care in the future in the identification of fragmentary or isolated dinosaur bones. It comes as false relationship evidence may arise because of cases of convergent evolution, such as that present in Chilesaurus.’
Dr. Fernando Novas, Bernardino Rivadavia Natural Sciences Museum, Buenos Aires, Argentina, led the research on Chilesaurus and said: ‘Chilesaurus is the first complete dinosaur from the Jurassic Period found in Chile and represents one of the most complete and anatomically correct documented theropod dinosaurs from the southern hemisphere. Although plant-eating theropods have been recorded in North America and Asia, this is the first time a theropod with this characteristic has been found in a southern landmass.
Chilesaurus was an odd plant-eating dinosaur only to be found in Chile. However, the recurrent discovery in beds of the Toqui Formation of its bones and skeletons clearly demonstrates that Chilesaurus was, by far, the most abundant dinosaur in southwest Patagonia 145 million years ago.’
Reference:
Fernando E. Novas, Leonardo Salgado, Manuel Suárez, Federico L. Agnolín, Martín D. Ezcurra, Nicolás R. Chimento, Rita de la Cruz, Marcelo P. Isasi, Alexander O. Vargas, David Rubilar-Rogers. An enigmatic plant-eating theropod from the Late Jurassic period of Chile. Nature, 2015; DOI: 10.1038/nature14307
Note: The above story is based on materials provided by University of Birmingham.
Tidal tugs on Teflon faults drive slow-slipping earthquakes
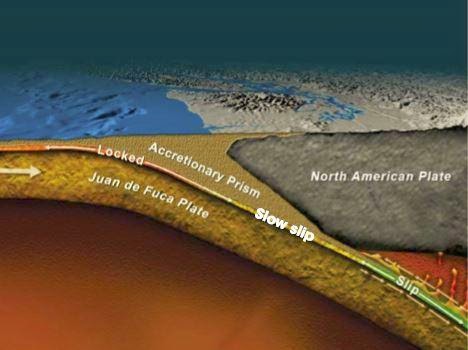
Unknown to most people, the Pacific Northwest experiences a magnitude-6.6 earthquake about once a year. The reason nobody notices is that the movement happens slowly and deep underground, in a part of the fault whose behavior, known as slow-slip, was only recently discovered.
A University of Washington seismologist who studies slow-slip quakes has looked at how they respond to tidal forces from celestial bodies and used the result to make a first direct calculation of friction deep on the fault. Though these events occur much deeper and on a different type of fault than the recent catastrophe in Nepal, the findings could improve general understanding of when and how faults break.
The new study, published online April 27 in Nature Geoscience, shows that the gravitational pull of the sun and the moon affect the Cascadia fault a few days after it has started slipping. The timing of movement suggests that the friction at this depth on the fault is only 0.1, roughly that of two pieces of lubricated metal.
“I was able to tease out the effect of friction and found that it is not the friction of normal rocks in the lab — it’s much lower,” said author Heidi Houston, a UW professor of Earth and space sciences. “It’s closer to Teflon than to sandpaper.”
The surprising results of the new study could help to better model the physics of these systems, and they could even tell us something about the frictional forces in the locked portion of the fault where hazardous earthquakes occur.
The research looked at six recent slow-slip events along the Cascadia subduction zone, one of the best-studied places for these enigmatic slow quakes. The slow quakes are accompanied by tremors, weak seismic vibrations previously thought to be random noise. The tremors begin every 12 to 14 months below Puget Sound, Washington, and then travel north and south at about 5 miles (8 kilometers) per day for several weeks, affecting each section of the fault for about five days.
The paper looks at how the gravitational pull of the sun and moon, which slightly deform the Earth and oceans, affect forces along, across and inside the fault, and what that means for the slow-slip seismic activity more than 20 miles (35 kilometers) underground.
Results show that on the first day of tremors, the tidal forces don’t matter much. But starting at about 1 1/2 days — when Houston thinks minerals that had been deposited from the surrounding fluid and that held the fault together may have broken — the additional pull of the tides does have an effect.
“Three days after the slipping has begun, the fault is very sensitive to the tides, and it almost slips only when the tides are encouraging it,” Houston said.
“It implies that something is changing on the fault plane over those five days.”
By averaging across many sections of the fault, and over all six events, she found that the amount of the tremor increases exponentially with increasing tidal force.
Regular fast earthquakes are also very slightly affected by the tides, but they are overwhelmed by other forces and the effect is almost too small to detect.
There is no need for worry, Houston says — even when celestial bodies line up to generate the biggest king tides, the effect would only rarely be enough to actually trigger a slow-slip quake, much less a regular earthquake. But it does tell us something about the physics of a crucial process that can’t be easily studied in the lab.
“We want to understand the physics of what is happening, to understand and predict how the fault is storing stress, and how it’s going to relieve stress,” Houston said. “Friction is a big piece of that. And it turns out that this part of the fault is much slipperier than previously thought.”
Slow-slip earthquakes relieve stress right where they slipped, but the movement actually places more stress on neighboring parts of the fault, including the so-called locked zone, where a rupture can cause the most damaging type of earthquakes.
In Cascadia’s slow-slip events the fault will move about an inch (3 centimeters) over several days, with different parts of the fault moving at different times. When the shallower “locked zone” ruptures, by contrast, a large section of the fault can lurch over 60 feet (18 meters) in minutes. When this occurs, as it does about every 500 years in a magnitude 9 on the Cascadia subduction zone, it generates strong damaging seismic waves in the Earth’s crust.
Still unknown is how slow-slip events are related to the more damaging quakes. A shallower slow-slip event was detected in the weeks before the deadly 2011 Tohoku earthquake and tsunami, on a fault like Cascadia’s where an ocean plate plunges below a continental plate.
“Understanding slow slip and tremor could give us some way to monitor what is happening in the shallower, locked part of the fault,” Houston said. “Geophysicists started with the picture of just a flat plane of sandpaper, but that picture is evolving.”
Reference:
Low friction and fault weakening revealed by rising sensitivity of tremor to tidal stress, Nature Geoscience (2015) DOI: 10.1038/ngeo2419
Note : The above story is based on materials provided by University of Washington.
Calbuco volcano – evacuations and air-traffic disruption follow eruption
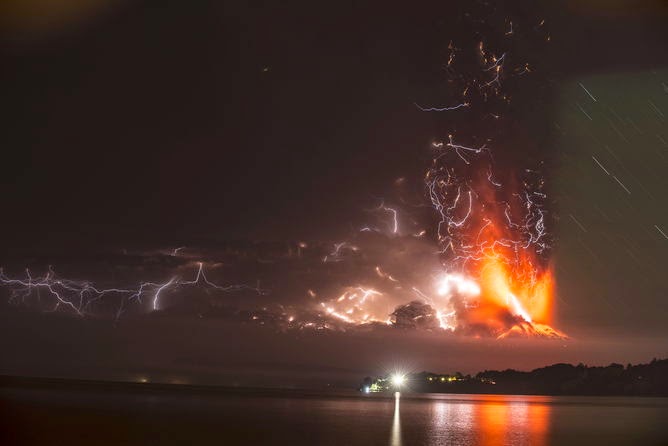
The Calbuco volcano, a 2,000 metre peak in southern Chile, sent a column of ash about 15km skywards twice on the night of April 22 and early the following morning. As the risk of deadly flows of ash and hot air was immediate, a 20km radius evacuation zone was declared.
The event was spectacularly visible from Puerto Montt, a city of nearly 200,000 inhabitants, only 30 km away. It seems to have begun within barely five hours of warning signs being first detected by local seismometers.
There two big eruptions over seven hours caused ash to fall in the Argentinian town of San Martin de los Andes, nearly 200km north-east of the volcano. Further eruptions are possible, although the likelihood of this decreases as time passes.
Eruptions like these are particularly significant because they have the potential to produce pyroclastic flows, which are fast-moving ground-hugging currents of ash and hot air, triggered when a rising ash column collapses. These are deadly – and the 20km radius evacuation zone wisely remains in place in case the volcano (quiet during most of April 24) wakes up again. For example, pyroclastic flows at the Indonesian volcano Sinabung killed at least 16 people in February last year, who had strayed back inside the local evacuation zone.
Less immediately deadly is the fall-out that settles from the high-altitude ash cloud that slowly disperses downwind. This is a respiratory hazard and can also kill vegetation and contaminate water supplies. After an eruption has ceased, ash that has settled to the ground will pose a risk of volcanic mudflows (widely known by their Indonesian name “lahars”) that can choke water-courses and destroy bridges.
Calbuco is about 90km south of the Puyehue-Cordon Caulle volcano, which erupted in June 2011 spreading airborne ash around the globe, leading to airspace closures in Australia. That eruption lasted for months, and produced a high ash column for more than a week. Calbuco’s current eruption seems unlikely to persist so long but already it has disrupted local air travel.
Volcanic ash is dangerous to aircraft and the Buenos Aires Volcanic Ash Advisory Centre (VAAC) this week issued a warning of airborne ash up to 40,000ft high across Chile and Argentina. The cloud is expected to disperse over Argentina, as as it is no longer being fed by a continuing eruption anyone hoping to fly in or out of Australia has little need to worry.
These days the rules about flying in volcanic ash are less stringent than they were during the 2010 eruption of Iceland’s Eyjafjallajökull volcano. When that began, the rule was if there was any ash at all, it was forbidden to fly through it. Nowadays it is agreed that a small amount of ash can be tolerated for short periods. Unfortunately it is hard to be sure of the density of airborne ash, so it is best to err on the side of caution.
Calbuco had been quiet since a four-hour eruption on August 26 1972, except for an episode of gas emission from fumaroles on 12 August 1996. One of the largest historical eruptions in Chile took place here in 1893-4, throwing 30cm bombs as far as 8km from the summit crater.
These and other volcanoes in the Andes are present as a result of plate tectonic processes, which also cause earthquakes in the region. The floor of the Pacific ocean (actually the Nazca Plate) is being pushed below South America which leads to melting at depth which forces magma upwards to feed the volcanoes. Because seawater has been transported into the melting zone, the magma contains gases such as water vapour and carbon dioxide, and the violent expansion of gas bubbles is what makes eruptions at these volcanoes so explosive.
Video
Ash fallout from Calbuco in San Martin de los Andes.
Video from Puerto Montt showing the 22/23 April eruption of Calbuco.
Note : The above story is based on materials provided by The Conversation.
This story is published courtesy of The Conversation (under Creative Commons-Attribution/No derivatives).
Chemistry of seabed’s hot vents could explain emergence of life
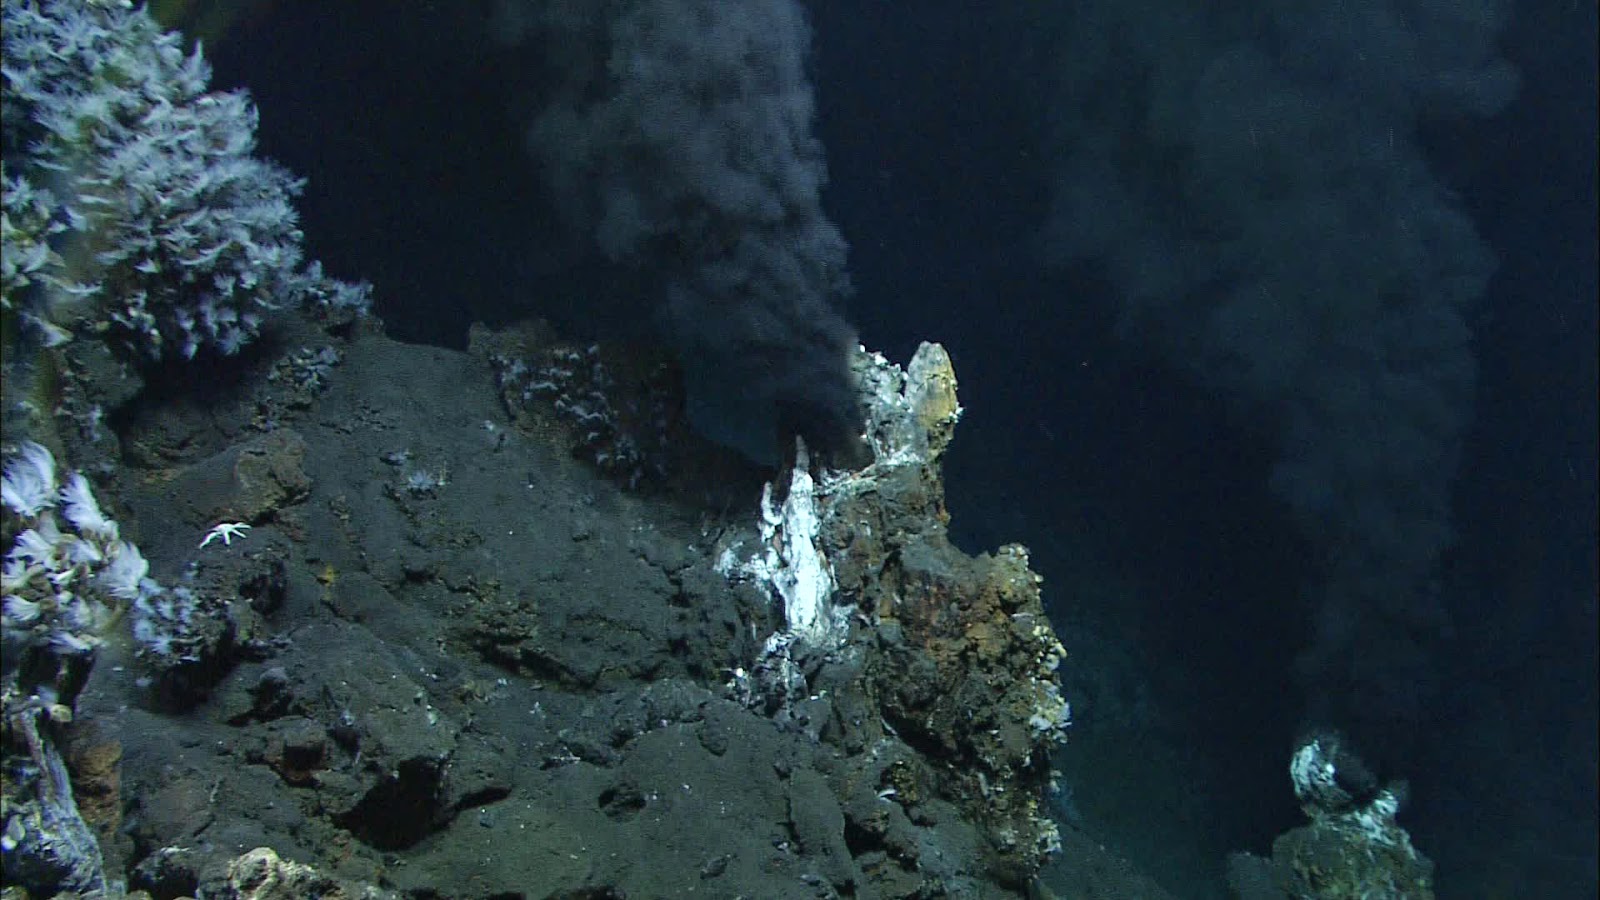
Hot vents on the seabed could have spontaneously produced the organic molecules necessary for life, according to new research by UCL chemists. The study shows how the surfaces of mineral particles inside hydrothermal vents have similar chemical properties to enzymes, the biological molecules that govern chemical reactions in living organisms. This means that vents are able to create simple carbon-based molecules, such as methanol and formic acid, out of the dissolved CO2 in the water.
The discovery, published in the journal Chemical Communications, explains how some of the key building blocks for organic chemistry were already being formed in nature before life emerged — and may have played a role in the emergence of the first life forms. It also has potential practical applications, showing how products such as plastics and fuels could be synthesised from CO2 rather than oil.
“There is a lot of speculation that hydrothermal vents could be the location where life on Earth began,” says Nora de Leeuw, who heads the team. “There is a lot of CO2 dissolved in the water, which could provide the carbon that the chemistry of living organisms is based on, and there is plenty of energy, because the water is hot and turbulent. What our research proves is that these vents also have the chemical properties that encourage these molecules to recombine into molecules usually associated with living organisms.”
The team combined laboratory experiments with supercomputer simulations to investigate the conditions under which the mineral particles would catalyse the conversion of CO2 into organic molecules. The experiments replicated the conditions present in deep sea vents, where hot and slightly alkaline water rich in dissolved CO2 passes over the mineral greigite (Fe3S4), located on the inside surfaces of the vents. These experiments hinted at the chemical processes that were underway. The simulations, which were run on UCL’s Legion supercomputer and HECToR (the UK national supercomputing service), provided a molecule-by-molecule view of how the CO2 and greigite interacted, helping to make sense of what was being observed in the experiments. The computing power and programming expertise to accurately simulate the behaviour of individual molecules in this way has only become available in the past decade.
“We found that the surfaces and crystal structures inside these vents act as catalysts, encouraging chemical changes in the material that settles on them,” says Nathan Hollingsworth, a co-author of the study. “They behave much like enzymes do in living organisms, breaking down the bonds between carbon and oxygen atoms. This lets them combine with water to produce formic acid, acetic acid, methanol and pyruvic acid. Once you have simple carbon-based chemicals such as these, it opens the door to more complex carbon-based chemistry.”
Theories about the emergence of life suggest that increasingly complex carbon-based chemistry led to self-replicating molecules — and, eventually, the appearance of the first cellular life forms. This research shows how one of the first steps in this journey may have occurred. It is proof that simple organic molecules can be synthesised in nature without living organisms being present. It also confirms that hydrothermal vents are a plausible location for at least part of this process to have occurred.
The study could also have a practical applications, as it provides a method for creating carbon-based chemicals out of CO2, without the need for extreme heat or pressure. This could, in the long term, replace oil as the raw material for products such as plastics, fertilisers and fuels.
This study shows, albeit on a very small scale, that such products, which are currently produced from non-renewable raw materials, can be produced by more environmentally friendly means. If the process can be scaled up to commercially viable scales, it would not only save oil, but use up CO2 — a greenhouse gas — as a raw material.
Reference:
A. Roldan, N. Hollingsworth, A. Roffey, H.-U. Islam, J. B. M. Goodall, C. R. A. Catlow, J. A. Darr, W. Bras, G. Sankar, K. B. Holt, G. Hogarth, N. H. de Leeuw. Bio-inspired CO2conversion by iron sulfide catalysts under sustainable conditions. Chem. Commun., 2015; 51 (35): 7501 DOI: 10.1039/C5CC02078F
Note: The above story is based on materials provided by University College London.
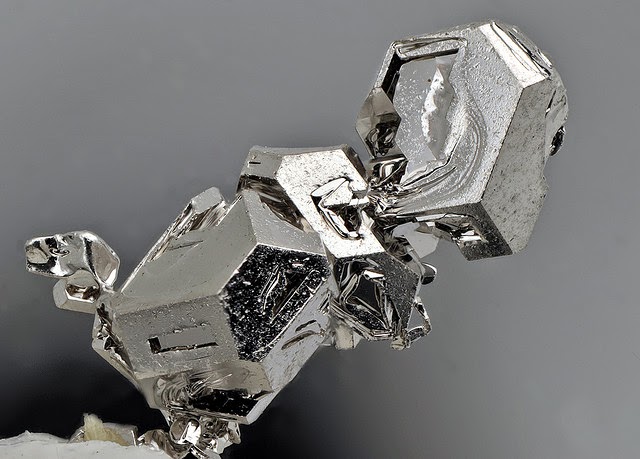
Platinum
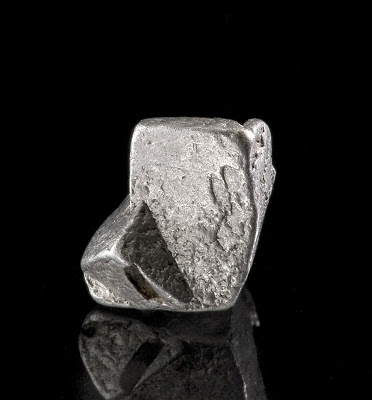
Chemical Formula: Pt
Locality: Most notably from the Urals, Russia and Brazil.
Name Origin: Spanish, platina = “silver.”
Locality: Most notably from the Urals, Russia and Brazil.
Name Origin: Spanish, platina = “silver.”
Platinum is a chemical element with the chemical symbol Pt and an atomic number of 78. It is a dense, malleable, ductile, highly unreactive, precious, gray-white transition metal. Its name is derived from the Spanish term platina, which is literally translated into “little silver”.Platinum is a member of the platinum group of elements and group 10 of the periodic table of elements. It has six naturally occurring isotopes. It is one of the rarest elements in the Earth’s crust with an average abundance of approximately 5 μg/kg. It occurs in some nickel and copper ores along with some native deposits, mostly in South Africa, which accounts for 80% of the world production. Because of its scarcity in the earth’s crust, only a few hundred tonnes are produced annually, and is therefore highly valuable and is a major precious metal commodity.Platinum is the least reactive metal. It has remarkable resistance to corrosion, even at high temperatures, and is therefore considered a noble metal. Consequently, platinum is often found chemically uncombined as native platinum. Because it occurs naturally in the alluvial sands of various rivers, it was first used by pre-Columbian South American natives to produce artifacts. It was referenced in European writings as early as 16th century, but it was not until Antonio de Ulloa published a report on a new metal of Colombian origin in 1748 that it became investigated by scientists.
Platinum is used in catalytic converters, laboratory equipment, electrical contacts and electrodes, platinum resistance thermometers, dentistry equipment, and jewellery. Being a heavy metal, it leads to health issues upon exposure to its salts, but due to its corrosion resistance, it is not as toxic as some metals. Compounds containing platinum, most notably cisplatin, are applied in chemotherapy against certain types of cancer.
Physical Properties of Platinum
Cleavage: None
Color: Whitish steel gray, Steel gray, Dark gray.
Density: 14 – 22, Average = 18
Diaphaneity: Opaque
Fracture: Hackly – Jagged, torn surfaces, (e.g. fractured metals).
Hardness: 4-4.5 – Between Fluorite and Apatite
Luminescence: Non-fluorescent.
Luster: Metallic
Magnetism: Naturally weak
Streak: grayish white
Photos:
Map shows content and origins of the geologic basement
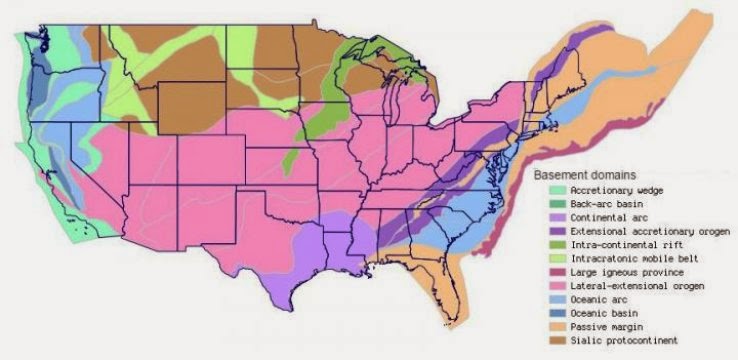
A map showing the many different pieces of Earth’s crust that comprise the nation’s geologic basement is now available from the U.S. Geological Survey. This is the first map to portray these pieces, from the most ancient to recent, by the events that influenced their composition, starting with their origin. This product provides a picture of the basement for the U.S., including Alaska, that can help scientists produce regional and national mineral resource assessments, starting with the original metal endowments in source rocks.
“Traditionally, scientists have assessed mineral resources using clues at or near the Earth’s surface to determine what lies below,” said USGS scientist Karen Lund, who led the project. “This map is based on the concept that the age and origins of basement rocks influenced the nature and location of mineral deposits. It offers a framework to examine mineral resources and other geologic aspects of the continent from its building blocks up,” said Lund.
More than 80 pieces of crust have been added to the nation’s basement since the Earth began preserving crust about 3.6 billion years ago. These basement domains had different ages and origins before they became basement rocks, and this map includes these as key factors that determined their compositions and the original metals that may be available for remobilization and concentration into ore deposits. The map further classifies the basement domains according to how and when they became basement, as these events also influence the specific metals and deposit types that might be found in a region.
Users can identify domains potentially containing specific metals or deposit types. They can configure the companion database to show the construction of the U.S. through time. The map also provides a template to correlate regional to national fault and earthquake patterns. The map is also available on a separate site, where users can combine data and overlay known mineral sites or other features on the domains.
Basement rocks are crystalline rocks lying above the mantle and beneath all other rocks and sediments. They are sometimes exposed at the surface, but often they are buried under miles of rock and sediment and can only be mapped over large areas using remote geophysical surveys. This map was compiled using a variety of methods, including data from national-scale gravity and aeromagnetic surveys.
Crustal rocks are modified several times before they become basement, and these transitions alter their composition. Basement rocks are continental crust that has been modified by a wide variety of plate tectonic events involving deformation, metamorphism, deposition, partial melting and magmatism. Ultimately, continental crust forms from pre-existing oceanic crust and overlying sediments that have been thus modified.
It is not only the myriad processes that result in varying basement rock content but also the time when these processes occurred during the Earth’s history. For example, because the Earth has evolved as a planet during its 4.5 billion year history, early deposit types formed when there was less oxygen in the atmosphere and the thin crust was hotter. The ancient domains are now more stable and less likely to be altered by modern processes that could cause metals to migrate. By contrast, basement rocks that formed out of crust that is less than one billion years old have origins that can be interpreted according to the present-day rates and scales of plate tectonic processes that reflect a more mature planet with a thicker crust.
By incorporating ancient to modern processes, this map offers a more complete and consistent portrait of the nation’s geologic basement than previous maps and presents a nationwide concept of basement for future broad-scale mineral resource assessments and other geologic studies.
Note: The above story is based on materials provided by United States Geological Survey.
Ascent or no ascent? How hot material is stopped in Earth’s mantle
Gigantic volumes of hot material rising from the deep earth’s mantle to the base of the lithosphere have shaped the face of our planet. Provided they have a sufficient volume, they can lead to break-up of continents or cause mass extinction events in certain periods of the Earth’s history. So far it was assumed that because of their high temperatures those bodies – called mantle plumes – ascend directly from the bottom of the earth’s mantle to the lithosphere. In the most recent volume of Nature Communications, a team of researchers from the Geodynamic Modeling Section of German Research Centre for Geosciences GFZ explains possible barriers for the ascent of these mantle plumes and under which conditions the hot material can still reach the surface. In addition, the researchers resolve major conflicts surrounding present model predictions.
The largest magmatic events on Earth are caused by massive melting of ascending large volumes of hot material from the Earth’s interior. The surface manifestations of these events in Earth’s history are still visible in form of the basaltic rocks of Large Igneous Provinces. The prevailing concept of mantle plumes so far was that because of their high temperatures, they have strongly positive buoyancy that causes them to ascend and uplift the overlying Earth’s surface by more than one kilometer. In addition, it was assumed that these mantle plumes are mushroom-shaped with a large bulbous head and a much thinner tail with a radius of only 100 km, acting as an ascent channel for new material. But here is the problem: In many cases, this concept does not agree with geological and geophysical observations, which report much wider zones of ascending material and much smaller surface uplift.
The solution is to incorporate observations from plate tectonics: In many places on the Earth’s surface, such as in the subduction zones around the Pacific, ocean floor sinks down into the Earth’s mantle. Apparently, this material descends up to a great depth in the Earth’s mantle over several millions of years. This former ocean floor has a different chemical composition than the surrounding Earth’s mantle, leading to a higher density. If this material is entrained by mantle plumes, which is indicated by geochemical analyses of the rocks of Large Igneous Provinces, the buoyancy of the plume will decrease. However, this opens up the question if this hot material is still buoyant enough to rise all the way from the bottom of the Earth’s mantle to the surface.
GFZ-researcher Juliane Dannberg: “Our computer simulations show that on the one hand, the temperature difference between the plume and the surrounding mantle has to be high enough to trigger the ascent of the plume. On the other hand, a minimum volume is required to cross a region in the upper mantle where the prevailing pressures and temperatures lead to minerals with a much higher density than the surrounding rocks.”
Under these conditions, mantles plumes with very low buoyancy can develop, preventing them from causing massive volcanism and environmental catastrophes, but instead making them pond inside of the Earth’s mantle. However, mantle plumes that are able to ascend through the whole mantle are much wider, remain in the Earth’s mantle for hundreds of millions of years and only uplift the surface by a few hundred meters, which agrees with observations.
Reference:
Juliane Dannberg, Stephan V. Sobolev. Low-buoyancy thermochemical plumes resolve controversy of classical mantle plume concept. Nature Communications, 2015; 6: 6960 DOI: 10.1038/ncomms7960
Note: The above story is based on materials provided by Helmholtz Centre Potsdam – GFZ German Research Centre for Geosciences.
Geothermal energy, aluto volcano, and Ethiopia’s rift valley
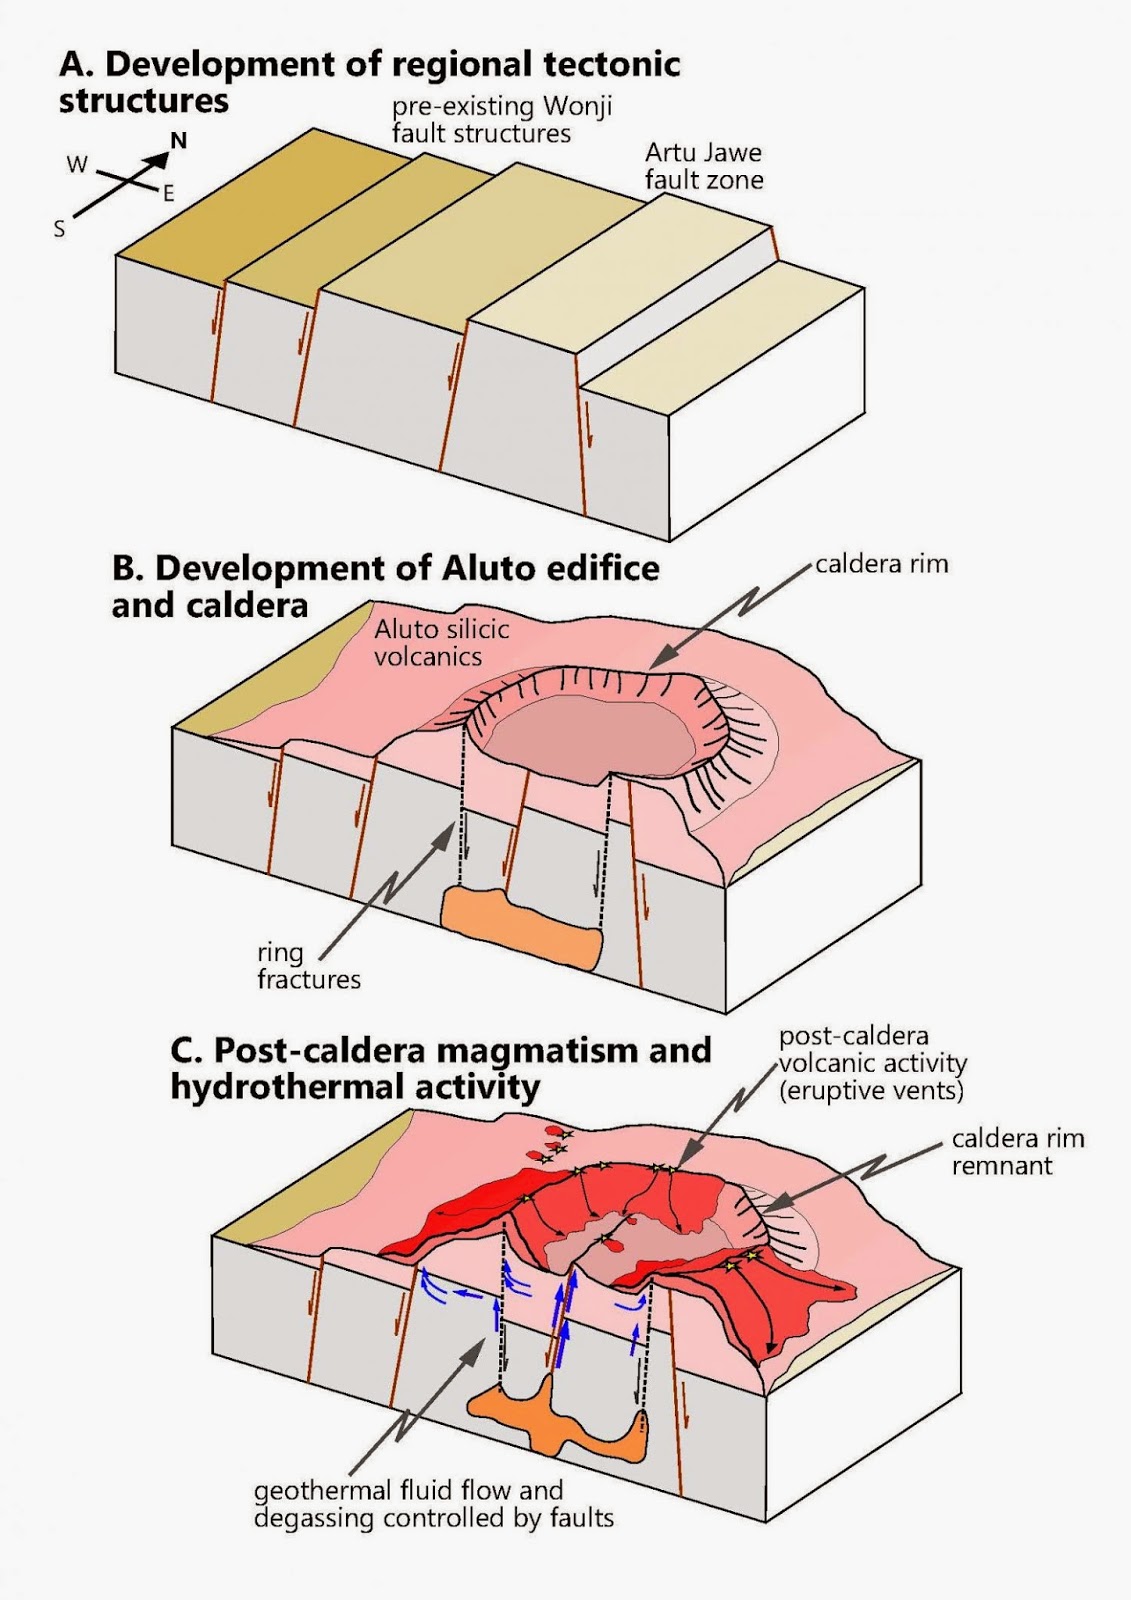
In their open access paper published in Geosphere this month, William Hutchison and colleagues present new data from Ethiopia’s Rift Valley and Aluto volcano, a major volcano in the region. Aluto is Ethiopia’s main source of geothermal energy, a low-carbon resource that is expected to grow considerably in the near future. Preexisting volcanic and tectonic structures have played a key role in the development of the Aluto volcanic complex and continue to facilitate the expulsion of gases and geothermal fluids.
Using high-resolution airborne imagery, field observations, and CO2 degassing data, the authors explore in great detail how these preexisting structures control fluid pathways and spatial patterns of volcanism, hydrothermal alteration, and degassing. Understanding these preexisting structures, they write, “Is a major task toward defining the evolution of rift zones and also has important implications for geothermal exploration, mineralization, and the assessment of volcanic hazard.”
In concluding their paper, Hutchison and colleagues write, “The new model for the structural development and volcanic edifice growth at Aluto opens up a number of avenues for future work. A major challenge is to determine how geothermal and magmatic fluids are distributed and stored in the subsurface of Aluto and how they ascend along the mapped fault zones.” These future studies, they note, “should focus on generating high-spatial-resolution maps of off-rift tectonic structures and should be complemented by detailed field work to constrain the stress field orientations during the development of the Aluto magma reservoir.”
Reference:
Structural controls on fluid pathways in an active rift system: A case study of the Aluto volcanic complex, William Hutchison et al., COMET, University of Oxford, Oxford, UK. Published online on 2 Apr. 2015; DOI: 10.1130/GES01119.1.
Note : The above story is based on materials provided by Geological Society of America.
New Insight on Ground Shaking from Man-Made Earthquakes
Significant strides in science have been made to better understand potential ground shaking from induced earthquakes, which are earthquakes triggered by man-made practices.
Earthquake activity has sharply increased since 2009 in the central and eastern United States. The increase has been linked to industrial operations that dispose of wastewater by injecting it into deep wells.
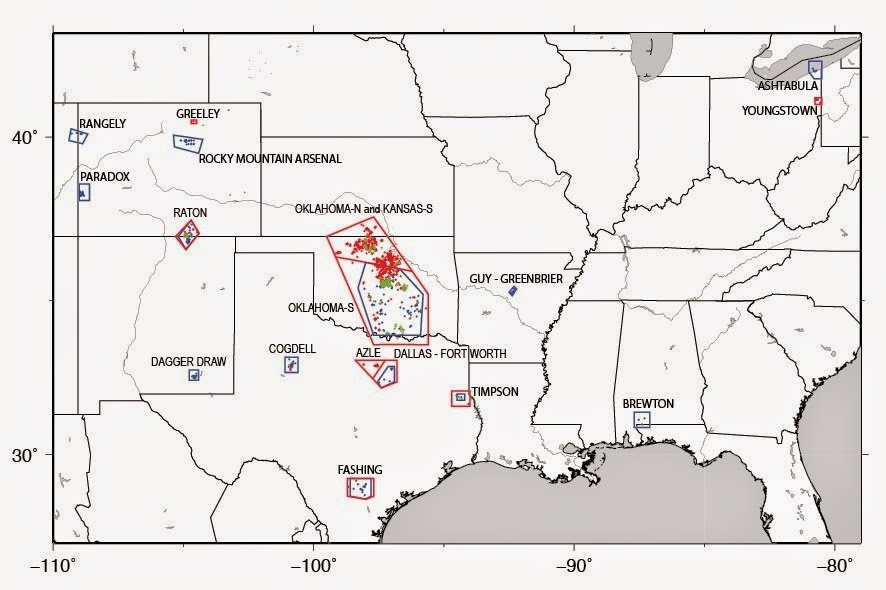
The U. S. Geological Survey (USGS) released a report today that outlines a preliminary set of models to forecast how hazardous ground shaking could be in the areas where sharp increases in seismicity have been recorded. The models ultimately aim to calculate how often earthquakes are expected to occur in the next year and how hard the ground will likely shake as a result. This report looked at the central and eastern United States; future research will incorporate data from the western states as well.
This report also identifies issues that must be resolved to develop a final hazard model, which is scheduled for release at the end of the year after the preliminary models are further examined. These preliminary models should be considered experimental in nature and should not be used for decision-making.
USGS scientists identified 17 areas within eight states with increased rates of induced seismicity. Since 2000, several of these areas have experienced high levels of seismicity, with substantial increases since 2009 that continue today. This is the first comprehensive assessment of the hazard levels associated with induced earthquakes in these areas. A detailed list of these areas is provided in the accompanying map, including the states of Alabama, Arkansas, Colorado, Kansas, New Mexico, Ohio, Oklahoma, and Texas.
Scientists developed the models by analyzing earthquakes in these zones and considering their rates, locations, maximum magnitude, and ground motions.
“This new report describes for the first time how injection-induced earthquakes can be incorporated into U.S. seismic hazard maps,” said Mark Petersen, Chief of the USGS National Seismic Hazard Modeling Project. “These earthquakes are occurring at a higher rate than ever before and pose a much greater risk to people living nearby. The USGS is developing methods that overcome the challenges in assessing seismic hazards in these regions in order to support decisions that help keep communities safe from ground shaking.”
In 2014, the USGS released updated National Seismic Hazard Maps, which describe hazard levels for natural earthquakes. Those maps are used in building codes, insurance rates, emergency preparedness plans, and other applications. The maps forecast the likelihood of earthquake shaking within a 50-year period, which is the average lifetime of a building. However, these new induced seismicity products display intensity of potential ground shaking from induced earthquakes in a one-year period. This shorter timeframe is appropriate because the induced activity can vary rapidly with time and is subject to commercial and policy decisions that could change at any point.
These new methods and products result in part from a workshop hosted by the USGS and the Oklahoma Geological Survey. The workshop, described in the new report, brought together a broad group of experts from government, industry and academic communities to discuss the hazards from induced earthquakes.
Wastewater that is salty or polluted by chemicals needs to be disposed of in a manner that prevents contaminating freshwater sources. Large volumes of wastewater can result from a variety of processes, such as a byproduct from energy production. Wastewater injection increases the underground pore pressure, which may lubricate nearby faults thereby making earthquakes more likely to occur. Although the disposal process has the potential to trigger earthquakes, most wastewater disposal wells do not produce felt earthquakes.
Many questions have been raised about whether hydraulic fracturing—commonly referred to as “fracking”—is responsible for the recent increase of earthquakes. USGS’s studies suggest that the actual hydraulic fracturing process is only occasionally the direct cause of felt earthquakes.
Reference:
Read the newly published USGS report, “Incorporating Induced Seismicity in the 2014 United States National Seismic Hazard Model—Results of 2014 Workshop and Sensitivity Studies.”. DOI: 10.3133/ofr20151070
Note: The above story is based on materials provided by USGS.
Calbuco Volcano Eruption,Chile , April 23, 2015
The Calbuco volcano erupted Wednesday for the first time in over 40 years, billowing a huge ash cloud over a sparsely populated, mountainous area in southern Chile. Authorities ordered the evacuation of the 1,500 inhabitants of the nearby town of Ensenada, along with residents of two smaller communities.
Video Copyright © Volcan de Colima
Scientists see deeper Yellowstone magma
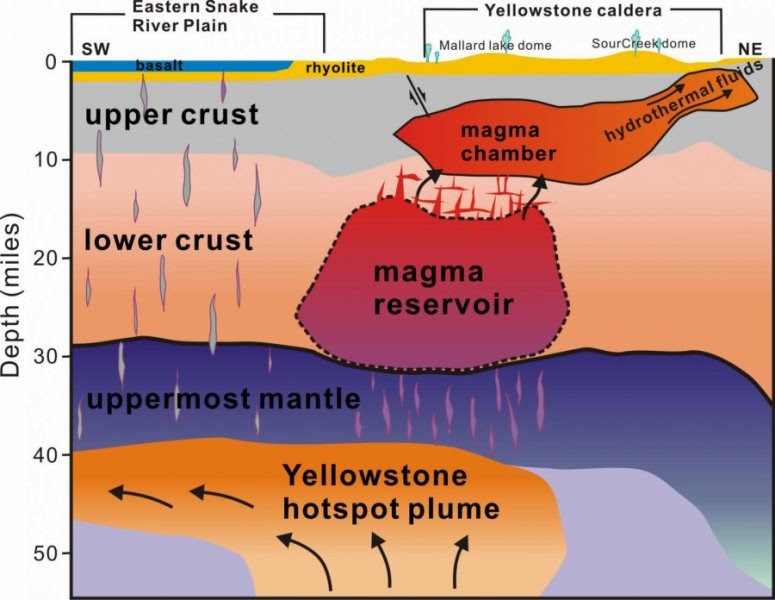
University of Utah seismologists discovered and made images of a reservoir of hot, partly molten rock 12 to 28 miles beneath the Yellowstone supervolcano, and it is 4.4 times larger than the shallower, long-known magma chamber.
The hot rock in the newly discovered, deeper magma reservoir would fill the 1,000-cubic-mile Grand Canyon 11.2 times, while the previously known magma chamber would fill the Grand Canyon 2.5 times, says postdoctoral researcher Jamie Farrell, a co-author of the study published online today in the journal Science.
“For the first time, we have imaged the continuous volcanic plumbing system under Yellowstone,” says first author Hsin-Hua Huang, also a postdoctoral researcher in geology and geophysics. “That includes the upper crustal magma chamber we have seen previously plus a lower crustal magma reservoir that has never been imaged before and that connects the upper chamber to the Yellowstone hotspot plume below.”
Contrary to popular perception, the magma chamber and magma reservoir are not full of molten rock. Instead, the rock is hot, mostly solid and spongelike, with pockets of molten rock within it. Huang says the new study indicates the upper magma chamber averages about 9 percent molten rock — consistent with earlier estimates of 5 percent to 15 percent melt — and the lower magma reservoir is about 2 percent melt.
So there is about one-quarter of a Grand Canyon worth of molten rock within the much larger volumes of either the magma chamber or the magma reservoir, Farrell says.
No increase in the danger
The researchers emphasize that Yellowstone’s plumbing system is no larger — nor closer to erupting — than before, only that they now have used advanced techniques to make a complete image of the system that carries hot and partly molten rock upward from the top of the Yellowstone hotspot plume — about 40 miles beneath the surface — to the magma reservoir and the magma chamber above it.
“The magma chamber and reservoir are not getting any bigger than they have been, it’s just that we can see them better now using new techniques,” Farrell says.
Study co-author Fan-Chi Lin, an assistant professor of geology and geophysics, says: “It gives us a better understanding the Yellowstone magmatic system. We can now use these new models to better estimate the potential seismic and volcanic hazards.”
The researchers point out that the previously known upper magma chamber was the immediate source of three cataclysmic eruptions of the Yellowstone caldera 2 million, 1.2 million and 640,000 years ago, and that isn’t changed by discovery of the underlying magma reservoir that supplies the magma chamber.
“The actual hazard is the same, but now we have a much better understanding of the complete crustal magma system,” says study co-author Robert B. Smith, a research and emeritus professor of geology and geophysics at the University of Utah.
The three supervolcano eruptions at Yellowstone — on the Wyoming-Idaho-Montana border — covered much of North America in volcanic ash. A supervolcano eruption today would be cataclysmic, but Smith says the annual chance is 1 in 700,000.
Before the new discovery, researchers had envisioned partly molten rock moving upward from the Yellowstone hotspot plume via a series of vertical and horizontal cracks, known as dikes and sills, or as blobs. They still believe such cracks move hot rock from the plume head to the magma reservoir and from there to the shallow magma chamber.
Anatomy of a supervolcano
The study in Science is titled, “The Yellowstone magmatic system from the mantle plume to the upper crust.” Huang, Lin, Farrell and Smith conducted the research with Brandon Schmandt at the University of New Mexico and Victor Tsai at the California Institute of Technology. Funding came from the University of Utah, National Science Foundation, Brinson Foundation and William Carrico.
Yellowstone is among the world’s largest supervolcanoes, with frequent earthquakes and Earth’s most vigorous continental geothermal system.
The three ancient Yellowstone supervolcano eruptions were only the latest in a series of more than 140 as the North American plate of Earth’s crust and upper mantle moved southwest over the Yellowstone hotspot, starting 17 million years ago at the Oregon-Idaho-Nevada border. The hotspot eruptions progressed northeast before reaching Yellowstone 2 million years ago.
Here is how the new study depicts the Yellowstone system, from bottom to top:
- Previous research has shown the Yellowstone hotspot plume rises from a depth of at least 440 miles in Earth’s mantle. Some researchers suspect it originates 1,800 miles deep at Earth’s core. The plume rises from the depths northwest of Yellowstone. The plume conduit is roughly 50 miles wide as it rises through Earth’s mantle and then spreads out like a pancake as it hits the uppermost mantle about 40 miles deep. Earlier Utah studies indicated the plume head was 300 miles wide. The new study suggests it may be smaller, but the data aren’t good enough to know for sure.
- Hot and partly molten rock rises in dikes from the top of the plume at 40 miles depth up to the bottom of the 11,200-cubic mile magma reservoir, about 28 miles deep. The top of this newly discovered blob-shaped magma reservoir is about 12 miles deep, Huang says. The reservoir measures 30 miles northwest to southeast and 44 miles southwest to northeast. “Having this lower magma body resolved the missing link of how the plume connects to the magma chamber in the upper crust,” Lin says.
- The 2,500-cubic mile upper magma chamber sits beneath Yellowstone’s 40-by-25-mile caldera, or giant crater. Farrell says it is shaped like a gigantic frying pan about 3 to 9 miles beneath the surface, with a “handle” rising to the northeast. The chamber is about 19 miles from northwest to southeast and 55 miles southwest to northeast. The handle is the shallowest, long part of the chamber that extends 10 miles northeast of the caldera.
Scientists once thought the shallow magma chamber was 1,000 cubic miles. But at science meetings and in a published paper this past year, Farrell and Smith showed the chamber was 2.5 times bigger than once thought. That has not changed in the new study.
Discovery of the magma reservoir below the magma chamber solves a longstanding mystery: Why Yellowstone’s soil and geothermal features emit more carbon dioxide than can be explained by gases from the magma chamber, Huang says. Farrell says a deeper magma reservoir had been hypothesized because of the excess carbon dioxide, which comes from molten and partly molten rock.
A better, deeper look at Yellowstone
As with past studies that made images of Yellowstone’s volcanic plumbing, the new study used seismic imaging, which is somewhat like a medical CT scan but uses earthquake waves instead of X-rays to distinguish rock of various densities. Quake waves go faster through cold rock, and slower through hot and molten rock.
For the new study, Huang developed a technique to combine two kinds of seismic information: Data from local quakes detected in Utah, Idaho, the Teton Range and Yellowstone by the University of Utah Seismograph Stations and data from more distant quakes detected by the National Science Foundation-funded EarthScope array of seismometers, which was used to map the underground structure of the lower 48 states.
The Utah seismic network has closely spaced seismometers that are better at making images of the shallower crust beneath Yellowstone, while EarthScope’s seismometers are better at making images of deeper structures.
“It’s a technique combining local and distant earthquake data better to look at this lower crustal magma reservoir,” Huang says.
Reference:
Hsin-Hua Huang, Fan-Chi Lin, Brandon Schmandt, Jamie Farrell, Robert B. Smith, Victor C. Tsai. The Yellowstone magmatic system from the mantle plume to the upper crust. Science, 2015 DOI: 10.1126/science.aaa5648
Note: The above story is based on materials provided by University of Utah.
Researchers map genomes of woolly mammoths, raising possibility of bringing them back
An international team of researchers has sequenced the nearly complete genome of two Siberian woolly mammoths — revealing the most complete picture to date — including new information about the species’ evolutionary history and the conditions that led to its mass extinction at the end of the Ice Age.
“This discovery means that recreating extinct species is a much more real possibility, one we could in theory realize within decades,” says evolutionary geneticist Hendrik Poinar, director of the Ancient DNA Centre at McMaster University and a researcher at the Institute for Infectious Disease Research, the senior Canadian scientist on the project.
“With a complete genome and this kind of data, we can now begin to understand what made a mammoth a mammoth — when compared to an elephant — and some of the underlying causes of their extinction which is an exceptionally difficult and complex puzzle to solve,” he says.
While scientists have long argued that climate change and human hunting were major factors behind the mammoth’s extinction, the new data suggests multiple factors were at play over their long evolutionary history.
Researchers from McMaster, Harvard Medical School, the Swedish Museum of Natural History, Stockholm University and others produced high-quality genomes from specimens taken from the remains of two male woolly mammoths, which lived about 40,000 years apart.
One had lived in northeastern Siberia and is estimated to be nearly 45,000 years old. The other -believed to be from one of the last surviving mammoth populations — lived approximately 4,300 years ago on Russia’s Wrangel Island, located in the Arctic Ocean.
“We found that the genome from one of the world’s last mammoths displayed low genetic variation and a signature consistent with inbreeding, likely due to the small number of mammoths that managed to survive on Wrangel Island during the last 5,000 years of the species’ existence,” says Love Dalén, an associate professor of Bioinformatics and Genetics at the Swedish Museum of Natural History.
Scientists used sophisticated technology to tease bits and pieces of highly fragmented DNA from the ancient specimens, which they then used to sequence the genomes. Through careful analysis, they determined the animal populations had suffered and recovered from a significant setback roughly 250,000 to 300,000 years ago. However, say researchers, another severe decline occurred in the final days of the Ice Age, marking the end.
“The dates on these current samples suggest that when Egyptians were building pyramids, there were still mammoths living on these islands,” says Poinar. “Having this quality of data can help with our understanding of the evolutionary dynamics of elephants in general and possible efforts at de-extinction.”
The latest research is the continuation of the pioneering work Poinar and his team began in 2006, when they first mapped a partial mammoth genome, using DNA extracted from carcasses found in permafrost in the Yukon and Siberia.
The study is published online in the Cell Press journal Current Biology.
Video
Reference:
Palkopoulou et al. Complete genomes reveal signatures of demographic and genetic declines in the woolly mammoth. Current Biology, 2015 DOI: 10.1016/j.cub.2015.04.007
Note: The above story is based on materials provided by McMaster University. The original article was written by Michelle Donovan.
Looking to fossils to predict tooth evolution in rodents

Fifty million years ago, all rodents had short, stubby molars–teeth similar to those found in the back of the human mouth, used for grinding food. Over time, rodent teeth progressively evolved to become taller, and some rodent species even evolved continuously growing molar teeth. A new study publishing April 23 in the journal Cell Reports predicts that most rodent species will have ever-growing molars in the far distant future.
“Our analyses and simulations point towards a gradual evolution of taller teeth, and in our future studies we will explore whether tinkering with the genetic mechanisms of tooth formation in lab mice–which have short molar teeth–will replicate the evolution of taller teeth,” says co-senior author Ophir Klein, an associate professor at the University of California San Francisco School of Dentistry.
For their research, Dr. Klein and his colleagues used fossil data from thousands of extinct rodent species to study the evolution of dental stem cells, which are required for continuous tooth growth. They found evidence that most of the species possess the potential for acquiring dental stem cells, and that the final developmental step on the path toward continuously growing teeth may be quite small. “Just studying how molars become taller should tell us about the first steps in the arrival of stem cells,” Klein says.
The team’s computer simulations predict that rodents with continuously growing teeth and active stem cell reserves will eventually outcompete all other rodent species, whose teeth have a finite length. This won’t likely apply to people, however.
“As we humans have short teeth, evolutionarily speaking we would have to go through multiple steps that would take millions of years before we could acquire continuously growing teeth. Obviously, this is not something that would happen as long as we cook our food and don’t wear down our teeth,” says co-senior author Jukka Jernvall, an evolutionary biologist at the University of Helsinki, in Finland. “However, regarding rodents, it will be interesting to resolve the regional and taxonomic details of the 50 million year trend.”
Reference:
Mushegyan et al. Continuously growing rodent molars result from a predictable quantitative evolutionary change over 50 million years. Cell Reports, 2015 DOI: 10.1016/j.celrep.2015.03.064
Note: The above story is based on materials provided by Cell Press.
Catalina Island’s slow sink—and potential tsunami hazard
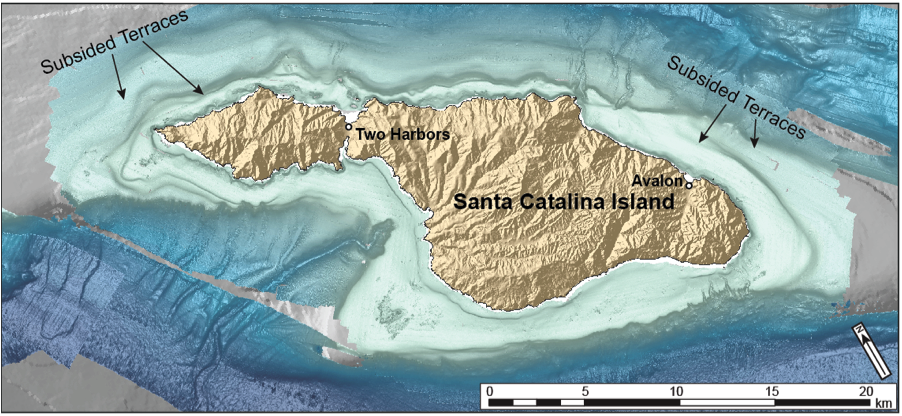
New images of ancient, underwater beach terraces around Santa Catalina Island suggest that the island is sinking, probably as a result of changes in the active fault systems around the island. At the rate that can be calculated so far, the island could disappear within three million years, as it is sinking approximately one foot every thousand years.
Chris Castillo of Stanford University and colleagues used a sort of underwater “ultrasound” called seismic reflection profiling to map out the traces of submerged marine terraces around the island, which correspond to beaches cut around the island at different sea levels. Although sea level around the island hasn’t dropped below 130 meters over the last 1 million years, the lowest level terraces are found at more than 350 meters, suggesting the island itself has sunk about 220 meters since these deepest terraces were formed.
There are several faults around the island, dominantly strike-slip to the northeast and a transtensional fault to the island’s southwest side. Within the last one million years, the researchers say, changes have happened within this fault system so that one portion of the system has “shut off” while another has become more active and allowed the island to subside. Knowing more about the exact timing and placement of this change could help scientists understand more about the potential seismic risks across fault systems in southern California. The researchers also found evidence of old landslides along a fault on the island that points toward Los Angeles, according to Castillo, which could indicate that the island may pose a small tsunami risk for the city if such landslides occur again.
Castillo will present his research at the annual meeting of the Seismological Society of America (SSA) in Pasadena, Calif.
Note : The above story is based on materials provided by Seismological Society of America.
Calbuco Volcano Eruption
The Calbuco volcano erupted Wednesday for the first time in over 40 years, billowing a huge ash cloud over a sparsely populated, mountainous area in southern Chile. Authorities ordered the evacuation of the 1,500 inhabitants of the nearby town of Ensenada, along with residents of two smaller communities.
Video Provided by: Rodrigo Barrera
Spectacular Calbuco voulcano eruption in Chile
The Calbuco volcano erupted Wednesday for the first time in over 40 years, billowing a huge ash cloud over a sparsely populated, mountainous area in southern Chile. Authorities ordered the evacuation of the 1,500 inhabitants of the nearby town of Ensenada, along with residents of two smaller communities.
Video Provided by: RT
Sexing Stegosaurus “Stegosaurus plates may have differed between male, female”
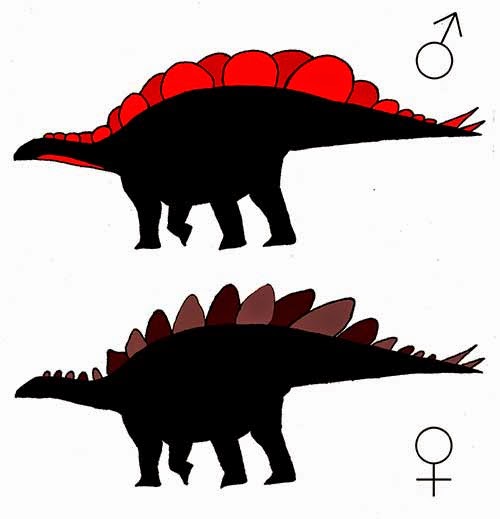
Stegosaurus, a large, herbivorous dinosaur with two staggered rows of bony plates along its back and two pairs of spikes at the end of its tail, lived roughly 150 million years ago during the Late Jurassic in the western United States.
Some individuals had wide plates, some had tall, with the wide plates being up to 45 per cent larger overall than the tall plates. According to the new study, the tall-plated Stegosaurus and the wide-plate Stegosaurus were not two distinct species, nor were they individuals of different age: they were actually males and females.
Professor Michael Benton, Director of the Masters in Palaeobiology at the University of Bristol said: “Evan made this discovery while he was completing his undergraduate thesis at Princeton University. It’s very impressive when an undergraduate makes such a major scientific discovery.
Sexual dimorphism (a term used to describe distinct anatomical differences between males and females of the same species) is common in living animals — think of the manes of lions or the antlers of deer — yet is surprisingly difficult to determine in extinct species.
Despite many previous claims of sexual dimorphism in dinosaurs, current researchers find them to be inconclusive because they do not rule out other possible explanations for why differences in anatomy might be present between fossil specimens. For example, two individuals that differ in anatomy might be two separate species, a young and an old individual, or a male and a female individual.
Having spent six summers in central Montana as part of an excavation crew digging up the first ever Stegosaurus ‘graveyard’, Evan Saitta was able to test these alternative explanations and others in the species Stegosaurus mjosi.
The group of dinosaurs excavated in Montana demonstrated the coexistence of individuals that only varied in their plates. Other skeletal differences indicating separation of ecological niches would have been expected if the two were different species.
The study also found that the two varieties were not a result of growth. CT scanning at Billings Clinic in Montana, as well as thin sections sampled from the plates for microscope analysis, showed that the bone tissues had ceased growing in both varieties. Neither type of plate was in the process of growing into the other.
With other possibilities ruled out, the best explanation for the two varieties of plates is that one type belonged to males and the other, females.
Speculating about which is which, Evan Saitta said: “As males typically invest more in their ornamentation, the larger, wide plates likely came from males. These broad plates would have provided a great display surface to attract mates. The tall plates might have functioned as prickly predator deterrents in females.”
Stegosaurus may not have been the only dinosaur to exhibit sexual dimorphism. Other species showed extra-large crests or nose horns, which were potentially sexual features. Male animals often fight or display for mates, just like red deer or peacocks today.
Not only does Saitta’s work show that dinosaurs exhibited sexual dimorphism, it suggests that the ornamentation of at least some species was used for sexual display.
The presence of sexual dimorphism in an extinct species can provide scientists with a much clearer picture of its behaviour than would otherwise be possible.
Reference:
Saitta ET (2015). Evidence for Sexual Dimorphism in the Plated Dinosaur Stegosaurus mjosi (Ornithischia, Stegosauria) from the Morrison Formation (Upper Jurassic) of Western USA. PLoS ONE, 2015 DOI: 10.1371/journal.pone.0123503
Note: The above story is based on materials provided by University of Bristol.
Magma intrusion is likely source of Colombia-Ecuador border quake swarms
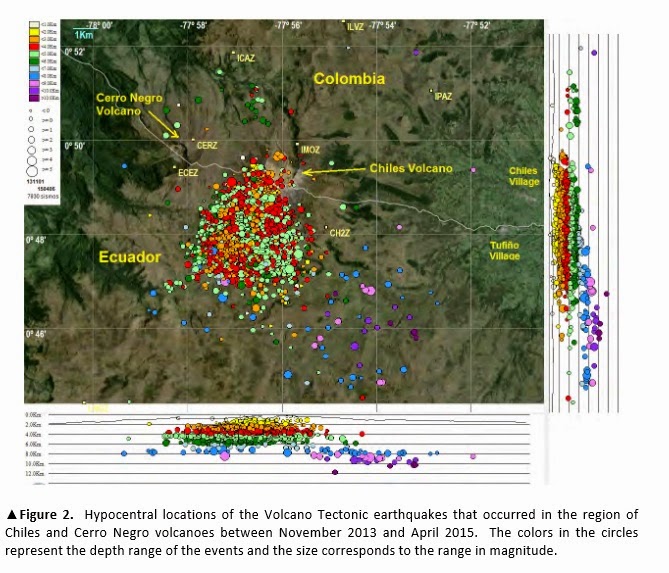
The “seismic crisis” around the region of the Chiles and Cerro Negro de Mayasquer volcanoes near the Columbia-Ecuador border is likely caused by intruding magma, according to a report by R. Corredor Torres of the Servicio Geológico Colombiano and colleagues presented at the annual meeting of the Seismological Society of America (SSA).
The intruding magma appears to be interacting with the regional tectonics to spawn micro-earthquakes, which at their peak of activity numbered thousands of micro-earthquakes each day. Most of the earthquakes were less than magnitude 3, although the largest quake to date was magnitude 5.6 that took place in October 2014. When the earthquake swarms began in 2013, the Colombian Servicio Geológico Colombiano and the Ecuadoran Instituto Geofísico of the Escuela Politécnica Nacional collaborated to set up a monitoring system to observe the swarms and judge the risk of volcanic eruption for the surrounding population.
The largest perceived threat of eruption came in the fall of 2014, when the activity level was changed from yellow to orange, meaning a probable occurrence of eruption in days to weeks. Due to the occurrence of a magnitude 5.6 earthquake and subsequent aftershocks, some houses in the area were damaged and local residents decided to sleep in tents to feel safe, accepting support from the Colombian Disaster Prevention Office, said Torres.
Data collected by the new monitoring stations suggest that most of the earthquakes in the area are of a type of volcano-tectonic quakes, which occur when the movement of magma-and the fluids and gases it releases-creates pressure changes in the rocks above. Based on the seismic activity in the area, the researchers infer that millions of cubic meters of magma have moved into the area deep under the Chile and Cerro Negro volcanoes. However, both volcanoes appear to have been dormant for at least 10,000 years, and the tectonic stress in the region is compressive–both of which may be holding the magma back from erupting to the surface. So far, there have been no signs of ground swelling or outgassing at the surface, and the rate of earthquakes has slowed considerably this year from its peak of 7000 — 8000 micro-quakes per day in the fall of 2014.
Note: The above story is based on materials provided by Seismological Society of America.
More Americans at risk from strong earthquakes, says new report

More than 143 million Americans living in the 48 contiguous states are exposed to potentially damaging ground shaking from earthquakes, with as many as 28 million people likely to experience strong shaking during their lifetime, according to research discussed at the annual meeting of Seismological Society of America. The report puts the average long-term value of building losses from earthquakes at $4.5 billion per year, with roughly 80 percent of losses attributed to California, Oregon and Washington.
“This analysis of data from the new National Seismic Hazard Maps reveals that significantly more Americans are exposed to earthquake shaking, reflecting both the movement of the population to higher risk areas on the west coast and a change in hazard assessments,” said co-author Bill Leith, senior science advisor at USGS. By comparison, FEMA estimated in 1994 that 75 million Americans in 39 states were at risk from earthquakes.
Kishor Jaiswal, a research contractor with the U.S. Geological Survey (USGS), presented the research conducted with colleagues from USGS, FEMA and California Geological Survey. They analyzed the 2014 National Seismic Hazard Maps and the latest data on infrastructure and population from LandScan, a product of Oak Ridge National Laboratory.
The report focuses on the 48 contiguous states, where more than 143 million people are exposed to ground motions from earthquakes, but Leith noted that nearly half the U.S. population, or nearly 150 million Americans, are at risk of shaking from earthquakes when Alaska, Puerto Rico and Hawaii are also considered.
In the highest hazard zones, where 28 million Americans will experience strong shaking during their lifetime, key infrastructure could also experience a shaking intensity sufficient to cause moderate to extensive damage. The analysis identified more than 6,000 fire stations, more than 800 hospitals and nearly 20,000 public and private schools that may be exposed to strong ground motion from earthquakes.
Using the 2010 Census data and the 2012 replacement cost values for buildings, and using FEMA’s Hazus program, researchers calculated systematically the losses that could happen on any given year, ranging from no losses to a very high value of loss. However, the long-term average loss to the buildings in the contiguous U.S. is $4.5 billion per year, with most financial losses occurring in California, Oregon and Washington states.
“Earthquakes remain an important threat to our economy,” said Jaiswal. “While the west coast may carry the larger burden of potential losses and the greatest threat from the strongest shaking, this report shows that the threat from earthquakes is widespread.”
Note: The above story is based on materials provided by Seismological Society of America.