It may seem unlikely that a large earthquake would take place hundreds of kilometers away from a tectonic plate boundary, in areas with low levels of strain on the crust from tectonic motion. But major earthquakes such as the Mw 7.9 2008 Chengdu quake in China and New Zealand’s 2011 Mw 6.3 quake have shown that large earthquakes do occur and can cause significant infrastructure damage and loss of life. So what should seismologists look for if they want to identify where an earthquake might happen despite the absence of historical seismic activity?
Roger Bilham of the University of Colorado shows that some of these regions had underlying features that could have been used to identify that the region was not as “aseismic” as previously thought. Some of these warning signs include debris deposits from past tsunamis or landslides, ancient mid-continent rifts that mark the scars of earlier tectonic boundaries, or old fault scarps worn down by hundreds or thousands of years of erosion.Earth’s populated area where there is no written history makes for an enormous “search grid” for earthquakes. For example, the Caribbean coast of northern Colombia resembles a classic subduction zone with the potential for tsunamigenic M>8 earthquakes at millennial time scales, but the absence of a large earthquake since 1492 is cause for complacency among local populations.
These areas are not only restricted to the Americas. Bilham notes that in many parts of Asia, where huge populations now reside and critical facilities exist or are planned, a similar historical silence exists. Parts of the Himalaya and central and western India that have not had any major earthquake in more than 500 years could experience shaking at levels and durations that are unprecedented in their written histories.
It’s the first thing that geologist Todd Halihan asks on a sunny spring afternoon at Oklahoma State University in Stillwater: “Did you feel the earthquake? My mother-in-law just called to complain that the house was shaking.”
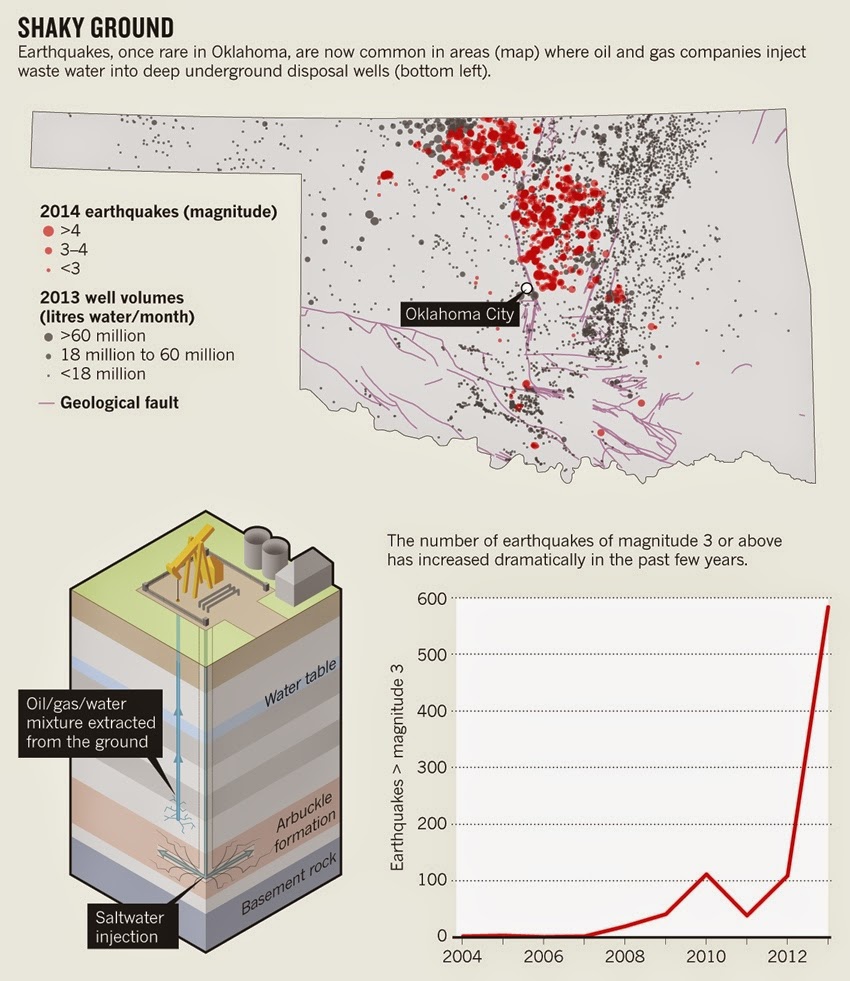
Halihan’s mother-in-law has been calling a lot lately. Fifteen quakes of magnitude 4 or greater struck in 2014 — packing more than a century’s worth of normal seismic activity for the state into a single year. Oklahoma had twice as many earthquakes last year as California — a seismic hotspot — and researchers are racing to understand why before the next major one strikes.
Whatever they learn will apply to seismic hazards worldwide. Oklahoma’s quakes have been linked to underground wells where oil and gas operations dispose of waste water, but mining, geothermal energy and other underground explorations have triggered earthquakes from South Africa to Switzerland. This week, at a meeting of the Seismological Society of America in Pasadena, California, scientists will discuss how the risk from human-induced quakes differs from that of natural quakes — and how society can prepare for it.
In Oklahoma, the earthquakes have unleashed a frenzy of finger-pointing, with angry residents suing oil and gas companies over damage to their homes. The industry and politicians are locked in fierce debates about whether the quakes are induced, but the unprecedented shaking across central and northern parts of the state matches almost exactly with the activity of water-disposal wells. “There are some who will argue that it is purely natural,” says Halihan. “But by now it’s pretty clear it’s not.”
Companies drill into the ground to extract oil and gas mixed with salt water, essentially the brine from a long-fossilized sea. They separate out the fuels and then inject the salt water into deep disposal wells (there are more than 4,600 in Oklahoma). State regulations require that the salt water be disposed of in rock layers below those that hold drinking water.
Stress fracture
Much of the liquid ends up in a rock formation called the Arbuckle, which underlies much of Oklahoma and is known for its ability to absorb huge volumes of water. But in many places the Arbuckle rests on brittle, ancient basement rocks, which can fracture along major faults under stress. “The deeper you inject, the more likely it is that the injected brine is going to make its way into a seismogenic fault zone, prone to producing earthquakes,” says Arthur McGarr, who leads research on induced quakes at the US Geological Survey (USGS) in Menlo Park, California.
Oil and gas companies operate disposal wells across the central United States, and although Oklahoma stands out for the sheer volume of waste water, other states may be getting triggered earthquakes. A report in Nature Communications this week, for example, links brine injection to a series of quakes that began in November 2013 near Azle, Texas.
The basic physics of the process has been understood since the 1970s, when scientists from the USGS pumped water down a well in Rangely, Colorado, and recorded how earthquake activity rose and petered out as they varied the amount of fluid. The question now is which faults are likely to rupture in Oklahoma, and how large an earthquake they might produce.
Whether a fault breaks in an earthquake depends on how it sits in relation to the stresses that compress Earth’s crust. The movement of tectonic plates is squeezing Oklahoma from east to west, so most of the earthquakes are happening along faults oriented northwest to southeast, or northeast to southwest. Other faults are less likely to rupture, says McGarr.
The biggest earthquake ever recorded in Oklahoma was a magnitude-5.6 event near the town of Prague in November 2011, and many seismologists think that it was induced by nearby disposal wells. Theoretical work suggests that the potential size of a quake grows with the volume of fluid injected into the ground. The biggest disposal wells in Oklahoma inject more than 60 million litres of waste water each month.
Austin Holland, the state seismologist at the Oklahoma Geological Survey in Norman, estimates that the chance of another earthquake of magnitude 5 or greater striking the state in the next year is about 30%. “That is not the kind of lottery we want to win,” he says.
Oklahoma has designated buffer zones, requiring extra scrutiny for disposal wells within 10 kilometres of sites of earthquake swarms or quakes of magnitude 4 or greater. As of 18 April, operators must also prove they are not injecting into or near basement rocks, or must cut their disposal volumes by half.
Yet oil and gas companies hold great political power in Oklahoma, and regulators continue to emphasize what they call uncertainty in linking injection wells to quakes. “We felt a big quake one Friday night and I knew we had permitted a brand-new Arbuckle disposal well not three miles from my house,” said Tim Baker, director of the oil and gas division of the Oklahoma Corporation Commission, which regulates drilling, at a town-hall meeting in suburban Oklahoma City this month. “I drove to that well to inspect it on Saturday morning, and it wasn’t even turned on. That’s how complex this issue is.”
The related — and controversial — technique of hydraulic fracturing, in which water is injected into rock to open cracks so oil and gas can flow more easily, has also been linked to earthquakes, but to a much lesser extent. The fracking involves injecting less water for shorter periods of time, and has not been tied to any earthquakes greater than magnitude 4 (ref. 5).
Seismic survey
One group of geologists wants to explore exactly how disposal wells might cause earthquakes. The team hopes to find a remote corner of Oklahoma and inject fluids deep underground while monitoring seismicity, in a modern analogue to the 1970s experiments in Colorado. “It’s a very ambitious goal, but we want to do a controlled field-scale experiment,” says Ze’ev Reches, a geophysicist at the University of Oklahoma in Norman and a co-leader of the project. But with Oklahomans already on edge, it is not clear whether the team could pull off such an experiment. So far, it remains hypothetical.
For now, seismologists are just trying to keep up with the quakes. The state geological survey recently gave up naming earthquake swarms, because the quakes simply never stopped, says Amberlee Darold, an agency seismologist. (The survey used to name swarms after nearby towns; it now identifies huge swathes of continuous activity by county.)
In the 15-storey brick Earth sciences building on the University of Oklahoma campus in Norman, statues celebrate the state’s ‘wildcatters’ who made it big in oil and gas, and a well-manicured garden nearby is dedicated to their achievements. Holland and Darold labour in the building’s dark basement, compiling a database of Oklahoma’s faults and trying to make sure that every earthquake is documented.
Many scientists are worried that the state’s buildings are not constructed to standards that consider seismic risk, and are concerned about how old brick-and-mortar structures would hold up in a large earthquake. The USGS issues national seismic-hazard maps every few years, but has never included the risk from induced quakes. This year, for the first time, the agency is developing induced-seismicity hazard maps for Oklahoma and surrounding states. The first of these is likely to be out by the end of 2015, says McGarr.
In Cushing, almost 60 kilometres north of Prague, crude-oil pipelines from across the continent meet. Fences topped with razor wire are meant to protect huge oil-storage tanks from a terrorist attack, but will not help if a major earthquake strikes, says Halihan.
In the meantime, he sits and waits to hear about the next quake. If he does not want to rely on his mother-in-law, Halihan can track the tremors by watching the movement of a small brass marker pinned to his office wall. It used to shake about once a week. Now it does so almost every day.
Note : The above story is based on materials provided by Nature.
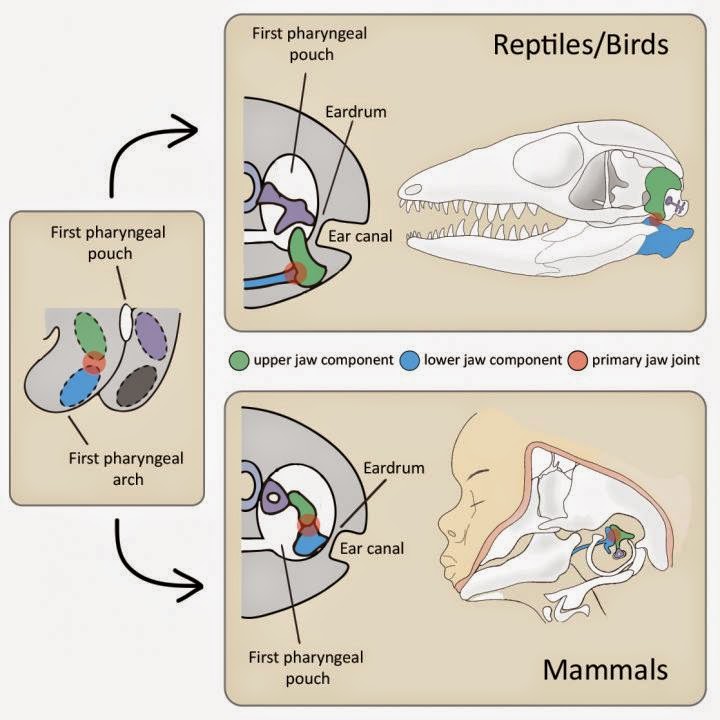
(Left) Generalized schematic showing the relative position of the first pharyngeal pouch and elements in the first pharyngeal arch. The upper (green) and lower (blue) elements in the first pharyngeal arch form the primary jaw joint (red circle). (Top) Reptiles/birds. The schematic on the left shows the eardrum forming between the first pharyngeal pouch and the ear canal. It is connected to one middle ear bone and the quadrate bone (green), which is part of the upper jaw. The schematic on the right shows these bones in a lizard with the primary jaw joint located between the upper and lower jaws. (Bottom) Mammals. The schematic on the left shows the eardrum forming between the first pharyngeal pouch and the ear canal. It is connected to the hammer bone (blue), which along with the anvil (green) make up two of the three middle ear bones. The schematic on the right shows the middle ear in a human embryo, with the primary jaw joint located within the middle ear, and the hammer (blue) connected to the lower jaw. Credit: RIKEN
Researchers at the RIKEN Evolutionary Morphology Laboratory and the University of Tokyo in Japan have determined that the eardrum evolved independently in mammals and diapsids–the taxonomic group that includes reptiles and birds. Published in Nature Communications, the work shows that the mammalian eardrum depends on lower jaw formation, while that of diapsids develops from the upper jaw. Significantly, the researchers used techniques borrowed from developmental biology to answer a question that has intrigued paleontologists for years.
The evolution of the eardrum and the middle ear is what has allowed mammals, reptiles, and birds to hear through the air. Their eardrums all look similar, are formed when the ear canal reaches the first pharyngeal pouch, and function similarly. However the fossil record shows that the middle ears in these two lineages are fundamentally different, with two of the bones that make up the mammalian middle ear–the hammer and the anvil–being homologous with parts of diapsid jawbones–the articular and quadrate. In both lineages, these bones connect at what is called the primary jaw joint.
Although scientists have suspected that the eardrum–and thus hearing–developed independently in mammals and diapsids, no hard evidence has been found in the fossil record because the eardrum is never fossilized. To overcome this difficulty, the research team and their collaborators turned to evolutionary developmental biology–or “evo-devo.” They noted that in mammals, the eardrum attaches to the tympanic ring–a bone derived from the lower jaw, but that in diapsids it attaches to the quadrate–an upper jawbone. Hypothesizing that eardrum evolution was related to these different jawbones, they performed a series of experiments that manipulated lower jaw development in mice and chickens.
First they examined eardrum development in mice that lacked the Ednra receptor, a condition known to inhibit lower jaw development. They found that these mice also lacked eardrums and ear canals, showing that their development was contingent on lower jaw formation.
Next, they used an Ednra-receptor antagonist to block proper development of the lower jaw in chickens. Rather than losing the eardrum, this manipulation created duplicate eardrums and ear canals, with the additional set forming from upper jaw components that had developed within the malformed lower jaw.
To understand how the eardrum evolved twice and why it is associated with different jaw components, the researchers looked at expression of Bapxl–a marker for the primary jaw joint–and its position relative to the first pharyngeal pouch. They found that in mouse embryos, Bapxl was expressed in cells slightly below the first pharyngeal pouch and that in chickens it was expressed considerably lower. This difference forces the eardrum to develop below the primary jaw joint in mammals, necessitating an association with the lower jaw, and above the joint in diapsids, necessitating an association with the upper jaw.
While scientists still do not know how or why the primary jaw junction shifted upwards in mammals, the study shows that the middle ear developed after this shift and must therefore have occurred independently after mammal and diapsid lineages diverged from their common ancestor. Emphasizing the importance of this evo-devo approach, Chief Scientist Shigeru Kuratani notes that, “convergent evolution can often result in structures that resemble each other so much that they appear to be homologous. But, developmental analyses can often reveal their different origins.”
For structures like the eardrum that do not fossilize, the evo-devo approach is even more important. Lead author Masaki Takechi speculates that, “this approach to studying middle ear evolution could help us understand other related evolutionary changes in mammals, including the ability to detect higher toned sounds and even our greater metabolic efficiency.”
Reference:
Kitazawa T, Takechi M, Hirasawa T, Adachi N, Narboux-Neme N, Kume H, Maeda K, Hirai T, Miyagawa-Tomita S, Kurihara Y, Hitomi J, Levi G, Kuratani S, and Kurihara H. (2015) Developmental Genetic Bases behind the Independent Origin of the Tympanic Membrane in Mammals and Diapsids. Nature Communications. DOI:10.1038/ncomms7853
Note : The above story is based on materials provided by RIKEN.
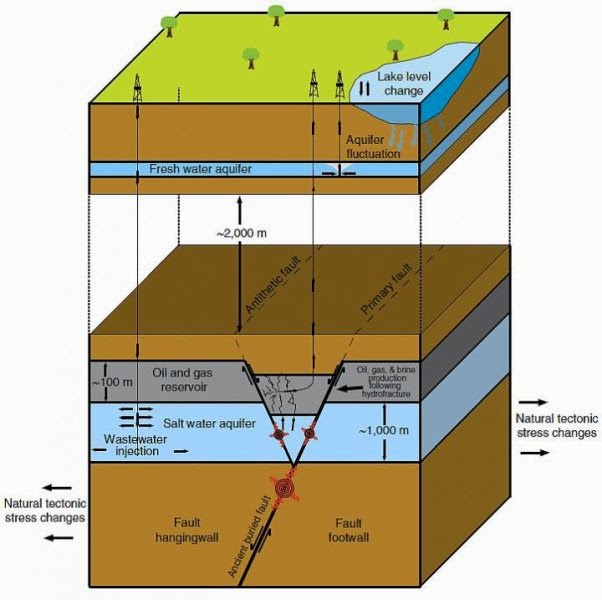
Several natural and man-made factors can influence the subsurface stress regime resulting in earthquakes. Natural ones include intraplate stress changes related to plate tectonics and natural water table or lake level variations caused by changing weather patterns or water drainage patterns over time, or advance or retreat of glaciers. Man-made include human-generated changes to the water table, including dam construction, and industrial activities involving the injection or removal of fluids from the subsurface. Credit: Nature Communications/SMU
A seismology team led by Southern Methodist University (SMU), Dallas, finds that high volumes of wastewater injection combined with saltwater (brine) extraction from natural gas wells is the most likely cause of earthquakes occurring near Azle, Texas, from late 2013 through spring 2014.
In an area where the seismology team identified two intersecting faults, they developed a sophisticated 3D model to assess the changing fluid pressure within a rock formation in the affected area. They used the model to estimate stress changes induced in the area by two wastewater injection wells and the more than 70 production wells that remove both natural gas and significant volumes of salty water known as brine.
Conclusions from the modeling study integrate a broad-range of estimates for uncertain subsurface conditions. Ultimately, better information on fluid volumes, flow parameters, and subsurface pressures in the region will provide more accurate estimates of the fluid pressure along this fault.
“The model shows that a pressure differential develops along one of the faults as a combined result of high fluid injection rates to the west and high water removal rates to the east,” said Matthew Hornbach, SMU associate professor of geophysics. “When we ran the model over a 10-year period through a wide range of parameters, it predicted pressure changes significant enough to trigger earthquakes on faults that are already stressed.”
Model-predicted stress changes on the fault were typically tens to thousands of times larger than stress changes associated with water level fluctuations caused by the recent Texas drought.
“What we refer to as induced seismicity — earthquakes caused by something other than strictly natural forces — is often associated with subsurface pressure changes,” said Heather DeShon, SMU associate professor of geophysics. “We can rule out stress changes induced by local water table changes. While some uncertainties remain, it is unlikely that natural increases to tectonic stresses led to these events.”
DeShon explained that some ancient faults in the region are more susceptible to movement — “near critically stressed” — due to their orientation and direction. “In other words, surprisingly small changes in stress can reactivate certain faults in the region and cause earthquakes,” DeShon said.
The study, “Causal Factors for Seismicity near Azle, Texas,” has been published online in the journal Nature Communications.
The study was produced by a team of scientists from SMU’s Department of Earth Sciences in Dedman College of Humanities and Sciences, the U.S. Geological Survey, the University of Texas Institute for Geophysics and the University of Texas Department of Petroleum and Geosystems Engineering. SMU scientists Hornbach and DeShon are the lead authors.
SMU seismologists have been studying earthquakes in North Texas since 2008, when the first series of felt tremors hit near DFW International Airport between Oct. 30, 2008, and May 16, 2009. Next came a series of quakes in Cleburne between June 2009 and June 2010, and this third series in the Azle-Reno area northwest of Fort Worth occurred between November 2013 and January 2014. The SMU team also is studying an ongoing series of earthquakes in the Irving-Dallas area that began in April 2014.
In both the DFW sequence and the Cleburne sequence, the operation of injection wells used in the disposal of natural gas production fluids was listed as a possible cause of the seismicity. The introduction of fluid pressure modeling of both industry activity and water table fluctuations in the Azle study represents the first of its kind, and has allowed the SMU team to move beyond assessment of possible causes to the most likely cause identified in this report.
Prior to the DFW Airport earthquakes in 2008, an earthquake large enough to be felt had not been reported in the North Texas area since 1950. The North Texas earthquakes of the last seven years have all occurred in areas developed for natural gas extraction from a geologic formation known as the Barnett Shale. The Texas Railroad Commission reports that production in the Barnett Shale grew exponentially from 216 million cubic feet a day in 2000, to 4.4 billion cubic feet a day in 2008, to a peak of 5.74 billion cubic feet of gas a day in 2012.
While the SMU Azle study adds to the growing body of evidence connecting some injection wells and, to a lesser extent, some oil and gas production to induced earthquakes, SMU’s team notes that there are many thousands of injection and/or production wells that are not associated with earthquakes.
The area of study addressed in the report is in the Newark East Gas Field (NEGF), north and east of Azle. In this field, hydraulic fracturing is applied to loosen and extract gas trapped in the Barnett Shale, a sedimentary rock formation formed approximately 350 million years ago. The report explains that along with natural gas, production wells in the Azle area of the NEGF can also bring to the surface significant volumes of water from the highly permeable Ellenburger Formation — both naturally occurring brine as well as fluids that were introduced during the fracking process.
Subsurface fluid pressures are known to play a key role in causing seismicity. A primer produced by the U.S. Department of Energy explains the interplay of fluids and faults:
“The fluid pressure in the pores and fractures of the rocks is called the ‘pore pressure.’ The pore pressure acts against the weight of the rock and the forces holding the rock together (stresses due to tectonic forces). If the pore pressures are low (especially compared to the forces holding the rock together), then only the imbalance of natural in situ earth stresses will cause an occasional earthquake. If, however, pore pressures increase, then it would take less of an imbalance of in situ stresses to cause an earthquake, thus accelerating earthquake activity. This type of failure…is called shear failure. Injecting fluids into the subsurface is one way of increasing the pore pressure and causing faults and fractures to “fail” more easily, thus inducing an earthquake. Thus, induced seismicity can be caused by injecting fluid into the subsurface or by extracting fluids at a rate that causes subsidence and/or slippage along planes of weakness in the earth.”
All seismic waveform data used in the compilation of the report are publically available at the IRIS Data Management Center. Wastewater injection, brine production and surface injection pressure data are publicly available at the Texas Railroad Commission (TRC). Craig Pearson at the TRC, Bob Patterson from the Upper Trinity Groundwater Conservation District; scientists at XTO Energy, ExxonMobil, MorningStar Partners and EnerVest provided valuable discussions and, in some instances, data used in the completion of the report.
“This report points to the need for even more study in connection with earthquakes in North Texas,” said Brian Stump, SMU’s Albritton Chair in Earth Sciences. “Industry is an important source for key data, and the scope of the research needed to understand these earthquakes requires government support at multiple levels.”
Reference:
Matthew J. Hornbach, Heather R. DeShon, William L. Ellsworth, Brian W. Stump, Chris Hayward, Cliff Frohlich, Harrison R. Oldham, Jon E. Olson, M. Beatrice Magnani, Casey Brokaw, James H. Luetgert. Causal factors for seismicity near Azle, Texas. Nature Communications, 2015; 6: 6728 DOI: 10.1038/ncomms7728
Neuropeptides are small proteins in the brains of all animals that bind to receptor proteins and cause activity in cells. The researchers at Queen Mary University of London, led by Professor Maurice Elphick, were investigating whether a particular sea urchin neuropeptide was an evolutionary link between neuropeptides in humans and insects.
The last common ancestor of humans, sea urchins and insects probably lived over 600 million years ago but we’ll almost certainly never know what it looked like or even find an example of it in the fossil record but we can tell a lot about it by looking at genes and proteins in its evolutionary descendants.
Neuropeptide molecules are difficult to study in this way because they are small, often only a few amino acids long, much shorter than most proteins, and therefore patterns can be difficult to identify.
Dean Semmens, a PhD student at QMUL and first author of the paper said:
“The remarkable process of evolution means that molecules that once had the same function can, over hundreds of millions of years, change to control such different processes as anxiety in humans and moulting in insects.
“Despite their alien looking shape sea urchins are comparatively close relatives of humans, certainly much closer than insects. For this reason, as with this discovery, they can help us determine the evolutionary history and origins of important molecules in our brain.”
Reference:
‘Discovery of sea urchin NGFFFamide receptor unites a bilaterian neuropeptide family’ by Semmens DC, Beets I, Rowe ML, Blowes LM, Oliveri P, Elphick MR. 2015 is published in Open Biology. DOI: 10.1098/rsob.150030
Earth Day is an annual event, celebrated on April 22, on which day events worldwide are held to demonstrate support for environmental protection. It was first celebrated in 1970, and is now coordinated globally by the Earth Day Network, and celebrated in more than 192 countries each year.
In 1969 at a UNESCO Conference in San Francisco, peace activist John McConnell proposed a day to honor the Earth and the concept of peace, to first be celebrated on March 21, 1970, the first day of spring in the northern hemisphere. This day of nature’s equipoise was later sanctioned in a Proclamation written by McConnell and signed by Secretary General U Thant at the United Nations. A month later a separate Earth Day was founded by United States Senator Gaylord Nelson as an environmental teach-in first held on April 22, 1970. Nelson was later awarded the Presidential Medal of Freedom Award in recognition of his work. While this April 22 Earth Day was focused on the United States, an organization launched by Denis Hayes, who was the original national coordinator in 1970, took it international in 1990 and organized events in 141 nations. Numerous communities celebrate Earth Week, an entire week of activities focused on environmental issues.
The History of a Movement
Each year, Earth Day — April 22 — marks the anniversary of what many consider the birth of the modern environmental movement in 1970.
The height of hippie and flower-child culture in the United States, 1970 brought the death of Jimi Hendrix, the last Beatles album, and Simon & Garfunkel’s “Bridge Over Troubled Water”. Protest was the order of the day, but saving the planet was not the cause. War raged in Vietnam, and students nationwide increasingly opposed it.
At the time, Americans were slurping leaded gas through massive V8 sedans. Industry belched out smoke and sludge with little fear of legal consequences or bad press. Air pollution was commonly accepted as the smell of prosperity. “Environment” was a word that appeared more often in spelling bees than on the evening news. Although mainstream America remained oblivious to environmental concerns, the stage had been set for change by the publication of Rachel Carson’s New York Times bestseller Silent Spring in 1962. The book represented a watershed moment for the modern environmental movement, selling more than 500,000 copies in 24 countries and, up until that moment, more than any other person, Ms. Carson raised public awareness and concern for living organisms, the environment and public health.
Earth Day 1970 capitalized on the emerging consciousness, channeling the energy of the anti-war protest movement and putting environmental concerns front and center.
The Idea
The idea came to Earth Day founder Gaylord Nelson, then a U.S. Senator from Wisconsin, after witnessing the ravages of the 1969 massive oil spill in Santa Barbara, California. Inspired by the student anti-war movement, he realized that if he could infuse that energy with an emerging public consciousness about air and water pollution, it would force environmental protection onto the national political agenda. Senator Nelson announced the idea for a “national teach-in on the environment” to the national media; persuaded Pete McCloskey, a conservation-minded Republican Congressman, to serve as his co-chair; and recruited Denis Hayes as national coordinator. Hayes built a national staff of 85 to promote events across the land.
As a result, on the 22nd of April, 20 million Americans took to the streets, parks, and auditoriums to demonstrate for a healthy, sustainable environment in massive coast-to-coast rallies. Thousands of colleges and universities organized protests against the deterioration of the environment. Groups that had been fighting against oil spills, polluting factories and power plants, raw sewage, toxic dumps, pesticides, freeways, the loss of wilderness, and the extinction of wildlife suddenly realized they shared common values.
Earth Day 1970 achieved a rare political alignment, enlisting support from Republicans and Democrats, rich and poor, city slickers and farmers, tycoons and labor leaders. The first Earth Day led to the creation of the United States Environmental Protection Agency and the passage of the Clean Air, Clean Water, and Endangered Species Acts. “It was a gamble,” Gaylord recalled, “but it worked.”
As 1990 approached, a group of environmental leaders asked Denis Hayes to organize another big campaign. This time, Earth Day went global, mobilizing 200 million people in 141 countries and lifting environmental issues onto the world stage. Earth Day 1990 gave a huge boost to recycling efforts worldwide and helped pave the way for the 1992 United Nations Earth Summit in Rio de Janeiro. It also prompted President Bill Clinton to award Senator Nelson the Presidential Medal of Freedom (1995) — the highest honor given to civilians in the United States — for his role as Earth Day founder.
Earth Day Today
As the millennium approached, Hayes agreed to spearhead another campaign, this time focused on global warming and a push for clean energy. With 5,000 environmental groups in a record 184 countries reaching out to hundreds of millions of people, Earth Day 2000 combined the big-picture feistiness of the first Earth Day with the international grassroots activism of Earth Day 1990. It used the Internet to organize activists, but also featured a talking drum chain that traveled from village to village in Gabon, Africa, and hundreds of thousands of people gathered on the National Mall in Washington, DC. Earth Day 2000 sent world leaders the loud and clear message that citizens around the world wanted quick and decisive action on clean energy.
Much like 1970, Earth Day 2010 came at a time of great challenge for the environmental community. Climate change deniers, well-funded oil lobbyists, reticent politicians, a disinterested public, and a divided environmental community all contributed to a strong narrative that overshadowed the cause of progress and change. In spite of the challenge, for its 40th anniversary, Earth Day Network reestablished Earth Day as a powerful focal point around which people could demonstrate their commitment. Earth Day Network brought 225,000 people to the National Mall for a Climate Rally, amassed 40 million environmental service actions toward its 2012 goal of A Billion Acts of Green®, launched an international, 1-million tree planting initiative with Avatar director James Cameron and tripled its online base to over 900,000 community members.
The fight for a clean environment continues in a climate of increasing urgency, as the ravages of climate change become more manifest every day. We invite you to be a part of Earth Day and help write many more victories and successes into our history. Discover energy you didn’t even know you had. Feel it rumble through the grassroots under your feet and the technology at your fingertips. Channel it into building a clean, healthy, diverse world for generations to come.
The Earth Day name
According to Nelson, the moniker “Earth Day” was “an obvious and logical name” suggested by “a number of people” in the fall of 1969, including, he writes, both “a friend of mine who had been in the field of public relations” and “a New York advertising executive,” Julian Koenig. Koenig, who had been on Nelson’s organizing committee in 1969, has said that the idea came to him by the coincidence of his birthday with the day selected, April 22; “Earth Day” rhyming with “birthday,” the connection seemed natural. Other names circulated during preparations—Nelson himself continued to call it the National Environment Teach-In, but national coordinator Denis Hayes used the term Earth Day in his communications and press coverage of the event was “practically unanimous” in its use of “Earth Day,” so the name stuck. The introduction of the name “Earth Day” was also claimed by John McConnell (see “Equinox Earth Day,” below).
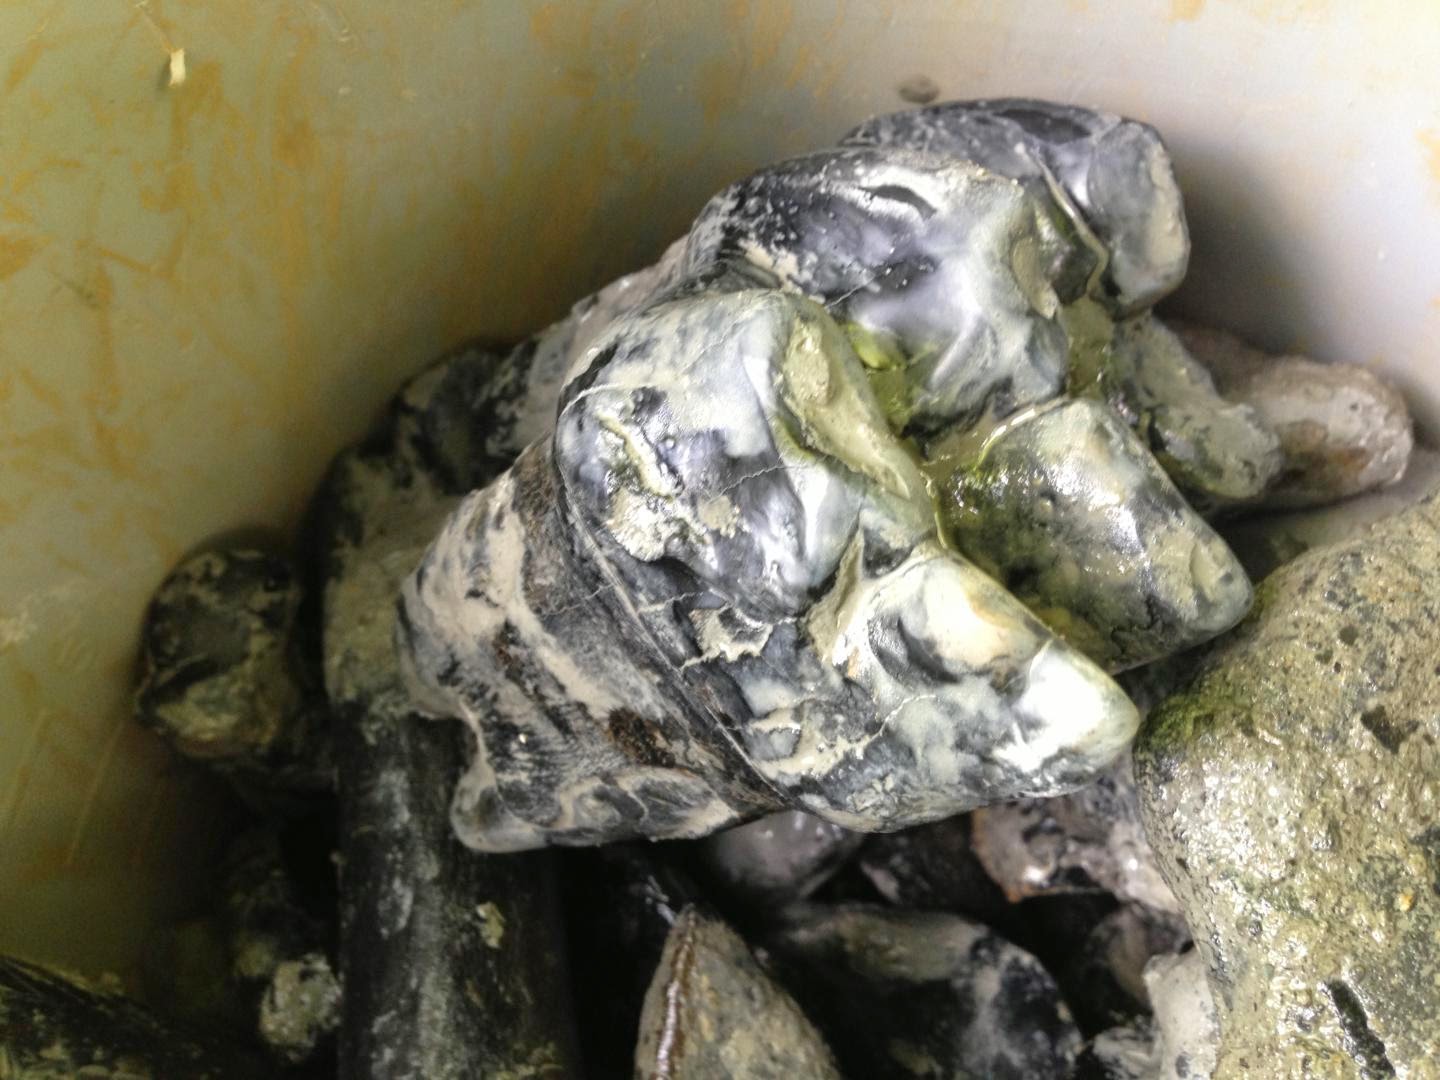
Non-soluble and soluble uranium Credit: Alain Herzog, 2015
The oceans and other water bodies contain billions of tons of dissolved uranium. Over the planet’s history, some of this uranium was transformed into an insoluble form, causing it to precipitate and accumulate in sediments. There are two ways that uranium can go from a soluble to an insoluble form: either through the action of live organisms – bacteria – or by interacting chemically with certain minerals. Knowing which pathway was taken can provide valuable insight into the evolution and activity of microbial biology over Earth’s history.
Publishing in the journal PNAS, an international team of researchers led by the Ecole Polytechnique Fédérale de Lausanne in Switzerland describes a new method that uses the isotopic composition of uranium to distinguish between these alternative pathways.
The link between bacteria and the rock record is not new. Under certain conditions, bacteria interact biochemically with dissolved ions such as sulfur, or uranium, causing them to become insoluble and precipitate, contributing to their accumulation in oceanic sediments. But for the first time, scientists can determine whether bacteria were active at the time and place the sediments were formed by analyzing tiny amounts of uranium present in sediments.
Picky electron donors
The fact that bacteria and uranium interact at all may sound somewhat surprising. But as Rizlan Bernier-Latmani, the study’s principal investigator explains, to complete certain metabolic processes, the bacteria need to get rid of electrons, and dissolved uranium just happens to be capable of taking them up. Uranium is far from being the only metal to which bacteria donate extra electrons. But once it precipitates in its insoluble form, uranium is the only metal known to date that preserves a signal that scientists can analyze to detect whether bacteria were involved in its transformation.
What makes uranium unique is that bacteria are picky when it comes to the atomic weight of the uranium to which they donate electrons. Of the two most abundant uranium isotopes found on earth – uranium-238 and uranium-235 – bacteria seem to prefer the heavier uranium-238. The chemical transformation pathway, by contrast, treats both forms of uranium equally. As a result, a slightly higher ratio between heavy and light isotopes in solid uranium extracted from the ground points at a bacterial transformation process.
The evolution of life
Being able to discriminate between both pathways gives researchers a unique tool to probe into environmental niches occupied by bacteria billions of years ago. Applying their methodology to existing data of Archean sediments from Western Australia, the authors argue that uranium found in oxygen-depleted sediments there was immobilized biologically. Bacteria, they argue, were active there already 2.5 billion years ago when the sediments were formed.
To an environmental biogeochemist like Bernier-Latmani, knowing whether or not bacteria were active at that time and place is exciting, as it could provide new insight into the planet’s chemical evolution, for example on the abundance free oxygen in the oceans and the atmosphere. “We have some understanding of how oxygen concentrations in the atmosphere and oceans evolved over time. There is increasing evidence that traces of oxygen were available already billions of years ago in an overall anoxic world – and bacteria existed that indirectly used it. These changes have a direct bearing on the evolution of life and on mass extinctions,” she says. In the complex puzzle of the planet’s early history, uranium could be holding some of the missing pieces.
The research was carried out in collaboration with researchers from the Institute of Mineralogy at Leibniz University in Hannover, Germany, and the School of Earth and Space Exploration at Arizona State University in Arizona, USA.
Edited by Donald E. Canfield, Institute of Biology and Nordic Center for Earth Evolution, University of Southern Denmark, Odense M., Denmark, and approved March 23, 2015
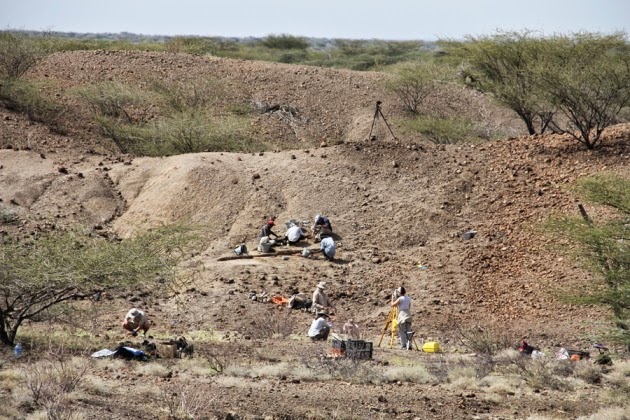
Excavators at Lomekwi, Kenya, in 2011. Credit: MPK/WTAP
The oldest stone tools on record may spell the end for the theory that complex toolmaking began with the genus Homo, to which humans belong. The 3.3-million-year-old artefacts, revealed at a conference in California last week, predate the first members of Homo, and suggest that more-ancient hominin ancestors had the intelligence and dexterity to craft sophisticated tools.
“This is a landmark discovery pertaining to one of the key evolutionary milestones,” says Zeresenay Alemseged, a palaeoanthropologist at the California Academy of Sciences in San Francisco, who attended the talk at the annual meeting of the Paleoanthropology Society in San Francisco, on 14 April.
More than 80 years ago, anthropologist Louis Leakey found stone tools in Olduvai Gorge in Tanzania. Decades later, he and his wife Mary and their team found bones from a species that the Leakeys named Homo habilis — ‘the handy man’. This led to the prevailing view that human stone-tool use began with Homo, a group that includes modern humans and their big-brained and tall forebears. The oldest of these Oldowan tools date to 2.6 million years ago — around the time of the earliest Homo fossils. Climate upheavals that transformed dense forest into open savannah might have catalysed ancient humans into developing the new technology so that they could hunt or scavenge grass-eating animals, the theory goes.
Chimpanzees and other non-human primates use stones to crack nuts, for instance, but their tools lack the craftsmanship of the Oldowan toolmakers, who would strike one rock against another, breaking off flakes to leave a sharp-edged stone core.
In 2010, Alemseged and his team reported an intriguing find at a site called Dikika in Ethiopia (S. P. McPherron et al. Nature 466, 857–860; 2010). They saw cut marks on bones from 3.4 million years ago, when ape-like creatures such as Australopithecus afarensis — the same species as the famous fossil called Lucy — roamed eastern Africa. This hinted at even earlier manufacturing of stone tools. Other researchers questioned the find, attributing the marks to natural wear and tear such as trampling, or bites inflicted by crocodiles.
Aware of this controversy, a team led by Sonia Harmand of Stony Brook University in New York set out in 2011 to find tools older than 3 million years, at a site west of Kenya’s Lake Turkana. On a July day, the team took a wrong turn and happened upon a patch of land that seemed worth exploring. By tea time, they had found pieces of rock lying on the ground that looked like flakes left over from the manufacture of stone tools. Careful excavation of the patch revealed 19 buried artefacts, including stone core forms, and dozens more on the surface. One key surface find was a small rock flake, which fitted in a gap in a buried core as snugly as a jigsaw puzzle piece, confirming that the tools were made through a flaking process.
The tools come from sediments that Harmand’s team dated to around 3.3 million years ago and are much larger than the Oldowan artefacts: some weigh as much as 15 kilograms. The team concluded that the tools represent a distinct culture, which they have named the Lomekwian culture after the site where the implements were found. “Lomekwi marks a new beginning to the known archaeological record,” Harmand said at the meeting.
Hominin fossils and cut-marked animal bones have not been found at the site, so the team cannot yet say who made the tools or how they were used. But their discovery may deliver a fatal blow to the already fragile idea that complex toolmaking began with Homo. Harmand suggests that earlier species, such as Kenyanthropus platyops, bones of which have been found on the western shore of Lake Turkana, and A. afarensis, may have made tools by building on the cruder abilities seen in apes and monkeys. The Lomekwi tools were made in a forest environment, also questioning the idea that open landscapes catalysed tool use, said Harmand.
Alemseged sees the Lomekwi tools as vindication for his team’s controversial find of cut-marked bones. Before Harmand’s presentation, Alemseged’s colleague Jessica Thompson, an archaeologist at Emory University in Atlanta, Georgia, presented an analysis of other animal bones from Dikika. None contained similar patterns to those reported in 2010, suggesting that the marks were made by something other than wear and tear — probably by tools.
The Lomekwi talk left David Braun, an archaeologist at George Washington University in Washington DC, itching for further details. He says that the tools look authentic, as does the date that Harmand and her team assert. The identity of their makers has aroused his curiosity: “What the hell do these things look like if they can use 15-kilogram tools?”
But he is most interested in what the Lomekwi tools meant for their creators. Did they offer an advantage over the other hominins that were around at the time, or was toolmaking more common 3 million to 4 million years ago than existing evidence suggests? “They’re a game-changer,” he adds, “no matter what.”
Note : The above story is based on materials provided by Nature.
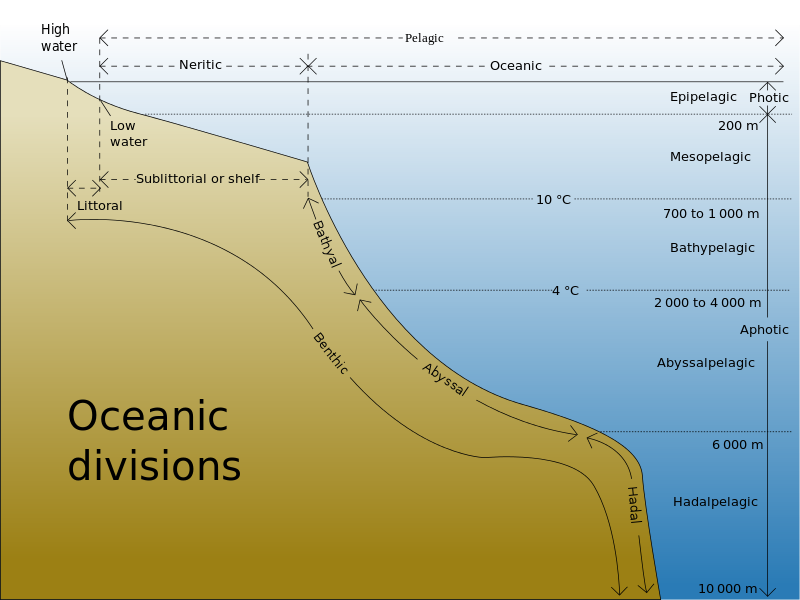
Diagram showing the divisions of the worlds oceans. Credit: Chris huh
Large amounts of methane – whether as free gas or as solid gas hydrates – can be found in the sea floor along the ocean shores. When the hydrates dissolve or when the gas finds pathways in the sea floor to ascend, the methane can be released into the water and rise to the surface. Once emitted into the atmosphere, it acts as a very potent greenhouse gas twenty times stronger than carbon dioxide. Fortunately, marine bacteria exist that consume part of the methane before it reaches the water surface. Geomicrobiologists and oceanographers from Switzerland, Germany, Great Britain and the U.S. were able to show in an interdisciplinary study that ocean currents can have a strong impact on this bacterial methane removal. Nature Geoscience has published the study today.
The data was collected during an expedition in the summer of 2012 aboard the research vessel MARIA S. MERIAN. At that time, the international research team was studying the methane seeps off the west coast of the Norwegian Svalbard archipelago. “Already then, we were able to see that the level of activity of the methane consuming bacteria changed drastically over very short time spans, while at the same time many oceanographic parameters such as water temperature and salinity also changed”, explains Lea Steinle, first-author of the study and PhD student at the University of Basel and the GEOMAR Helmholtz Centre for Ocean Research Kiel. For her PhD thesis, Steinle studies where and how much methane is consumed in the ocean water column by bacteria.
In order to test if the fluctuations measured during the four weeks of the expedition were only random observations or based on typical and recurring processes, oceanographers of the GEOMAR later took a closer look at the region with a high resolution ocean model. “We were able to see that the observed fluctuations of the oceanographic data and the activity level of the bacteria can be traced back to recurring shifts in the West Spitsbergen Current”, says Prof. Dr. Arne Biastoch from the GEOMAR. The West Spitsbergen Current is a relatively warm, salty current that carries water from the Norwegian Sea to the Arctic Ocean. “It mostly runs very close to the coast. Shifts in the current strength are responsible for the meandering of the current. Then, in a matter of a few days, the current moves miles away from the coast”, explains Professor Biastoch further.
If the current runs directly over the methane seeps near the coast or continues on the open sea, impacts the methane filtration. “We were able to show that strength and variability of ocean currents control the prevalence of methanotrophic bacteria”, says Lea Steinle, “therefore, large bacteria populations cannot develop in a strong current, which consequently leads to less methane consumption.”
In order to verify if these results are only valid for Spitsbergen or are of global importance, the researchers studied in a second, global ocean model how ocean currents are varying in other regions of the world with methane seeps. “We saw that strong and fluctuating currents are often found above methane seeps”, says Dr. Helge Niemann, biogeochemist at the University of Basel and one of the initiator of the study. His colleague Prof. Dr. Tina Treude, geomicrobiologist at the University of California Los Angeles adds: “This clearly shows that one-time or short-term measurements often only give us a snapshot of the whole situation.” In the future, fluctuations of bacterial methane consumption caused by oceanographic parameters will have to be considered, both during field measurements as well as models.
Reference:
Water column methanotrophy controlled by a rapid oceanographic switch, Nature Geoscience, DOI: 10.1038/ngeo2420
A team of specialists from four Australian universities, including The University of Western Australia, has established the exact source of a diamond-bearing rock for the first time.
These rocks, orangeites, are already commonly found in South Africa. However, the new study now reveals that they may be present in much higher abundance worldwide, including in Australia.
While rough on the outside, orangeites contain not only treasured diamonds but also tiny fragments of mantle and crustal rocks. By using highly sophisticated geochemical and isotopic analytical techniques, the scientists were able to link those fragments to the source of the orangeites, deep in the interior of the planet.
The work was carried out by Associate Professor Marco Fiorentini from UWA’s Centre for Exploration Targeting and the ARC Centre of Excellence for Core to Crust Fluid Systems, and colleagues from a team of Australian universities.
“We found strong evidence that orangeites are sourced from MARID (Mica-Amphibole-Rutile-Ilmenite-Diopside) mantle, which up until recently had only been recognised in South Africa,” Professor Fiorentini said. “However, ongoing studies suggest that MARID mantle may occur in other continents, including here in Australia.”
The team found that orangeites were formed from lava produced by massive volcanic eruptions several tens of millions of years ago. “With such an ancient age perhaps diamonds truly are forever,” joked Professor Fiorentini. “What is certain is that the new study provides key information about the composition of the deep Earth.
“Orangeites are the solidified product of lavas from explosive volcanic eruptions, forming shallow craters and rock-filled fractures (or diatremes) in the Earth’s crust. Diatremes breach the Earth’s surface and produce a steep inverted cone shape, where diamonds are usually found.”
The team presented its findings on the composition of the source that generated orangeites in a paper published online today in Nature Communications.
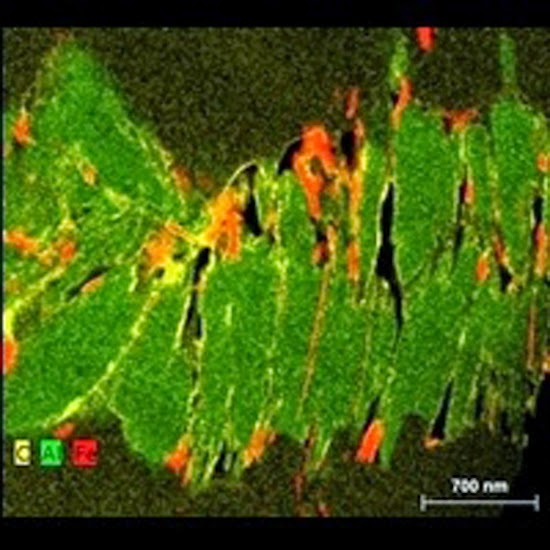
Elemental map of a cross section through a pseudofossil. It can be seen that the artefact consists of a complex stack of plate like aluminium-rich clay minerals (green, stacked from left to right). Some of these are coated with later generation of carbon (yellow) and iron (red) giving the false impression of cellular compartments. Credit: University of Western Australia
New analysis of world-famous 3.46 billion-year-old rocks by researchers from The University of Western Australia is set to finally resolve a long-running evolutionary controversy.
The new research, published this week in Proceedings of the National Academy of Sciences USA, shows that structures once thought to be Earth’s oldest microfossils do not compare with younger fossil candidates but have, instead, the character of peculiarly shaped minerals.
In 1993, US scientist Bill Schopf described tiny (c. 0.5-20 micrometres wide), carbon-rich filaments within the 3.46 billion-year-old Apex chert from the Pilbara region of Western Australia, which he likened to certain forms of bacteria, including cyanobacteria. (Chert is fine-grained, silica-rich sedimentary rock.)
These ‘Apex chert microfossils’ soon became enshrined in textbooks, museums displays, popular science books and online reference guides as the earliest evidence for life on Earth. In 1996, these structures were even used to test and help refute the case against ‘microfossils’ in the Martian meteorite ALH 84001.
Even so, their curious colour and complexity gave rise to some early questions. Gravest doubts emerged in 2002, when a team led by Martin Brasier of Oxford University (co-author of this current study) revealed that the host rock was not part of a simple sedimentary unit but rather came from a complex, high-temperature hydrothermal vein, with evidence for multiple episodes of subsurface fluid flow over a long time. His team advanced an alternative hypothesis, stating that these curious structures were not true microfossils but pseudofossils formed by the redistribution of carbon around mineral grains during these hydrothermal events.
Although other research teams have since supported the hydrothermal context of Brasier, the ‘Apex microfossil’ debate has remained hard to resolve because scientific instrumentation has only recently reached the level of resolution needed to map both chemical composition and morphology of these ‘microfossils’ at the sub-micrometre scale.
Now scientists based in UWA’s Centre for Microscopy, Characterisation and Analysis, in collaboration with the late Professor Brasier, have come up with new high-spatial resolution data that clearly demonstrate that the ‘Apex chert microfossils’ comprise stacks of plate-like clay minerals arranged into branched and tapered worm-like chains. Carbon was then absorbed on to the edges of these minerals during the circulation of hydrothermal fluids, giving a false impression of carbon-rich cell-like walls.
UWA researchers Dr David Wacey and Professor Martin Saunders used transmission electron microscopy to examine ultrathin slices of ‘microfossil’ candidates, to build up nanoscale maps of their size, shape, mineral chemistry and distribution of carbon.
Dr Wacey said it soon became clear that the distribution of carbon was unlike anything seen in authentic microfossils. “A false appearance of cellular compartments is given by multiple plates of clay minerals having a chemistry entirely compatible with a high temperature hydrothermal setting,” he said.
“We studied a range of authentic microfossils using the same transmission electron microscopy technique and in all cases these reveal coherent, rounded envelopes of carbon having dimensions consistent with their origin from cell walls and sheaths. At high spatial resolution, the Apex ‘microfossils’ lack all evidence for coherent, rounded walls. Instead, they have a complex, incoherent spikey morphology, evidently formed by filaments of clay crystals coated with iron and carbon.”
Before his death Professor Brasier said: “This research should, at long last, provide a closing chapter for the ‘Apex microfossil’ debate. Such discussions have encouraged us to refine both the questions and techniques needed to search for life remote in time and space, including signals from Mars or beyond. It is hoped that textbooks and websites will now focus upon recent and more robust discoveries of microfossils of a similar age from Western Australia, also examined by us in the same article.”
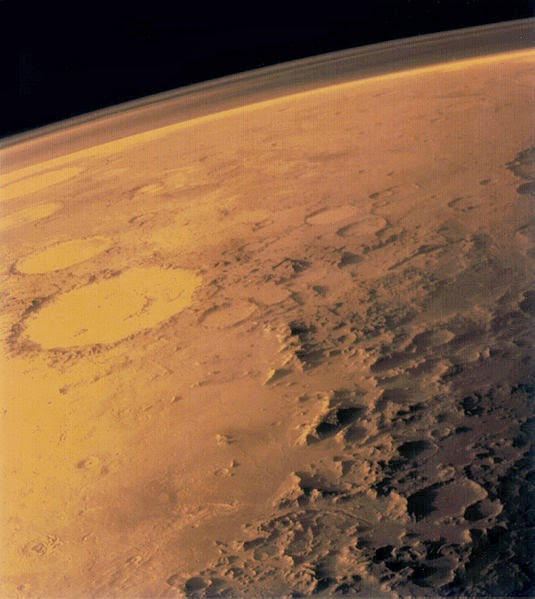
An international group of specialists in the field of planetary sciences has found strong evidence that lava flows on Mars may also host base and precious metals.
The Martian surface geology is dominated by volcanic rocks, which are broadly similar to ancient lava flows on earth, such as komatiites and ferropicrites.
On Earth, these rocks are significant hosts of precious and base metals such as nickel, copper and the immensely valuable platinum group elements.
In a paper published online today in Ore Geology Reviews Professor Marco Fiorentini and Ph.D. researcher Raphael Baumgartner, from the Centre for Exploration Targeting (CET) at The University of Western Australia and the ARC Centre of Excellence for Core to Crust Fluid Systems (CCFS), together with an international group, present their findings on whether lava flows on the Red Planet also host base and precious metals.
“We found strong evidence that mechanisms crucial in the formation of ore deposits on Earth also acted on our neighbour planet, where lava flows may have formed base and precious metal rich mineralisation,” Ph.D. researcher Raphael Baumgartner said.
The study’s lead scientist and project coordinator, Professor Marco Fiorentini, added: “Answering the question of whether this style of mineralisation also exists on Mars offers a chance to enhance our fundamental understanding of the processes governing the evolution of such mineral systems on Earth – improving the scientific foundation upon which mineral exploration models are built.”
David Baratoux, a project collaborator from the Université de Toulouse, said the outcomes of the study provide a comprehensive foundation for further research targeting individual Martian igneous provinces to host precious and base metal rich mineralisation.
“As a first step, we examined the prospectivity of Mars at the planetary scale. We are confident that our future work will shed light on specific settings where these mineralised occurrences likely occur on Mars,” he said.
Kerim Sener, a project sponsor from Matrix Exploration Pty. Ltd., a private mineral resources consultancy, emphasised the importance of the research for future Martian exploration.
“Understanding how and where potential ore forming processes occurred on Mars is a prerequisite for long-term planning for future space missions to the planet and for designing exploration criteria for certain sample-return programmes,” he said.
The Martian geology is surprisingly well documented. Orbiting satellites have imaged and analysed Mars surface remotely, Landers and Rovers have directly observed and analysed the Martian surface, and even limited rock specimens are available to the scientific community – with the Martian meteorites representing fragments of the Martian crust ejected by asteroid impacts.
Baumgartner RJ, Fiorentini M, Baratoux D, Micklethwaite S, Lorand JP, Sener AK, McCuaig C. Magmatic Controls on the Genesis of Ni-Cu±(PGE) Sulphide Mineralisation on Mars. Ore Geology Reviews (in press).
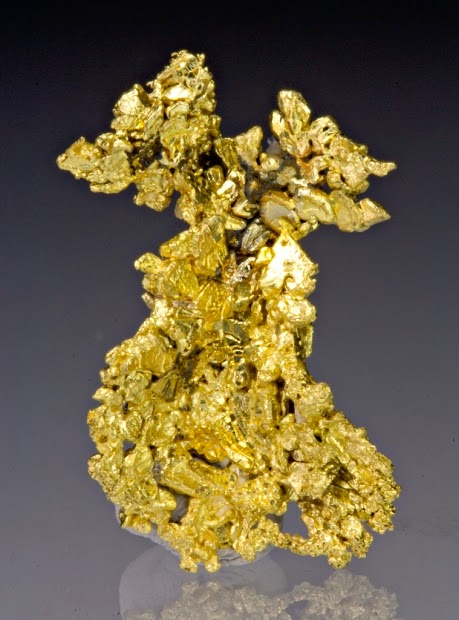
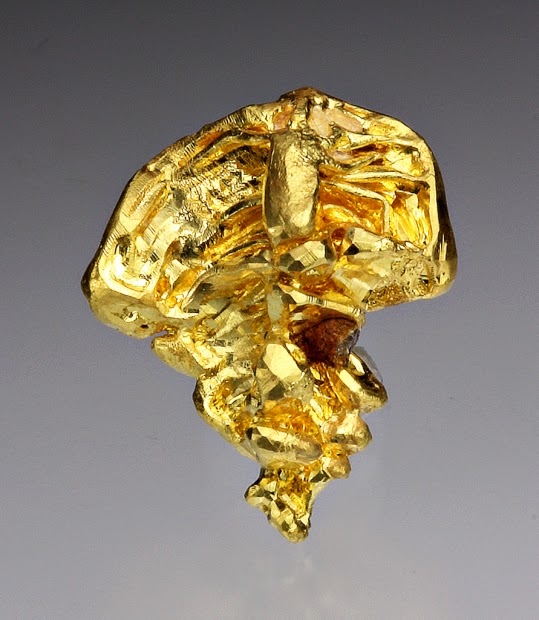
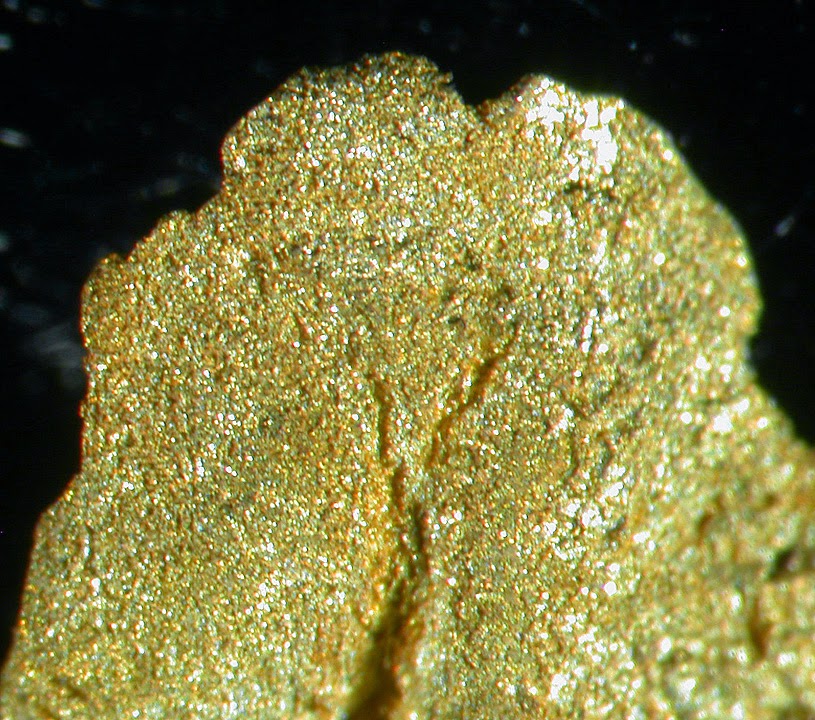
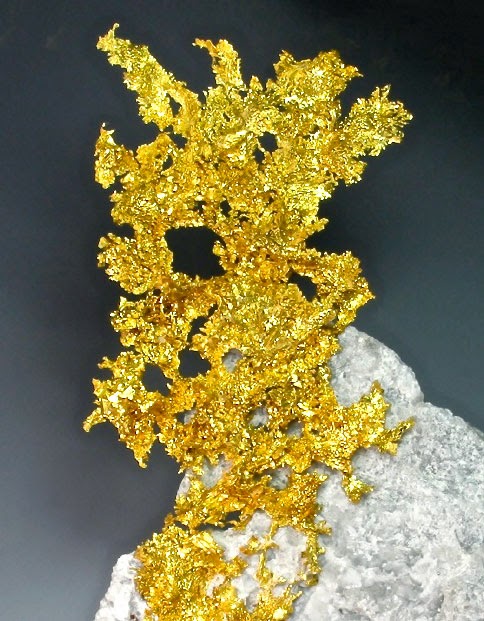
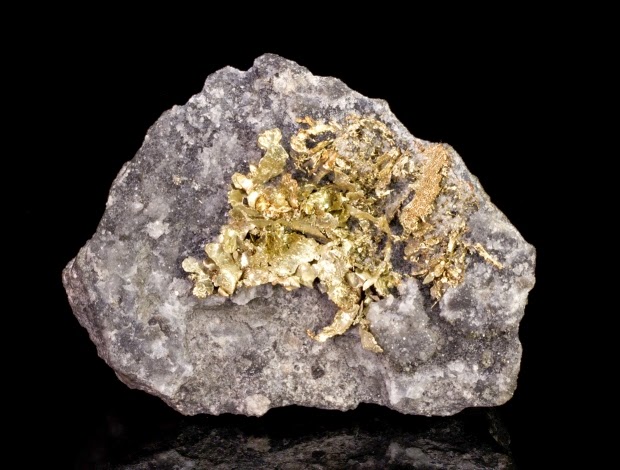
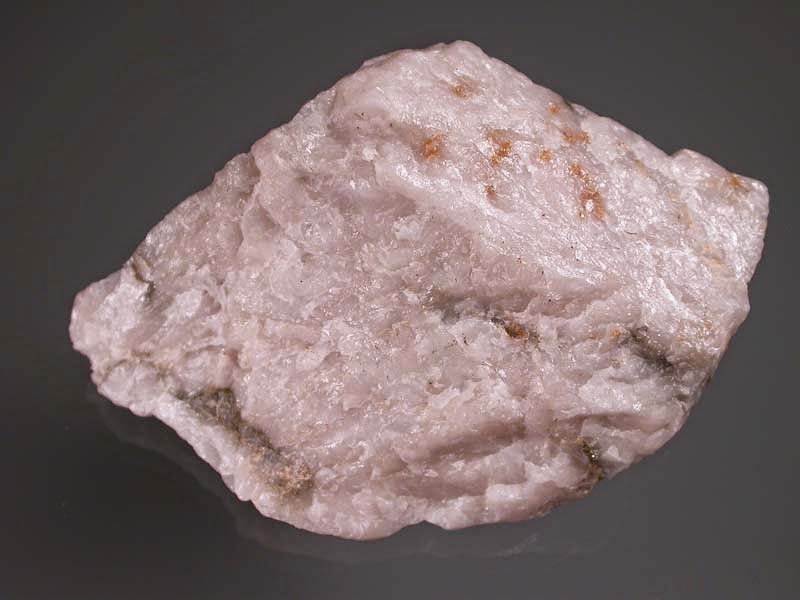
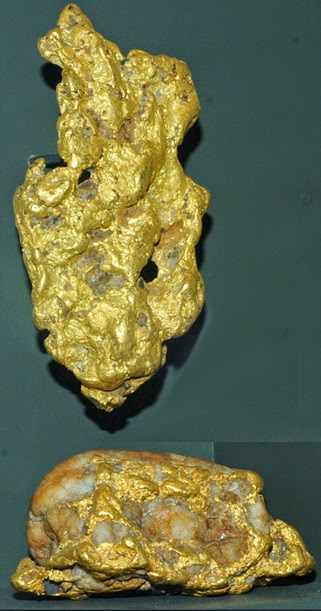
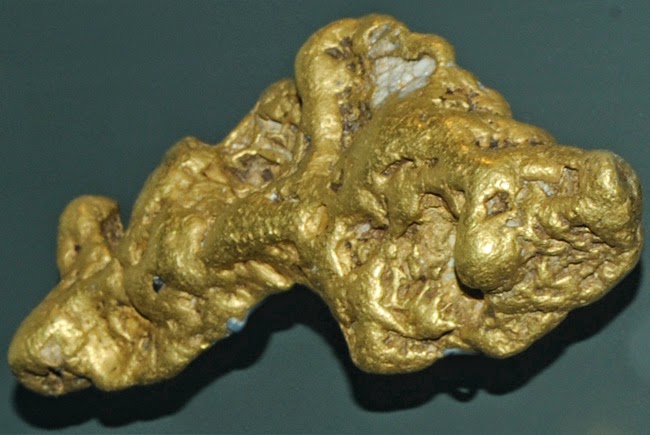
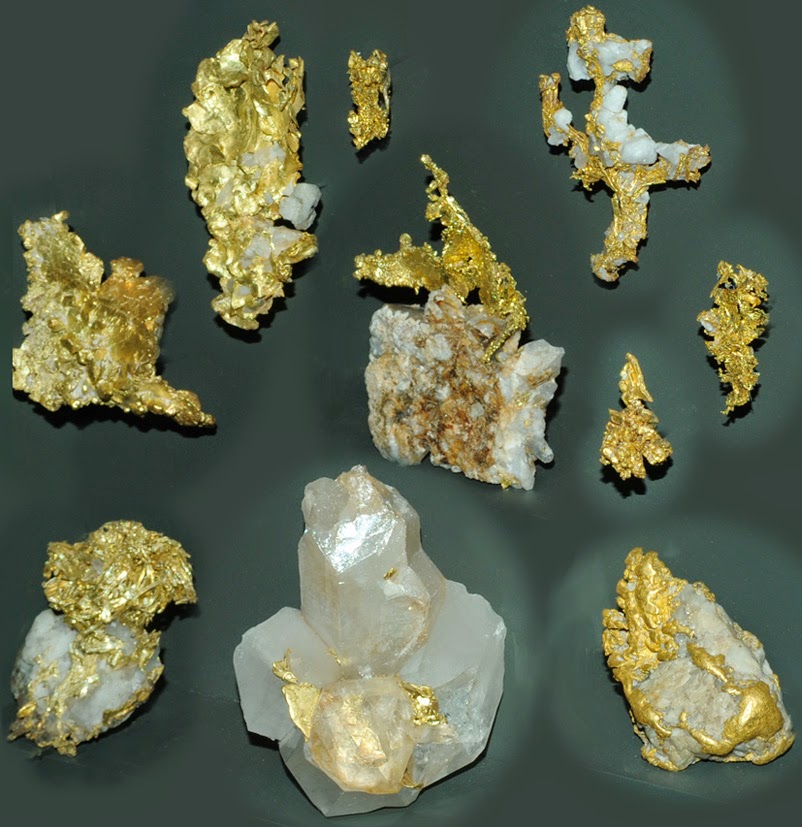
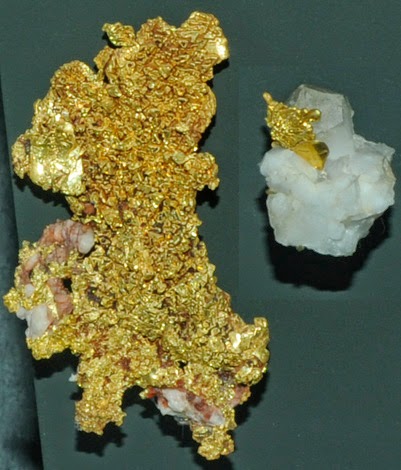
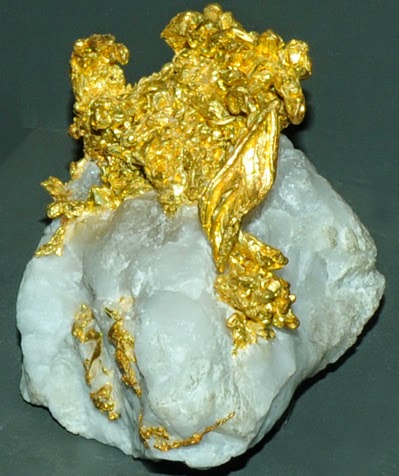
Chemical Formula: Au Locality: Sierra Nevada Mountains, Nome, Alaska and many other places in the world. Name Origin: Anglo Saxon, of uncertain origin.
Gold is a chemical element with symbol Au (from Latin: aurum) and atomic number 79. It is a bright yellow dense, soft, malleable and ductile metal. The properties remain when exposed to air or water. Chemically, gold is a transition metal and a group 11 element. It is one of the least reactive chemical elements, and is solid under standard conditions. The metal therefore occurs often in free elemental (native) form, as nuggets or grains, in rocks, in veins and in alluvial deposits. It occurs in a solid solution series with the native element silver (as electrum) and also naturally alloyed with copper and palladium. Less commonly, it occurs in minerals as gold compounds, often with tellurium (gold tellurides).
Gold’s atomic number of 79 makes it one of the higher atomic number elements that occur naturally in the universe, and is traditionally thought to have been produced in supernova nucleosynthesis to seed the dust from which the Solar System formed. Because the Earth was molten when it was just formed, almost all of the gold present in the Earth sank into the planetary core. Therefore most of the gold that is present today in the Earth’s crust and mantle is thought to have been delivered to Earth later, by asteroid impacts during the late heavy bombardment, about 4 billion years ago.
Gold resists attacks by individual acids, but it can be dissolved by aqua regia (nitro-hydrochloric acid), so named because it dissolves gold into a soluble gold tetrachloride cation. Gold compounds also dissolve in alkaline solutions of cyanide, which have been used in mining. It dissolves in mercury, forming amalgam alloys; it is insoluble in nitric acid, which dissolves silver and base metals, a property that has long been used to confirm the presence of gold in items, giving rise to the term acid test.
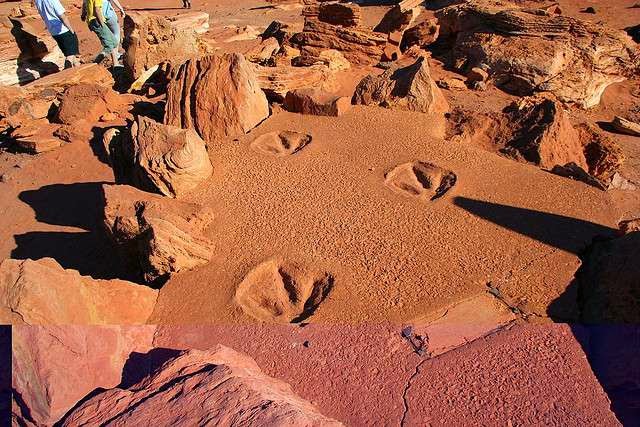
Dinosaur footprints at Gantheaume Point near Broome. Credit: Bjarni Thorbjornsson
While audiences in Perth attend Walking with Dinosaurs this weekend palaeontologists working near Broome will be documenting the extinct vertebrates’ extensive fossilised footsteps using laser scanning technology.
The researchers are using the hand-held scanner Zebedee to help build three-dimensional images of the prints, as part of the government-funded Walking with Dinosaurs in the Kimberley project.
Queensland University senior lecturer Steven Salisbury is leading the project.
He returned to Broome this week, to take advantage of massive tides (up to 12m) at this time of year which expose tracks on rock platforms which are mostly underwater.
He says it is an intense period of research, trying to gather as much data as possible at low tide for interpretation back in the laboratory.
Dr Salisbury says some areas are exposed just a few hours, a few days of the year.
“So we don’t get many chances,” he says.
“At one time in the past, you’d have been able to lay out some tape measures and transect line and using some graph paper go about casually recording it but we can’t do that here because we’d be washed away.”
Previous expeditions have used on-ground and aerial photography from drones and aircraft and photogrammetry to build-up 3D images but it is the first time Zebedee has been deployed.
It is a lightweight LiDAR laser scanner developed by CSIRO that fires lasers into the atmosphere from a spinning mirror. Distance is measured when the lasers bounce back.
The scanner earned its name from the spring-loaded children’s TV character Zebedee from The Magic Roundabout.
Dr Salisbury says Zebedee is better suited to 3D spaces like caves and its use on flat terrain has needed some modifications.
However, the results are very exciting.
“The more you do it, the bigger the three dimensional point cloud and you can build-up a three-dimensional terrain,” he says
“What we are doing now is trying to overlay the three dimensional photographs into that terrain.
“We obviously have a lot of processing and cataloguing to do back at the uni but already we are able to do a lot of work with what we’ve got.
“Two student on the team are working on interpreting one of the nice sauropod track site close to Broome which we haven’t been able to do previously because it’s too tricky with tides and the extent of the track sites.
Dr Salisbury says the Kimberley has the only example of Australian dinosaurs, up to 20 different types, from 130 million years ago.
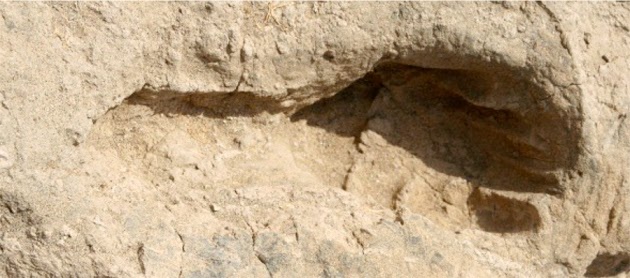
An ancient footprint from Ileret, Kenya: one of several sets showing evidence of Homo erectus males travelling in groups. Credit: Brian Richmond
A long-past hunting party left a permanent sign of its outing — and it was not empty beer cans. Dozens of 1.5-million-year-old human footprints in Kenya may be evidence of an early antelope hunt, offering a rare look at the lives of ancient humans, researchers reported at a conference in California this week.
Footprints are the rarest of human relics. They tend to erode away very quickly; only the choicest of conditions keep them preserved for thousands or millions of years. But unlike collections of bones and tools — which are difficult to link to a single individual or group — footprints offer a snapshot of daily life.
In the late 2000s, researchers exploring the area near a village in northwestern Kenya, called Ileret, for human bones and tools instead stumbled on a collection of 22 human footprints. Their 2009 publication on the discovery, in Science1, focused on the anatomy of the people who left the prints: tall individuals who probably belonged to the species Homo erectus, and who walked very much like modern humans (Homo sapiens).
But Neil Roach, a palaeoanthropologist at the American Museum of Natural History in New York, saw the prints as an opportunity to catch a glimpse in the day of a life of Homo erectus. He and his colleagues returned to Ileret to take a closer look at the prints and to search for more.
They have now found around 100 human footprints, split between several sets that were probably each laid down on the same day. Roach says that the prints represent groups of multiple individuals, rather than lone ramblers. The size of the prints point to adult males, he told the annual meeting of the Paleoanthropology Society in San Francisco.
One direction
To get a better sense of the purpose of these jaunts, Roach and his colleagues looked at the prints of other animals, including crocodiles, antelopes and other bovids, and birds such as storks and pelicans. This mix suggests that the ancient humans were walking on a lakeside buffered by grasslands, Roach says. And unlike the grass-eating bovids, whose prints tended to lead from the grasslands to the lake shore, the humans all walked in one direction along the lake — similar to the movements of other hunting animals.
Roach and his team propose that the tracks represent group hunts for antelope or wildebeest. “What we can say is that we have a number of individuals, probably males, that are moving across a lake shore in a way that is consistent with how carnivores move,” he says. The researchers now plan to study the movement patterns of present-day subsistence hunters in Africa to get a better idea of what their footprints look like. “Hunting is a difficult thing to prove in human evolution,” Roach says. The presence of numerous adult males also points to some level of cooperation.
Other evidence suggests that Homo erectus — a forebear to modern Homo sapiens — were more predatory than their ancestors, who may have scavenged the meat that they ate. Stone tools and cut-marked bones become more common in the archaeological record after around 2 million years ago (when Homo erectus emerged). And some researchers have speculated that their svelte bodies helped them to track down fast-moving prey, while their bulging brains demanded loads of calories. “There’s starting to be a consensus that around 2 million years ago we see more carnivory that has to do with hunting,” Roach says.
“Who knows what they’re doing there,” says Curtis Marean, a palaeoanthropologist at Arizona State University in Tempe. “It could be a group hunt, but it could also be lakeshore foraging.” Some lakeshore plants produce nutritious bulbs on which the footprint-makers may have gorged.
But Marean thinks that Roach and his team are onto something by using footprints to study daily life. “It’s a completely novel piece of data,” he says. “I think it’s a really interesting way to get an angle on what communities were doing in the past.”
Note : The above story is based on materials provided by Nature
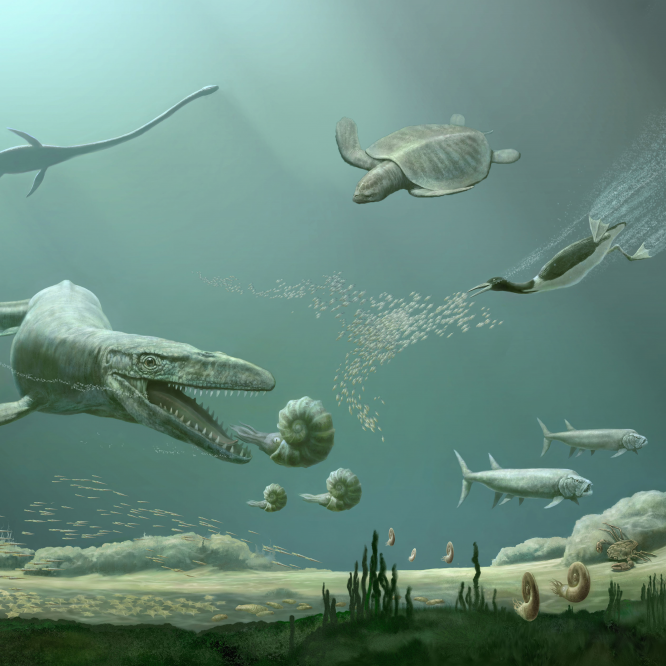
This marine scene shows an assortment of marine tetrapods that lived in Cretaceous oceans near the end of the “Age of Reptiles,” including a sea turtle, an early flightless marine bird, a large mosasaur and a long-necked elasmosaur. Artwork by Karen Carr
For more than 250 million years, four-limbed land animals known as tetrapods have repeatedly conquered the Earth’s oceans. These creatures–such as plesiosaurs, penguins and sea turtles–descended from separate groups of terrestrial vertebrates that convergently evolved to thrive in aquatic environments.
In a new scientific review, a team of Smithsonian scientists synthesized decades of scientific discoveries to illuminate the common and unique patterns driving the extraordinary transitions that whales, dolphins, seals and other species underwent as they moved from land to sea. Drawing on recent breakthroughs in diverse fields such as paleontology, molecular biology and conservation ecology, their findings offer a comprehensive look at how life in the ocean has responded to environmental change over time. The paper also highlights how evolutionary history informs an understanding of the impact of human activities on marine species today. More information is available in the April 17 issue of Science.
Marine tetrapods represent a diverse group of living and extinct species of mammals, reptiles, amphibians and birds that all play–or played–a critical role as large ocean predators in marine ecosystems. The repeated transitions between land and sea have driven innovation, convergence and diversification against a backdrop of changing marine ecosystems and mass extinctions dating back to the Triassic period. In this way, they provide ideal models for testing hypotheses about the evolution of species over long periods of time. Modern species of marine tetrapods now face a suite of human-driven impacts to their environment, including climate change, habitat degradation, ship collisions and underwater noise.
“We know from the fossil record that previous times of profound change in the oceans were important turning points in the evolutionary history of marine species,” said Neil Kelley, a Peter Buck post-doctoral researcher in the National Museum of Natural History’s department of paleobiology and lead author in the study. “Today’s oceans continue to change, largely from human activities. This paper provides the evolutionary context for understanding how living species of marine predators will evolve and adapt to life in the Anthropocene.”
Recent investigations in the fossil record have provided new insight into the evolution of traits that allowed marine tetrapods to thrive in the sea. In some cases, similar anatomy evolved among lineages that adapted to marine lifestyles. For example, modern dolphins and extinct marine reptiles called ichthyosaurs descended from distinct terrestrial species, but independently converged on an extremely similar fish-like body plan although they were separated in time by more than 50 million years. The repeated transformation of legs adapted for walking on land into fins is another classic example of convergent evolution. Species ranging from seals to mosasaurs independently developed streamlined forelimbs as they transitioned from living on land to the ocean, allowing them to move quickly and efficiently in the water. This transformation may have been achieved by parallel changes at the genome level.
“Land to sea transitions have happened dozens of times among reptiles, mammals and birds, across major mass extinctions,” said Nicholas Pyenson, the museum’s curator of fossil marine mammals. “You often get similar looking results but convergence is more than skin deep. It can be seen on a broad range of scales, from molecules to food webs, over hundreds of millions of years.”
In the case of deep divers such as beaked whales and seals, these species have independently evolved to have positively charged oxygen-binding proteins called myoglobin in their muscles, allowing them to survive underwater for long periods of time. Scientists also have found identical genetic sequences in different marine species, such as whales, seals and sea cows. Whether these invisible molecular similarities account for larger-scale visible patterns of convergent evolution, or whether convergent anatomy follows different genetic pathways in different groups, remains an important open question to be tackled as genomic sequences become available for more species.
Not all adaptations observed in marine tetrapods can be attributed to convergent evolution. For instance, as baleen whales evolved to live underwater, they developed a unique filter-feeding system that depends on hair-like plates instead of teeth. In contrast, toothed whales evolved to catch and feed on prey by emitting calls and using echolocation, a kind of sonar, to process the echoes from these noises and detect objects in the sea.
Kelley and Pyenson synthesized research from existing studies and referenced the Smithsonian’s paleobiology collections during the course of their research. They intend that this comprehensive review will encourage future collaboration between researchers across scientific fields and lead to new insights about evolutionary biology, paleontology and marine conservation.
Reference:
Neil P. Kelley, Nicholas D. Pyenson. Evolutionary innovation and ecology in marine tetrapods from the Triassic to the Anthropocene. Science, 2015 DOI: 10.1126/science.aaa3716
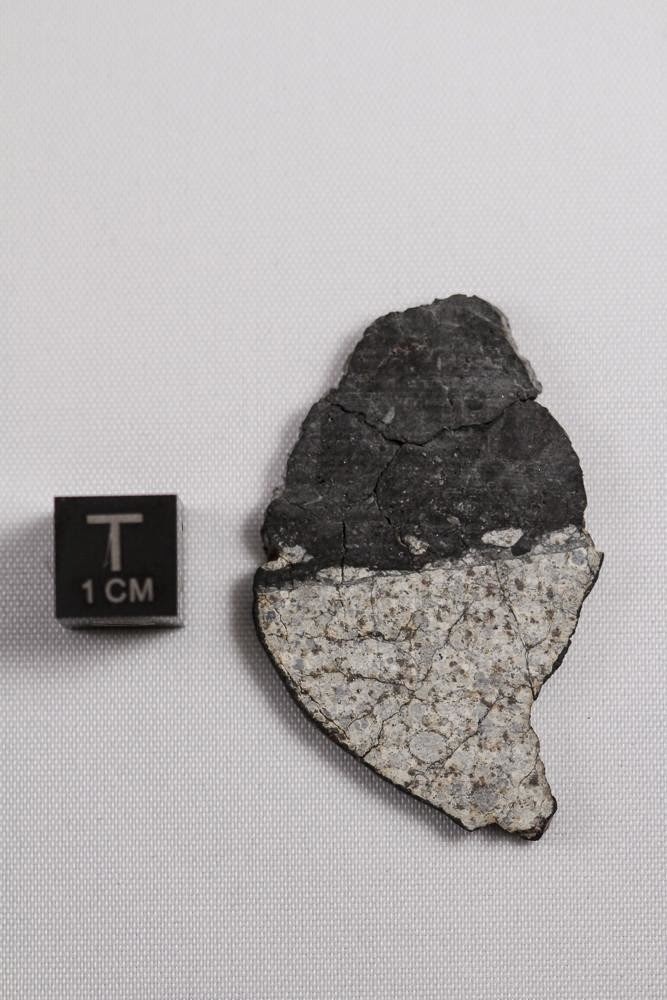
This image shows a meteorite fragment found after a 17-20 meter asteroid disrupted in the atmosphere near Chelyabinsk, Russia on Feb. 15, 2013. Credit: Vishnu Reddy, Planetary Science Institute
Through a combination of data analysis and numerical modeling work, researchers have found a record of the ancient Moon-forming giant impact observable in stony meteorites. Their work will appear in the April 2015 issue of the Journal Science. The work was done by NASA Solar System Exploration Research Virtual Institute (SSERVI) researchers led by Principal Investigator Bill Bottke of the Institute for the Science of Exploration Targets (ISET) team at the Southwest Research Institute and included Tim Swindle, director of the University of Arizona’s Lunar and Planetary Laboratory.
The inner Solar System’s biggest known collision was the Moon-forming giant impact between a large protoplanet and the proto-Earth. The timing of this giant impact, however, is uncertain, with the ages of the most ancient lunar samples returned by the Apollo astronauts still being debated. Numerical simulations of the giant impact indicate this event not only created a disk of debris near Earth that formed the Moon, but it also ejected huge amounts of debris completely out of the Earth-Moon system. The fate of this material, comprising as much as several percent of an Earth mass, has not been closely examined until recently.
However, it is likely some of it blasted main belt asteroids, with a record plausibly left behind in their near-surface rocks. Collisions on these asteroids in more recent times delivered these shocked remnants to Earth, which scientists have now used to date the age of the Moon.
The research indicates numerous kilometer-sized fragments from the giant impact struck main belt asteroids at much higher velocities than typical main belt collisions, heating the surface and leaving behind a permanent record of the impact event. Evidence that the giant impact produced a large number of kilometer-sized fragments can be inferred from laboratory and numerical impact experiments, the ancient lunar impact record itself, and the numbers and sizes of fragments produced by major main belt asteroid collisions.
Once the team concluded that pieces of the Moon-forming impact hit main belt asteroids and left a record of shock heating events in some meteorites, they set out to deduce both the timing and the relative magnitude of the bombardment. By modeling the evolution of giant impact debris over time and fitting the results to ancient impact heat signatures in stony meteorites, the team was able to infer the Moon formed about 4.47 billion years ago, in agreement with many previous estimates. The most ancient Solar System materials found in meteorites are about one hundred million years older than this age.
Insights into the last stages of planet formation in the inner solar system can be gleaned from these impact signatures. For example, the team is exploring how they can be used to place new constraints on how many asteroid-like bodies still existed in the inner Solar System in the aftermath of planet formation. They can also help researchers deduce the earliest bombardment history of ancient bodies like Vesta, one of the targets of NASA’s Dawn mission and a main belt asteroid whose fragments were delivered to Earth in the form of meteorites. It is even possible that tiny remnants of the Moon-forming impactor or proto-Earth might still be found within meteorites that show signs of shock heating by giant impact debris. This would allow scientists to explore for the first time the unknown primordial nature of our homeworld.
Co-author Swindle, who specializes in finding the times when meteorites or lunar samples were involved in large collisions, said: “Bill Bottke had the idea of looking at the asteroid belt to see what effect a Moon-forming giant impact would have, and realized that you would expect a lot of collisions in the period shortly after that.
“Here at LPL, we had been determining ages of impact events that affected meteorites, and when we got together, we found that our data matched his predictions,” he added. “It’s a great example of taking advantage of groups that work in two different specialties — orbital dynamics and chronology — and combining their expertise.”
Intriguingly, some debris may have also returned to hit the Earth and Moon after remaining in solar orbit over timescales ranging from tens of thousands of years to 400 million years.
“The importance of giant impact ejecta returning to strike the Moon could also play an intriguing role in the earliest phase of lunar bombardment,” said Bottke, who is an alumnus of the University of Arizona’s Lunar and Planetary Laboratory. “This research is helping to refine our time scales for ‘what happened when’ on other worlds in the Solar System.”
Yvonne Pendleton, Director of the NASA SSERVI Institute, notes: “This is an excellent example of the power of multidisciplinary science. By linking studies of the Moon, of main belt asteroids, and of meteorites that fall to Earth, we gain a better understanding of the earliest history of our Solar System.”
Video
One possible realization of the Moon-forming impact event is animated. Here it is assumed that a Mars-sized protoplanet, defined as having 13 percent of an Earth-mass, struck the proto-Earth at a 45-degree angle near the mutual escape velocity of both worlds. The “red” particles, comprising 0.3 percent of an Earth-mass, were found to escape the Earth-Moon system. Some of this debris may eventually go on to strike other solar system bodies like large main belt asteroids. “Yellow-green” particles go into the disk that makes the Moon. “Blue” particles were accreted by the proto-Earth. The details of this simulation can be found in Canup, R. (2004, Simulations of a late lunar-forming impact, Icarus 168, 433-456).
Credit: Robin Canup, Southwest Research Institute
Reference:
W. F. Bottke, D. Vokrouhlický, S. Marchi, T. Swindle, E. R. D. Scott, J. R. Weirich, H. Levison. Dating the Moon-forming impact event with asteroidal meteorites. Science, 2015 DOI: 10.1126/science.aaa0602
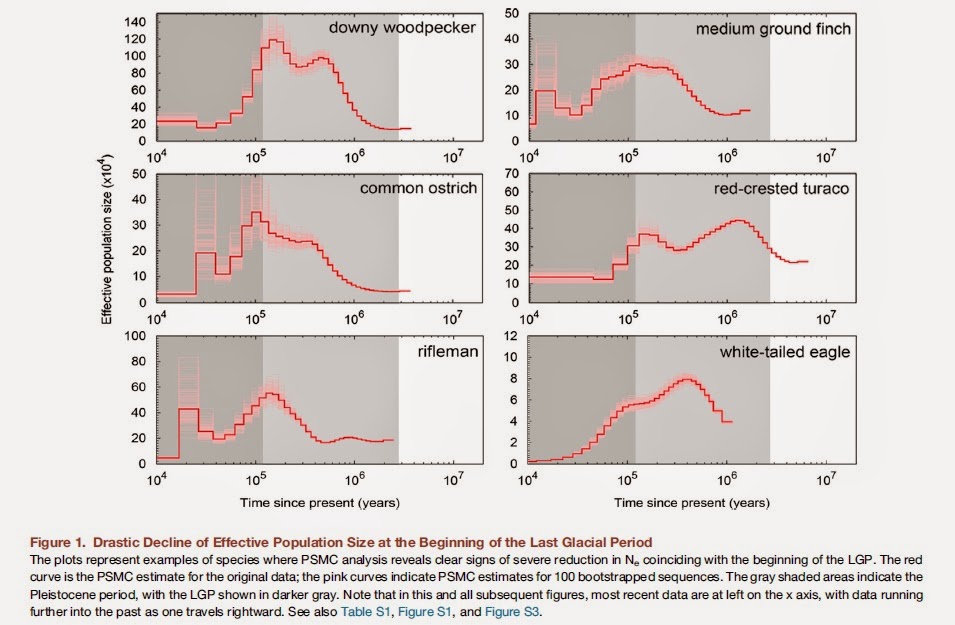
A key question in the climate debate is how the occurrence and distribution of species is affected by climate change. But without information about natural variation in species abundance it is hard to answer. In a major study, published in the scientific journal Current Biology, researchers can now for the first time give us a detailed picture of natural variation.
The impact of climate change on species occurrence and distribution is a central issue in the climate debate, since human influence on the climate risks posing threats to biodiversity. But until now methods for investigating how natural climate variation in the past has affected the abundance of species have been lacking.
Now, for the first time, Krystyna Nadachowska-Brzyska and Hans Ellegren of Uppsala University’s Evolutionary Biology Centre in collaboration with researchers at the Beijing Genomics Institute, have managed to clarify the issue in detail by analysing the whole genome of some 40 bird species. By studying the genetic variation of DNA molecules, they have succeeded in estimating how common these species were at various points in time, from several million years ago to historical times.
Ellegren says: ‘The majority of all species exhibit cyclical swings in numbers and these swings often coincide with the periods of ice ages.’
During the Quaternary Period (the past two million years, including the Pleistocene epoch, i.e. up to some 11,500 years ago), inland ice periodically spread across large land areas of Earth. Species distribution then became compressed with falling numbers of individuals as a result. When the climate became milder and the ice sheets retreated, many species expanded.
Rising and falling species numbers thus seem to result naturally from climate variation. Nevertheless, Ellegren warns of the effects of human influence on the environments in which many birds live, and in the long term on the climate as well.
‘The last Ice Age (110,000-12,000 years ago) had a particularly heavy impact on birds. Many species suffered their most dramatic falls in numbers then.’
Accordingly, there is a risk of the relatively recent influence exerted by human beings on environments and habitats, and of course the climate, having a particularly adverse effect on species that have already ‘declined’. Anthropogenic impact may therefore be what irrevocably pushes their decline beyond the ‘tipping point’ to eventual extinction.
‘We’ve analysed several species classified as “endangered” in the IUCN Red List of Threatened Species. Several, such as the crested ibis, crowned crane, brown mesite and kea, were already at a low level even before human activities affected their ranges,’ says Ellegren.
The survey, which is based on advanced mathematical calculations of how many individuals of each species have existed at different periods, yielding the genetic variation in the genome that is now observable, is the most extensive of its kind to date.
Reference:
Nadachowska-Brzyska K, Li C, Smeds L, Zhang G & Ellegren H. Temporal Dynamics of Avian Populations during Pleistocene Revealed by Whole-Genome Sequences. Current Biology, April 2015 DOI: 10.1016/j.cub.2015.03.047
This is an 18,000 year-old mastodon molar (Mammut americanum). Credit: Tom Robinette, UC
“The answers to extinction, survival and evolution are right here in the dirt,” says University of Cincinnati Quaternary science researcher Ken Tankersley, associate professor of anthropology and geology. “And we are continually surprised by what we find.”
While many scientists focus on species’ extinction wherever there has been rapid and profound climate change, Tankersley looks closely at why certain species survived.
For many years he has invited students and faculty from archeology and geology, and representatives from the Cincinnati Museum Center and Kentucky State Parks to participate in an in-the-field investigation at a rich paleontological and archeological site not too far from UC’s campus.
Through scores of scientific data extracted from fossilized vegetation and the bones and teeth of animals and humans, Tankersley has been able to trace periods of dramatic climate change, what animals roamed the Earth during those epochs and how they survived. And his most recent evidence reveals when humans came on the scene and how they helped change the environment in Big Bone Lick, Kentucky.
“What we found is that deforestation efforts over 5,000 years ago by humans significantly modified the environment to the degree that the erosion began filling in the Ohio River Valley, killing off much of the essential plant life,” says Tankersley. “At that point animals had to either move, evolve or they simply died off.”
Tankersley will present the culmination of his years of Surviving Climate Change research – including countless hours in the field and in the lab as well as multiple published works – at the Society for American Archeology annual meeting, April 15-19 in San Francisco titled, Quaternary Chronostratigraphy of Big Bone Lick, Kentucky, USA. He also has a paper published online in the March issue of the prestigious journal Quaternary Research titled, “Quaternary chronostratigraphy and stable isotope paleoecology of Big Bone Lick, Kentucky, USA.”
STUDENTS DIG DEEP FOR ANSWERS
Big Bone Lick (BBL) State Park in north-central Kentucky has over 25,000 years of well-preserved bones, rocks and other archeological treasures that have been easily accessible since the 1700s. But until recently, the evidence for why some of this region’s former inhabitants evolved into present-day animals, while others simply died off, was buried deep in the sediment.
Only 20 minutes away from UC’s main campus by interstate, Tankersley and his students have been taking advantage of BBL’s rich and accessible history for the past three years. By digging through layers of soil, scavenging around in creek bottoms and scraping specimens from bone fragments, they have unearthed a treasure trove of ancient specimens – some more than 25,000 years old.
“One of my students, Stephanie Miller, discovered a 10-foot mastodon tusk beneath the water table at the bottom of a creek when she reached below the mud and felt a hard object pointed at the end,” says Tankersley. “That tusk is now on display at the Cincinnati Museum Center.”
Possessing a proud ancestry of part Native American Cherokee, Tankersley feels a strong need for all this discovery is in his bones, too.
Tankersley originally thought that when the ice reached its maximum advance 25,000 years ago – covering the area now known as Sharonville – the mammoths were grazing on C4 tundra vegetation of herbaceous plants and sedges. To his surprise, what he found is that he couldn’t have been more wrong.
While mammoths and mastodons are two distinct species of the proboscidean family, they were originally thought to have lived in different epochs in time and in separate areas of the world:
Mastodons existed earlier, about 27-30 million years ago primarily in North and Central America.
Mammoths came on the scene 5.1 million years ago arising out of Africa.
The evidence at BBL now shows that mammoths and mastodons both roamed together – possibly through intercontinental migration – and were both eating the same vegetation, even with the difference in the shape of their molars.
The original model of the changing landscape botanically, and in terms of the animals’ diet was completely wrong, and was a big shock to Tankersley.
Tankersley’s evidence also revealed significant periods of radical shifts in environmental temperature since the last glacial maximum more than 25,000 years ago, which caused an increase in the deposit of sediment that was greater than the system was able to support. And those radical shifts from cold and dry to warm and moist significantly altered the landscape and the vegetation and plant life.
“To determine what animals roamed the area and how they survived, we looked at the stable carbon and nitrogen isotope chemistry of both the animals and plants that were in the sediment for the past 25,000 years,” says Tankersley. “Since we are what we eat, we discovered that the mammoths, mastodons and bison were not eating the plants we originally thought. As it turns out, they were eating more C3 vegetation, which is tree leaves and weedy vegetation more like we see outside today.”
After incidents like cataclysmic cosmic events caused temperatures to drop and darkened the air with clouds of poisonous gas, the resulting climate change presented challenges for most plant and animal species to continue living. According to Tankersley, life at that time became a true test of survival skills for all living things, so those that could move or adapt to their new surroundings survived – many by evolving into a smaller, lighter and faster species.
Larger animal species that could not move fast or for long distances starved or were imprisoned in the muddy landscape and became easy prey for hungry predators.
“My students discovered all of this,” says Tankersley. “My job in this ‘Surviving Climate Change’ project was to give them the resources and tools and teach them the scientific techniques we use, but then let them be the discoverers, which is exactly what happened.”
SURVIVAL OF THE MOST FLEXIBLE
At BBL, Tankersley focused on which species survived and which ones went extinct. They determined that during times when food sources were declining, animals had to move to more fruitful environments or learn to do with less food, which ultimately led to the evolution of today’s surviving species.
Looking closer at those survival patterns, Tankersley found that species like caribou could no longer make a living in this area, but they could up north. And although bison are still around, they are a lot smaller than they were thousands of years ago.
The moral to this story, explains Tankersley, is that many species evolved into smaller animals over time as their food sources started to decline. While some larger species simply died off from a lack of necessary resources, bison and deer were two mammals that were able to survive by evolving with a smaller body mass and shorter stature.
“If you look at a species and you have an environmental downturn or major change in the amount of solar radiation, the amount of water moisture and the amount of frost-free days, can all plants respond to that equally? Of course not,” says Tankersley. “As individuals, we all have different tolerance levels for change. So in the case of the caribou, when the climate changed rapidly and profoundly it could no longer make a living at BBL. But it could continue to make a living up north where it had the environment for survival.
“Species get bigger when there is a lot of food available and smaller when there is not. So the bison downsized, but the mammoth and mastodon did not. They could neither move nor downsize quickly enough so they simply died off.”
BEAVERS THE SIZE OF BLACK BEARS – OH MY! Tankersley’s team also discovered different species within a species. For example, while there were small beavers then just like there are now, from 25,000 until 10,000 years ago there were also large beavers the size of black bears.
“The larger extinct beaver lost its battle to survive because it was dependent on a certain environment that was dying off, but the modern beaver could make its own environment and consequently survived,” says Tankersley. “So there is a lesson there. Animals had to adapt, downsize or go extinct.”
Last year Tankersley and his students excavated over 17,000 specimens that are now housed at the Cincinnati Museum Center. While digging up animal bones they found evidence of humans who had butchered these animals.
ENTER THE HUMANS
To effectively date the plant and animal specimens, Tankersley’s students examined radiocarbon and optically stimulated luminescence (OSL) ages. Dating much of the material to 5,000 years ago using OSL procedures, Tankersley was shocked to find the evidence for human activity and a new anthropological time period now called the Anthropocene – when humans became the most powerful, natural force.
“So much of science is serendipitous,” claims Tankersley. “What the students discovered serendipitously, by dating these deposits, was that humans came in and broke the sod.
Deeper into the sediment, Tankersley found that humans had dug pits into the ground to process animal skins to wear as clothing. Based on ethnographic French literature, the Native Americans had put piles of rocks inside the pits along with hickory nuts, then they used hot rocks to boil the water. The oily, greasy meat of the hickory nut would float to the top and the non-edible remains like the shell and hull would sink to the bottom.
“They would skim it off and drink the water, as it was very nutritious,” says Tankersley. “When they were finished, they would grab the softened deerskin and leave the rocks and nutshells behind, which is what we found.”
To protect their hickory-nut trees from squirrels and other animals, Tankersley found evidence for human deforestation, where large areas of trees were cleared to create separate hickory-tree orchards, protecting them from animal invasion. That deforestation and degradation resulted in substantial erosion of the uplands, which caused the overbank and backwater flooding of the Ohio Valley area.
The changing vegetation, as a result of this deforestation also contributed to the demise, adaptation or evolution of several species.
Furthermore, Tankersley and his students uncovered evidence for animals being hunted by humans during this same period. Looking closely at the hash marks in animal bones, there was strong clues that humans had greatly contributed to the extinction of some of the species in BBL like the larger bison.
Consequently, through deforestation and arboriculture behavior, and the hunting and extinction of many species of animals, Tankersley found clear evidence that humans indeed contributed to the changing landscape even as far back as 5,000 years ago.
“It’s hard to believe, but there is no volcano, no earthquake or tsunami that is moving more sediment than we are,” says Tankersley. “Humans are the most powerful force on the planet right now.”
To help prevent an underlying assumption of landscape change or stability where it does not exist, Tankersley’s team efforts show that both natural and human anthropogenic erosional processes were taking place 5,000 years ago. This activity is directly responsible for the primary and secondary deposits of animal, plant and human artifact remains at Big Bone Lick, Kentucky.