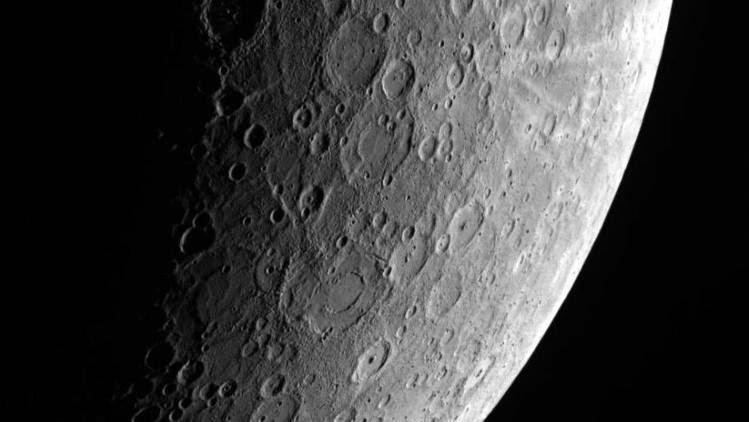
A Mercury-like body smashed into a young Earth and gave our planet’s core the radioactive elements necessary to generate a magnetic field, two Oxford geochemists say.
Without that magnetic field, there would be no shield to protect us from the onslaught of radiation constantly bombarding Earth from space, making the existence of life as we know it impossible, scientists say.
The study, published in the journal Nature, offers insight into how Earth’s magnetic field – and, perhaps, the moon – came to be.
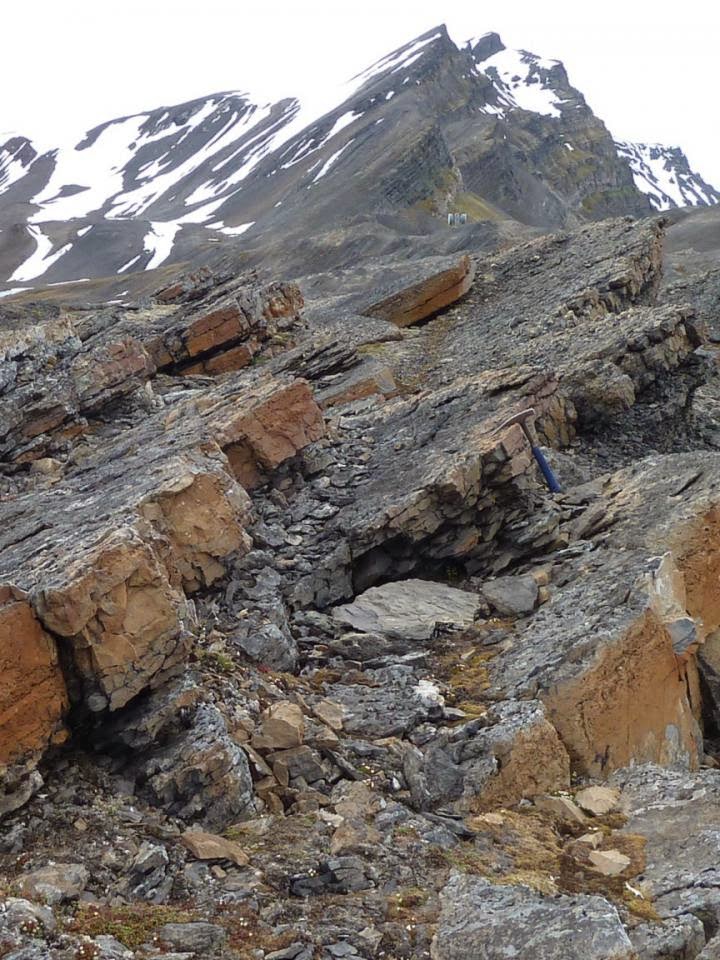
Our planet is thought to have formed from small rocky bodies like the ones in the asteroid belt today, study co-author Bernard Wood, a geochemist at the University of Oxford, said in an interview. It’s a theory that fits quite well with what’s been studied on Earth, though it’s not a perfect fit, he said.
“That sort of roughly works, but there are all kinds of little questions that don’t quite work,” Wood said, “and one of them is, what is the energy source that drives the Earth’s magnetic field?”
Here’s the problem. To drive Earth’s magnetic field, you need radioactive elements like potassium, thorium or uranium – elements that give off heat as they decay – to also be in the planet’s churning iron core. Those elements love getting together with oxygen, making oxides – but oxides are really light and would float toward the planet’s surface; they wouldn’t be heavy enough to stay in the core. These elements also hate getting together with iron.
“They love oxygen so much and they hate being metals so much that they shouldn’t go into the Earth’s core,” Wood said.
So there’s no good way, under current models, to keep enough radioactive material in Earth’s center to power our vital magnetic field – a conundrum for planetary scientists.
But Wood and Oxford colleague Anke Wohlers realized that if you had a source of reduced sulfides – sulfur compounds that don’t have oxygen – into the iron core, it would make it easier for these iron-hating radioactive elements to hang with the metal.
“We said OK, we’ll re-create those conditions in our high-pressure apparatus and we’ll look and see whether the radioactive elements uranium and thorium, and also some of the so-called rare earth elements, would partition into the sulfur-rich metal under those conditions,” Wood said. “And we found much to our pleasure and surprise that uranium very strongly partitions into sulfur-rich metal under those very oxygen-poor or -reducing conditions.”
It would also explain why the ratio of two such rare-earth elements, samarium to neodymium, is higher in the crust and mantle than it is in the rest of the solar system, he added. Because neodymium mixes with iron sulfides more easily than samarium, it more easily sinks into the core, leaving relatively more samarium behind in Earth’s upper layers.
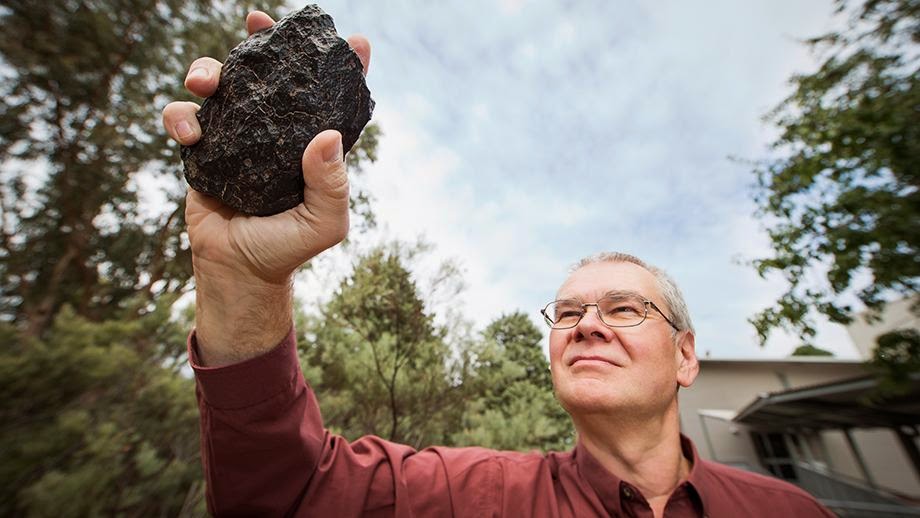
But how did Earth, which is full of oxides, get all these reduced sulfides in the first place? It probably came from a body that looked a lot like Mercury, which is rich in sulfur and very poor in oxygen.
The scientists think that, early in the planet’s history, Earth gobbled up a Mercury-like body, and those sulfides allowed the uranium to stay in the core, which is what has allowed it to power our magnetic field for an estimated 3.5 billion years.
“Before Wohlers and Wood’s experiments, there was only limited (and controversial) experimental evidence that either uranium or potassium can be incorporated in iron metal at the high temperatures and pressures of core formation,” Richard Carlson of the Carnegie Institution for Science in Washington, who was not involved in the study, wrote in a commentary on the paper.
However, he added, “a more stringent test” of whether uranium made it into the core in this way would be to study the radio of different isotopes of neodymium in Earth’s crust and mantle.
This body, by the way, was Mercury-like in composition, but it was not Mercury-sized, Wood said. It was probably closer to the mass of Mars.
That’s interesting, because scientists think that a Mars-sized body’s dramatic collision with Earth is what gave birth to the moon. It’s possible that this Mercury-like body was in fact that selfsame Earth-shattering missile.
“We think that that is quite conceivable,” Wood said. “It’s kind of exciting to think that this reduced body could actually be the thing which caused the moon.”
Reference:
A Mercury-like component of early Earth yields uranium in the core and high mantle 142Nd, Nature 520, 337–340 (16 April 2015) DOI: 10.1038/nature14350
Note : The above story is based on materials provided by Los Angeles Times, Distributed by Tribune Content Agency, LLC.