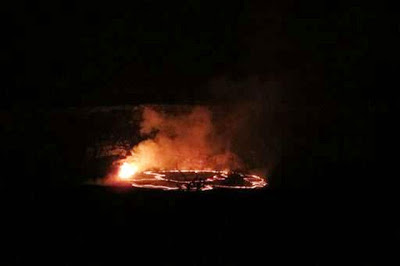
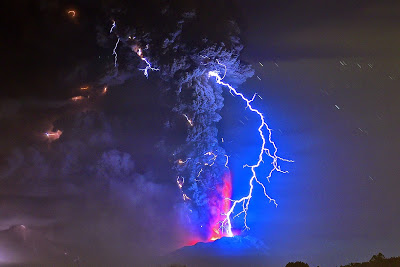
In this Saturday, May 9, 2015 photo, molten rock lights up the night as it spews into a lake of lava near the summit of Kilauea volcano on Hawaii’s Big Island. The lava lake had reached a record high level on May 8 and then began descending, making scientists wonder where the molten rock will go next. Credit: AP Photo/Cathy Bussewitz
A series of earthquakes and shifting ground on the slopes of Kilauea have scientists wondering what will happen next at one of the world’s most active volcanos.
A lake of lava near the summit of Kilauea on Hawaii’s Big Island had risen to a record-high level after a recent explosion. But in the past few days, the pool of molten rock began sinking, and the surface of the lava lake fell nearly 500 feet.
Meanwhile, a rash of earthquakes rattled the volcano with as many as 20 to 25 quakes per hour, and scientists’ tilt meters detected that the ground was deforming.
“Clearly the lava, by dropping out of sight, it has to be going somewhere,” said Steven Brantley, deputy scientist in charge of Hawaiian Volcano Observatory of the U.S. Geological Survey.
One possibility is that a new lava eruption could break through the surface of the mountain, Brantley said.
Right now, there are two active eruptions on Kilauea. One is the eruption spewing into the lava lake in the Halemaumau Crater, which is visible in Hawaii Volcanoes National Park. The other is Puu Oo vent, in Kilauea’s east rift zone, which sent fingers of lava toward the town of Pahoa before stopping outside a shopping center last year.
The flurry of earthquakes that peaked in intensity Friday have been rattling Kilauea’s southwest rift zone, so it’s possible that a new eruption could occur southwest of the Halemaumau Crater, or even in the crater itself, Brentley said. Or, the tilting, shifting ground could lead to nothing.
“We don’t know what the outcome of this activity might be,” Brantley said. “That is the challenge, is trying to interpret what this activity really means in terms of the next step for Kilauea.”
An eruption on the southwest side wouldn’t pose a threat to the population, because the area is generally closed to the public and there aren’t any structures.
The earthquake activity had slowed Saturday morning, and scientists were continuing to watch the volcano closely, Brantley said.
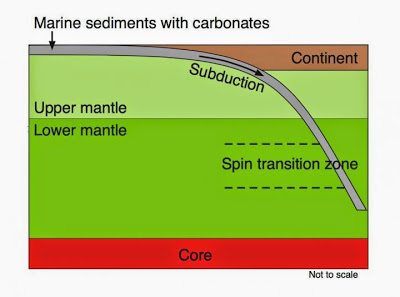
Illustration of the possible location of carbonate spin transition in the lower mantle, courtesy of Sergey Lobanov. Credit: Sergey Lobanov
Carbonates are a group of minerals that contain the carbonate ion (CO32-) and a metal, such as iron or magnesium. Carbonates are important constituents of marine sediments and are heavily involved in the planet’s deep carbon cycle, primarily due to oceanic crust sinking into the mantle, a process called subduction. During subduction, carbonates interact with other minerals, which alter their chemical compositions. The concentrations of the metals gained by carbonate ions during these interactions are of interest to those who study deep earth chemistry cycles.
Carbonates were known to exist in the upper mantle due to their role in the deep carbon cycle. But it was thought that they could not withstand the more-extreme conditions of the lower mantle. Laboratory experiments and the discovery of tiny bits of carbonate impurities in lower mantle diamonds indicated that carbonates could withstand the extreme pressures and temperatures of not only the upper mantle, but the lower mantle as well.
Previous research had shown that upper mantle carbonates are magnesium-rich and iron-poor. Under lower mantle conditions, it is thought that the arrangement of electrons in carbonate minerals changes under the pressure stress in such a way that iron may be significantly redistributed. However, accurate observations of lower mantle carbonates’ chemical composition are not possible yet.
A research team–Carnegie’s Sergey Lobanov and Alexander Goncharov, along with Konstantin Litasov of the Russian Academy of Science and Novosibirsk State University in Russia–focused on the high-pressure chemistry of a carbonate mineral called siderite, which is an iron carbonate, FeCO3, commonly found in hydrothermal vents. Their findings help resolve questions about the presence of iron-containing lower mantle carbonates, and are published by American Mineralogist.
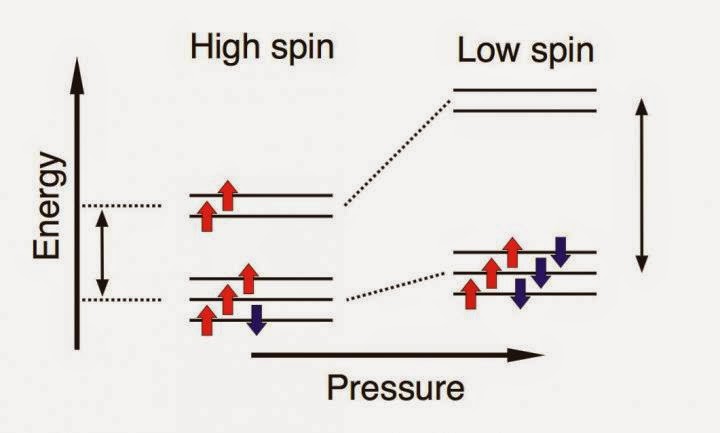
Rearrangement of the electrons in iron upon pressure-induced spin transition in carbonates, courtesy of Sergey Lobanov. Credit: Sergey Lobanov
Until recently the electron-arrangement change responsible for iron redistribution in the lower mantle had not been measured in the lab. It was previously discovered that this change, a phenomenon called a spin transition, took place between about 424,000 and 484,000 times normal atmospheric pressure (43 to 49 gigapascals).The team was able to pinpoint that spin transition was occurring in iron carbonates under about 434,000 times normal atmospheric pressure (44 gigapascals), typical of the lower mantle.
A spin transition is a rearrangement of electrons in a molecule or a mineral (figure 1 below). Electrons hold a compound’s atoms together by bonding. Certain fundamental rules of chemistry govern this bonding process, which have to do with the energy it takes to form the bonds. Pressure-induced spin transitions rearrange electrons and change the energy of the chemical bonds. If the change in chemical bond energy is high enough, the spin transition may trigger iron redistribution between coexisting minerals.
To quantify the energy change, siderite’s spin transition was examined using highly sensitive spectroscopic techniques at pressures ranging from zero to about 711,000 times normal atmospheric pressure (72 gigapascals), and also revealed by a visible color change after the transition, indicating rearrangement of electrons. The obtained spectroscopic data provided the key ingredient to estimating the carbonate composition at pressures exceeding the spin transition-pressure. It turned out that lower mantle carbonates should be iron-rich, unlike upper mantle carbonates (figure 2 below). Similar effects may exist in other lower mantle minerals, if they also undergo spin transitions.
“As we learn more about how the spin transition affects chemical composition in carbonates, we improve our understanding of all iron-bearing minerals, enhancing our knowledge about lower mantle chemistry,” said Lobanov.
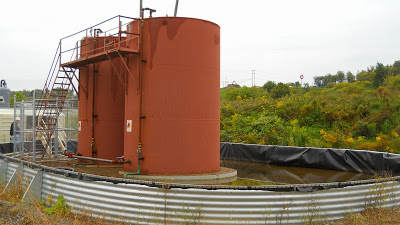
Storage tanks for produced water from natural gas drilling in the Marcellus Shale gas play of western Pennsylvania. Credit: USGS photo, Doug Duncan.
In a study of 13 hydraulically fractured shale gas wells in north-central Pennsylvania, USGS researchers found that the microbiology and organic chemistry of the produced waters varied widely from well to well.
The variations in these aspects of the wells followed no discernible spatial or geological pattern but may be linked to the time a well was in production. Further, the study highlighted the presence of some organic compounds (e.g. benzene) in produced waters that could present potential risks to human health, if the waters are not properly managed.
Produced water is the term specialists use to describe the water brought to the land surface during oil, gas, and coalbed methane production. This water is a mixture of naturally occurring water and fluid injected into the formation deep underground to enhance production. A USGS Fact Sheet on produced water provides more background information and terminology definitions.
Although the USGS investigators found that the inorganic (noncarbon-based) chemistry of produced waters from the shale gas wells tested in the Marcellus region was fairly consistent from well to well and meshed with comparable results of previous studies (see USGS Energy Produced Waters Project), the large differences in the organic geochemistry (carbon-based, including petroleum products) and microbiology (e.g. bacteria) of the produced waters were striking findings of the study.
“Some wells appeared to be hotspots for microbial activity,” observed Denise Akob, a USGS microbiologist and lead author of the study, “but this was not predicted by well location, depth, or salinity. The presence of microbes seemed to be associated with concentrations of specific organic compounds — for example, benzene or acetate — and the length of time that the well was in production.”
The connection between the presence of organic compounds and the detection of microbes was not, in itself, surprising. Many organic compounds used as hydraulic fracturing fluid additives are biodegradable and thus could have supported microbial activity at depth during shale gas production.
The notable differences in volatile organic compounds (VOCs) from the produced waters of the tested wells could play a role in the management of produced waters, particularly since VOCs, such as benzene, may be a health concern around the well or holding pond. In wells without VOCs, on the other hand, disposal strategies could concentrate on issues related to the handling of other hazardous compounds.
Microbial activity detected in these samples could turn out to be an advantage by contributing to the degradation of organic compounds present in the produced waters. Potentially, microbes could also serve to help mitigate the effects of organic contaminants during the disposal or accidental release of produced waters. Additional research is needed to fully assess how microbial activity can best be utilized to biodegrade organic compounds found in produced waters.
Reference:
Denise M. Akoba, Isabelle M. Cozzarellia, Darren S. Dunlapa, Elisabeth L. Rowanb, Michelle M. Lorahc. Organic and inorganic composition and microbiology of produced waters from Pennsylvania shale gas wells. DOI:10.1016/j.apgeochem.2015.04.011
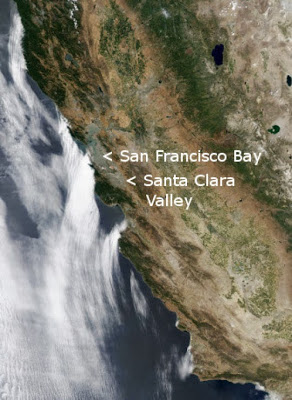
Santa Clara Valley, California, USA. Credit: NASA’s Earth Observatory
California and other parts of the western U.S. are experiencing extended severe drought conditions. Varying groundwater levels in valleys throughout the state, balanced by water imported, for instance, via the State Water Project and the federal Central Valley Project make understanding the state’s underlying hydrologic framework all the more important. This paper by R.T. (Randy) Hanson of the U.S. Geological Survey focuses on California’s Santa Clara Valley.
In the introduction to his paper, Hanson provides a succinct history of the area, as paraphrased here: Santa Clara Valley is a long, narrow (240 square miles), trough-like coastal watershed that borders the southern end of San Francisco Bay, extending about 35 miles southeast from there. The watershed principally drains parts of Santa Clara and San Mateo counties. Santa Clara Valley has experienced the typical evolution of land- and water-use development in the western United States, with a transition from an agricultural and ranching economy to one based on urban services and industry. In the first half of the twentieth century, the valley was intensively cultivated for fruit and truck crops, but subsequent development has included urbanization and industrialization, so that the area is now commonly known as “Silicon Valley.”
Hanson says that the valley underwent extensive groundwater development from the early 1900s through the mid-1960s. This development caused groundwater level declines of more than 200 feet and induced regional subsidence of as much as 12.7 feet from the early 1900s to the mid-1960s. As with other coastal aquifer systems, Hanson notes, “the possibility exists that the combined effects of land subsidence and seawater intrusion will result in large water-level declines.”
The San Francisco Water Department started delivering imported water to several north county cities in the early 1950s. In the 1960s, the Santa Clara Valley Water District (SCVWD) began importing surface water into the valley to help meet growing demands and to reduce the area’s dependence on groundwater. The combination of reduced groundwater pumping and this artificial recharge has caused groundwater levels to recover to near their predevelopment levels, and this, in turn, has arrested the land subsidence, says Hanson, noting, “Currently, the water purveyors in the Santa Clara Valley, in conjunction with SCVWD, would like to meet the water demand in the basin while limiting any potential for additional land subsidence.”
Even though extensive studies have been completed in the Santa Clara Valley, there were no comprehensive three-dimensional hydrologic, geologic, and geochemical data that would allow the delineation of the hydrologic framework that controls the distribution and movement of the water resources in the Santa Clara Valley. Hanson’s article summarizes the hydrologic framework of the valley using data obtained from nine new monitoring-well sites and various supply wells in combination with a detailed groundwater-surface-water model.
The synthesis of this framework is based on a sequence of interdisciplinary studies between the U.S. Geological Survey and the Santa Clara Valley Water District. The framework components, as summarized in Hanson’s article, include the hydrogeologic structure of the valley, groundwater budgets, the role of climate cycles, the nature of stream-aquifer interactions, distribution and nature of groundwater pumpage, effects of land subsidence, the distribution of artificial recharge, geochemical characteristics of the aquifers and wells, and the overall water-resource management issues relevant to the sustainable and conjunctive use of the groundwater and surface water resources of the Santa Clara Valley.
Reference:
R. T. Hanson. Hydrologic framework of the Santa Clara Valley, California. Geosphere, 2015; DOI: 10.1130/GES01104.1
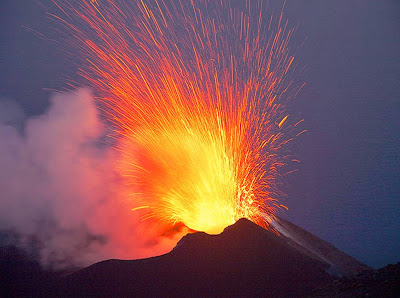
A Strombolian type explosion at Stromboli. (9th of October 2006, Stromboli, Photo T. Pfeiffer).
Scientists have made an important step towards understanding how volcanic eruptions happen, after identifying a previously unrecognised potential trigger.
An international team of researchers from the University of Liverpool, Monash University and the University of Newcastle (Australia) think their findings could lead to new ways of interpreting signs of volcanic unrest measured by satellites and surface observations.
Dr Janine Kavanagh, from the University of Liverpool’s School of Environmental Sciences and lead author of the research paper, said: “Understanding the triggers for volcanic eruptions is vital for forecasting efforts, hazard assessment and risk mitigation.
“With more than 600 million people worldwide living near a volcano at risk of eruptive activity, it is more important than ever that our understanding of these complex systems and their triggering mechanisms is improved.
“There is also a strong economic incentive to understand the causes of volcanic activity — as demonstrated in 2010 by the eruption of Eyjafjallajökull, Iceland, which caused air-traffic disruption across Europe for more than one month, with an estimated US$1.8 billion loss in revenue to the airline industry.”
Studying volcanic processes in nature can be challenging because of the remoteness of many volcanoes, the dangers to scientists wanting to study destructive eruptions up close, and the fact that they are often obscured from direct observation by volcanic ash or rock.
To get around this difficulty, the researchers recreated a scaled down version in labs at Monash University.
They studied the plumbing systems of volcanoes by modelling how magma ascends from great depths to the surface through a series of connected fractures (called dykes and sills).
The scientists used a tank filled with gelatine (jelly) into which coloured water was injected to mimic ascending magma. A high-speed camera and a synchronised laser was used to observe what was going on inside the tank as the ascending magma moved upwards.
Professor Sandy Cruden, from the School of Earth, Atmosphere and Environment at Monash University, said: “It was at this point that we discovered a significant and previously unknown drop in pressure when the ascending vertical dyke stalled to form a horizontal sill.”
“Sills often form in nature as part of a developing volcanic plumbing system, and a pressure drop can drive the release of dissolved gasses, potentially causing the magma to explode and erupt.”
“It’s similar to removing a cap from a bottle of shaken fizzy drink — the pressure drop causes bubbles to form and the associated increase in volume results in a fountain of foam erupting from the bottle.”
Volcano-monitoring systems around the world rely on the interpretation of signals of Earth’s surface and subsurface measured by satellites, ground deformation devices and seismometers. These record when and how magma moves at depth and they are used to help determine the likelihood of an eruption occurring.
The new results will aid this effort by adding a previously unknown potential eruption triggering mechanism and by helping to improve understanding of the dynamics of magma ascent, which leads to eruptions.
Reference:
J.L. Kavanagh, D. Boutelier, A.R. Cruden. The mechanics of sill inception, propagation and growth: Experimental evidence for rapid reduction in magmatic overpressure. Earth and Planetary Science Letters, 2015; 421: 117 DOI: 10.1016/j.epsl.2015.03.038
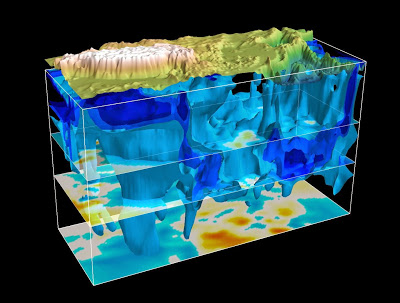
Three-dimensional high velocity structures beneath East Asia from 50 km to 1000 km depth viewed from the southeast. Surface topography with vertical exaggeration is superimposed for geographic references. Isosurfaces of high velocity anomalies in percent referenced to a one-dimensional earth model (STW105) at each depth are plotted from 1% to 4% with 1% interval. Three cut planes show shear wave velocity maps at 410 km, 660 km, and 1000 km depths. The highest elevations represent the Himalayas and the Tibetan Plateau. Credit: Min Chen, Rice University.
A new work based on 3-D supercomputer simulations of earthquake data has found hidden rock structures deep under East Asia. Researchers from China, Canada, and the U.S. worked together to publish their results in March 2015 in the American Geophysical Union Journal of Geophysical Research, Solid Earth.
The scientists used seismic data from 227 East Asia earthquakes during 2007-2011, which they used to image depths to about 900 kilometers, or about 560 miles below ground.
Notable structures include a high velocity colossus beneath the Tibetan plateau, and a deep mantle upwelling beneath the Hangai Dome in Mongolia. The researchers say their line of work could potentially help find hidden hydrocarbon resources, and more broadly it could help explore the Earth under East Asia and the rest of the world.
“With the help of supercomputing, it becomes possible to render crystal-clear images of Earth’s complex interior,” principal investigator and lead author Min Chen said of the study. Chen is a postdoctoral research associate in the department of Earth Sciences at Rice University.
Chen and her colleagues ran simulations on the Stampede and Lonestar4 supercomputers of the Texas Advanced Computing Center through an allocation by XSEDE, the eXtreme Science and Engineering Discovery Environment funded by the National Science Foundation.
“We are combining different kinds of seismic waves to render a more coherent image of the Earth,” Chen said. “This process has been helped by supercomputing power that is provided by XSEDE.”
“What is really new here is that this is an application of what is sometimes referred to as full waveform inversion in exploration geophysics,” study co-author Jeroen Tromp said. Tromp is a professor of Geosciences and Applied and Computational Mathematics, and the Blair Professor of Geology at Princeton University.
In essence the application combined seismic records from thousands of stations for each earthquake to produce scientifically accurate, high-res 3-D tomographic images of the subsurface beneath immense geological formations.
XSEDE provided more than just time on supercomputers for the science team. Through the Campus Champions program, researchers worked directly with Rice XSEDE champion Qiyou Jiang of Rice’s Center for Research Computing and with former Rice staffer Roger Moye, who used Rice’s DAVinCI supercomputer to help Chen with different issues she had with high performance computing.” “They are the contacts I had with XSEDE,” Chen said.
“These collaborations are really important,” said Tromp of XSEDE. “They cannot be done without the help and advice of the computational science experts at these supercomputing centers. Without access to these computational resources, we would not be able to do this kind of work.”
Like a thrown pebble generates ripples in a pond, earthquakes make waves that can travel thousands of miles through the Earth. A seismic wave slows down or speeds up a small percentage as it travels through changes in rock composition and temperature. The scientists mapped these wave speed changes to model the physical properties of rock hidden below ground.
Tromp explained that the goal for his team was to match the observed ground-shaking information at seismographic stations to fully numerical simulations run on supercomputers.
“In the computer, we set off these earthquakes,” says Tromp. “The waves ripple across southeast Asia. We simulate what the ground motion should look like at these stations. Then we compare that to the actual observations.
The differences between our simulations and the observations are used to improve our models of the Earth’s interior,” Tromp said. “What’s astonishing is how well those images correlate with what we know about the tectonics, in this case, of East Asia from surface observations.”
The Tibetan Plateau, known as ‘the roof of the world,’ rises about three miles, or five kilometers above sea level. The details of how it formed remain hidden to scientists today.
The leading theory holds that the plateau formed and is maintained by the northward motion of the India plate, which forces the plateau to shorten horizontally and move upward simultaneously.
Scientists can’t yet totally account for the speed of the movement of ground below the surface at the Tibetan Plateau or what happened to the Tethys Ocean that once separated the India and Eurasia plates. But a piece of the puzzle might have been found.
“We found that beneath the Tibetan plateau, the world’s largest and highest plateau, there is a sub-vertical high velocity structure that extends down to the bottom of the mantle transition zone,” Chen said.
High-resolution 360 degree rotating view of high velocity structures beneath East Asia. Credit: Min Chen, Rice University.
The bottom of the transition zone goes to depths of 660 kilometers, she said. “Three-dimensional geometry of the high velocity structure depicts the lithosphere beneath the plateau, which gives clues of the fate of the subducted oceanic and the continental parts of the Indian plate under the Eurasian plate,” Chen said.
The collision of plates at the Tibetan Plateau has caused devastating earthquakes, such as the recent 2015 Nepal earthquake at the southern edge of where the two plates meet. Scientists hope to use earthquakes to model the substructure and better understand the origins of these earthquakes.
To reach any kind of understanding, the scientists first grappled with some big data, 1.7 million frequency-dependent traveltime measurements from seismic waveforms. “We applied this very sophisticated imaging technique called adjoint tomography with a key component that is a numerical code package called SPECFEM3D_GLOBE,” Chen said.
Specifically, they used SPECFEM3D GLOBE, open source software maintained by the UC Davis Computational Infrastructure for Geodynamics. “It uses parallel computing to simulate the very complex seismic waves through the Earth,” Chen said.
Even with the tools in place, the study was still costly. “The cost is in the simulations of the wave propagation,” says Tromp. “That takes hundreds of cores for tens of minutes at a time per earthquake.
High-resolution 360 degree rotating view of low velocity structures beneath East Asia. Credit: Min Chen, Rice University.
As you can imagine, that’s a very expensive proposition just for one iteration simulating all these 227 earthquakes.” In all, the study used about eight million CPU hours on the Stampede and Lonestar4 supercomputers.
“The big computing power of supercomputers really helped a lot in terms of shortening the simulation time and in getting an image of the Earth within a reasonable timeframe,” said Chen. “It’s still very challenging. It took us two years to develop this current model beneath East Asia. Hopefully, in the future it’s going to be even faster.”
Three-D imaging inside the Earth can help society find new resources, said Tromp. The iterative inversion methods they used to model structures deep below are the same ones used in exploration seismology to look for hidden hydrocarbons.
“There’s a wonderful synergy at the moment,” Tromp said. “The kinds of things we’re doing here with earthquakes to try and image the Earth’s crust and upper mantle and what people are doing in exploration geophysics to try and image hydrocarbon reservoirs.”
“In my point of view, it’s the era of big seismic data,” Chen said. She said their ultimate goal is to make everything about seismic imaging methods automatic and accessible by anyone to better understand the Earth.
It sounded something like a Google Earth for inside the Earth itself. “Right, exactly. Assisted by the supercomputing systems of XSEDE, you can have a tour inside the Earth and possibly make some new discoveries.” Chen said.
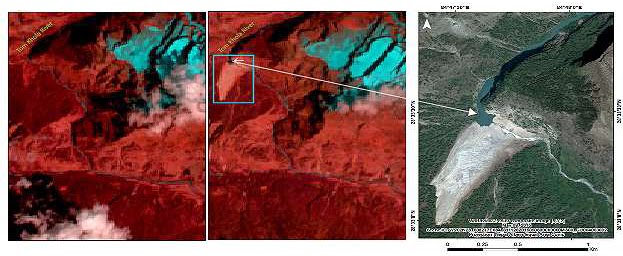
A University of Dayton geologist is helping a NASA-U.S. Geological Survey volunteer group detect severe hazards developing as a result of the April 25 and May 12 earthquakes in Nepal.
Umesh Haritashya, an assistant geology professor, leads a group reviewing satellite photos of the Nepalese peak section of Manaslu, the world’s eighth-highest mountain, for “secondary and tertiary hazards like landslides and river blockages.”
This effort is part of the 50-member international volunteer group formed after the Gorkha quake under the umbrella of the NASA international Global Land Ice Measurements from Space project led by Jeff Kargel from the University of Arizona.
“Hopefully, our work will help direct resources to the right place or avert potential future problems due to large mass movements,” Haritashya said.
Haritashya said landslides have blocked rivers and formed lakes at many river basins in the mountainous region. With continuous aftershocks and a second major earthquake such as one on May 12, along with the fast-approaching monsoon season, Haritashya said these lakes are in danger of spilling water into remote villages.
“It is important to understand that no such major threat has been observed at this point, but it is a continuously developing story and we are keeping an eye on a daily basis,” Haritashya said.
Haritashya joined the University of Dayton’s geology department after completing a post-doctoral research appointment in NASA’s international Global Land Ice Measurements from Space project at the University of Nebraska-Omaha.
His research interests include hydropower, water resources, glaciers, climate change and the Himalayas. He is an editorial board member of the Journal of Hydrologic Engineering, The Open Hydrology Journal and Himalayan Geology. Haritashya also helped edit Encyclopedia of Snow, Ice and Glaciers.
For centuries, people have imagined the possibility of life on Mars. But long-held dreams that Martians could be invaders of Earth, or little green men, or civilized superbeings, all have been undercut by missions to our neighboring planet that have, so far, uncovered no life at all.
Yet visits to the Red Planet by unmanned probes from NASA and the European Space Agency have found evidence that a prime condition for life once may have existed: water.”There has been a tremendous amount of very exciting findings this year that Mars once contained actively flowing, low-saline, near-neutral-pH water — pretty much the type of water where you find life on Earth today,” said Alison Olcott Marshall, assistant professor of geology at the University of Kansas. “This has made people think that it’s possible that life could have existed on Mars, although most researchers agree it’s unlikely to exist today — at least on the surface — as conditions on the surface of Mars are incredibly harsh.”
Olcott Marshall is working with her colleague and husband, Craig Marshall, associate professor of geology at KU, to improve the way scientists detect condensed aromatic carbon, thought to be a chemical signature of astrobiology.
“If we’re going to identify life on Mars, it will likely be the fossil remnants of the chemicals once synthesized by life, and we hope our research helps strengthen the ability to evaluate the evidence collected on Mars,” Craig Marshall said.
Craig Marshall is an expert in using Raman spectroscopy to look for carbonaceous materials, while Alison Olcott Marshall is a paleontologist interested in how the record of life gets preserved on Earth, especially when there is no bone or shell or tooth or other hard part to fossilize.
The pair is known recently for overturning the idea that 3.5 billion-year-old specks found in rocks in Australia were the oldest examples of life on Earth. (Rather than ancient bacteria fossils, the researchers showed the shapes were nothing more than tiny gaps in the rock that are packed with minerals.)
If traces if ancient biology are detected in Mars, the KU researchers want to make sure the evidence is more conclusive.
According to a recent paper by the Marshalls in the peer-reviewed Philosophical Transactions of the Royal Society, by itself Raman spectroscopy is able to screen for carbonaceous material, but it can’t determine its source — thus the technology needs to be supplemented in order to determine if life exists on Mars.
“Raman spectroscopy works by impinging a laser on a sample so the molecules within that sample vibrate at diagnostic frequencies,” Craig Marshall said. “Measuring those frequencies allows the identification of inorganic and organic materials. It’s insufficient because however the carbonaceous material is made, it will be the same chemically and structurally, and thus Raman spectroscopy cannot determine the origin.”
The Marshalls call for the use of gas chromatography/mass spectroscopy to supplement Raman spectroscopy and develop more conclusive evidence of ancient extraterrestrial life.
“Much like the search for ancient life on Earth, though, one strand of evidence is not, and should not be, conclusive,” said Alison Olcott Marshall. “This is a vast puzzle, and we want to make sure we are examining as many different pieces as we can.”
Currently, the KU researchers are extending this line of investigation by using Raman spectroscopy to analyze rocks from Earth that are similar to those on Mars. They hope to publish their findings in the near future.
“If you were to pick up a typical rock on Mars it would look quite different, chemically, from a typical rock here on Earth, not to mention the fact that it would be covered in rusty dust,” Alison Olcott Marshall said. “Previous research into how Raman spectroscopy would fare on Mars was mainly done on pure salts and minerals, often ones synthesized in a lab. We identified field sites on the Kansas-Oklahoma border with a chemical content more like what could be found on Mars, right down to the rusty dust, and we’ve been exploring how Raman spectroscopy fares in such an environment.”
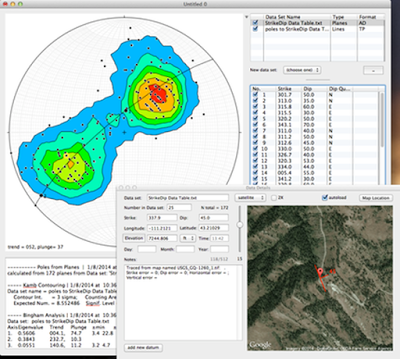
Stereonet 9 brings location and date tagging of individual measurements as well as a free form notes field. Points with location data can be plotted on a Google satellite (or terrain or roadmap) image right in the program. This version of Stereonet is compatible with all modern operating systems and has a modern user interface which has been modeled after OSXStereonet for Mac by Nestor Cardozo and me. It can read and write older Stereonet text files but has a new binary format for its native file.
Stereonet 9 for Macintosh uses the modern Mac OS X “Cocoa” architecture. The Macintosh version is being made available here for those users who need binary file compatibility with the Windows version. Stereonet 9 for Macintosh does not have the nifty 3D viewing of OSXStereonet, but does have Google satellite visualization. Stereonet 9 requires Mac OS X 10.7 (Lion) or higher.
For those hardy souls using Linux, you too can download a copy of Stereonet 9, though I have never seen it run on a Linux box and don’t know if there are any compatibility issues!
For long term viability of your data, however, you should still export any work as text files which will always be readable by a large number of programs.
A comprehensive manual is included with the zip archive. For Mac Users still on Mac OS X 10.5 and lower (Leopard, Tiger, etc.), you can download a Carbon version of Stereonet. Note that this version will not be kept up to date with the above Cocoa version.
Version History
Version 9.3.0 — 2015.05.13
Major improvements to the Rose diagram functionality, including:
Scale the petals by either length or area (new). Only length was possible before
Calculation of the mean direction for axial data (i.e., data with no directional significance). this is sometimes referred to as Krumbein’s (1939) mean
Half circle rose diagrams always show Krumbein’s mean; full circle diagrams can either depict vector azimuths or, if “treat data as axes” is checked in the Inspector, the full circle diagrams will be symmetric (this has been a highly requested feature that I’ve resisted until now!)
Addition of a Von Mises Distribution option to the Calculations menu which displays the same 2D azimuthal statistics as the Rose diagram displays. The program now calculates the circular variance, kappa, and 1 sigma standard error for azimuthal data.
Plots wil polar grids can now be saved as .pdf and .svg files
Fixed a bug that occurred when planes were being entered in “DD” format and the data details window was opened.
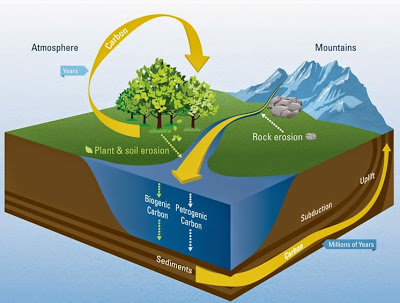
Plants convert carbon dioxide from the atmosphere into organic carbon via photosynthesis. Most of this carbon eventually returns to the atmosphere when plant material (or animals that eat plants) decompose. A small fraction of this material, however, ends up in rivers. They carry it out to sea, where some settles to the seafloor and is buried and disconnected from the atmosphere for millions of years and eventually makes its way back to the surface in the form of rocks. At the same time, rivers also erode carbon-containing rocks into particles carried downstream. The process exposes carbon to air, oxidizing the previously locked-up carbon into carbon dioxide that can leak back out to the atmosphere. Credit: Illustration by Eric Taylor, Woods Hole Oceanographic Institutio
Humans concerned about climate change are working to find ways of capturing excess carbon dioxide (CO2) from the atmosphere and sequestering it in the Earth. But Nature has its own methods for the removal and long-term storage of carbon, including the world’s river systems, which transport decaying organic material and eroded rock from land to the ocean.
While river transport of carbon to the ocean is not on a scale that will bail humans out of our CO2 problem, we don’t actually know how much carbon the world’s rivers routinely flush into the ocean — an important piece of the global carbon cycle.
But in a study published May 14 in the journal Nature, scientists from Woods Hole Oceanographic Institution (WHOI) calculated the first direct estimate of how much and in what form organic carbon is exported to the ocean by rivers. The estimate will help modelers predict how the carbon export from global rivers may shift as Earth’s climate changes.
“The world’s rivers act as Earth’s circulatory system, flushing carbon from land to the ocean and helping reduce the amount that returns to the atmosphere in the form of heat-trapping carbon dioxide,” said lead author and geochemist Valier Galy. “Some of that carbon–‘new’ carbon–is from decomposed plant and soil material that is washed into the river and then out to sea. But some of it comes from carbon that has long been stored in the environment in the form of rocks– ‘old’ carbon–that have been eroded by weather and the force of the river.”
The scientists, who included Bernhard Peucker-Ehrenbrink, and Timothy Eglinton (now at ETH Zürich), amassed data on sediments flowing out of 43 river systems all over the world, which cumulatively account for 20 percent of the total sediments discharged by rivers. The representative rivers also encompassed a broad range of climates, vegetation, geological conditions, and levels of disturbance by people.
From these river sediment flow measurements, the research team calculated amounts of particles of carbon-containing plant and rock debris that each river exported. They estimated that the world’s rivers annually transport 200 megatons (200 million tons) of carbon to the ocean. The total equals about .02 percent of the total mass of carbon in the atmosphere. That may not seem like a lot, but over 1000 to 10,000 years, it continues to add up to significant amounts of carbon (20 and 200 percent) extracted from the atmosphere.
Generally, plants convert CO2 from the atmosphere into organic carbon via photosynthesis. But most of this carbon eventually returns to the atmosphere when plant material (or animals that eat plants) decompose. A small fraction of this material, however, ends up in rivers. They carry it out to sea, where some settles to the seafloor and is buried and disconnected from the atmosphere for millions of years and eventually makes its way back to the surface in the form of rocks.
At the same time, rivers also erode carbon-containing rocks into particles carried downstream. The process exposes carbon to air, oxidizing the previously locked-up carbon into carbon dioxide that can leak back out to the atmosphere. Until now, scientists had no way to distinguish how much of the carbon whisked away by rivers comes from either the biospheric or petrogenic (rock) sources. Without this information, scientists’ ability to model or quantitatively predict carbon sequestration under different scenarios was limited.
To solve this dilemma, the scientists found a novel way to distinguish for the first time the sources of that carbon–either from eroded rocks or from decomposed plant and soil material. They analyzed the amounts of carbon-14, a radioactive isotope, in the river particles. Carbon-14 decays away within about 60,000 years, so it is present only in material that came from living things, and not rocks. Subtracting the portion of particles that did not contain carbon-14, the scientists calculated the percentage that was derived from the terrestrial biosphere: about 80 percent.
But even though biospheric carbon is the major source of carbon exported by rivers, the scientists also discovered that rivers surrounded by greater amounts of vegetation didn’t necessarily transport more carbon to the ocean. Instead, the export was “primarily controlled by the capacity of rivers to mobilize and transport” particles. Erosion is the key factor–the more erosion occurs along the river, the more carbon it transfers to sea and sequesters from the air.
“The atmosphere is a small reservoir of carbon compared to rocks, soils, the biosphere, and the ocean,” the scientists wrote in Nature. “As such, its size is sensitive to small imbalances in the exchange with and between these larger reservoirs.”
The new study gives scientists a firmer handle on measuring the important, and heretofore elusive, role of global rivers in the planetary carbon cycle and enhances their ability to predict how riverine carbon export may shift as Earth’s climate changes.
“This study will provide geochemical modelers with new insights on an important link between the global carbon and water cycles,” says Don Rice, program director in the National Science Foundation’s Division of Ocean Sciences, a major funder of the research.
Reference:
Valier Galy, Bernhard Peucker-Ehrenbrink, Timothy Eglinton. Global carbon export from the terrestrial biosphere controlled by erosion. Nature, 2015; 521 (7551): 204 DOI: 10.1038/nature14400
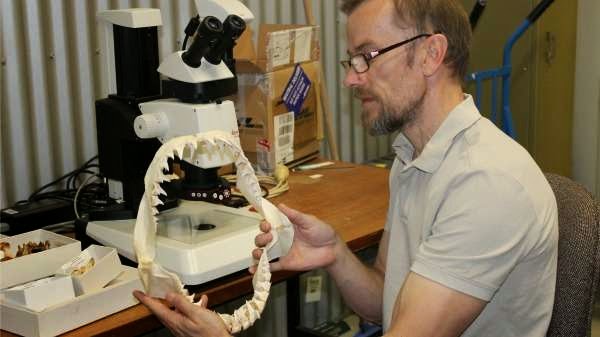
Dr Mikael Siversson examining the jaws of a modern long fin mako shark (Isurus paucus). Credit: H.Ryan/WA Museum
As an undergraduate student of geology I had become fascinated by palaeontology—in particular the study of marine vertebrate fossils from the Cretaceous period (145-66 million years ago).
Together with a fellow student I saved up enough money to travel to the USA in search of fossils.
One day we were prospecting a 75 million-year-old floodplain and shallow marine sediments, exposed in spectacularly scenic badland areas of north central Montana.
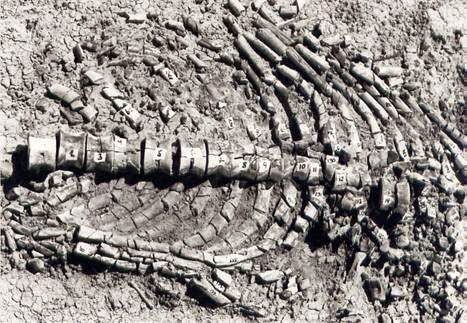
I was busy dry sieving a lens of marginal marine sand full of perfectly preserved shark teeth when my friend stumbled across an articulated but headless skeleton of a long-necked plesiosaur lying on its back in estuarine mud.
As we began marking the vertebrae I noticed deep bite marks on one of the leg bones.
Further excavation revealed a few teeth of a large individual of the apex predatory shark Archaeolamna kopingensis.
Sharks may lose teeth as they bite into tough prey and a plesiosaur’s torso was built like a tank.
The discovery and excavation of the plesiosaur skeleton and the dramatic story it reveals, with a shark probably weighing several hundred kilograms tearing at its limbs, cemented my desire as a young student to pursue a career in palaeontology.
Cretaceous plesiosaur skeleton. Credit: M. Siversson/WA Museum
In August 2011 a field party from the WA Museum came across another Cretaceous ‘crime scene’: this time in the Giralia Range, southeast of Exmouth where marine rocks of Early Cretaceous age are well-exposed.
One of the volunteers discovered a few bones lying near the top of a small hill of the Gearle Siltstone, which is approximately 108-107 million years old in this particular area.
The bones looked so well-preserved he initially thought they must have belonged to a modern animal like a sheep or a goat.
I was, however, able to determine that they were in fact of Cretaceous age and belonged to an extinct, dolphin-like marine reptile called an ichthyosaur.
The most complete bone discovered is a surangular bone that, together with several additional bones, makes up the lower jaw in these reptiles.
Upon closer examination I noticed that the incomplete front part of the bone had been nearly completely sheared off at an angle.
Another jaw fragment of the same ichthyosaur has multiple, parallel bite marks probably produced by smaller sharks.
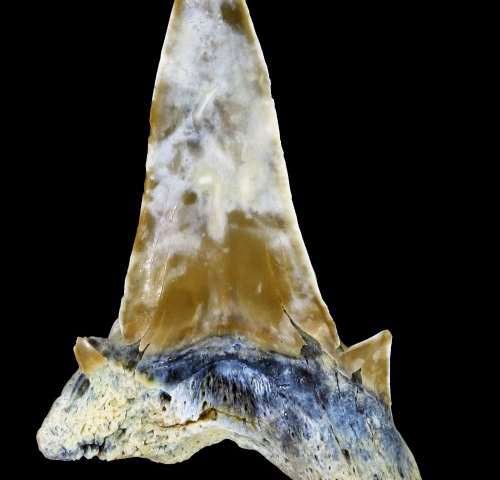
Front tooth of the early Cretaceous shark Dwardius, Giralia Range. Credit: M.Siversson/WA Museum
All but one of the shark species co-occurring with ichthyosaurs in the Giralia Range were either small or very rare.
A distant relative of the white shark, belonging in the extinct genus Dwardius, was however both common and large enough to potentially prey on ichthyosaurs.
Its fossilised teeth have been found in England, France and now also in Western Australia.
The ‘detective’ aspect of vertebrate palaeontology, looking for clues on the bones, is an incredibly exciting field of research.
In some cases palaeontologists have found direct evidence of predatory behaviour with tooth-fragments of the predator imbedded in healed bone tissue.
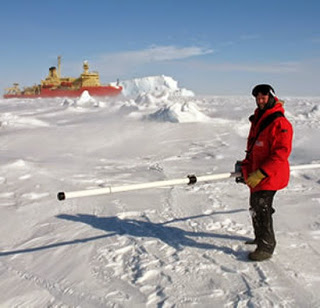
Blake Weissling researching in the Antarctic in 2007.
In October, UTSA College of Sciences faculty members Stephen Ackley and Blake Weissling wlll travel to the Arctic as a part of a project funded by the Office of Naval Research (ONR) to study the diminishing ice cover. The pair will join a team of nearly 20 scientists from around the world for the 42-day trip from Nome, Alaska into the Arctic Ocean.
Ackley has conducted research in the polar regions for more than 30 years and has a specific geographic location, “Ackley Point,” named after him. Ackley Point is located on Ross Island, an island formed by four volcanoes in the Ross Sea, near Antarctica. This will be his 12th trip to study polar sea ice, conducted from either drifting ice camps or aboard a vessel.
An assistant research professor in the UTSA Department of Geological Sciences, Weissling has led UTSA students conducting ice research in the Arctic, the Antarctic and at Pico de Orizaba, a volcano east of Mexico City. Ackley and Weissling will travel on the “Sikuliak,” an icebreaking ship making its maiden voyage into the ice.
Project leaders hope to develop methods to quantify how the ice is changing. Satellite remote sensing has captured how the ice surface area has been changing, but accurately measuring the region’s ice thickness from above has been a challenge.
“The Navy is particularly concerned with improving its models for atmospheric sensing and for waves,” said Ackley. “When the ice cover is taken away, then the potential for ocean waves builds up. The waves can be a major factor in any kind of economic development involving oil rigs, shipping, search and rescue efforts, and Navy operations. Large waves can also affect the native residents going out to hunt.”
Weissling added, “We are going to be looking for storm events so we can measure the oceanographic, meteorological, and ice parameters associated with waves. We will be looking at how the waves are interacting with the ice edge, because the ice edge dampens wave fields dramatically.”
The UTSA researchers are supported by an ONR research grant as well as a $500,000 Department of Defense instrumentation grant. They have used the instrumentation grant to purchase sophisticated equipment including radars, a light detection and ranging (LIDAR) system and two electromagnetic induction meters. LIDAR systems incorporate a remote sensing method that uses light in the form of a pulsed laser to measure variable distances to the Earth. The electromagnetic induction instruments will enable researchers to measure sea ice thickness within a few centimeters of accuracy, either on the surface or from the vessel.
Once the researchers return, they envision another two years of data analysis.
After the exploratory trip is complete, UTSA faculty members representing various colleges will benefit. Much of the equipment purchased has additional applications and can be used in the geosciences, civil engineering, architecture and archaeology.
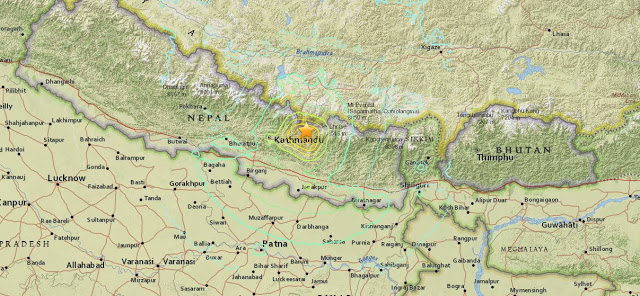
The May 12, 2015 M 7.3 Nepal earthquake (SE of Zham, China) occurred as the result of thrust faulting on or near the decollément associated with the Main Himalayan Thrust, which defines the interface between the underthrusting India plate and the overriding Eurasia plate to the north. At the location of this earthquake, approximately 80 km to the east-northeast of the Nepalese capital of Kathmandu, the India plate is converging with Eurasia at a rate of 45 mm/yr towards the north-northeast – a fraction of which (~18 mm/yr) is driving the uplift of the Himalayan mountain range. The May 12, 2015 event is the largest aftershock to date of the M 7.8 April 25, 2015 Nepal earthquake – known as the Gorkha earthquake – which was located 150 km to the west, and which ruptured much of the decollément between these two earthquakes.
While commonly plotted as points on maps, earthquakes of this size are more appropriately described as slip over a larger fault area. Events of the size of the May 12, 2015 earthquake are typically about 55×30 km in size (length x width). The April 25, 2015 M 7.8 mainshock had approximate dimensions of ~120×80 km, directed from its hypocenter eastwards, and towards Kathmandu. The May 12, 2015 earthquake is located just beyond the eastern end of that rupture.
The boundary region of the India and Eurasia plates has a history of large and great earthquakes. Prior to April 25, four events of M6 or larger had occurred within 250 km of this area over the past century. One, a M 6.9 earthquake in August 1988, 140 km to the south-southeast of the May 12 event, caused close to 1500 fatalities. The largest, an M 8.0 event known as the 1934 Nepal-Bihar earthquake, ruptured a large section of the fault to the south of this May 2015 event, and east of the April 2015 mainshock, in a similar location to the 1988 earthquake. It severely damaged Kathmandu, and is thought to have caused around 10,600 fatalities. Prior to the 20th century, a large earthquake in 1833 is thought to have ruptured a similar area as the April 25, 2015 event. To date, there have been close to 100 M3+ aftershocks of the Gorkha earthquake. In the first two hours after the May 12 event, six further aftershocks have occurred, to the southwest-to-southeast of that earthquake.
Seismotectonics of the Himalaya and Vicinity
Seismicity in the Himalaya dominantly results from the continental collision of the India and Eurasia plates, which are converging at a relative rate of 40-50 mm/yr. Northward underthrusting of India beneath Eurasia generates numerous earthquakes and consequently makes this area one of the most seismically hazardous regions on Earth. The surface expression of the plate boundary is marked by the foothills of the north-south trending Sulaiman Range in the west, the Indo-Burmese Arc in the east and the east-west trending Himalaya Front in the north of India.
The India-Eurasia plate boundary is a diffuse boundary, which in the region near the north of India, lies within the limits of the Indus-Tsangpo (also called the Yarlung-Zangbo) Suture to the north and the Main Frontal Thrust to the south. The Indus-Tsangpo Suture Zone is located roughly 200 km north of the Himalaya Front and is defined by an exposed ophiolite chain along its southern margin. The narrow (<200km) Himalaya Front includes numerous east-west trending, parallel structures. This region has the highest rates of seismicity and largest earthquakes in the Himalaya region, caused mainly by movement on thrust faults. Examples of significant earthquakes, in this densely populated region, caused by reverse slip movement include the 1934 M8.1 Bihar, the 1905 M7.5 Kangra and the 2005 M7.6 Kashmir earthquakes. The latter two resulted in the highest death tolls for Himalaya earthquakes seen to date, together killing over 100,000 people and leaving millions homeless. The largest instrumentally recorded Himalaya earthquake occurred on 15th August 1950 in Assam, eastern India. This M8.6 right-lateral, strike-slip, earthquake was widely felt over a broad area of central Asia, causing extensive damage to villages in the epicentral region.
The Tibetan Plateau is situated north of the Himalaya, stretching approximately 1000km north-south and 2500km east-west, and is geologically and tectonically complex with several sutures which are hundreds of kilometer-long and generally trend east-west. The Tibetan Plateau is cut by a number of large (>1000km) east-west trending, left-lateral, strike-slip faults, including the long Kunlun, Haiyuan, and the Altyn Tagh. Right-lateral, strike-slip faults (comparable in size to the left-lateral faults), in this region include the Karakorum, Red River, and Sagaing. Secondary north-south trending normal faults also cut the Tibetan Plateau. Thrust faults are found towards the north and south of the Tibetan Plateau. Collectively, these faults accommodate crustal shortening associated with the ongoing collision of the India and Eurasia plates, with thrust faults accommodating north south compression, and normal and strike-slip accommodating east-west extension.
Along the western margin of the Tibetan Plateau, in the vicinity of south-eastern Afghanistan and western Pakistan, the India plate translates obliquely relative to the Eurasia plate, resulting in a complex fold-and-thrust belt known as the Sulaiman Range. Faulting in this region includes strike-slip, reverse-slip and oblique-slip motion and often results in shallow, destructive earthquakes. The active, left-lateral, strike-slip Chaman fault is the fastest moving fault in the region. In 1505, a segment of the Chaman fault near Kabul, Afghanistan, ruptured causing widespread destruction. In the same region the more recent 30 May 1935, M7.6 Quetta earthquake, which occurred in the Sulaiman Range in Pakistan, killed between 30,000 and 60,000 people.
On the north-western side of the Tibetan Plateau, beneath the Pamir-Hindu Kush Mountains of northern Afghanistan, earthquakes occur at depths as great as 200 km as a result of remnant lithospheric subduction. The curved arc of deep earthquakes found in the Hindu Kush Pamir region indicates the presence of a lithospheric body at depth, thought to be remnants of a subducting slab. Cross-sections through the Hindu Kush region suggest a near vertical northerly-dipping subducting slab, whereas cross-sections through the nearby Pamir region to the east indicate a much shallower dipping, southerly subducting slab. Some models suggest the presence of two subduction zones; with the Indian plate being subducted beneath the Hindu Kush region and the Eurasian plate being subducted beneath the Pamir region. However, other models suggest that just one of the two plates is being subducted and that the slab has become contorted and overturned in places.
Shallow crustal earthquakes also occur in this region near the Main Pamir Thrust and other active Quaternary faults. The Main Pamir Thrust, north of the Pamir Mountains, is an active shortening structure. The northern portion of the Main Pamir Thrust produces many shallow earthquakes, whereas its western and eastern borders display a combination of thrust and strike-slip mechanisms. On the 18 February 1911, the M7.4 Sarez earthquake ruptured in the Central Pamir Mountains, killing numerous people and triggering a landside, which blocked the Murghab River.
Further north, the Tian Shan is a seismically active intra-continental mountain belt, which extends 2500 km in an ENE-WNW orientation north of the Tarim Basin. This belt is defined by numerous east-west trending thrust faults, creating a compressional basin and range landscape. It is generally thought that regional stresses associated with the collision of the India and Eurasia plates are responsible for faulting in the region. The region has had three major earthquakes (>M7.6) at the start of the 20th Century, including the 1902 Atushi earthquake, which killed an estimated 5,000 people. The range is cut through in the west by the 700-km-long, northwest-southeast striking, Talas-Ferghana active right-lateral, strike-slip fault system. Though the system has produced no major earthquakes in the last 250 years, paleo-seismic studies indicate that it has the potential to produce M7.0+ earthquakes and it is thought to represent a significant hazard.
The northern portion of the Tibetan Plateau itself is largely dominated by the motion on three large left-lateral, strike-slip fault systems; the Altyn Tagh, Kunlun and Haiyuan. The Altyn Tagh fault is the longest of these strike slip faults and it is thought to accommodate a significant portion of plate convergence. However, this system has not experienced significant historical earthquakes, though paleoseismic studies show evidence of prehistoric M7.0-8.0 events. Thrust faults link with the Altyn Tagh at its eastern and western termini. The Kunlun Fault, south of the Altyn Tagh, is seismically active, producing large earthquakes such as the 8th November 1997, M7.6 Manyi earthquake and the 14th November 2001, M7.8 Kokoxili earthquake. The Haiyuan Fault, in the far north-east, generated the 16 December 1920, M7.8 earthquake that killed approximately 200,000 people and the 22 May 1927 M7.6 earthquake that killed 40,912.
The Longmen Shan thrust belt, along the eastern margin of the Tibetan Plateau, is an important structural feature and forms a transitional zone between the complexly deformed Songpan-Garze Fold Belt and the relatively undeformed Sichuan Basin. On 12 May 2008, the thrust belt produced the reverse slip, M7.9 Wenchuan earthquake, killing over 87,000 people and causing billions of US dollars in damages and landslides which dammed several rivers and lakes.
Southeast of the Tibetan Plateau are the right-lateral, strike-slip Red River and the left-lateral, strike-slip Xiangshuihe-Xiaojiang fault systems. The Red River Fault experienced large scale, left-lateral ductile shear during the Tertiary period before changing to its present day right-lateral slip rate of approximately 5 mm/yr. This fault has produced several earthquakes >M6.0 including the 4 January 1970, M7.5 earthquake in Tonghai which killed over 10,000 people. Since the start of the 20th century, the Xiangshuihe-Xiaojiang Fault system has generated several M7.0+ earthquakes including the M7.5 Luhuo earthquake which ruptured on the 22 April 1973. Some studies suggest that due to the high slip rate on this fault, future large earthquakes are highly possible along the 65km stretch between Daofu and Qianning and the 135km stretch that runs through Kangding.
Shallow earthquakes within the Indo-Burmese Arc, predominantly occur on a combination of strike-slip and reverse faults, including the Sagaing, Kabaw and Dauki faults. Between 1930 and 1956, six M7.0+ earthquakes occurred near the right-lateral Sagaing Fault, resulting in severe damage in Myanmar including the generation of landslides, liquefaction and the loss of 610 lives. Deep earthquakes (200km) have also been known to occur in this region, these are thought to be due to the subduction of the eastwards dipping, India plate, though whether subduction is currently active is debated. Within the pre-instrumental period, the large Shillong earthquake occurred on the 12 June 1897, causing widespread destruction.
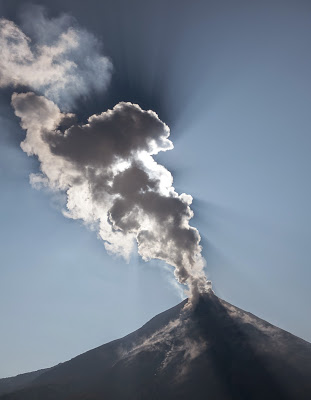
This image of ash and gases exploding from Volcan de Colima was taken by the research team during the study. Credit: Paul Cole/Plymouth University
The varying scale and force of certain volcanic eruptions are directly influenced by the distribution of gases within magma inside a volcano’s conduit, according to a new study.
Using state of the art equipment including UV cameras and electron microscopes, researchers from Plymouth University led a project to analyse the eruptive plumes and ash generated by Volcán de Colima, the most active volcano in the Americas.
Working alongside academics from the University of Cambridge and the Universidad de Colima in Mexico, they documented for the first time marked differences in the vesicularity, crystal characteristics and glass composition in juvenile material from the volcanic explosions.
The results led them to suggest that degassing which occurs during magma ascent leads to a build-up of both fast-ascending gas-rich magma pulses together with slow-ascending gas poor pulses within the volcano’s conduit, which in turn determine the explosivity of any resulting eruption.
This particular type of volcanic activity is known as a Vulcanian explosion, and while they are explosive and short-lived, they often see large amounts of ash and magma fired more than 10km into the Earth’s atmosphere.
Dr Paul Cole, Lecturer in Geohazards at Plymouth University, said: “Vulcanian explosions can be hazardous, and the purpose of this study is to try and get some understanding of what controls the explosions themselves. Volcan de Colima became active again in 2013, and our concern is that this may be the forerunner to something more serious as it has previously erupted every 100 years or so, with the last major eruption in 1913. With tens of thousands of people living in communities regularly evacuated because of the volcano, any increased knowledge of its activity could obviously have a marked effect.”
Vulcanian explosions are among the most common types of volcanic activity observed at silicic volcanoes, and have also recently been in evidence at the Calbuco volcano in Chile.
Magma ascent rates have often been invoked as being the fundamental control on their explosivity, yet until now this factor is poorly constrained, partly due to the rarity of ash samples and low gas fluxes.
For this study, researchers employed a multi-disciplinary approach to address this, measuring sulphur dioxide fluxes emanating from the summit, as well as collecting ash for subsequent quantitative crystal and micro-geochemical analysis.
Dr Cole added: “This research has enhanced our knowledge, but we now need to explore whether the phenomena we have identified here are mirrored elsewhere. The current eruptions at Calbuco in Chile can also further our understanding of this type of activity and assist in our efforts to build a picture of how this gaseous interaction takes place, and the effects it has. Ultimately, it could help in our ongoing efforts to improve safety for communities living in the shadow of volcanoes.”
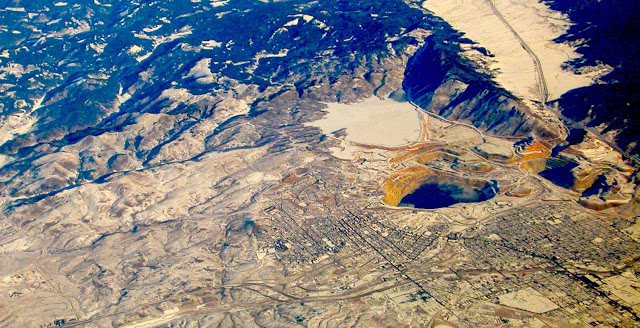
Aerial view of porphyry copper deposit at Butte, Montana. Credit: Stephen Kesler
Climate helps drive the erosion process that exposes economically valuable copper deposits and shapes the pattern of their global distribution, according to a new study from researchers at the University of Idaho and the University of Michigan.
Nearly three-quarters of the world’s copper production comes from large deposits that form about 2 kilometers (1.2 miles) beneath the Earth’s surface, known as porphyry copper deposits. Over the course of millions to tens of millions of years, they are exposed by erosion and can then be mined.
Brian Yanites of the University of Idaho and Stephen Kesler of the University of Michigan examined data on the age and number of exposed porphyry copper deposits worldwide. When they compared those data to the climate in each region, they noticed a pattern: The youngest deposits are in areas of high rainfall, such as the tropics, where erosion was rapid. Deposits are older in dry areas that have low rates of erosion.
Then they counted the number of deposits in the different regions and found something striking. Where erosion is rapid, there were relatively few deposits, but locations with low erosion rates contain lots of deposits. Such regions include the Atacama Desert in the Andes Mountains and the American Southwest–both places where porphyry copper mining is important to the economy.
By using porphyry copper deposits as a marker of a specific depth (2 kilometers) beneath the Earth’s surface, Yanites and Kesler were able to determine how rapidly the overlying crust had been eroded. The results showed that climate-driven erosion influenced the age and abundance of exposed copper porphyry deposits around the world.
Their findings are scheduled for online publication May 11 in Nature Geoscience.
“An important conclusion of this paper is that climate has a strong impact on the rate at which mountains are eroded and on the distribution of global copper resources. This effect persists over very long periods of Earth’s history,” said Kesler, an emeritus professor in the U-M Department of Earth and Environmental Sciences.
“The length of time is surprising. Most people would say that rainfall and climate are important to erosion, but usually only over short periods–perhaps up to a million years. This study shows that the effects have extended for tens of millions of years.”
Yanites is an assistant professor in UI’s Department of Geological Sciences and a former postdoctoral researcher at U-M. He is a geomorphologist, studying Earth’s topography. Kesler is an economic geologist, studying the formation of deposits that can be mined for raw materials.
“This is the first time that we’ve found a connection between geomorphology and economic geology,” Yanites said. “It’s exciting to think that erosion and the building of our mountain landscapes influences where society gets its resources from, and it’s another line of evidence showing the importance of climate in shaping the landscape.”
The study shows that the number of porphyry copper deposits in a region reflects the cumulative history of erosion experienced by the rocks there. As erosion removes overlying material, underlying rock rises toward the surface. So the amount of time a rock unit spends at a specific crustal depth depends on the history of erosion above that zone.
Rocks that are rapidly exhumed spend less time at depths of around 2 kilometers that are most favorable for the processes that form porphyry copper deposits. Therefore, fewer deposits will be observed when this level is exposed at the surface.
Yanites compared the relationship between erosion rate and the number of copper deposits in a region to a game on the TV show “American Gladiators,” where competitors had to run past tennis-ball-launching cannons to reach their goal.
“The faster the competitors run, the lower the chance that they will get hit because they spend less time in the ‘danger zone,'” Yanites said. “Similarly, rock layers that spend less time in the porphyry production zone–due to rapidly eroding landscapes above–have less of a chance of getting injected with one of these valuable deposits.”
Kesler said the new paper is the result of a fortuitous collaboration that developed several years ago after Yanites attended a talk by Kesler about a mathematical model describing how copper deposits move through the Earth’s crust after forming at a depth of 2 kilometers. Yanites was a U-M postdoc at the time.
“Because we know how many deposits are at the surface, and we know the ages of those deposits, the model calculation told us how many deposits were in the subsurface,” Kesler said. “And because we know the rate at which we mine copper, we could show that there are enough deposits to supply the mining industry for only a few thousand years. This puts a limit on what you might essentially call the sustainability of our lifestyle on the planet, even with good recycling.”
Yanites borrowed data from the study by Kesler and retired U-M professor Bruce Wilkinson and used it to reach novel conclusions about the climate signal in exhumation patterns revealed by porphyry copper deposits. The work by Yanites and Kesler was supported in part by the National Science Foundation.
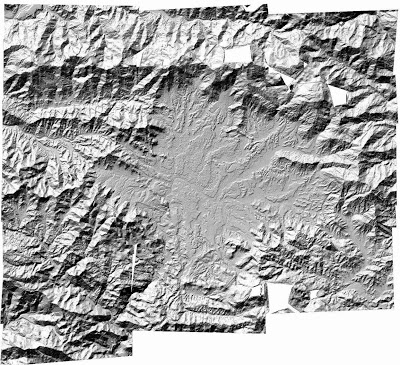
Two university research teams are employing satellite imagery and supercomputers to produce high-resolution images to aid the Nepali earthquake relief effort. This image is a hillshade-rendered Digital Terrain Model image of the Kathmandu Valley, Nepal, created by SETSM software. The Ohio Supercomputer Center is providing the computing power for these data-intensive calculations. Credit: Ian Howat/The Ohio State University
Researchers who normally use high-resolution satellite imagery to study glaciers are using their technology this week to help with disaster relief and longer-term stabilization planning efforts related to the recent earthquake in Nepal.
On April 25, a violent earthquake struck central Nepal, killing more than 7,000 people and destroying hundreds of thousands of homes. The deadliest earthquake in Nepal since 1934, the tremor killed at least 19 climbers and crew on Mount Everest and reportedly produced casualties in the adjoining countries of Bangladesh, China and India.
Two research teams – one at The Ohio State University and another at the University of Minnesota – are working quickly to employ Surface Extraction for TIN-based Searchspace Minimization (SETSM) software to produce high-resolution, 3-D digital surface maps for use in the Nepali relief effort. The Ohio Supercomputer Center is providing the computing power for these data-intensive calculations.
“These data are critical for a range of uses, including mapping infrastructure, planning rescues and assessing slope stability,” explained Ian Howat, Ph.D., an associate professor of Earth Sciences at Ohio State and a principal investigator in the Glacier Dynamics Research Group at the university’s Byrd Polar and Climate Research Center. “Thus far, we have produced a mosaic that models the Kathmandu area with measurements at eight-meter intervals.”
“To support this effort, we have granted the SETSM team priority queuing and an emergency allocation of up to 60,000 core hours for use of our flagship supercomputer system, the Oakley Cluster,” said Brian Guilfoos, HPC Client Services Manager at the Ohio Supercomputer Center.
The SETSM software is a fully automatic algorithm for deriving the surface maps, called Digital Terrain Models, or DTMs. The maps are created from applying the algorithm to sets of overlapping pairs of high-resolution satellite images acquired by colleagues at the Polar Geospatial Center at the University of Minnesota. The satellite images are acquired from the Worldview-1 and Worldview-2 satellites, owned by DigitalGlobe Inc., and are licensed through the National Geospatial-Intelligence Agency’s NextView program. The Polar Geospatial Center will distribute the final products on the organization’s website.
“Besides improving on this DTM, we will be processing the entirely useable archive of Worldview stereo imagery over Nepal, starting this week, in order to expand coverage,” said Myoung-Jong Noh, a member of the Glacier Dynamics Research Group at the Byrd Center and the lead author of a scientific paper on SETSM in the journal GIScience & Remote Sensing.
The DTMs are built using photogrammetric techniques in which common features are identified in each image and are used to model the relative three-dimensional position of the terrain. These DTMs are constructed without ground control and rely on the satellite-positioning model to locate the surface in space. The accuracy of the DTM is expected to be within several meters in the vertical dimension. The initial version of the Nepal mosaic was produced automatically and, therefore, has some small errors and edge artifacts that will be improved in the days ahead.
In partnership with the Polar Geospatial Center, the Ohio State group has embarked on a massive implementation of SETSM to derive high-resolution DTM mosaics of large areas, such as the Greenland Ice Sheet. SETSM is currently installed and running on high performance computing systems at the Ohio Supercomputer Center, the National Science Foundation’s Extreme Science and Engineering Discovery Environment and the National Aeronautics and Space Administration. SETSM was developed as part of grant NNX10AN61G from the National Aeronautics and Space Administration.
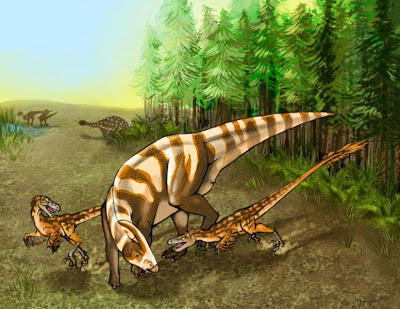
Two Saurornitholestes sullivani raptors attacks a subadult hadrosaur Parasaurolophus tubicen. Credit: Illustration by Mary P. Wiliams
A researcher from the University of Pennsylvania has identified a species of dinosaur closely related to Velociraptor, the group of creatures made infamous by the movie “Jurassic Park.” The newly named species likely possessed a keen sense of smell that would have made it a formidable predator.
Steven Jasinski, a doctoral student in the School of Arts & Sciences’ Department of Earth and Environmental Science at Penn and acting curator of paleontology and geology at the State Museum of Pennsylvania, discovered the new species while investigating a specimen originally assigned to a previously known species. His analysis suggests the fossil — part of the dinosaur’s skull — actually represents a brand new species, which Jasinski has named Saurornitholestes sullivani.
Jasinski reported his findings this month in the New Mexico Museum of Natural History and Science Bulletin.
The specimen, roughly 75 million years old, was discovered by paleontologist Robert Sullivan in the Bisti/De-Na-Zin Wilderness Area of New Mexico in 1999. When first described, scientists believed it was a member of Saurornitholestes langstoni, a species of theropod dinosaurs in the Dromaeosauridae family that had been found in present-day Alberta, Canada.
But when Jasinski began a comparative analysis of the specimen to other S. langstoni specimens, he found subtle differences. Notably, he observed that the surface of the skull corresponding with the brain’s olfactory bulb was unusually large. This finding implies a powerful sense of smell.
“This feature means that Saurornitholestes sullivani had a relatively better sense of smell than other dromaeosaurid dinosaurs, including Velociraptor, Dromaeosaurus, and Bambiraptor,” Jasinski said. “This keen olfaction may have made S. sullivani an intimidating predator as well.”
S. sullivani comes from the end of the time of dinosaurs, or the Late Cretaceous, and represents the only named dromaeosaur from this period in North America south of Montana.
At the time S. sullivani lived, North America was split into two continents separated by an inland sea. This dinosaur lived on the western shores in an area called Laramidia.
Numerous dromaeosaurs, which are commonly called raptors, are known from more northern areas in Laramidia, including Alberta and Montana. However, S. sullivani represents the only named dromaeosaur from the Late Cretaceous of southern Laramidia.
S. sullivani shared its world with numerous other dinosaurs. Plant-eating contemporary dinosaurs included the duck-billed hadrosaurs Parasaurolophus walkeri and Kritosaurus navajovius, the horned dinosaur Pentaceratops sternbergii, the pachycephalsaurs Stegoceras novomexicanum and Sphaerotholus goodwini and the ankylosaurs Nodocephalosaurus kirtlandensis and recently named Ziapelta sanjuanensis. Other contemporary meat-eating theropods included the tyrannosaurs Bistahieversor sealeyi and Daspletosaurus, along with ostrich-like ornithomimids.
Though a distinct species, S. sullivani appears to be closely related to S. langstoni. Finding the two as distinct species further shows that differences existed between dinosaurs between the northern and southern parts of North America.
At less than 3 feet at its hip and roughly 6 feet in length, S. sullivani was not a large dinosaur. However, previous findings of related species suggest the animal would have been agile and fast, perhaps hunting in packs and using its acute sense of smell to track down prey.
“Although it was not large, this was not a dinosaur you would want to mess with,” Jasinski said
New research, led by the University of Southampton, has questioned the role played by ocean acidification, produced by the asteroid impact that killed the dinosaurs, in the extinction of ammonites and other planktonic calcifiers 66 million years ago.
Ammonites, which were free-swimming molluscs of the ancient oceans and are common fossils, went extinct at the time of the end-Cretaceous asteroid impact, as did more than 90 per cent of species of calcium carbonate-shelled plankton (coccolithophores and foraminifera).
Comparable groups not possessing calcium carbonate shells were less severely affected, raising the possibility that ocean acidification, as a side-effect of the collision, might have been responsible for the apparent selectivity of the extinctions.
Previous CO2 rises on Earth happened so slowly that the accompanying ocean acidification was relatively minor, and ammonites and other planktonic calcifiers were able to cope with the changing ocean chemistry. The asteroid impact, in contrast, caused very sudden changes.
In the first modelling study of ocean acidification which followed the asteroid impact, the researchers simulated several acidifying mechanisms, including wildfires emitting CO2 into the atmosphere (as carbon dioxide emissions dissolve in seawater they lower the pH of the oceans making them more acidic and more corrosive to shells) and vaporisation of gypsum rocks leading to sulphuric acid or ‘acid rain’ being deposited on the ocean surface.
The researchers concluded that the acidification levels produced were too weak to have caused the disappearance of the calcifying organisms.
Professor Toby Tyrrell, from Ocean and Earth Science at the University of Southampton and co-author of the study, says: “While the consequences of the various impact mechanisms could have made the surface ocean more acidic, our results do not point to enough ocean acidification to cause global extinctions. Out of several factors we considered in our model simulation, only one (sulphuric acid) could have made the surface ocean severely corrosive to calcite, but even then the amounts of sulphur required are unfeasibly large.
“It throws up the question, if it wasn’t ocean acidification what was it?”
Possible alternative extinction mechanisms, such as intense and prolonged darkness from soot and aerosols injected into the atmosphere, should continue to be investigated.
The study, which is published in the Proceedings of the National Academy of Sciences (PNAS), involved researchers from the University of Southampton and the Leibniz Center for Tropical Marine Ecology. The project received funding from the European Project on Ocean Acidification and funding support from NERC, Defra and DECC to the UK Ocean Acidification programme (grant no. NE/H017348/1).
Reference:
Toby Tyrrell, Agostino Merico, and David Ian Armstrong McKay. Severity of ocean acidification following the end-Cretaceous asteroid impact. PNAS, May 11, 2015 DOI: 10.1073/pnas.1418604112
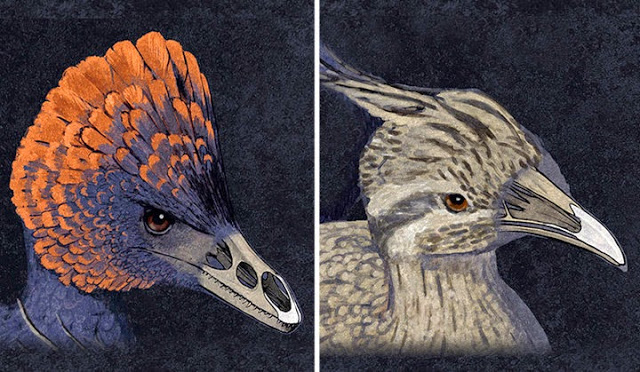
Scientists have successfully replicated the molecular processes that led from dinosaur snouts to the first bird beaks. Credit: Image courtesy of Yale University
Using the fossil record as a guide, a research team led by Yale paleontologist and developmental biologist Bhart-Anjan S. Bhullar and Harvard developmental biologist Arhat Abzhanov conducted the first successful reversion of a bird’s skull features. The scientists replicated ancestral molecular development to transform chicken embryos in a laboratory into specimens with a snout and palate configuration similar to that of small dinosaurs such as Velociraptor and Archaeopteryx.
Just don’t call them dino-chickens.
“Our goal here was to understand the molecular underpinnings of an important evolutionary transition, not to create a ‘dino-chicken’ simply for the sake of it,” said Bhullar, lead author of the study, published online May 12 in the journal Evolution.
Finding the mechanism to recreate elements of dinosaur physiology has been a topic of popular interest for some time. It has been featured in everything from molecular biologist Jack Horner’s 2009 book, “How to Build a Dinosaur,” to the upcoming Hollywood movie “Jurassic World.”
In this case, the fascination derives from the importance of the beak to avian anatomy. “The beak is a crucial part of the avian feeding apparatus, and is the component of the avian skeleton that has perhaps diversified most extensively and most radically — consider flamingos, parrots, hawks, pelicans, and hummingbirds, among others,” Bhullar explained. “Yet little work has been done on what exactly a beak is, anatomically, and how it got that way either evolutionarily or developmentally.”
In the new study, Bhullar and his colleagues detail a novel approach to finding the molecular mechanism involved in creating the skeleton of the beak. First, they did a quantitative analysis of the anatomy of related fossils and extant animals to generate a hypothesis about the transition; next, they searched for possible shifts in gene expression that correlated with the transition.
The team looked at gene expression in the embryos of emus, alligators, lizards, and turtles. The researchers discovered that both major living lineages of birds (the common neognaths and the rarer paleognaths) differ from the major lineages of non-bird reptiles (crocodiles, turtles, and lizards) and from mammals in having a unique, median gene expression zone of two different facial development genes early in embryonic development. This median gene expression had previously only been observed in chickens.
Using small-molecule inhibitors to eliminate the activity of the proteins produced by the bird-specific, median signaling zone in chicken embryos, the researchers were able to induce the ancestral molecular activity and the ancestral anatomy. Not only did the beak structure revert, but the process also caused the palatine bone on the roof of the mouth to go back to its ancestral state. “This was unexpected and demonstrates the way in which a single, simple developmental mechanism can have wide-ranging and unexpected effects,” Bhullar said.
The work took Bhullar from the alligator nests at Rockefeller Wildlife Refuge in southern Louisiana to an emu farm in Massachusetts. He extracted DNA from various species in order to clone fragments of genetic material to look for specific gene expression.
Bhullar said the research has several implications. For example, he said, if a single molecular mechanism was responsible for this transformation, there should be a corresponding, linked transformation in the fossil record. “This is borne out by the fact that Hesperonis — discovered by Othniel Charles Marsh of the Yale Peabody Museum of Natural History — which is a near relative of modern birds that still retains teeth and the most primitive stem avian with a modernized beak in the form of fused, elongate premaxillae, also possesses a modern bird palatine bone,” he said.
Premaxillae are the small bones at the tip of the upper jaw of most animals, but are enlarged and fused to form the beak of birds.
Bhullar noted that this same approach could be used to investigate the underlying developmental mechanisms of a host of great evolutionary transformations.
The other corresponding authors are Zachary Morris, Elizabeth Sefton, Bumjin Namkoong, and Jasmin Camacho, all of Harvard; Atalay Tok, of Uppsala University; Masayoshi Tokita, of Toho University; and David Burnham, of the University of Kansas.
Reference:
Bhart-Anjan S. Bhullar, Zachary S. Morris, Elizabeth M. Sefton, Atalay Tok, Masayoshi Tokita, Bumjin Namkoong, Jasmin Camacho, David A. Burnham, Arhat Abzhanov. A molecular mechanism for the origin of a key evolutionary innovation, the bird beak and palate, revealed by an integrative approach to major transitions in vertebrate history. Evolution, 2015; DOI: 10.1111/evo.12684
Note: The above story is based on materials provided by Yale University. The original article was written by Jim Shelton
Huge bolts of pryoclastic lightning flash as the Calbuco volcano in southern Chile erupts Credit: Martin Bernetti/AFP
A new study shows that relatively small external disturbances play a crucial role in chaotic phenomena like the recent Calbuco volcanic eruption in Chile, leading to drum-beat-like seismicity.
Volcanoes are considered chaotic systems. They are difficult to model because the geophysical and chemical parameters in volcanic eruptions exhibit high levels of uncertainty. Now, Dmitri V. Alexandrov and colleagues from the Ural Federal University in Ekaterinburg, in the Russian Federation, have further extended an eruption model — previously developed by other scientists — to the friction force at work between the volcanic plug and volcanic conduit surface. The results, published in EPJB, provide evidence that volcanic activity can be induced by external noises that would not otherwise have been predicted by the model.
Predicting when, where and how volcanic eruptions will happen is likely to remain empirical. That is, until it is possible to improve the modelling of their dynamics. The challenge of such models is that the volcanic eruption dynamics are very complex, involving simultaneous unrelated processes and offering a variety of possible scenarios.
The authors built on a previous study demonstrating the influence of noise in triggering eruptions. Namely, they assumed that, under complex friction forces, the volcano plug and conduit exhibit a previously identified mechanism, called stick-slip behaviour, which causes the volcanic plug to rise and fall in an attenuated manner. They then studied the influence of random disturbances on these dynamics. They also tested the resulting model with experimental data from the Mount St. Helen’s eruption, dating back to 2004 and 2005.
Alexandrov and colleagues show that the external noise is also linked to the appearance of large-amplitude oscillations in the volcanic plug and high seismicity. An increase in noise intensity leads to drumbeat-type plug movement, exhibiting irregular periodicity dependent on noise. Such beat-type behaviour is a building block for understanding the physical mechanisms of volcanic drumbeat seismicity.
Reference:
Dmitri V. Alexandrov, Irina A. Bashkirtseva, Lev B. Ryashko. How a small noise generates large-amplitude oscillations of volcanic plug and provides high seismicity. The European Physical Journal B, 2015; 88 (4) DOI: 10.1140/epjb/e2015-60130-6