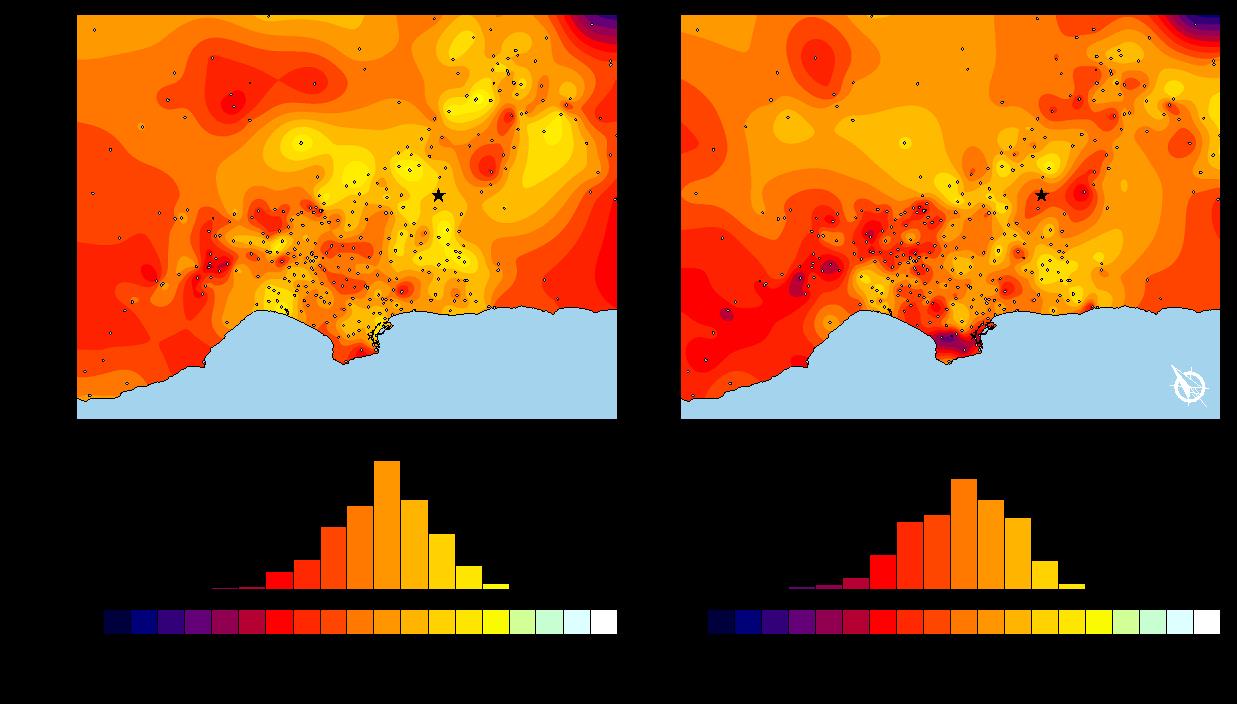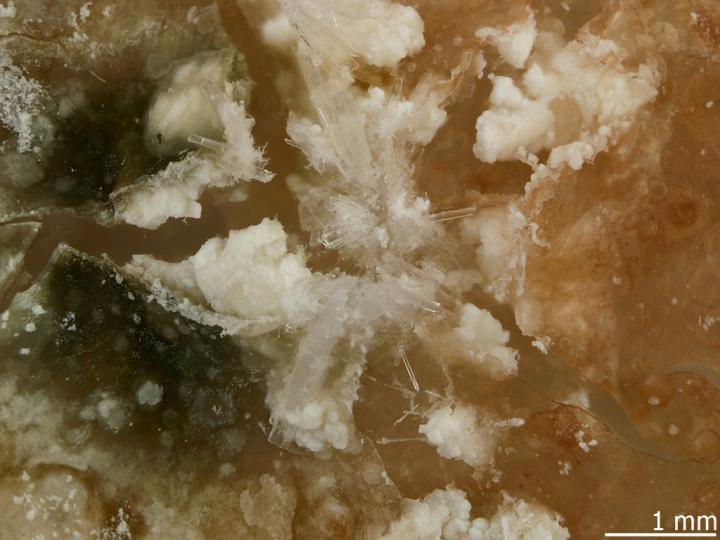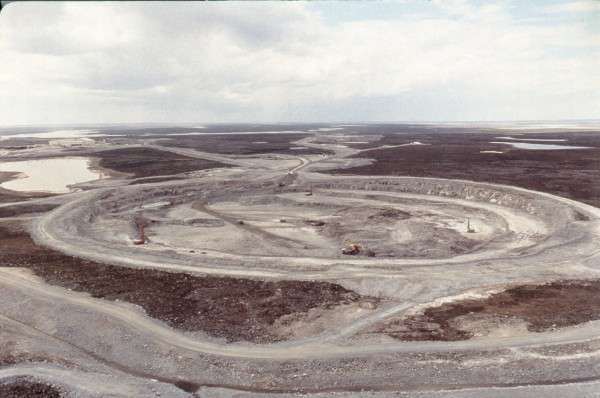
The intensity of groundwater contamination via uranium (red) and nitrate (blue) is shown in two major aquifers and other sites through out the nation. UNL researcher Karrie Weber says the availability of uranium data pales compared to that of nitrate. Credit: University of Nebraska-Lincoln
Nearly 2 million people throughout the Great Plains and California above aquifer sites contaminated with natural uranium that is mobilized by human-contributed nitrate, according to a study from the University of Nebraska-Lincoln.
Data from roughly 275,000 groundwater samples in the High Plains and Central Valley aquifers show that many Americans live less than two-thirds of a mile from wells that often far exceed the uranium guideline set by the Environmental Protection Agency.
The study reports that 78 percent of the uranium-contaminated sites were linked to the presence of nitrate, a common groundwater contaminant that originates mainly from chemical fertilizers and animal waste. Nitrate mobilizes naturally occurring uranium through a series of bacterial and chemical reactions that oxidize the radioactive mineral, making it soluble in groundwater.
UNL researchers Karrie Weber and Jason Nolan found that the High Plains aquifer contains uranium concentrations up to 89 times the EPA standard and nitrate concentrations up to 189 times greater. The uranium and nitrate levels of the California-based Central Valley aquifer measured up to 180 and 34 times their respective EPA thresholds.
The authors published their findings in the August edition of the journal Environmental Science and Technology Letters. Their research was funded in part by the U.S. Geological Survey.
“It needs to be recognized that uranium is a widespread contaminant,” said Weber, assistant professor of biological, Earth and atmospheric sciences. “And we are creating this problem by producing a primary contaminant that leads to a secondary one.”
Prior research has suggested that prolonged drinking of uranium-contaminated water may lead, or make people more susceptible, to kidney damage and elevated blood pressure. According to Weber, peer-reviewed studies have also indicated that food crops can accumulate uranium when irrigated by water containing high concentrations of it.
The High Plains aquifer — the largest in the United States — provides drinking water and irrigation for an eight-state swath that stretches from South Dakota through Nebraska and into northern Texas. As California’s largest reservoir, the Central Valley aquifer sits beneath some of the state’s most fertile agricultural land. According to a 2012 census from the U.S. Department of Agriculture, the two aquifers irrigate cropland that accounts for one-sixth of the annual revenue generated by U.S. agriculture.
The researchers also determined that only one of the six wells located near a former or current mining site was contaminated. This finding counters the notion that uranium contamination stems primarily from mining operations or spent nuclear fuel, Weber said.
“We hope that this study serves as a catalyst to get other people interested in this issue,” she said. “If the problem is this widespread, more research needs to be done. We’re limited by the data that’s been collected, and uranium isn’t often monitored.”
Weber said the expense of water treatment plants — specialized facilities that can cost tens of millions of dollars — often puts them out of financial reach for smaller and rural communities. Addressing the issue might require managing groundwater and focusing on the aquifers’ sediment, which houses bacteria that can help control uranium by breathing and eating it, she said.
Regardless of the approach, Weber said it is important for decision-makers and researchers to account for the presence of uranium in U.S. water sources.
“When you start thinking about how much water is drawn from these aquifers, it’s substantial relative to anywhere else in the world,” Weber said. “These two aquifers are economically important — they play a significant role in feeding the nation — but they’re also important for health.
“What’s the point of having water if you can’t drink it or use it for irrigation?”
Note: The above post is reprinted from materials provided by University of Nebraska-Lincoln. The original article was written by Scott Schrage, University Communications.
Glaciological field measurements on a glacier in the Jetim-Bel range, Kyrgyzstan. Systematic in-situ surveys as pictured are essential for providing ground truth data against which satellite observation can be compared. Credit: D. Farinotti, GFZ
Glaciers in Central Asia experience substantial losses in glacier mass and area. Along the Tien Shan, Central Asia’s largest mountain range, glaciers have lost 27% of their mass and 18% of their area during the last 50 years. An international research team led by the GFZ German Research Centre for Geosciences and including the institute of the French Centre National de la Recherche Scientifique (CNRS) at Rennes University in particular, estimated that almost 3000 square kilometres of glaciers and an average of 5.4 gigatons of ice per year have been lost since the 1960s. In the current online issue of Nature Geoscience, the authors estimate that about half of Tien Shan’s glacier volume could be depleted by the 2050s.
Glaciers play an important role in the water cycle of Central Asia. Snow and glacier melt from the Tien Shan is essential for the water supply of Kazakhstan, Kyrgyzstan, Uzbekistan, and parts of China. “Despite this importance, only little was known about how glaciers in this region changed over the last century” the principal investigator Daniel Farinotti explains. Most of the direct monitoring programs, that were shut down with the collapse of the Soviet Union, are resumed only today, and modern observation techniques often cover a limited time span only.
GFZ-researcher Farinotti and colleagues now present a reconstruction of the glacier evolution in the Tien Shan. “We combined various methods based on satellite gravimetry, laser altimetry and glaciological modelling” Farinotti says. “This way, we were able to reconstruct the evolution of every single glacier. Currently, the Tien Shan is losing ice at a pace that is roughly twice the annual water consumption of entire Germany.”
Glaciers in Central Asia
Glaciers can store water as glacier ice over decades, and transfer winter precipitation into the summer months by releasing it as melt water. This is particularly important in seasonally arid regions, i.e. regions that have months with virtually no precipitation, since local water supply is then closely linked to meltwater availability.
Central Asia is the outstanding case for human dependence on water seasonally delayed by glaciers. Nowhere the question about the glacier state is linked so closely to questions of water availability and, thus, food security.
The pace of glacier retreat noticeably accelerated between the 1970s and the 1980s. Daniel Farinotti: “The long-term signal is clearly related to the overall rise in temperature.” In fact, the study shows that the rise in temperature, and summer temperature in particular, is a primary control for glacier evolution in the region. “For Central Asia, this statement is less trivial than it might seem at first glance: Since the winter months in the region are very dry and the mountains are that high, glaciers receive most of their snowfalls during summer.” Farinotti explains. “This means that an increased temperature contributes to both, increased melt and reduced glacier nourishment — and obviously, both contributes to glacier wastage.”
By using the latest climate projections, which anticipate an additional 2 °C warming of summer temperatures in the period 2021 — 2050, the authors also provide a first outlook for the future evolution: Half of the total glacier ice volume present in the Tien Shan today could be lost by the 2050s.
Reference:
Daniel Farinotti, Laurent Longuevergne, Geir Moholdt, Doris Duethmann, Thomas Mölg, Tobias Bolch, Sergiy Vorogushyn, Andreas Güntner. Substantial glacier mass loss in the Tien Shan over the past 50 years. Nature Geoscience, 2015; DOI: 10.1038/ngeo2513
An opal doublet from Andamooka South Australia Credit: CRPeters
Opal is a hydrated amorphous form of silica; its water content may range from 3 to 21% by weight, but is usually between 6 and 10%. Because of its amorphous character, it is classed as a mineraloid, unlike the other crystalline forms of silica, which are classed as minerals. It is deposited at a relatively low temperature and may occur in the fissures of almost any kind of rock, being most commonly found with limonite, sandstone, rhyolite, marl, and basalt.
Opal is the national gemstone of Australia. Australian opal has often been cited as accounting for 95-97% of the world’s supply of precious opal, with the state of South Australia accounting for 80% of the world’s supply. Recent data suggests that the world supply of precious opal may have changed. In 2012, Ethiopian opal production was estimated to be 14,000 kg (31,000 lb) by the United States Geological Survey. USGS data from the same period (2012), reveals that Australian opal production to be $41 million. Because of the units of measurement, it is not possible to directly compare Australian and Ethiopian opal production, but these data and others suggest that the traditional percentages given for Australian opal production may be overstated. Yet, the validity of data in the USGS report appears to conflict with that of Laurs and others and Mesfin, who estimated the 2012 Ethiopian opal output (from Wegal Tena) to be only 750 kg (1,650 lb).
The internal structure of precious opal makes it diffract light; depending on the conditions in which it formed, it can take on many colors. Precious opal ranges from clear through white, gray, red, orange, yellow, green, blue, magenta, rose, pink, slate, olive, brown, and black. Of these hues, the reds against black are the most rare, whereas white and greens are the most common. It varies in optical density from opaque to semitransparent.
Common opal, called “potch” by miners, does not show the display of color exhibited in precious opal.
Naming
The word ‘opal’ is adapted from the Roman term opalus, but the origin of this word is a matter of debate. However, most modern references suggest it is adapted from the Sanskrit word úpala.
References to the gem are made by Pliny the Elder. It is suggested to have been adapted from Ops, the wife of Saturn and goddess of fertility. The portion of Saturnalia devoted to Ops was “Opalia”, similar to opalus.
Another common claim that the term is adapted from the Greek word, opallios. This word has two meanings, one is related to “seeing” and forms the basis of the English words like “opaque”; the other is “other” as in “alias” and “alter”. It is claimed that opalus combined these uses, meaning “to see a change in color”. However, historians have noted the first appearances of opallios do not occur until after the Romans had taken over the Greek states in 180 BC, and they had previously used the term paederos.
However, the argument for the Sanskrit origin is strong. The term first appears in Roman references around 250 BC, at a time when the opal was valued above all other gems. The opals were supplied by traders from the Bosporus, who claimed the gems were being supplied from India. Before this the stone was referred to by a variety of names, but these fell from use after 250 BC.
Precious opal
Idealized molecular structure of precious opal: an orderly array of silicon dioxide spheres. Credit: Dpulitzer
Precious opal shows a variable interplay of internal colors, and though it is a mineraloid, it has an internal structure. At microscopic scales, precious opal is composed of silica spheres some 150 to 300 nm in diameter in a hexagonal or cubic close-packed lattice. These ordered silica spheres produce the internal colors by causing the interference and diffraction of light passing through the microstructure of the opal. The regularity of the sizes and the packing of these spheres determines the quality of precious opal. Where the distance between the regularly packed planes of spheres is around half the wavelength of a component of visible light, the light of that wavelength may be subject to diffraction from the grating created by the stacked planes. The colors that are observed are determined by the spacing between the planes and the orientation of planes with respect to the incident light. The process can be described by Bragg’s law of diffraction.
Visible light of diffracted wavelengths cannot pass through large thicknesses of the opal. This is the basis of the optical band gap in a photonic crystal, of which opal is the best-known natural example. In addition, microfractures may be filled with secondary silica and form thin lamellae inside the opal during solidification. The term opalescence is commonly and erroneously used to describe this unique and beautiful phenomenon, which is correctly termed play of color. Contrarily, opalescence is correctly applied to the milky, turbid appearance of common or potch opal. Potch does not show a play of color.
Multicolor rough crystal opal from Coober Pedy, South Australia, expressing nearly every color of the visible spectrum
For gemstone use, most opal is cut and polished to form a cabochon. “Solid” opal refers to polished stones consisting wholly of precious opal. Opals too thin to produce a “solid” may be combined with other materials to form attractive gems. An opal doublet consists of a relatively thin layer of precious opal, backed by a layer of dark-colored material, most commonly ironstone, dark or black common opal (potch), onyx, or obsidian. The darker backing emphasizes the play of color, and results in a more attractive display than a lighter potch. An opal triplet is similar to a doublet, but has a third layer, a domed cap of clear quartz or plastic on the top. The cap takes a high polish and acts as a protective layer for the opal. The top layer also acts as a magnifier, to emphasize the play of color of the opal beneath, which is often of lower quality. Triplet opals therefore have a more artificial appearance, and are not classed as precious opal. Jewelry applications of precious opal can be somewhat limited by opal’s sensitivity to heat due primarily to its relatively high water content and predisposition to scratching.
Combined with modern techniques of polishing, doublet opal produces a similar effect to black or boulder opal at a fraction of the price. Doublet opal also has the added benefit of having genuine opal as the top visible and touchable layer, unlike triplet opals.
Black opal is characterised by a dark body tone causing brightness of colour which is unmatched by lighter opals. Black Opals are usually mined in Lightning Ridge, New South Wales, and are the most famous, and sought-after type of opal. The term ‘black opal’ does not mean that the stone is completely black (a common mistake), it simply means the stone has a dark body tone in comparison to a white opal.
Australian black opals are the most valuable and widely known type of opal. Black opal is characterised by a dark body tone which can range from dark grey to jet black. (See the following chart). However this refers only to the general body tone of the stone, and is not related to the rainbow or spectral colours present in the opal. Some people expect a black opal to be completely black (in which case it would be completely worthless).
11.0 x 7.0 x 2.5 mm
White Opal
Also known as ‘milky opal’, white opal features light white body tones, and is mined in South Australia. White opal is more common and because of its body tone, generally does not show the colour as well as black opal. Nevertheless, white opals can still be absolutely magnificent in colour if a good quality stone is found.
Boulder opal forms on ironstone boulders in Queensland. This type of opal is often cut with the ironstone left on the back, as the opal seam is usually quite thin. Leaving the ironstone on the back means that boulder opal can be very dark and beautiful in colour. The opal forms within the cavities of the boulders in both vertical and horizontal cracks. Boulders vary in shape and size, from as small as a pea, to as big as a family car. Boulder Opal has a tendency to cleave; when cleaved the “split” leaves two faces of opal, with a naturally polished face.
Crystal opal is any of the above kind of opal which has a transparent or semi-transparent body tone – i.e. you can see through the stone. Crystal opal can have a dark or light body tone, leading to the terms “black crystal opal” and “white crystal opal”.
Fire opal
Is a transparent to translucent opal, with warm body colors of yellow to orange to red. Although it does not usually show any play of color, occasionally a stone will exhibit bright
green flashes. The most famous source of fire opals is the state of Querétaro in Mexico; these opals are commonly called Mexican fire opals. Fire opals that do not show play of color are sometimes referred to as jelly opals. Mexican opals are sometimes cut in their ryholitic host material if it is hard enough to allow cutting and polishing. This type of Mexican opal is referred to as a Cantera opal. Also, a type of opal from Mexico, referred to as Mexican water opal, is a colorless opal which exhibits either a bluish or golden internal sheen.
Girasol opal
Is a term sometimes mistakenly and improperly used to refer to fire opals, as well as a type of transparent to semitransparent type milky quartz from Madagascar which displays an asterism, or star effect, when cut properly. However, the true girasol opal is a type of hyalite opal that exhibits a bluish glow or sheen that follows the light source around. It is not a play of color as seen in precious opal, but rather an effect from microscopic inclusions. It is also sometimes referred to as water opal, too, when it is from Mexico. The two most notable locations of this type of opal are Oregon and Mexico.
Peruvian opal (also called blue opal)
Is a semiopaque to opaque blue-green stone found in Peru, which is often cut to include the matrix in the more opaque stones. It does not display pleochroism. Blue opal also comes from Oregon in the Owhyee region, as well as from Nevada around Virgin Valley.
Sources of opal
Australian opal
Australia produces around 97% of the world’s opal; 90% is called light opal or white and crystal opal. White makes up 60% of the opal production, but cannot be found in all of the opal fields. Crystal opal or pure hydrated silica makes up 30% of the opal produced, 8% is black and only 2% is boulder opal.
The town of Coober Pedy in South Australia is a major source of opal. The world’s largest and most valuable gem opal “Olympic Australis” was found in August 1956 at the “Eight Mile” opal field in Coober Pedy. It weighs 17,000 carats (3450 g) and is 11 in (280 mm) long, with a height of 4.75 in (121 mm) and a width of 4.5 in (110 mm). The Mintabie Opal Field located about 250 km (160 mi) north west of Coober Pedy has also produced large quantities of crystal opal and the rarer black opal. Over the years, it has been sold overseas incorrectly as Coober Pedy opal. The black opal is said to be some of the best examples found in Australia. Andamooka in South Australia is also a major producer of matrix opal, crystal opal, and black opal’. Another Australian town, Lightning Ridge in New South Wales, is the main source of black opal, opal containing a predominantly dark background (dark-gray to blue-black displaying the play of color). Boulder opal consists of concretions and fracture fillings in a dark siliceous ironstone matrix. It is found sporadically in western Queensland, from Kynuna in the north, to Yowah and Koroit in the south. Its largest quantities are found around Jundah and Quilpie (known as the “home of the boulder opal”) in South West Queensland. Australia also has opalised fossil remains, including dinosaur bones in New South Wales, and marine creatures in South Australia. The rarest type of Australian opal is “pipe” opal, closely related to boulder opal, which forms in sandstone with some iron oxide content, usually as fossilized tree roots.
Ethiopian opal
Nodule of gem-grade precious Ethiopian Welo opal
Although it has been reported that Northern African opal was used to make tools as early as 4000 BC, the first published report of gem opal from Ethiopia appeared in the 1994, with the discovery of precious opal in the Menz Gishe District, North Shewa Province. The opal, found mostly in the form of nodules, was of volcanic origin and was found predominantly within weathered layers of rhyolite. This Shewa Province opal, was mostly dark brown in color, and had a tendency to crack. These qualities made it unpopular in the gem trade. In 2008, a new opal deposit was found near the town of Wegel Tena, in Ethiopia’s Wollo Province. The Wollo Province opal was different from the previous Ethiopian opal finds in that it more closely resembled the sedimentary opals of Australia and Brazil, with a light background and often vivid play-of-color. Wollo Province opal, more commonly referred to as “Welo” or “Wello” opal has become the dominant Ethiopian opal in the gem trade.
Virgin Valley, Nevada
The Virgin Valley opal fields of Humboldt County in northern Nevada produce a wide variety of precious black, crystal, white, fire, and lemon opal. The black fire opal is the official gemstone of Nevada. Most of the precious opal is partial wood replacement. The precious opal is hosted and found within a subsurface horizon or zone of bentonite in-place which is considered a “lode” deposit. Opals which have weathered out of the in-place deposits are alluvial and considered placer deposits. Miocene-age opalised teeth, bones, fish, and a snake head have been found. Some of the opal has high water content and may desiccate and crack when dried. The largest producing mines of Virgin Valley have been the famous Rainbow Ridge, Royal Peacock, Bonanza, Opal Queen, and WRT Stonetree/Black Beauty Mines. The largest unpolished black opal in the Smithsonian Institution, known as the “Roebling opal”, came out of the tunneled portion of the Rainbow Ridge Mine in 1917, and weighs 2,585 carats. The largest polished black opal in the Smithsonian Institution comes from the Royal Peacock opal mine in the Virgin Valley, weighing 160 carats, known as the “Black Peacock”.
Other locations
Another source of white base opal or creamy opal in the United States is Spencer, Idaho. A high percentage of the opal found there occurs in thin layers.
Other significant deposits of precious opal around the world can be found in the Czech Republic, Slovakia, Hungary, Turkey, Indonesia, Brazil (in Pedro II, Piauí), Honduras Erandique-LempiraLempira Department, Guatemala and Nicaragua.
In late 2008, NASA announced it had discovered opal deposits on Mars.
The marine shell-crushing reptile Psephoderma alpinum, one of the last placodonts on Earth, just reported from Somerset. Credit: James O’Shea
The diversity of animal life that inhabited the coastlines of South West England 200 million years ago has been revealed in a study by an undergraduate at the University of Bristol.
Klara Nordén studied material from the Late Triassic sediments at the Marston Road Quarry, near Nunney in Somerset, which are rich in microscopic fossil teeth. Although the fossils were collected in the 1980s by Gloucester-based geologist Mike Curtis, they had never been studied or described – until now.
Klara’s research reveals the diverse fauna that once inhabited shallow coastal waters in what at the time was a tropical archipelago in Somerset. The study identifies a total of six species of bony fish and six species of shark as well as Pachystropheus rhaeticus, a crocodile-like animal, and a placodont, an armoured turtle-like reptile whose flat teeth were ideal for crushing the shells of invertebrate prey found in the muddy sediment on the seafloor.
Klara said: “We were excited to find teeth from a placodont, which are rare in British sediments. The presence of placodonts indicates that the area was once a coastal environment, with shallow waters and abundant invertebrate prey. Placodonts were in decline in the Late Triassic, and the placodont teeth from Marston Road must come from some of the last of these reptiles to exist on Earth.”
The study also reports the first finding of sphenodontians, small, lizard-like reptiles, in British marine sediments. Sphenodontians inhabited the islands in the archipelago, which they shared with Thecodontosaurus, the famous ‘Bristol dinosaur’.
Professor Michael Benton, Klara’s project supervisor, said: “It’s really unusual to find remains of land-living animals mixed in with the marine fishes and sharks. They must have been washed off the land into the shallow sea, and this provides evidence to match the age of the marine and terrestrial deposits in the area.”
Together, the fossils reveal the details of a coastal landscape lost for 200 million years. They paint a picture very different from today’s – where British shores were inhabited by exotic species of sharks, fish and turtle-like placodonts, whose armour might have protected them from the large predators roaming the waters.
Collaborator Dr Chris Duffin said: “I began working on these fossils from the Bristol area forty years ago and it’s great to see such wonderful work by a Bristol undergraduate.”
The research is published today [14 August] in Proceedings of the Geologists’ Association.
Reference:
‘A marine vertebrate fauna from the Late Triassic of Somerset, and a review of British placodonts’ by K. K. Nordén, C. J. Duffin, and M. J. Benton in Proceedings of the Geologists’ Association. DOI: 10.1016/j.pgeola.2015.07.001
Palestine has faced hundreds of earthquakes since the beginning of the year. Thanks to the SASPARM and SASPARM 2.0 projects, the next generation of citizens and researchers will be better equipped to face this growing threat.
‘We [in Palestine] have modest and undeveloped capacities that do not allow us to face earthquakes and their repercussions well,’ Moufid al-Hasayneh, minister of public works and housing, tells Al-Monitor. He knows that this lack of capacity needs to be filled as soon as possible if Palestine is to face the growing threat of earthquakes and its potential impact on human lives.
According to recent reports, a massive earthquake would lead to the devastation of 70 % of houses in the country, and the death of 16 000 people. As Palestine is located in the Rift Valley – right at the frontier between the Arabian and African plates which are moving farther apart – the likelihood of earthquakes is expected to keep increasing. The country needs more resistant buildings, better public awareness and improved trainings for young researchers in order to face this threat.
This is precisely what the SASPARM and SASPARM 2 projects are bringing to the table. The first one, which was completed at the end of November 2014, aimed to increase the An-Najah National University’s competitiveness as a research centre in the field of seismic risk mitigation and disaster management. Among other things, a database of existing research data was created, knowledge gaps were identified, courses on structural engineering were organized. The project also began initiatives to increase general public awareness and established networks of researchers in the context of the European Research Area (ERA).
‘Hundreds of engineers in the field of planning and designing buildings that are resistant to earthquakes were trained, and dozens of sessions and workshops on the topic have been held,’ notes Jalal Dabbeek, director of the Earth Sciences and Seismic Engineering Center and coordinator of the project.
But this was only the first stage of a longer term endeavour. In January 2015, SASPARM 2.0 was initiated with further support from the EU, and will be running until the end of 2017. ‘This second stage aims at promoting [Palestine’s] capacities in facing earthquakes by training civil defense cadres and developing the skills of engineers. We hope to improve the existing buildings through computerized programmes and smartphones that save information about the house of each citizen. This would help in building a database to discover the likelihood of these houses being affected. Buildings will also undergo a field survey, and awareness campaigns will be increased in the media,’ Dabbeek explains.
The consortium, which also includes EUCENTRE and the Institute for Advanced Study of Pavia (IUSS), will notably develop a web portal where the likes of students, citizens, practitioners, governmental organisations and NGOs will be able to add and manage data related to buildings. All in all, this initiative is expected to increase the reliability of seismic risk estimations.
This is an inscription from 1891 found in Dayu Cave. It reads: On May 24th, 17th year of the Emperor Guangxu period (June 30th, 1891 CE), Qing Dynasty, the local mayor, Huaizong Zhu led more than 200 people into the cave to get water. A fortuneteller named Zhenrong Ran prayed for rain during a ceremony. Credit: L. Tan
An international team of researchers, including scientists from the University of Cambridge, has discovered unique ‘graffiti’ on the walls of a cave in central China, which describes the effects drought had on the local population over the past 500 years.
The information contained in the inscriptions, combined with detailed chemical analysis of stalagmites in the cave, together paint an intriguing picture of how societies are affected by droughts over time: the first time that it has been possible to conduct an in situ comparison of historical and geological records from the same cave. The results, published in the journal Scientific Reports, also point to potentially greatly reduced rainfall in the region in the near future, underlying the importance of implementing strategies to deal with a world where droughts are more common.
The inscriptions were found on the walls of Dayu Cave in the Qinling Mountains of central China, and describe the impacts of seven drought events between 1520 and 1920. The climate in the area around the cave is dominated by the summer monsoon, in which about 70% of the year’s rain falls during a few months, so when the monsoon is late or early, too short or too long, it has a major impact on the region’s ecosystem.
“In addition to the obvious impact of droughts, they have also been linked to the downfall of cultures — when people don’t have enough water, hardship is inevitable and conflict arises,” said Dr Sebastian Breitenbach of Cambridge’s Department of Earth Sciences, one of the paper’s co-authors. “In the past decade, records found in caves and lakes have shown a possible link between climate change and the demise of several Chinese dynasties during the last 1800 years, such as the Tang, Yuan and Ming Dynasties.”
According to the inscriptions in Dayu Cave, residents would come to the cave both to get water and to pray for rain in times of drought. An inscription from 1891 reads, “On May 24th, 17th year of the Emperor Guangxu period, Qing Dynasty, the local mayor, Huaizong Zhu led more than 200 people into the cave to get water. A fortune-teller named Zhenrong Ran prayed for rain during the ceremony.”
Another inscription from 1528 reads, “Drought occurred in the 7th year of the Emperor Jiajing period, Ming Dynasty. Gui Jiang and Sishan Jiang came to Da’an town to acknowledge the Dragon Lake inside in Dayu Cave.”
While the inscriptions are business-like in tone, the droughts of the 1890s led to severe starvation and triggered local social instability, which eventually resulted in a fierce conflict between government and civilians in 1900. The drought in 1528 also led to widespread starvation, and there were even reports of cannibalism.
“There are examples of things like human remains, tools and pottery being found in caves, but it’s exceptional to find something like these dated inscriptions,” said Dr Liangcheng Tan of the Institute of Earth Environment at the Chinese Academy of Sciences in Xi’an, and the paper’s lead author. “Combined with the evidence found in the physical formations in the cave, the inscriptions were a crucial way for us to confirm the link between climate and the geochemical record in the cave, and the effect that drought has on a landscape.”
The researchers removed sections of cave formations, or speleothems, and analysed the stable isotopes and trace elements contained within. They found that concentrations of certain elements were strongly correlated to periods of drought, which could then be verified by cross-referencing the chemical profile of the cave with the writing on the walls.
When cut open, speleothems such as stalagmites frequently reveal a series of layers that record their annual growth, just like tree rings. Using mass spectrometry, the researchers analysed and dated the ratios of the stable isotopes of oxygen, carbon, as well as concentrations of uranium and other elements. Changes in climate, moisture levels and surrounding vegetation all affect these elements, since the water seeping into the cave is related to the water on the surface. The researchers found that higher oxygen and carbon isotope ratios, in particular, corresponded with lower rainfall levels, and vice versa.
The researchers then used their results to construct a model of future precipitation in the region, starting in 1982. Their model correlated with a drought that occurred in the 1990s and suggests another drought in the late 2030s. The observed droughts also correspond with the El Niño-Southern Oscillation (ENSO) cycle. Due to the likelihood that climate change caused by humans will make ENSO events more severe, the region may be in for more serious droughts in the future.
“Since the Qinling Mountains are the main recharge area of two larger water transfer projects, and the habitat for many endangered species, including the iconic giant panda, it is imperative to explore how the region can adapt to declining rain levels or drought,” said Breitenbach. “Things in the world are different from when these cave inscriptions are written, but we’re still vulnerable to these events — especially in the developing world.”
Reference:
Liangcheng Tan, Yanjun Cai, Zhisheng An, Hai Cheng, Chuan-Chou Shen, Sebastian F. M. Breitenbach, Yongli Gao, R. Lawrence Edwards, Haiwei Zhang, Yajuan Du. A Chinese cave links climate change, social impacts, and human adaptation over the last 500 years. Scientific Reports, 2015; 5: 12284 DOI: 10.1038/srep12284
Note: The above post is reprinted from materials provided by University of Cambridge. The original story is licensed under a Creative Commons Licence.
Image: Barry Roal Carlsen, University of Wisconsin-Madison
Early humans were the dominant cause of the extinction of a variety of species of giant beasts, new research has revealed.
Scientists at the universities of Exeter and Cambridge claim their research settles a prolonged debate over whether humankind or climate change was the dominant cause of the demise of massive creatures in the time of the sabretooth tiger, the woolly mammoth, the woolly rhino and the giant armadillo.
Known collectively as megafauna, most of the largest mammals ever to roam the earth were wiped out over the last 80,000 years, and were all extinct by 10,000 years ago.
Lewis Bartlett, of the University of Exeter, led the research, which also involved the universities of Reading and Bristol and is published in the journal Ecography. He said cutting-edge statistical analysis had helped solve the mystery almost beyond dispute, concluding that man was the dominant force in wiping out the creatures, although climate change could also have played a lesser role.
The researchers ran thousands of scenarios which mapped the windows of time in which each species is known to have become extinct, and humans are known to have arrived on different continents or islands. This was compared against climate reconstructions for the last 90,000 years.
Examining different regions of the world across these scenarios, they found coincidences of human spread and species extinction which illustrate that man was the main agent causing the demise, with climate change exacerbating the number of extinctions. However, in certain regions of the world — mainly in Asia — they found patterns which patterns were broadly unaccounted for by either of these two drivers, and called for renewed focus on these neglected areas for further study.
Lewis Bartlett, a researcher from the University of Exeter’s Centre for Ecology and Conservation, said: “As far as we are concerned, this research is the nail in the coffin of this 50-year debate — humans were the dominant cause of the extinction of megafauna. What we don’t know is what it was about these early settlers that caused this demise. Were they killing them for food, was it early use of fire or were they driven out of their habitats? Our analysis doesn’t differentiate, but we can say that it was caused by human activity more than by climate change. It debunks the myth of early humans living in harmony with nature.”
Dr Andrea Manica, of Cambridge University, was lead supervisor on the paper. He said: “Whilst our models explain very well the timing and extent of extinctions for most of the world, mainland Asia remains a mystery. According to the fossil record, that region suffered very low rates of extinctions. Understanding why megafauna in mainland Asia is so resilient is the next big question.”
Reference:
Lewis J. Bartlett, David R. Williams, Graham W. Prescott, Andrew Balmford, Rhys E. Green, Anders Eriksson, Paul J. Valdes, Joy S. Singarayer, Andrea Manica. Robustness despite uncertainty: regional climate data reveal the dominant role of humans in explaining global extinctions of Late Quaternary megafauna. Ecography, 2015; DOI: 10.1111/ecog.01566
Believed to be roughly the size of a dachshund, Ichibengops lived around 255 million years ago. Credit: Image courtesy of Field Museum
Scientists at The Field Museum have identified a new species of pre-mammal in what is now Zambia. Thanks to a unique groove on the animal’s upper jaw, it was dubbed Ichibengops (Itchy-BEN-gops), which combines the local Bemba word for scar (ichibenga), and the common Greek suffix for face (ops). Put simply: Scarface.
Believed to be roughly the size of a dachshund, Ichibengops lived around 255 million years ago, and was a member of Therocephalia, a group of ancient mammal relatives that survived the largest mass extinction in history (the Permian-Triassic extinction). The species description was published in the Journal of Vertebrate Paleontology by University of Utah, University of Washington and Burke Museum, and The Field Museum.
“Discoveries of new species of animals like Ichibengops are particularly exciting because they help us to better understand the group of animals that gave rise to mammals,” said Field Museum’s Kenneth Angielczyk, PhD, associate curator of paleomammalogy. “One interesting feature about this species in particular is the presence of grooves above its teeth, which may have been used to transmit venom.”
Indeed, venomousness is rare among mammals and their extinct relatives. Only a handful of modern mammals produce venom, including the platypus and certain species of shrews. One other extinct therocephalian, Euchambersia, has been suggested to be venomous, but even among ancient mammal relatives this is an exception rather than the rule. Although the trait is uncommon, it may have proved advantageous to carnivores by enabling them to better capture prey and defend themselves.
Angielczyk, whose work focuses on ancient mammal relatives, explained the importance of finding new species like Ichibengops. “By studying the effects of the Permian-Triassic mass extinction and the subsequent recovery, we can apply the lessons we learn to the mass extinction being caused by humans today.”
Reference:
Adam K. Huttenlocker, Christian A. Sidor, Kenneth D. Angielczyk. A new eutherocephalian (Therapsida, Therocephalia) from the upper Permian Madumabisa Mudstone Formation (Luangwa Basin) of Zambia. Journal of Vertebrate Paleontology, 2015; e969400 DOI: 10.1080/02724634.2015.969400
Detail of the marks on a fossilized rib bone, one of the two controversial bones. “The best match we have for the marks, using currently available data, would still be butchery with stone tools,” says anthropologist Jessica Thompson. Credit: Zeresenay Alemseged.
Marks on two 3.4 million-year-old animal bones found at the site of Dikika, Ethiopia, were not caused by trampling, an extensive statistical analysis confirms. The Journal of Human Evolution is publishing the results of the study, which developed new methods of fieldwork and analysis for researchers exploring the origins of tool making and meat eating in our ancestors.
“Our analysis clearly shows that the marks on these bones are not characteristic of trampling,” says Jessica Thompson, an assistant professor of anthropology at Emory University and lead author of the study. “The best match we have for the marks, using currently available data, would still be butchery with stone tools.”
The 12 marks on the two specimens — a long bone from a creature the size of a medium antelope and a rib bone from an animal closer in size to a buffalo — most closely resemble a combination of purposeful cutting and percussion marks, Thompson says. “When these bones were hit, they were hit with enormous force and multiple times.”
The paper supports the original interpretation that the damage to the two bones is characteristic of stone tool butchery, published in Nature in 2010. That finding was sensational, since it potentially pushed back evidence for the use of stone tools, as well as the butchering of large animals, by about 800,000 years.
The Nature paper was followed in 2011 by a rebuttal in the Proceedings of the National Academy of Sciences (PNAS), suggesting that the bones were marked by incidental trampling in abrasive sediments. That sparked a series of debates about the significance of the discovery and whether the bones had been trampled.
For the current paper, Thompson and her co-authors examined the surfaces of a sample of more than 4000 other bones from the same deposits. They then used statistical methods to compare more than 450 marks found on those bones to experimental trampling marks and to the marks on the two controversial specimens.
“We would really like to understand what caused these marks,” Thompson says. “One of the most important questions in human evolution is when did we start eating meat, since meat is considered a likely explanation for how we fed the evolution of our big brains.”
Evidence shows that our genus, Homo, emerged around 2.8 million years ago. Until recently, the earliest known stone tools were 2.6 million years old. Changes had already been occurring in the organization of the brains of the human lineage, but after this time there was also an increase in overall brain size. This increased size has largely been attributed to a higher quality diet.
While some other apes are known to occasionally hunt and eat animals smaller than themselves, they do not hunt or eat larger animals that store abundant deposits of fat in the marrow of their long bones. A leading hypothesis in paleoanthropology is that a diet rich in animal protein combined with marrow fat provided the energy needed to fuel the larger human brain.
The animal bones in the Dikika site, however, have been reliably dated to long before Homo emerged. They are from the same sediments and only slightly older than the 3.3-million-year-old fossils unearthed from Dikika belonging to the hominid species Australopithecus afarensis.
Thompson specializes in the study of what happens to bones after an animal dies. “Fossil bones can tell you stories, if you know how to interpret them,” she says.
A whole ecosystem of animals, insects, fungus and tree roots modify bones. Did they get buried quickly? Or were they exposed to the sun for a while? Were they gnawed by a rodent or chomped by a crocodile? Were they trampled on sandy soil or rocky ground? Or were they purposely cut, pounded or scraped with a tool of some kind?
One way that experimental archeologists learn to interpret marks on fossil bones is by modifying modern-day bones. They hit bones with hammer stones, feed them to carnivores and trample them on various substrates, then study the results.
Based on knowledge from such experiments, Thompson was one of three specialists who diagnosed the marks on the two bones from Dikika as butchery in a blind test, before being told the age of the fossils or their origin.
The PNAS rebuttal paper, however, also used experimental methods and came to the conclusion that the marks were characteristic of trampling.
Thompson realized that data from a larger sample of fossils were needed to chip away at the mystery.
The current paper investigated with microscopic scrutiny all non-hominin fossils collected from the Hadar Formation at Dikika. The researchers collected a random sample of fossils from the same deposits as the controversial specimens, as well as nearby deposits. They measured shapes and sizes of marks on the fossil bones. Then they compared the characteristics of the fossil marks statistically to the experimental marks reported in the PNAS rebuttal paper as being typical of trampling damage. They also investigated the angularity of sand grains at the site and found that they were rounded — not the angular type that might produce striations on a trampled bone.
“The random population sample of the fossils provides context,” Thompson says. “The marks on the two bones in question don’t look like other marks common on the landscape. The marks are bigger, and they have different characteristics.”
Trample marks tend to be shallow, sinuous or curvy. Purposeful cuts from a tool tend to be straight and create a narrow V-shaped groove, while a tooth tends to make a U-shaped groove. The study measured and quantified such damage to modern-day bones for comparison to the fossilized ones.
“Our analysis shows with statistical certainty that the marks on the two bones in question were not caused by trampling,” Thompson says. “While there is abundant evidence that other bones at the site were damaged by trampling, these two bones are outliers. The marks on them still more closely resemble marks made by butchering.”
One hypothesis is that butchering large animals with tools occurred during that time period, but that it was an exceedingly rare behavior. Another possibility is that more evidence is out there, but no one has been looking for it because they have not expected to find it at a time period this early.
The Dikika specimens represent a turning point in paleoanthropology, Thompson says. “If we want to understand when and how our ancestors started eating meat and moving into that ecological niche, we need to refine our search images for the field and apply these new recovery and analytical methods. We hope other researchers will use our work as a recipe to go out and systematically collect samples from other sites for comparison.”
In addition to Dikika, other recent finds are shaking up long held views of hominin evolution and when typical human behaviors emerged. This year, a team led by archeologist Sonia Harmand in Kenya reported unearthing stone tools that have been reliably dated to 3.3 million years ago, or 700,000 years older than the previous record.
“We know that simple stone tools are not unique to humans,” Thompson says. “The making of more complex tools, designed for more complex uses, may be uniquely human.”
Reference:
Jessica C. Thompson, Shannon P. McPherron, René Bobe, Denné Reed, W. Andrew Barr, Jonathan G. Wynn, Curtis W. Marean, Denis Geraads, Zeresenay Alemseged. Taphonomy of fossils from the hominin-bearing deposits at Dikika, Ethiopia. Journal of Human Evolution, 2015; DOI: 10.1016/j.jhevol.2015.06.013
Note: The above post is reprinted from materials provided by Emory Health Sciences. The original item was written by Carol Clark.
This is a schematic of the changes in the Arctic Mediterranean at the end of the last Ice Age. Credit: UCL Geography
The build-up and subsequent release of warm, stagnant water from the deep Arctic Ocean and Nordic Seas played a role in ending the last Ice Age within the Arctic region, according to new research led by a UCL scientist.
The study, published today in Science, examined how the circulation of the ocean north of Iceland — the combined Arctic Ocean and Nordic Seas, called the Arctic Mediterranean — changed since the end of the last Ice Age (~20,000-30,000 years ago).
Today, the ocean is cooled by the atmosphere during winter, producing large volumes of dense water that sink and flush through the deep Arctic Mediterranean. However, in contrast to the vigorous circulation of today, the research found that during the last Ice Age, the deep Arctic Mediterranean became like a giant stagnant pond, with deep waters not being replenished for up to 10,000 years.
This is thought to have been caused by the thick and extensive layer of sea ice and fresh water that covered much of the Arctic Mediterranean during the Ice Age, preventing the atmosphere from cooling and densifying the underlying ocean.
Dr David Thornalley (UCL Geography) said: “As well as being stagnant, these deep waters were also warm. Sitting around at the bottom of the ocean, they slowly accumulated geothermal heat from the seafloor, until a critical point was reached when the ocean became unstable.
“Suddenly, the heat previously stored in the deep Arctic Mediterranean was released to the upper ocean. The timing of this event coincides with the occurrence of evidence for a massive release of meltwater into the Nordic Seas. We hypothesize that this input of melt water was caused by the release of deep ocean heat, which melted icebergs, sea-ice and surrounding marine-terminating ice sheets.”
This study highlights the important impact that changes in ocean circulation can have on climate, due to the ocean’s capacity to redistribute vast quantities of heat around the globe. For example, scientists are currently concerned that ongoing changes in ocean circulation may result in warmer subsurface water that will cause enhanced melting and retreat of certain ice sheets in Greenland and Antarctica.
Dr Thornalley added: “To help predict the role of the ocean in future climate change, it is useful to investigate how ocean circulation changed in the past and what the associated climate effects were.”
In this study, researchers from UCL, Woods Hole Oceanographic Institute and other partner institutions analysed the composition of calcite shells of small single-celled organisms (called foraminifera) that are found in ocean floor sediment. The shells of these organisms record the chemistry of the deep ocean at the time they were living, enabling the researchers to reconstruct past changes in ocean circulation.
By measuring the radiocarbon content of these shells, the research team was able to determine how rapidly deep water was being formed in the Arctic Mediterranean. A number of different techniques were then used to constrain past temperature changes, including measuring the ratio of magnesium and calcium, and the arrangement of isotopes of carbon and oxygen within the calcite shells of the foraminifera, both of which vary according to the temperature of the water in which the foraminifera grew.
A warmer, deep Arctic Mediterranean during glacial times has been suggested in previous studies, too. As summarised by co-author Dr Henning Bauch (GEOMAR/Germany) “It is good to see that new, independent proxy data would give strong support now to these former hypotheses.”
Reference:
D. J. R. Thornalley, H. A. Bauch, G. Gebbie, W. Guo, M. Ziegler, S. M. Bernasconi, S. Barker, L. C. Skinner, and J. Yu. A warm and poorly ventilated deep Arctic Mediterranean during the last glacial period. Science, 14 August, 2015 DOI: 10.1126/science.aaa9554
The revised geometry of the downgoing Nazca plate beneath the Andean mountains in southern Peru and northern Bolivia. Seismic stations are shown as colored cubes. Vertical lines show the location of these stations projected onto the slab. Credit: Lara Wagner.
New work from an international team of researchers including Carnegie’s Lara Wagner improves our understanding of the geological activity that is thought to have formed the Rocky Mountains. It is published by Nature.
Subduction is a geological process that occurs at the boundary between two of the many plates that make up the Earth’s crust. An oceanic crustal plate sinks and slides under another plate—either oceanic or continental—and is plunged deep into Earth’s mantle.
Usually the lower plate slides down into the mantle at a fairly steep angle, sinking rapidly into the warmer, less-dense mantle material. However, in a process called “flat-slab” subduction, the lower plate moves nearly horizontally underneath the upper plate, sometimes for great distances.
Flat-slab subduction is used to explain volcanism and mountain formation that occurs far from plate boundaries, because the lower, “flat” slab moves inland beneath the surface of a landmass and thereby transmits the friction of the plates sliding against one another far inland. The formation of the Rocky Mountains between 55 and 80 million years ago, according to sedimentary and volcanic records that have been studied in detail since the 1970s, often is attributed to flat-slab subduction as the plate beneath the Pacific Ocean at that time slid beneath the North American continent.
Today, the largest flat slab is found beneath Peru, where the oceanic Nazca Plate is being subducted under the continental South American Plate. An undersea mountain belt, called the Nazca Ridge, sits on the Nazca Plate, and has been subducted along with the rest of the plate for the past 11 million years, according to previous studies
Although scientists knew that a flat slab existed in this region, much about how and when it was formed has remained a mystery. Using an array of seismometers placed over the region of flat-slab subduction, the team was able to image the structure of the subducted plate in unprecedented detail. This allowed the team to study the evolution of the Peruvian flat slab over time and to better understand the forces that created and sustain it.
What they found is that the angle of subduction is shallowest where the Nazca Ridge is being subducted beneath Peru. The portion of the plate containing this ridge sinks about 90 kilometers (56 miles) down and then flattens out. Away from the ridge, older portions of the flat slab that are no longer supported by the thick crust of the Nazca Ridge are found to be sagging, and younger, more recently subducted oceanic crust has torn free of the old, flat slab and is subducting at a normal dip angle.
“This was surprising as we expected to image large, older flat slab to the north. Instead, we found that the flat slab north of the subducting Nazca Ridge tears and reinitiates normal, steep subduction,” said lead author Sanja Knezevic Antonijevic, a student at the College of Arts and Sciences at the University of North Carolina at Chapel Hill.
Suction and trench retreat previously were theorized to be sufficient to create a flat slab. Suction is created between the upper plate and the downgoing slab, because the surrounding mantle is too viscous to creep into the narrow space between the two plates. Trench retreat occurs when the subducting oceanic plate moves dominantly downward, not laterally forward, resulting in an oceanward migration of the continent and trench.
However the team’s model shows that the subduction of the ridge is necessary for the flat slab’s formation, presumably because the buoyancy of the volcanically thickened Nazca Ridge keeps this portion of the plate from plunging steeply into the mantle. What’s more, removing the ridge from the model causes the flat slab to become unstable.
“Our model provides insights into the way that the Peruvian flat slab formed and evolved over time that can be applied to the studies of other flat-slab subduction events, such as the one that formed the Rocky Mountains,” Wagner said.
Reference:
The role of ridges in the formation and longevity of flat slabs, Sanja Knezevic Antonijevic, Lara S. Wagner, Abhash Kumar, Susan L. Beck, Maureen D. Long, George Zandt, Hernando Tavera & Cristobal Condori. DOI: 10.1038/nature14648
Competition from cats drove the extinction of many species of ancient dogs. Credit: Michele Silvestro
Competition played a more important role in the evolution of the dog family (wolves, foxes, and their relatives) than climate change, shows a new international study published in PNAS.
An international team including scientists from the Universities of Gothenburg (Sweden), São Paulo (Brazil) and Lausanne (Switzerland) analyzed over 2000 fossils and revealed that the arrival of felids to North America from Asia had a deadly impact on the diversity of the dog family, contributing to the extinction of as many as 40 of their species.
“We usually expect climate changes to play an overwhelming role in the evolution of biodiversity. Instead, competition among different carnivore species proved to be even more important for canids” says leading author Daniele Silvestro at the Department of Biological and Environmental Sciences, University of Gothenburg.
The dog family originated in North America about 40 million of years ago and reached a maximum diversity around 22 million of years ago, when more than 30 species inhabited the continent. Today, only 9 species of the dog family live in North America. They progressively increased in body size and specialized into becoming large predators. Some of them exceeded 30 Kg (66 pounds) and were among the largest carnivores on the North American continent. Although several large carnivores today face a higher extinction risk than smaller species, the authors of the study found no evidence of a similar pattern in ancient canid species.
The evolutionary success of carnivorous animals is inevitably linked to their ability to obtain food. The limited amount of resources (preys) imposes strong competition among carnivores sharing the same geographic range. For instance African carnivores such as wild dogs, hyenas, lions and other felids are constantly competing with each other for food. North American carnivores in the past might have followed similar dynamics and much of the competition is found among species of the dog family and from ancient felids and dogs. Interestingly, while felids appeared to have a strongly negative impact on the survival of ancient dogs, the opposite is not true. This suggests that felids must have been more efficient predators than most of the extinct species in the dog family.
Reference:
Daniele Silvestro, Alexandre Antonelli, Nicolas Salamin, Tiago B. Quental. The role of clade competition in the diversification of North American canids. Proceedings of the National Academy of Sciences, 2015; 112 (28): 8684 DOI: 10.1073/pnas.1502803112
Drilling activities for seismic investigations Credit: C. Haberland, GFZ
When the western part of the super-continent Gondwana broke up around 130 Million years ago, today’s Africa and South-America started to separate and the South Atlantic was born. It is commonly assumed that enormous masses of magma ascended from the deep mantle up to higher levels, and that this hot mantle plume (the Tristan mantle plume) weakened the continental lithosphere, eventually causing the break-up of the continental plate of Gondwana.
A group of German scientists are now questioning this theory. On the basis of seismic measurements published in the current issue of the journal “Geology”, scientists from Potsdam (GFZ German Research Centre for Geosciences), Bremerhaven (Alfred-Wegener-Institute, AWI) and Kiel (GEOMAR) show that impacts of the mantle plume on the continental crust are actually surprisingly small. This is by no means in agreement with a large plume playing an important role in the break-up process. Accordingly, a dominant or controlling role of a mantle plume for the break-up of the continent is thus questionable.
Hot ascending mantle plumes in the Earth’s mantle are an important driving force in plate tectonics. With an assumed diameter of the plume heads of up to several thousand kilometers, the amount of hot material ascending from the core mantle boundary at 2900 km depth is sufficient to migrate through the continental lithosphere. This process leads to the eruption of large volcanic material (flood basalts) at the Earth’s surface. This is also the case for Southern Africa and South America: the Parana/Etendeka/ flood basalt provinces are the direct consequences of the Gondwana break-up starting some 130 million years ago. Traces of the break-up process can be found on the newly formed ocean floor: the Walvis Ridge off the coast of Northern Namibia images the track of the mantle plume.
In order to study these processes, German scientists investigated structures which are related to the break-up process of Gondwana in the South Atlantic. The upwelling of large amounts of hot mantle material produces regions of crustal and mantle rocks with different seismic velocities (with respect to the surrounding, unaffected regions). In cooperation with colleagues from AWI and GEOMAR, and with the support of the Geological Survey of Namibia, scientists from GFZ have carried out extensive seismic investigations on and offshore Northern Namibia. The crustal structure was investigated along several seismic lines. “For the first time we could obtain images of the deeper crustal structure in the region where the Walvis Ridge joins the African continent, in order to study the impact of a mantle plume” explains Trond Ryberg from GFZ. “Our seismic investigations found a distinctive high-velocity anomaly in the lower crust between 20 and 40 km depth.” This region of anomalously high seismic velocities can be related to the intrusion of magmatic material in the lower crust of the Earth. This was expected according to the current perception. But surprisingly, the size of the anomaly was far too small to be created by a large plume head playing an active role in the break-up process. Trond Ryberg: “The crustal structure in the investigated region reflects the general process of continental break-up rather than the immediate impact of the plume head on the lithosphere. In addition, we were able to reconstruct the direction of the mantle plume flow”. It seems that the break-up of Gondwana in the South Atlantic and, in general, the role of mantle plumes during the continental break-up needs to be carefully re-evaluated.
Reference:
T. Ryberg, Ch. Haberland, Th. Haberlau, M. H. Weber, K. Bauer, J. H. Behrmann, W. Jokat: “Crustal structure of Northwest Namibia: Evidence for plume-rift-continent interaction”, Geology, August 2015, Vol. 43, p. 739-742, DOI:10.1130/G36768.1, geology.geoscienceworld.org/content/43/8/739.full
A rift opens near the front of Greenland’s Helheim glacier. Credit: Meredith Nettles
It is only recently that scientists learned of the existence of glacial earthquakes–measurable seismic rumblings produced as massive chunks fall off the fronts of advancing glaciers into the ocean. In Greenland, these quakes have grown sevenfold over the last two decades and they are advancing northward, suggesting that ice loss is increasing as climate warms. But exactly what drives the quakes has been poorly understood. Now, a new study elucidating the quakes’ mechanics may give scientists a way to measure ice loss remotely, and thus refine predictions of future sea-level rise. The study appears this week in the early online edition of the leading journal Science.
It shows that as the glacier front falls off into the water, or calves, there is a kickback. The rest of the glacier moves rapidly downward and backward–something like a skateboard that slips out from under a rider’s feet and goes backward as the rider falls forward. This is what produces the quake, say the researchers. The force of that kickback can be so great, it can reverse the glacier’s flow for a few minutes, from the equivalent of about 95 feet per day forward to about 130 feet per day backward. Earlier studies have shown that glaciers often speed up after calving, but did not show the more immediate backward motion that apparently produces the quakes.
“This gives us a far better explanation for the source of the earthquakes than we had before,” said Meredith Nettles, a seismologist at Columbia University’s Lamont-Doherty Earth Observatory and a coauthor of the study. “It will move us a long way towards being able to use remotely detectable seismic signals to estimate mass loss from a major class of events in both Greenland and Antarctica.”
The Greenland ice sheet has been shrinking in recent years, and nearly half the sheet’s annual mass loss is thought to occur through calving. The sheet is believed to be an important contributor to sea level.
The researchers studied Helheim Glacier, one of the largest in southeast Greenland. At some 4 miles wide and more than 100 miles long, it sheds icebergs that can be the size of small cities.
During the summer of 2013, Nettles’ colleagues from the United Kingdom’s Swansea, Newcastle and Sheffield universities installed a network of Global Positioning System (GPS) devices on the rough surface of the Helheim to measure the extent and velocity of any movements. Working with collaborators from U.S. universities, they used seismic data to tie the quakes to the kickbacks observed when glaciers calved. Water-tank experiments on scale models of glaciers bolstered the evidence.
“We were really surprised to see the glacier flowing backwards in our GPS data,” said lead author Tavi Murray of Swansea University. “The motion happens every time a large iceberg is calved and a glacial earthquake is produced.”
Glacial earthquakes in Greenland have increased from only 6 detected in 1993 to 42 in 2013. Understanding how they work is a crucial step toward measuring glaciers’ contributions to sea-level change, said the researchers. It could eventually provide global near-real time estimates of iceberg loss from ice sheets, they said.
Reference:
Reverse glacier motion during iceberg calving and the cause of glacial earthquakes, Published Online June 25 2015. Science 17 July 2015: Vol. 349 no. 6245 pp. 305-308 DOI: 10.1126/science.aab0460
This is a false color photo of megalosauripus footprints. Color scale shows how deep the footprint goes down. The footprint is left by the small dinosaur. Credit: Pernille Venø Troelsen
Some 142 million years ago, two carnivorous dinosaurs strolled along the beach in what is now Germany. Their footprints fossilized and have been analyzed by a biologist who now provides insight into the two hunters’ daily life.
One is large, the other is small. They are in no hurry, they almost stroll along, leaving their footprints in the wet sand. From time to time they skid because it’s hard to stand firm in the wet sand, but they keep their course and continue straight ahead.
A few times the small one has to trot in order to catch up with the big one. Their average speed is 6.3 km/h for the big one and 9.7 km/hour for the little one. It is notably slow for a carnivorous dinosaur that can run with more than 40 km/hour.
These and other details about the two animals that lived about 142 million years ago were presented by biologist Pernille Venø Troelsen from University of Southern Denmark on July 10 2015 at XIII Annual Meeting of the European Association of Vertebrate Paleontologists in Opole, Poland.
The ca. 50 footprints investigated were excavated in the period 2009-11 in Bückeberg Formation in Münchehagen in Germany, ca. 50 km from Hannover. For more than 200 years footprints and tracks of footprints have been found here.
A biologist looks at footprints differently than a geologist
The ca. 50 tracks investigated have previously been subject to a variety of geological surveys, but Pernille Venø Troelsen is the first to thoroughly examine them as a biologist, and this provides a different kind of information than the geologically based surveys.
“As a biologist, I can contribute with knowledge about behavior of the individual animals,” explains Pernille Venø Troelsen.
Based on analysis of the footsteps she has concludes that the two animals measured respectively 1.6 meters and 1.1 meters at hip height, and that they are probably carnivorous dinosaurs of the species Megalosauripus.
The little one has occasionally crossed its legs on its way, and according to Pernille Venø Troelsen there can be a number of reasons for this: Perhaps it lost its balance because it was slippery or the wind was strong, perhaps it found something to eat, or maybe it wanted to stick close to the big one.
“If so, this may illustrate two social animals, perhaps a parent and a young,” says Pernille Venø Troelsen.
Dinosaurs were social animals
A growing number of findings point to the fact that several dinosaur species were social animals and maybe hunted together and took care of their offspring after they were hatched.
However, it cannot be determined whether the tracks from the small one and the big one were created at the same time.
“There may be many years apart, in which case it maybe reflects two animals randomly crossing each other’s tracks. We can also see that a duckbill dinosaur (Iguanodon) has crossed their tracks at one time or another, so there has been some traffic in the area.”
These carnivorous dinosaurs were agile hunters who walked and ran on two legs. They were of app. same sze as the velicoraptor, known by many from the film Jurassic Park.
Dinosaur footprints have been found in several European countries. Especially England, Northern Germany and Spain host hundreds of footprints from carnivorous dinosaurs, aged 140-145 million years old — all from the same geological period as the footprints, examined by Pernille Venø Troelsen.
These are high-resolution photomosaic images of a healthy coral reef (left) and a volcanically acidified algae-dominated habitat (right) at Maug Island, Commonwealth of the Northern Mariana Islands. Credit: Image credits: C. Edwards and M. Fox
Scientists from NOAA and the Cooperative Institute for Marine and Atmospheric Studies at the University of Miami Rosenstiel School of Marine and Atmospheric Science (UM) have documented a dramatic shift from vibrant coral communities to carpets of algae in remote Pacific Ocean waters where an underwater volcano spews carbon dioxide.
The new research published online August 10 in Nature Climate Change provides a stark look into the future of ocean acidification — the absorption by the global oceans of increasing amounts of human-caused carbon dioxide emissions. Scientists predict that elevated carbon dioxide absorbed by the global oceans will drive similar ecosystem shifts, making it difficult for coral to build skeletons and easier for other plants and animals to erode them.
“While we’ve done lab simulations of how increased carbon dioxide influences coral growth, this is the first field evidence that increasing ocean acidification results in such a dramatic ecosystem change from coral to algae,” said Ian Enochs, a scientist with NOAA’s Cooperative Institute for Marine and Atmospheric Studies at UM who led the research. “Healthy coral reefs provide food and shelter for abundant fisheries, support tourism and protect shorelines from storms. A shift from coral to algae-covered rocks is typically accompanied by a loss of species diversity and the benefits that reefs provide.”
The research was conducted on Maug, an uninhabited volcanic island in the Commonwealth of the Northern Mariana Islands about 450 miles from Guam. This location allowed scientists to single out a small geographic area that experiences carbon dioxide levels that vary from present day to those predicted for a hundred years in the future. Maug also provided researchers with an area with few other human-made stressors for coral, such as overfishing and pollution from land.
By setting up underwater instruments to continuously measure the effects of carbon dioxide, scientists were able to use this natural laboratory to show that coral cover decreased under higher levels of carbon dioxide, giving way to less desirable algae-covered rocks near the volcano’s vents.
Reference:
I. C. Enochs, D. P. Manzello, E. M. Donham, G. Kolodziej, R. Okano, L. Johnston, C. Young, J. Iguel, C. B. Edwards, M. D. Fox, L. Valentino, S. Johnson, D. Benavente, S. J. Clark, R. Carlton, T. Burton, Y. Eynaud, N. N. Price. Shift from coral to macroalgae dominance on a volcanically acidified reef. Nature Climate Change, 2015; DOI: 10.1038/nclimate2758
Healthy kelp forest in the present-day carbon dioxide levels. Credit: Ivan Nagelkerken, University of Adelaide
A world-first underwater study of fish in their natural environment by University of Adelaide marine ecologists has shown how predicted ocean acidification from climate change will devastate temperate marine habitats and biodiversity.
Published in the journal Nature Climate Change, the researchers used natural CO2 underwater seeps to study how entire ecosystems have been impacted by the resulting acidification of the water.
They compared ecosystems in the high-CO2 levels found at volcanic vents in temperate waters in both the Northern and Southern hemispheres with adjacent ecosystems with present-day levels of CO2. These underwater vents have specific sites that release CO2 into the water at concentrations predicted for the end of the century.
“Human greenhouse gas emissions are rapidly acidifying our oceans,” says project leader Associate Professor Ivan Nagelkerken, Australian Researcher Council (ARC) Future Fellow with the University’s Environment Institute. “Using these CO2 seeps, we’ve been able to get a unique preview of what the future ocean will look like under current projections for the end of the century — and it’s not good.
“Previous studies have largely looked at how single fish species are affected by acidification in laboratory experiments. But we used these ‘natural laboratories’ to see the effects on whole ecosystems, as well as how acidification affects the behaviour and physiology of individual species.”
The study confirmed previous laboratory research which showed acidification of the water affects fish behaviour, for example, by reducing the escape response from predators.
But there were some surprising results. When the fish were close to shelter in their natural environment, this negative effect of acidification disappeared.
“We also found that some species were more abundant in the acidified waters. But these were common or generalist species such as gobie and triplefin fishes which doubled or even tripled in number to the detriment of other species,” Associate Professor Nagelkerken says.
The most dramatic finding was the marked habitat shift found in the high-CO2, acidified waters.
“As you swim from one area to the other you see a dramatic difference,” says co-author Professor Sean Connell. “One minute you’re in a kelp forest with one metre high kelp and lots of different fish. Then you move into the vent area where everything is barren with short turf algae, just a few centimetres high and devoid of the life and colour of the other areas.
“Ecosystems represent complex interactions between different species, and between species and their environment. Our research has given us a greater understanding of increasing CO2 emissions as a driver of ecological change and what this might mean for future marine biodiversity and fisheries production.”
Reference:
Ivan Nagelkerken, Bayden D. Russell, Bronwyn M. Gillanders, Sean D. Connell. Ocean acidification alters fish populations indirectly through habitat modification. Nature Climate Change, 2015; DOI: 10.1038/nclimate2757
Researchers work with seismic equipment to track meltwater running through Alaska’s Yahtse Glacier. Credit: Tony Oney
Researchers for the first time have used seismic sensors to track meltwater flowing through glaciers and into the ocean, an essential step to understanding the future of the world’s largest glaciers as climate changes.
The University of Texas Institute for Geophysics (UTIG) helped pioneer this new method on glaciers in Greenland and Alaska. The study will be published Aug. 10 in the journal Geophysical Research Letters.
Meltwater moving through a glacier into the ocean is critically important because it can increase melting and destabilize the glacier in a number of ways: The water can speed the glacier’s flow downhill toward the sea; it can move rocks, boulders and other sediments toward the terminus of the glacier along its base; and it can churn and stir warm ocean water, bringing it in contact with the glacier.
“It’s like when you drop an ice cube into a pot of warm water. It will eventually melt, but it will melt a lot faster if you stir that water,” said Timothy Bartholomaus, a postdoctoral fellow at UTIG and the study’s lead author. “Subglacial discharge provides that stirring.”
The new technique offers scientists a tool for tracking meltwater at glaciers that end in the ocean, called tidewater glaciers. Unlike landlocked glaciers, where scientists can simply measure the meltwater flowing in glacial rivers, there previously had not been a method available to track what’s occurring within tidewater glaciers.
“All of the biggest glaciers in Greenland, all of the biggest glaciers in Antarctica, they end in the ocean,” Bartholomaus said. “We need to understand how these glaciers are moving and how they are melting at their front. If we want to answer those questions, we need to know what’s occurring with the meltwater being discharged from the glacier.”
UTIG research associate Jake Walter worked on the study. The team also includes researchers from the University of Alaska Southeast, the U.S. Geological Survey and the University of Alaska Fairbanks. Bartholomaus did his fieldwork while studying for his doctorate at the University of Alaska Fairbanks, but he analyzed the data and wrote the study while at UTIG.
UTIG is a research unit of The University of Texas at Austin Jackson School of Geosciences.
The team discovered the new method while trying to study earthquakes caused by iceberg calving — when large chunks of ice break off glaciers. Bartholomaus said the ability to identify these earthquakes, known as icequakes, varied over the season, and that they were much more difficult to detect during summer because seismic background noise was obscuring the icequake signals.
The team set about trying to determine what was causing the background noise, investigating potential causes such as rainfall, iceberg calving and the movement of the glacier over the ground. Eventually, as the researchers discounted these theories, they discovered that the seismic vibrations being detected by the equipment was caused by meltwater percolating down through the glacier and weaving its way through the complicated plumbing system in the interior of the ice.
Researchers tested the theory on glaciers with meltwater rivers and found that the timing of the meltwater and the seismic signals synced perfectly. The method is very good at identifying when the glacial discharge is flowing into the ocean, Bartholomaus said, but it will take more research to determine exactly how much water is flowing out.
“Now that we know when subglacial discharge is faster or slower, we can make better measurements of glacier change,” Bartholomaus said. “My hope is that this method will really help us understand how the glaciers and the oceans are coupled, and how the ocean might be affecting the behavior of tidewater glaciers.”
Reference:
Timothy C. Bartholomaus, Jason M. Amundson, Jacob I. Walter, Shad O’Neel, Michael E. West, Christopher F. Larsen. Subglacial discharge at tidewater glaciers revealed by seismic tremor. Geophysical Research Letters, 2015; DOI: 10.1002/2015GL064590
At first, NDSU senior Sean Ternes didn’t realize he had an incredible find at his fingertips. But he soon learned the small fossil he discovered in the dust of the North Dakota Badlands dates back to the time of the dinosaurs.
Ternes, a geology major, is an intern this summer for the North Dakota Geological Survey. Most days, he prepares data about sandstone formations in the Bakken region.
Another of his internship duties is to teach proper fossil-hunting techniques to volunteers who participate in the agency’s annual series of public digs. And that’s what he was doing July 9 about 2 p.m. near Bowman, North Dakota.
“I was walking around, looking for exposed fossils on the surface,” Ternes said. “I came around the corner, noticed something and got down on my knees to take a closer look.”
Ternes stumbled upon a pile of modern bones, possibly from a rabbit. But, just a foot away, another small bone caught his eye.
“My first thought was that it was from the modern mammal that had died, but it had a little discoloration; it had a darker color to it,” Ternes said, noting he carefully brushed away the soil from around the bone and leaned in to examine it.
The fossil, just over an inch long, was the jawbone of a Glasbius twitchelli, a small marsupial that lived near at the end of the Cretaceous Period about 65 million years ago. The small creature was among the first mammals on earth, appearing shortly before the dinosaurs became extinct.
Ternes speculates the jawbone was only recently unearthed by water or wind erosion, because the fossil was in superb condition. The entire lower jaw was intact, with six tiny teeth still in place.
“I showed it to one of the survey paleontologists and he got very, very excited. Then, I knew I had found something pretty important,” said Ternes, who grew up in Bismarck, North Dakota. “My thought was ‘Wow’ and that’s when I got excited.”
Fossils of Glasbius twitchelli have been found in Montana and Wyoming, but never as far east as North Dakota.
“Finding a complete mammal jaw from the Late Cretaceous is very rare, and the specimen Sean found may be the most complete lower jaw ever found for this species,” explained Clint Boyd, North Dakota Geological Survey senior paleontologist. “This find improves our knowledge of this species and enhances our understanding of the Late Cretaceous fauna from North Dakota.”
Paleontology is an interesting subject for Ternes, but it’s not his life’s calling. He plans a career in economic geology after graduate school. “Mineral exploration is my real passion. I want to eventually look for potential gold, silver or copper mines,” he said.
“Finding the fossil, though, was cool.”
The jawbone is now in North Dakota Geological Survey’s State Fossil Collection.
Digital maps of seafloor sediments are hown. Figures 1 and 2 are from Dutkiewicz et al., Geology, Aug. 5, 2015. Credit: Dutkiewicz et al., Geology, Aug. 5, 2015
Ocean sediments cover 70% of our planet’s surface, forming the substrate for the largest ecosystem on Earth and its largest carbon reservoir — but the most recent map of seafloor geology was drawn by hand more than 40 years ago. Now Adriana Dutkiewicz and her colleagues from the University of Sydney have carefully analyzed and categorized 15,000 seafloor sediment samples to reveal that deep ocean basins are much more complex than previously thought.
The team has created a new digital seafloor geologic map using an artificial intelligence method designed to learn how different types of deep marine sediments are juxtaposed. Combined with sea surface observations, the map reveals that diatom accumulations on the seafloor are nearly entirely decoupled from diatom blooms in surface waters in the Southern Ocean.
Diatoms are tiny planktonic organisms thriving in sunlit surface waters, producing about a quarter of the oxygen we breathe, and making a major contribution to fighting global warming as their dead remains sink to the bottom of the ocean, locking away their carbon. However, the new seafloor geology map demonstrates that geoscientists don’t yet understand how carbon sources in surface ocean waters are linked to sinks on the seafloor.
Reference:
Census of seafloor sediments in the world’s ocean
Adriana Dutkiewicz et al., EarthByte Group, School of Geosciences, University of Sydney, Sydney, Australia. Published online ahead of print on 5 Aug. 2015; DOI: 10.1130/G36883.1. This article is OPEN ACCESS.