Home Blog Page 184

Comet craters — literal melting pots for life on Earth

Comet craters-GeologyPage
First author Edel O’Sullivan enjoys the sunshine by the Sudbury Crater in Canada. Credit: Trinity College Dublin

Geochemists from Trinity College Dublin’s School of Natural Sciences may have found a solution to a long-debated problem as to where – and how – life first formed on Earth.

In a paper just published in the journal Geochimica et Cosmochimica Acta, the team proposes that large meteorite and comet impacts into the sea created structures that provided conditions favourable for life. Water then interacted with impact-heated rock to enable synthesis of complex organic molecules, and the enclosed crater itself was a microhabitat within which life could flourish.

It has long been suggested that the meteoritic and cometary material that bombarded the early Earth delivered the raw materials – complex organic molecules, such as glycine, β-alanine, γ-amino-n-butyric acid, and water – and the energy that was required for synthesis. The Trinity group’s work has provided the new hypothesis that impact craters were ideal environments to facilitate the reactions that saw the first ‘seeds of life’ take root.

First author Edel O’Sullivan, now a PhD candidate in Switzerland, said: “Previous studies investigating the origin of life have focused on synthesis in hydrothermal environments. Today these are found at mid-ocean ridges – hallmark features of plate tectonics, which likely did not exist on the early Earth. By contrast, the findings of this new study suggest that extensive hydrothermal systems operated in an enclosed impact crater at Sudbury, Ontario, Canada.”

The research was part of a wider project funded by Science Foundation Ireland and led by senior author, Professor of Geology and Mineralogy at Trinity, Balz Kamber.

Although no very ancient terrestrial impact structures are preserved, the Sudbury basin provides a unique opportunity to study the sediment that filled the basin as a guide to what the earlier impact craters would have looked like. The Sudbury structure is distinctive among the known terrestrial impact craters. It has an unusually thick (nearly 2.5 km) basin fill, and much of this is almost black in colour (due to carbon) containing also hydrothermal metal deposits.

Professor Kamber said: “Due to later tectonic forces, all the rocks of the once ~200 km-wide structure are now exposed at the surface rather than being buried. This makes it possible to take a traverse from the shocked footwall through the melt sheet and then across the entire basin fill. To a geologist, this is like a time journey from the impact event through its aftermath.”

Representative samples across the basin fill were analysed for their chemistry and for carbon isotopes, and they revealed an interesting sequence of events.

The first thing that became evident was that the crater was filled with seawater at an early stage, and remained sub-marine throughout deposition. Importantly, the water in the basin was isolated from the open ocean for long enough to deposit more than 1.5 km of volcanic rock and sediment. The lower fill is made up of rocks that formed when the water entered the crater whose floor was covered by hot impact melt. Fuel-coolant reactions deposited volcanic rocks and promoted hydrothermal activity. Above these deposits, reduced carbon starts to appear within the basin fill and the volcanic products become more basaltic.

Previously the puzzling presence of carbon in these rocks was explained by washing in from outside the crater basin. However, the new data show that it was microbial life within the crater basin that was responsible for the build-up of carbon and also for the depletion in vital nutrients, such as sulphate.

“There is clear evidence for exhaustion of molybdenum in the water column, and this strongly indicates a closed environment, shut off from the surrounding ocean,” added Edel O’Sullivan.

Only after the crater walls eventually collapsed did the study show replenishment of nutrients from the surrounding sea. These sub-marine, isolated impact basins, which experienced basaltic volcanism and were equipped with their own hydrothermal systems, thus present a new pathway to synthesis and concentration of the stepping stones to life.

A copy of the journal article is available on request.

Reference:
Edel M. O’Sullivana, Robbie Goodhuea, Doreen E. Amesb, Balz S. Kambera, Chemostratigraphy of the Sudbury impact basin fill: Volatile metal loss and post-impact evolution of a submarine impact basin. DOI: 10.1016/j.gca.2016.04.007

Note: The above post is reprinted from materials provided by Trinity College Dublin.

San Andreas Fault ‘locked, loaded and ready to roll’ with big quake, expert says

San Andreas Fault 'locked, loaded-GeologyPage
This simulation by the Southern California Earthquake Center shows the shaking that could be felt by Los Angeles during a possible magnitude 8 earthquake on the San Andreas fault. (SCEC)

Southern California’s section of the San Andreas Fault is “locked, loaded and ready to roll,” a leading earthquake scientist said Wednesday at the National Earthquake Conference in Long Beach.

The San Andreas Fault is one of California’s most dangerous, and is the state’s longest fault. Yet for Southern California, the last big earthquake to strike the southern San Andreas was in 1857, when a magnitude 7.9 earthquake ruptured an astonishing 185 miles between Monterey County and the San Gabriel Mountains near Los Angeles.

It has been quiet since then – too quiet, said Thomas Jordan, director of the Southern California Earthquake Center.

“The springs on the San Andreas system have been wound very, very tight. And the southern San Andreas fault, in particular, looks like it’s locked, loaded and ready to go,” Jordan said in the opening keynote talk.

Other sections of the San Andreas Fault also are overdue for a big quake. Further southeast of the Cajon Pass, such as in San Bernardino County, the fault has not moved substantially since an earthquake in 1812, and further southeast toward the Salton Sea, it has been relatively quiet since about 1680 to 1690.

Here’s the problem: Scientists have observed that based on the movement of tectonic plates, with the Pacific plate moving northwest of the North American plate, earthquakes should be relieving about 16 feet of accumulated plate movement every 100 years. Yet the San Andreas has not relieved stress that has been building up for more than a century.

Jordan said it’s important that California focus on becoming resilient to a potential huge earthquake, one as strong as a magnitude 8. He praised Los Angeles’ plan to require earthquake retrofits on apartment and concrete buildings, pushed into law by Mayor Eric Garcetti.

“It’s remarkable that this happened,” Jordan said. “We know politically how difficult it is to make these kinds of changes.”

Other areas of focus have included strengthening Los Angeles’ vulnerable aqueduct systems and its telecommunications networks.

A 2008 U.S. Geological Survey report warned that a magnitude 7.8 earthquake on the southern San Andreas Fault would cause more than 1,800 deaths, 50,000 injuries, $200 billion in damage and severe, long-lasting disruptions. Among the predicted problems: The sewer system could be out of commission for six months.

Such an earthquake could cause shaking for nearly two minutes, with the strongest shaking in the Coachella Valley, Inland Empire and Antelope Valley, but it also could send pockets of strong shaking into areas where sediments trap shaking waves, such as the San Gabriel Valley and East Los Angeles.

The devastating potential of the fault became clear with a 1857 temblor, which had an estimated magnitude of 7.9. It became known as the Fort Tejon quake. The name is something of a misnomer because it started farther north, way up in Parkfield in Monterey County. The quake then barreled south on the San Andreas for about 185 miles, through Fort Tejon near the northern edge of Los Angeles County, then east toward the Cajon Pass in San Bernardino County, near what is now the 15 Freeway.

The quake was so powerful that the soil liquefied, causing trees as far away as Stockton to sink. Trees were also uprooted west of Fort Tejon. The shaking lasted 1 to 3 minutes.

Even though the San Andreas fault does not go directly into Los Angeles — it is 30 miles away from downtown — the city is expected to be heavily shaken by a large earthquake on that fault. For instance, simulations of a possible magnitude 7.8 quake on the San Andreas fault that begins at the Salton Sea and spreads west toward the San Gabriel mountains show seismic shaking waves “bent into the Los Angeles area,” Jordan said. One video shows strong ground-shaking stretching from northern San Diego County to Barstow.

Using the world’s largest supercomputer at the time, the Southern California Earthquake Center in 2010 unveiled a simulated magnitude 8 earthquake that begins in Monterey County, like in 1857, but travels even farther south, heading toward the Mexican border. The L.A. Basin and the San Fernando Valley would be hit hard because the shaking would be trapped by soft soils in the valley and basin.

“You can see that this area of influence by the shaking has now expanded out to huge proportions,” Jordan said. “You see that big directivity pulse out in front, as that energy is being shoved down that fault, that directivity pulse leads energy into seismic waves that excite the sedimentary basins, like the San Fernando Valley and the Los Angeles Basin,” and through San Bernardino, Jordan said.

“You’ll notice large shaking in the Los Angeles region persisting for long periods of time,” he said.

Note: The above post is reprinted from materials provided by Los Angeles Times/Distributed by Tribune Content Agency, LLC.

Scientists map a new island volcano

Scientists map a new island volcano-GeologyPage
A satellite view of the new island. Credit: NASA

One of the earth’s newest islands exploded into view from the bottom of the southwest Pacific Ocean in January 2015, and scientists sailing around the volcano this spring have created a detailed map of its topography.

The Schmidt Ocean Institute’s research vessel Falkor conducted the mapping in collaboration with NASA during a research cruise whose focus was actually elsewhere: exploring marine life around the hydrothermal vent fields of the nearby eastern Lau Basin, near the island Kingdom of Tonga. Lamont-Doherty Earth Observatory scientist Vicki Ferrini, who uses geophysical mapping techniques to study the seafloor, was aboard the R/V Falkor and helped process the mapping data.

Because much of the landscape dynamics associated with new oceanic island volcanoes happens underwater, this unique project of opportunity provides scientists at NASA and Lamont-Doherty with an integrated view of the three dimensional character of the new island, from the seafloor to its approximately 130-meter-tall summit above sea-level, all at meter-scale resolution.

The new island—unofficially named Hunga Tonga Hunga Ha’apai—was formed in what’s called a “surtseyan” eruption, named after the island of Surtsey off the southern coast of Iceland. In such events, hot magma rising from the seafloor into cool water causes a violent blast of ash and rock. (The name “Surtsey” derives from Surtr, a fire giant from Norse mythology.)

The mapping will help researchers understand how such rapidly formed volcanic islands evolve and why their survival as land is often limited. Preliminary analysis by Ferrini and NASA scientists from the Goddard Space Flight Center show why the new island has lost nearly 30 percent of its initial land area in only 15 months since the eruptive activity ended in late January 2015. The work showed that the submarine topography around the new island clearly affects the pace and location of erosion due primarily to marine abrasion and local subsidence.

The work will contribute to understanding of hydro-volcanic processes on planets such as Mars, where similar-appearing volcanic structures have been observed by NASA satellites such as the Mars Reconnaissance Orbiter.

The mapping also contributes to a project to extend satellite-based measurements that NASA’s Earth Sciences Program began in summer of 2015 with collaborators from the National Geospatial-Intelligence Agency and the Canadian Space Agency, as well as the German Space Agency.

Video

Note: The above post is reprinted from materials provided by Columbia University.

Research on modern day animals reveals insights into extinct animals

Research on modern day animals-GeologyPage
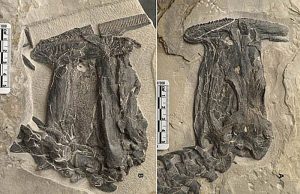
Cadaver 3. (a) Day 3, 72 h. (b) Day 4, 96 h. At this stage the head and anterior neck has a slight downward bend compared with the preceding stage (a). (c) Day 5, 120 h. Both head and posterior neck recoil upward. Thoracic vertebrae and ribs are strongly displaced ventrally (detail in Fig. 4). (d) Body outline from day 5 imposed over cadaver at day 4 stage (head and neck curved slightly downward from day 3 stage) to show the considerable upward recoil of the head and neck.

Powerful head and neck retractions of vertebrate carcasses, including dinosaur fossils, have puzzled researchers as to whether they occurred just before an animal’s death in agony, or after. Now experiments performed in the wild on large ostrich chick cadavers show that they occur post-mortem.

The experiments show that the timing of soft tissue decay is critical, and that muscle destruction or loss of tone must occur before ligament destruction. This would allow for the release of stored energy in the ligament and result in vertebral retraction.

The wider implications of the study concerns one of the most controversial dinosaurs known, Sinosauropteryx , which is thought by some to have been feathered and to have died in water.

“While emphasis on Sinosauropteryx has been on its alleged and highly questionable protofeathers, the present study offers considerably more constructive research on how the dinosaur died,” said Prof. Theagarten Lingham-Soliar, author of the Journal of Zoology study.

Reference:
T. Lingham-Soliar. Experiments on ostrich decomposition and opisthotonus with implications for theropod dinosaurs. Journal of Zoology, 2016; DOI: 10.1111/jzo.12345

Note: The above post is reprinted from materials provided by Wiley.

Scientists find likely cause for recent southeast U.S. earthquakes

scientists find likely cause-GeologyPage
Shaking from the magnitude 5.8 earthquake near Mineral, Virginia on August 23, 2011 was felt by more people than any other earthquake in U.S. history, according to the U.S. Geological Survey. Credit: USGS

The southeastern United States should, by all means, be relatively quiet in terms of seismic activity. It’s located in the interior of the North American Plate, far away from plate boundaries where earthquakes usually occur. But the area has seen some notable seismic events — most recently, the 2011 magnitude-5.8 earthquake near Mineral, Virginia that shook the nation’s capital.

Now scientists report in a new study a likely explanation for this unusual activity: pieces of the mantle under this region have been periodically breaking off and sinking down into the Earth. This thins and weakens the remaining plate, making it more prone to slipping that causes earthquakes. The study authors conclude this process is ongoing and likely to produce more earthquakes in the future.

“Our idea supports the view that this seismicity will continue due to unbalanced stresses in the plate,” said Berk Biryol, a seismologist at the University of North Carolina at Chapel Hill and lead author of the new study. “The [seismic] zones that are active will continue to be active for some time.” The study was published today in the Journal of Geophysical Research — Solid Earth, a journal of the American Geophysical Union.

Compared to earthquakes near plate boundaries, earthquakes in the middle of plates are not well understood and the hazards they pose are difficult to quantify. The new findings could help scientists better understand the dangers these earthquakes present.

Old plates and earthquakes

Tectonic plates are composed of Earth’s crust and the uppermost portion of the mantle. Below is the asthenosphere: the warm, viscous conveyor belt of rock on which tectonic plates ride.

Earthquakes typically occur at the boundaries of tectonic plates, where one plate dips below another, thrusts another upward, or where plate edges scrape alongside each other. Earthquakes rarely occur in the middle of plates, but they can happen when ancient faults or rifts far below the surface reactivate. These areas are relatively weak compared to the surrounding plate, and can easily slip and cause an earthquake.

Today, the southeastern U.S. is more than 1,056 miles from the nearest edge of the North American Plate, which covers all of North America, Greenland and parts of the Atlantic and Arctic oceans. But the region was built over the past billion years by periods of accretion, when new material is added to a plate, and rifting, when plates split apart. Biryol and colleagues suspected ancient fault lines or pieces of old plates extending deep in the mantle following episodes of accretion and rifting could be responsible for earthquakes in the area.

“This region has not been active for a long time,” Biryol said. “We were intrigued by what was going on and how we can link these activities to structures in deeper parts of the Earth.”

A CAT scan of the Earth

To find out what was happening deep below the surface, the researchers created 3D images of the mantle portion of the North American Plate. Just as doctors image internal organs by tracing the paths of x-rays through human bodies, seismologists image the interior of the Earth by tracing the paths of seismic waves created by earthquakes as they move through the ground. These waves travel faster through colder, stiffer, denser rocks and slower through warmer, more elastic rocks. Rocks cool and harden as they age, so the faster seismic waves travel, the older the rocks.

The researchers used tremors caused by earthquakes more than 2,200 miles away to create a 3D map of the mantle underlying the U.S. east of the Mississippi River and south of the Ohio River. They found plate thickness in the southeast U.S. to be fairly uneven — they saw thick areas of dense, older rock stretching downward and thin areas of less dense, younger rock.

“This was an interesting finding because everybody thought that this is a stable region, and we would expect regular plate thickness,” Biryol said.

At first, they thought the thick, old rocks could be remnants of ancient tectonic plates. But the shapes and locations of the thick and thin regions suggested a different explanation: through past rifting and accretion, areas of the North American Plate have become more dense and were pulled downward into the mantle through gravity. At certain times, the densest parts broke off from the plate and sank into the warm asthenosphere below. The asthenosphere, being lighter and more buoyant, surged in to fill the void created by the missing pieces of mantle, eventually cooling to become the thin, young rock in the images.

The researchers concluded this process is likely what causes earthquakes in this otherwise stable region: when the pieces of the mantle break off, the plate above them becomes thinner and more prone to slip along ancient fault lines. Typically, the thicker the plate, the stronger it is, and the less likely to produce earthquakes.

According to Biryol, pieces of the mantle have most likely been breaking off from underneath the plate since at least 65 million years ago. Because the researchers found fragments of hard rocks at shallow depths, this process is still ongoing and likely to continue into the future, potentially leading to more earthquakes in the region, he said.

Reference:
C. Berk Biryol, Lara S. Wagner, Karen M. Fischer, Robert B. Hawman. Relationship Between Observed Upper Mantle Structures and Recent Tectonic Activity Across the Southeastern United States. Journal of Geophysical Research: Solid Earth, 2016; DOI: 10.1002/2015JB012698

Note: The above post is reprinted from materials provided by University of North Carolina at Chapel Hill. The original item was written by Lauren Lipuma.

Serranía de Hornocal, Argentine

Serranía de Hornocal
Serranía de Hornocal Photo Copyright © Trip Advisor

The Serrania del Hornocal is one of the wonders of the province of Jujuy, a limestone formation with different types of minerals being eroded stripped a symphony of colors on the mountainsides.

It is a landscape that calls be contemplated, to stand in front of him for a moment, or for a long time in which we would not feel hardly insignificant. In the viewpoint streaks color, triangular shapes in this particular rainbow some say, reaches the 33 shades are appreciated. It is an example of sedimentation layers, colors are formed by a limestone ranging from ocher, green, yellow, and even white.

These strata were underground for thousands of years, when the formation of the mountains did with his long process, the effect to expose the color. Today we see the fractured rocks making frame the panoramic views. And not feel further push to contemplate and take good pictures. One of the most famous viewpoints of this mountainous area is about 25 kilometers along Provincial Route 73, from the city of Humahuaca.

Get only takes about 40 minutes of gravel road to a viewpoint facing the hill. We will face a silent and majestic spectacle, no less than 4,300 meters Another of the great beauties of the Quebrada, although in this case, less known and visited. Another point to consider is the tour schedule to arrive in the afternoon, when the sun will handle highlight the colors on the mountainside. At that time, we can imagine the grandeur of these landscapes in the time still lived the Incas.

In fact, the entire Humahuaca was the landscape under a section of this historical journey of thousands of kilometers that was born in Ecuador and quite stretched further south in Argentina. Today, both the Inca Trail as the Quebrada are recognized as World Heritage sites by UNESCO, a recognition that is easily explained by the cultural value and natural beauty combined. And yet, amid so much majesty and both tourist takeoff, these landscapes little or nothing has changed, and remain under the reign of silence, clouds, and the cycles of the sun: a show full time you can enjoy all year.

The mountains reach an altitude of 4761 meters above sea level.

Photos

Map

References:
Wikipedia: Serranía de Hornocal
Argentina: Mirador del Hornocal: el secreto del Norte
Photo Copyright © Trip Advisor

Endangered venomous mammal predates dinosaurs’ extinction, study confirms

Endangered venomous mammal-GeologyPage
ZooDom veterinarian Adrell Nunez (center) draws blood from a solenodon for DNA samples. Researchers caught the venomous mammal by allowing it to walk across their bodies at night in the forests of the Dominican Republic. Pictured from left to right: Nicolas De J. Corona, Adrell Nunez, Taras K. Oleksyk, and Yimell Corona. Credit: Photo by Taras Oleksyk and Yashira Afanador

The University of Illinois and University of Puerto Rico have completely sequenced the mitochondrial genome for the Hispaniolan solenodon, filling in the last major branch of placental mammals on the tree of life.

The study, published in Mitochondrial DNA, confirmed that the venomous mammal diverged from all other living mammals 78 million years ago, long before an asteroid wiped out the dinosaurs.

“It’s just impressive it’s survived this long,” said co-first author Adam Brandt, a postdoctoral researcher at Illinois. “It survived the asteroid; it survived human colonization and the rats and mice humans brought with them that wiped out the solenodon’s closest relatives.”

The study also supports recent findings that the Dominican Republic contains genetically distinct northern and southern populations that should be conserved as separate sub-species. Furthermore, the study found that the southern population has little diversity, whereas the northern population is much more diverse.

An offspring’s nuclear DNA is a mixture of genes from each parent while mitochondrial DNA is passed directly from mother to offspring without changes, creating a genetic record that researchers can use to trace back the lineage of organisms.

Because solenodons are endangered, it is difficult to acquire DNA. Working with colleagues at several universities in the Dominican Republic, UPR Professor of Genetics Taras Oleksyk and his team collected samples by laying on the ground and waiting for the solenodons to crawl across their bodies.

Brandt and co-first author Kirill Grigorev, a bioinformatician at the Caribbean Genome Center, analyzed the samples using two different methods to determine the sequence of nucleotides (building blocks that make up DNA) of the solendon’s mitochondrial genome. Independently, the two methods produced the exact same results.

A previous study used a different set of genes to estimate that solenodons diverged from mammals during the Cretaceous Period 76 million years ago. Working with an expert at Texas A&M, this study used a very different method but still established a similar estimate: 78 million years.

Interestingly, these two estimates align with a hypothesis regarding how the solenodon came to inhabit the island of Hispaniola. Some geologists speculate that the island was part of a volcanic arc connected to Mexico 75 million years ago and over time the arc has moved eastward.

“Whether they got on the island when the West Indies ran into Mexico 75 million years ago, or whether they floated over on driftwood or whatever else much later is not very clear,” said lead researcher Alfred Roca, a professor of animal sciences and member of the Carl R. Woese Institute for Genomic Biology.

What they do know is that any close ancestors are long gone, and today’s solenodons are the only remnant of a very ancient group of mammals. While the solenodon is venomous and resembles a “giant rat with Freddy Krueger claws” (according to Roca), it evolved in the absence of carnivores. Today, it is threatened by cats and dogs introduced by humans as well as habitat loss.

The Dominican Republic made this study possible by supporting the collection of samples.

Reference:
Adam L. Brandt, Kirill Grigorev, Yashira M. Afanador-Hernández, Liz A. Paulino, William J. Murphy, Adrell Núñez, Aleksey Komissarov, Jessica R. Brandt, Pavel Dobrynin, J. David Hernández-Martich, Roberto María, Stephen J. O’Brien, Luis E. Rodríguez, Juan C. Martínez-Cruzado, Taras K. Oleksyk, Alfred L. Roca. Mitogenomic sequences support a north–south subspecies subdivision withinSolenodon paradoxus. Mitochondrial DNA Part A, 2016; 1 DOI: 10.3109/24701394.2016.1167891

Note: The above post is reprinted from materials provided by Carl R. Woese Institute for Genomic Biology, University of Illinois at Urbana-Champaign.

Earth may be home to one trillion species

Earth may be home to-GeologyPage
Soils are one of the largest reservoirs of microbial diversity on Earth. It is not uncommon for a gram of soil to contain 1 trillion cells and 10,000 species of bacteria, including Actinomyces israelii (pictured). Credit: GrahamColm at English Wikipedia

Earth could contain nearly 1 trillion species, with only one-thousandth of 1 percent now identified, according to a study from biologists at Indiana University.

The estimate, based on the intersection of large datasets and universal scaling laws, appears May 2 in the Proceedings of the National Academy of Sciences. The study’s authors are Jay T. Lennon, associate professor in the IU Bloomington College of Arts and Sciences’ Department of Biology, and Kenneth J. Locey, a postdoctoral fellow in the department.

The IU scientists combined microbial, plant and animal community datasets from government, academic and citizen science sources, resulting in the largest compilation of its kind. Altogether, these data represent over 5.6 million microscopic and nonmicroscopic species from 35,000 locations across all the world’s oceans and continents, except Antarctica.

“Estimating the number of species on Earth is among the great challenges in biology,” Lennon said. “Our study combines the largest available datasets with ecological models and new ecological rules for how biodiversity relates to abundance. This gave us a new and rigorous estimate for the number of microbial species on Earth.

“Until recently, we’ve lacked the tools to truly estimate the number of microbial species in the natural environment,” he added. “The advent of new genetic sequencing technology provides an unprecedentedly large pool of new information.”

The work is funded by an effort of the National Science Foundation to transform, by 2020, understanding about the scope of life on Earth by filling major gaps in humanity’s knowledge about the planet’s biodiversity.

“This research offers a view of the extensive diversity of microbes on Earth,” said Simon Malcomber, director of the NSF’s Dimensions of Biodiversity program. “It also highlights how much of that diversity still remains to be discovered and described.”

Microbial species are all forms of life too small to be seen with the naked eye, including all single-celled organisms, such as bacteria and archaea, as well as certain fungi. Many earlier attempts to estimate the number of species on Earth simply ignored microorganisms or were informed by older datasets that were based on biased techniques or questionable extrapolations, Lennon said.

“Older estimates were based on efforts that dramatically under-sampled the diversity of microorganisms,” he added. “Before high-throughput sequencing, scientists would characterize diversity based on 100 individuals, when we know that a gram of soil contains up to a billion organisms, and the total number on Earth is over 20 orders of magnitude greater.”

The realization that microorganisms were significantly under-sampled caused an explosion in new microbial sampling efforts over the past several years, including the collection of human-related microorganisms by the National Institutes of Health’s Human Microbiome Project; marine microorganisms by the Tara Oceans Expedition; and aquatic, terrestrial and host-related microorganisms by the Earth Microbiome Project.

These data sources — and many others — were compiled to create the inventory in the IU study, which pulls together 20,376 sampling efforts on bacteria, archaea and microscopic fungi and 14,862 sampling efforts on communities of trees, birds and mammals. All of these sources were either publically available or provided access to IU.

“A massive amount of data has been collected from these new surveys,” said Locey, whose work included programming required to compile the inventory. “Yet few have actually tried to pull together all the data to test big questions.

“We suspected that aspects of biodiversity, like the number of species on Earth, would scale with the abundance of individual organisms,” he added. “After analyzing a massive amount of data, we observed simple but powerful trends in how biodiversity changes across scales of abundance. One of these trends is among the most expansive patterns in biology, holding across all magnitudes of abundance in nature.”

Scaling laws, like those discovered by the IU scientists, are known to accurately predict species numbers for plant and animal communities. For example, the number of species scales with the area of a landscape.

“Until now, we haven’t known whether aspects of biodiversity scale with something as simple as the abundance of organisms,” Locey said. “As it turns out, the relationships are not only simple but powerful, resulting in the estimate of upwards of 1 trillion species.”

The study’s results also suggest that actually identifying every microbial species on Earth is an almost unimaginably huge challenge. To put the task in perspective, the Earth Microbiome Project — a global multidisciplinary project to identify microscope organisms — has so far cataloged less than 10 million species.

“Of those cataloged species, only about 10,000 have ever been grown in a lab, and fewer than 100,000 have classified sequences,” Lennon said. “Our results show that this leaves 100,000 times more microorganisms awaiting discovery — and 100 million to be fully explored. Microbial biodiversity, it appears, is greater than ever imagined.”

This research was also supported in part by the U.S. Army Research Office.

Reference:
Kenneth J. Loceya, and Jay T. Lennona. Scaling laws predict global microbial diversity. PNAS, 2016 DOI: 10.1073/pnas.1521291113

Note: The above post is reprinted from materials provided by Indiana University.

230 million-year-old dinosaur footprint found in north Spain

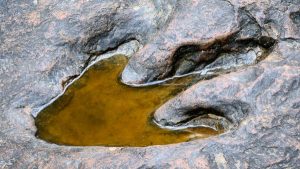
This photo made available by the Direccio General de Comunicacio del Govern of Catalonia on Monday, May 2, 2016, shows a footprint of a dinosaur discovered in early April by a person out walking in Olesa de Montserrat, 40 kilometers north of Barcelona. The government says the footprint of a dinosaur that roamed Spain 230 million years ago has been found in an excellent state of conservation in northeastern Catalonia. (Direccio General de Comunicacio del Govern of Catalonia via AP)

Spain says a footprint of a dinosaur that roamed the area 230 million years ago has been found in northeastern Catalonia, and says it’s the best preserved dinosaur print seen so far in the Iberian Peninsula.

The print of a reptile-like creature called an Isochirotherium—an ancestor of dinosaurs and crocodiles—was discovered in early April by a person out walking in Olesa de Montserrat, 40 kilometers (25 miles) north of Barcelona.

The government said Monday that a plaster cast of the print was made by the town’s council and handed over to the region’s archaeology and paleontology department “so it can be studied and preserved.”

The statement said the “conservation status is exceptional and retains details of claws and skin.”

Note: The above post is reprinted from materials provided by The Associated Press.

Supercontinent rift formed bizarre Bunbury rocks

Supercontinent rift formed-GeologyPage
Their latest research suggest the lava that created Bunbury Basalt (pictured) actually came from a deep rift in the Earth’s crust. Credit: G Crouch

Bunbury beachgoers may be unsettled to learn that the refreshing, blue stretch of water off the port city was preceded by a huge lava flow almost as large as WA itself and several kilometres thick in places.

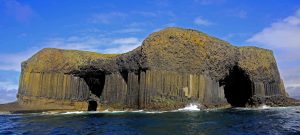
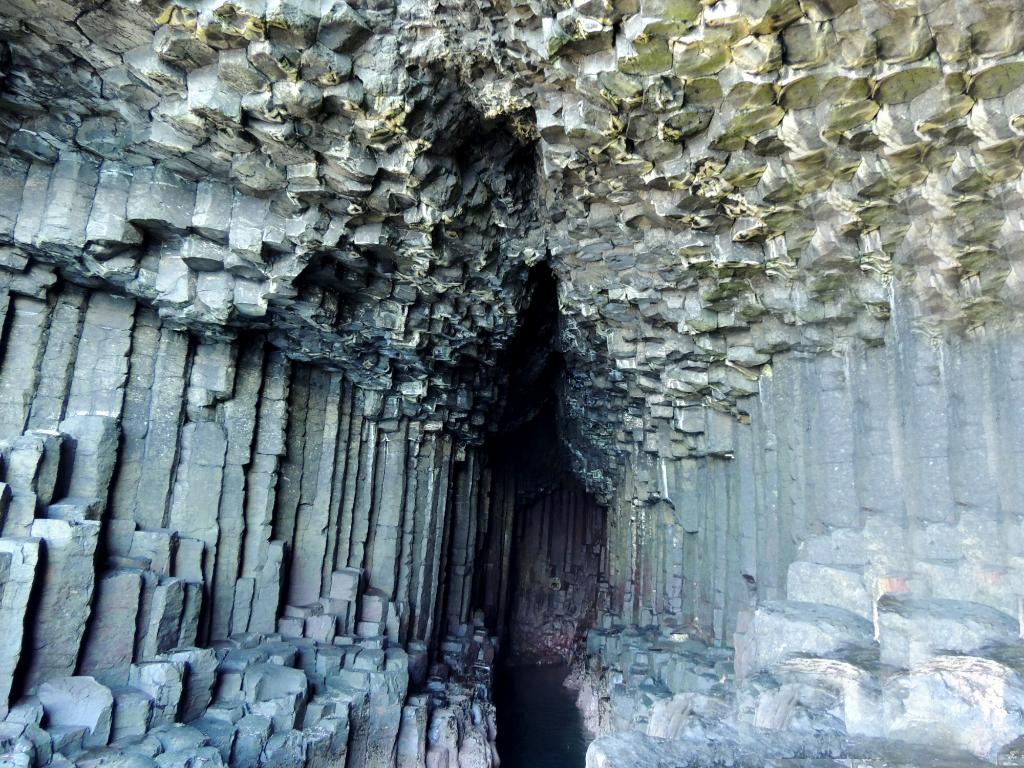
All that is left of these ancient scenes at Back Beach, Capel and Black Point in the South West are bizarre black rock columns—known as Bunbury Basalt—which are now mostly submerged under the Indian Ocean.

While the lava flows are no surprise to Curtin University geologists their latest research suggest the lava that created Bunbury Basalt actually came from a deep rift in the Earth’s crust.

This is opposed to the conventional theory that a single volcano in the region was responsible for the lava flow.

The volcano was thought to have been caused by a “magma pocket” or weakening of the crust as it passed over a hot spot in the Earth’s mantle.

Associate Professor Fred Jourdan bases the updated explanation on a new date for the rocks, 137 million years before present, which is seven million years earlier than previously thought.

This date coincides with India’s separation from the West Australian coast when the supercontinent Gondwana broke up.

At this point in time the magmatic pocket would have been too far away to have created a volcano near present day Bunbury.

They reached their conclusion after dating rocks they collected near Bunbury and several Geoscience Australia samples from Heard and Kerguelen Islands in the Indian Ocean.

They crushed the samples and extracted the mineral plagioclase which they sent to be irradiated in a nuclear reactor.

Geological timeline came from decaying potassium

When it returned they measured the decay of potassium into argon in the mass spectrometer at Curtin University’s Argon Laboratory.

Potassium decays into argon, Prof Jourdan says, allowing researchers to date given geological events by measuring the proportions of Argon 39 and Argon 40 in a sample.

He said this “Argon-Argon” method works by heating the sample with a LASER, releasing the argon which is then measured on the mass spectrometer.

As a result they are able to attribute the giant basalt plane to a 137 million-year-old lava flow.

Why then did the lava form what appears to be millions of tall basalt columns in modern day Bunbury, packed tightly together?

A/Prof Jourdan says the lava cooled rapidly when exposed to the atmosphere similar to how mud shrinks and cracks on contact with the air.

Note: The above post is reprinted from materials provided by Science Network WA.

Microbes make tubular microtunnels on Earth and perhaps on Mars

Microbes make tubular-GeologyPage
Figure 6 from Nikitczuk et al. Credit: GSA Bulletin and Nikitczuk et al.

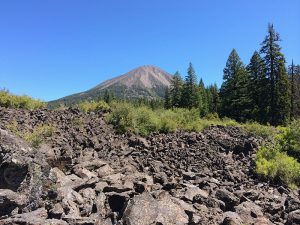
Tubular microtunnels believed to be the trace fossils formed by microbes inhabiting volcanic rock interiors have only been reported in oceanic and subglacial settings. This is the first observation of such features in basaltic volcanic glass erupted in a continental lake environment, the Fort Rock volcanic field.

As a result, the record of subsurface microbial activity in the form of endolithic microborings is prospectively expanded. Our understanding of the range of environments and conditions that microtunnels can form in is enhanced along with our knowledge of potentially habitable environments on Earth and beyond.

The Fort Rock volcanic field has analogous characteristics to locations found on Mars such as Gale and Gusev crater. The presence of these features in this new geologic setting may suggest that subsurface microbes or evidence thereof, if present on Mars, could exist nearer to the surface than previously thought. This knowledge can thus aid future Mars missions (e.g., Mars 2020 Project) with goals that include searching out biosignatures and finding suitable rocks for sample return.

Reference:
Candidate microbial ichnofossils in continental basaltic tuffs of central Oregon, USA: Expanding the record of endolithic microborings, M.P.C. Nikitczuk et al., Department of Earth Sciences, Brock University, 1812 Sir Isaac Brock Way, St. Catharines, Ontario L2S 3A1, Canada. This article is Open Access online at http://gsabulletin.gsapubs.org/content/early/2016/04/20/B31380.1.abstract.

Note: The above post is reprinted from materials provided by Geological Society of America.

How much does groundwater contribute to sea level rise?

Representative Image

Groundwater extraction and other land water contribute about three times less to sea level rise than previous estimates, according to a new study published in the journal Nature Climate Change. The study does not change the overall picture of future sea level rise, but provides a much more accurate understanding of the interactions between water on land, in the atmosphere, and the oceans, which could help to improve future models of sea level rise.

“Projecting accurate sea level rise is important, because rising sea level is a threat to people who live near the ocean and in small islands,” explains IIASA researcher Yoshihide Wada, who led the study. “Some low-lying areas will have more frequent flooding, and very low-lying land could be submerged completely. This could also damage substantially coastal infrastructure.”

Sea level has risen 1.7 mm per year over the 20th and the early 21st century, a trend that is expected to continue as climate change further warms the planet. Researchers have attributed the rising seas to a combination of factors including melting ice caps and glaciers, thermal expansion (water expands as it gets warmer), and the extraction of groundwater for human use.

Land water contributions are small in comparison to the contribution of ice melt and thermal expansion, yet they have been increasing, leading to concerns that this could exacerbate the problem of sea level rise caused by climate change.

However, much uncertainty remains about how much different sources contribute to sea level rise. In fact, sea level has actually risen more than researchers could account for from the known sources, leading to a gap between observed and modeled global sea-level budget.

Previous studies, including estimates used in the IPCC Fifth Assessment Report, had assumed that nearly 100% of extracted groundwater ended up in the ocean. The new study improves on previous estimates by accounting for feedbacks between the land, ocean, and atmosphere. It finds that number is closer to 80%. That means that the gap between modeled and observed sea level rise is even wider, suggesting that other processes are contributing more water than previously estimated.

“During the 20th century and early 21st century, cumulative groundwater contribution to global sea level was overestimated by at least 10 mm,” says Wada. In fact, the new study shows that from 1971 to 2010, the contribution of land water to global sea level rise was actually slightly negative — meaning that more water was stored in groundwater and also due to reservoir impoundment behind dams. From 1993 to 2010, the study estimates terrestrial water as contributing positive 0.12 mm per year to sea level rise.

The study does not change the fact that future groundwater contribution to sea level will increase as groundwater extraction increases. And the increasing trend in groundwater depletion has impacts beyond sea level rise. Wada explains, “The water stored in the ground can be compared to money in the bank. If you withdraw money at a faster rate than you deposit it, you will eventually start having account-supply problems. If we use groundwater unsustainably, in the future there might not be enough groundwater to use for food production. Groundwater depletion can also cause severe environmental problems like reduction of water in streams and lakes, deterioration of water quality, increased pumping costs, and land subsidence.”

Reference:
Yoshihide Wada, Min-Hui Lo, Pat J.-F. Yeh, John T. Reager, James S. Famiglietti, Ren-Jie Wu, Yu-Heng Tseng. Fate of water pumped from underground and contributions to sea-level rise. Nature Climate Change, 2016; DOI: 10.1038/NCLIMATE3001

Note: The above post is reprinted from materials provided by International Institute for Applied Systems Analysis.

Rainbow Sediment Stratum, Oued Metlili Ghardaia, Algeria

Rainbow Sediment
Rainbow Sediment

It’s Outcrop of sedimentary rocks of the Albian “Early Cretaceous”.

Metlili is a town and commune, and capital of Métlili District, in Ghardaïa Province, Algeria.

Metlili lies at an elevation of about 500 metres (1,600 ft) in a valley running from northwest to southeast between arid, rocky hills. The town is about 12 kilometres (7.5 mi) from end to end, but only about 0.5 kilometres (0.31 mi) wide.

Photos

Newly discovered baby Titanosaur sheds light on dinosaurs’ early lives

Newly discovered baby Titanosaur-GeologyPage
A sculpture of the baby Rapetosaurus shows its approximate size in life. Credit: Kristi Curry Rogers

Long-necked sauropod dinosaurs include the largest animals ever to walk on land, but they hatched from eggs no bigger than a soccer ball.

A lack of young sauropod fossils, however, has left the earliest lives of these giants shrouded in mystery. Did they require parental care after hatching like some other dinosaurs, or were they self-reliant?

Research funded by the National Science Foundation (NSF) and led by Kristi Curry Rogers of Macalester College in St. Paul, Minnesota, sheds the first light on the life of a young Rapetosaurus, a titanosaurian sauropod buried in the Upper Cretaceous Maevarano Formation of Madagascar.

The findings are published today in the journal Science.

Active at birth

The baby behemoths were active, capable of a wider array of maneuvers than adult members of their species, and didn’t need parental care after hatching.

“These scientists employed several lines of evidence to investigate growth strategies in the smallest known post-hatching sauropod dinosaur,” said Judy Skog, a program director in NSF’s Division of Earth Sciences, which funded the research along with NSF’s Division of Environmental Biology.

Skog said the researchers developed tests that could be applied to other perinatal dinosaurs.

“It’s intriguing that these animals developed quickly to function on their own, much like some birds and herding mammals of today,” she said.

The preserved partial skeleton was so small that its bones were originally mistaken for those of a fossil crocodile, said Curry Rogers.

“This baby’s limbs at birth were built for its later adult mass; as an infant, however, it weighed just a fraction of its future size,” Curry Rogers said. “This is our first opportunity to explore the life of a sauropod just after hatching, at the earliest stage of its life.”

Along with researchers Megan Whitney of the University of Washington, Mike D’Emic of Adelphi University, and Brian Bagley of the University of Minnesota, the team studied thin-sections of the tibia and used a high-powered CT scanner to get a closer look at the microstructures preserved inside the limb bones.

Microscopic bone features

The detailed microscopic features of the Rapetosaurus bones revealed patterns similar to those of living animals and made it possible for the scientists to reconstruct the beginning of the dinosaur’s post-hatching life.

“We looked at the preserved patterns of blood supply, growth cartilages at the ends of limb bones, and at bone remodeling,” Curry Rogers said. “These features indicate that Rapetosaurus grew as rapidly as a newborn mammal and was only a few weeks old when it died.”

The tiny titanosaur was mobile at hatching and less reliant on parental care than other animals. Baby sauropods like Rapetosaurus were somewhat like miniature adults, Curry Rogers said.

The team also observed microscopic zones deep within the bones. They proved similar to the hatching lines in today’s reptiles, and to neonatal growth lines in extant mammals.

The zones indicate the time of hatching in Rapetosaurus, and allowed the scientists to estimate the weight of the newly hatched Rapetosaurus — around 7.7 pounds.

Demise in a drought

What caused the demise of this baby Rapetosaurus?

Clues came from its cartilage growth plates, which bear a striking resemblance to the modified growth cartilages that occur during starvation among living vertebrates.

When taken in the context of the intensely drought-stressed ecosystem represented in the Maevarano Formation, it’s clear that this Rapetosaurus had it rough, Curry Rogers said.

“Between its hatching and death just a few weeks later,” she said, “this baby Rapetosaurus fended for itself in a harsh and unforgiving environment.”

Video

Reference:
K. Curry Rogers, M. Whitney, M. DEmic, B. Bagley. Precocity in a tiny titanosaur from the Cretaceous of Madagascar. Science, 2016; 352 (6284): 450 DOI: 10.1126/science.aaf1509

Note: The above post is reprinted from materials provided by National Science Foundation.

Researchers discover fate of melting glacial ice in Greenland

Researchers discover fate-GeologyPage
A team from Rutgers University and the University of Georgia, led by Asa Rennermalm of Rutgers, measures meltwater runoff from the ice sheet margin in Greenland during summer 2013.

Over the past several decades, scientists have observed a significant increase in the melting of glacial land ice on the island of Greenland, spurring concerns about global sea level rise and the long-term effects of atmospheric warming. What has been less clear, however, is what happens to this meltwater once it enters the ocean.

Now, a team of researchers led by faculty at the University of Georgia has discovered the fate of much of the freshwater that pours into the surrounding oceans as the Greenland ice sheet melts every summer. They published their findings today in the journal Nature Geoscience.

“Understanding the fate of meltwater is important, because research has shown that it can carry a variety of nutrients, which may impact biological production in the ocean,” said study co-author Renato Castelao, an associate professor of marine sciences in UGA’s Franklin College of Arts and Sciences. “There is also evidence that large freshwater inputs could alter ocean currents and affect the normal formation of sea ice.”

The researchers created a simulation that tracks meltwater runoff under a variety of atmospheric conditions, and they were surprised to discover that most of the meltwater found off the west coast of Greenland actually originated from ice on the east coast.

“Meltwater from Greenland is directed by the surrounding ocean currents, but its fate depends on when and where the runoff occurs and the wind fields driving ocean currents,” said study co-author Thomas Mote, Distinguished Research Professor of Geography at UGA.

According to the model, wind and ocean currents often transport meltwater around the southern tip of Greenland on a westward journey that can take upward of 60 days. After rounding the tip, the meltwater is largely deposited into the Labrador Sea, an arm of the Atlantic between Canada’s Labrador Peninsula and the east coast of Greenland.

Meltwater originating from the west coast of Greenland, on the other hand, is often kept pinned to the coastline by strong winds, which push it northward toward Baffin Bay.

This isn’t always how meltwater from the Greenland ice sheet disperses, as shifts in the prevailing winds can produce very different effects. But scientists must be aware of these shifts in order to fully understand how meltwater will affect the environment, Castelao said.

“The meltwater that comes from the east coast could have different qualities from the meltwater on the west coast, including different nutrient compositions,” he said. “We need to take the origins of this meltwater into account when we study the effects of ice sheet melt, as it could impact the oceans differently depending on where it comes from.”

And this is a problem that is only going to get worse, said Castelao, citing scientific models that suggest the amount of meltwater runoff from Greenland could more than double before the end of this century.

“We need to pay careful attention to where melt and runoff is occurring and how it interacts with surrounding ocean currents, in addition to measuring the total amount of melt,” said Mote.

Other researchers working on this project include Hao Luo and Patricia Yager from UGA’s department of marine sciences; Asa Rennermalm, Rutgers University; Marco Tedesco, Columbia University; and Annalisa Bracco, Georgia Institute of Technology.

Reference:
Hao Luo, Renato M. Castelao, Asa K. Rennermalm, Marco Tedesco, Annalisa Bracco, Patricia L. Yager & Thomas L. Mote, Oceanic transport of surface meltwater from the southern Greenland ice sheet. DOI:10.1038/ngeo2708

Note: The above post is reprinted from materials provided by University of Georgia.

Volcanic Lightning Could Aid Hazard Response During Eruptions

Volcanic Lightning Could -GeologyPage
A volcanic ash plume dwarfs the city of Puerto Montt in southern Chile just after the start of the eruption of Calbuco volcano on 22 April 2015. The radially expanding umbrella cloud is clearly visible, with ash moving in different directions due to wind shear. Credit: Carolina Barría Kemp, CC BY-SA 2.0

In the evening of 22 April 2015, Calbuco volcano began to erupt, forcing more than 6500 nearby residents to evacuate. For several days, ash ejected by the eruption disrupted air travel and damaged buildings in Chile, Argentina, and Uruguay. Calbuco is a 2015-meter stratovolcano located in southern Chile, and before 2015, it hadn’t erupted since 1972. Its last major eruption in 1961 also produced an ash plume. Now, researchers have used satellite and lightning data to reconstruct the 2015 eruption and its behavior.

Van Eaton et al. used data from the Geostationary Operational Environmental Satellite 13 (GOES 13) to track the growth of the ash-rich “umbrella cloud” that reached several kilometers above the volcano. The plume dispersed to the north and northeast, depositing a total of about 0.5 cubic kilometer of ash.

The eruption also caused more than 1000 cloud-to-ground lightning flashes. The researchers investigated the timing and location of the strokes using data from the World Wide Lightning Location Network, which employs ground sensors to detect lightning’s electromagnetic signals.

The scientists found a sharp increase in lightning flashes close to Calbuco just after the formation of pyroclastic density currents (PDCs)—destructive flows of ash, gas, and other volcanic debris that swept down the flanks of the mountain. On the basis of thermodynamic modeling, the authors propose that the intensified lightning was triggered by an electrical charge layer created by the PDCs.

The intensified lightning and formation of PDCs also coincided with the end of upwind growth of the ash umbrella—that is, the radial expansion of the umbrella cloud in the upwind direction (pictured in this animation; upwind direction is lower left). During eruptions of similar volcanoes, the researchers speculate, these combined observations could be used as a signal that PDCs have formed.

The team also found that certain changes in volcanic lightning and plume dynamics corresponded to the eruption’s start time, duration, and material ejection rate. For similar eruptions, such changes could be used to predict ash dispersal and minimize hazards to nearby communities and infrastructure.

Reference:
Alexa R. Van Eaton, Álvaro Amigo, Daniel Bertin, Larry G. Mastin, Raúl E. Giacosa, Jerónimo González, Oscar Valderrama, Karen Fontijn, Sonja A. Behnke,Volcanic lightning and plume behavior reveal evolving hazards during the April 2015 eruption of Calbuco volcano, Chile. DOI: 10.1002/2016GL068076

Note: The above post is reprinted from materials provided by Eos/American Geophysical Union. The original article was written by Sarah Stanley.

Speedy bridge repair: Engineers develop process to repair earthquake-damaged bridge

Speedy bridge repair-GeologyPage
CREDIT: Dan Hixson/University of Utah College of Engineering

In just 30 seconds, a devastating earthquake like the ones that struck Japan and Ecuador can render a city helpless. With roadways split and bridges severely damaged, residents and emergency personnel could be prevented from moving around to rebuild.

Normally, it takes weeks to repair the cracking or spalling of columns on just one bridge damaged in an earthquake. But a team of researchers led by University of Utah civil and environmental engineering professor Chris Pantelides has developed a new process of fixing columns that takes as little as a few days. This process is outlined in a new paper published Thursday, April 28, in the most recent issue of the American Concrete Institute Structural Journal.

“With this design and process, it is much easier and faster for engineers and crews to rebuild a city ravaged by an earthquake so that critical roadways remain open for emergency vehicles,” Pantelides says.

In an earthquake, a bridge is designed to take the brunt of the damage at the top and bottom of the vertical columns where they meet the foundation and the horizontal beams. If a bridge survives from collapsing but the columns are damaged, it is likely too unstable to be driven over. And if several of the steel rebar in the columns have snapped, the bridge likely cannot be repaired at all and must be torn down.

But if the columns can be repaired, engineers typically chip away at the concrete, replace any bent rebar and steel hoops inside and then pour new concrete into a steel cast that’s built around the column. That’s a lengthy process that leaves the bridge unusable for weeks until the repair is finished.

Pantelides’ quicker and more cost-effective process involves creating concrete donuts known as “repairs” that are lined with a composite fiber material built around the bottom and top of each column. The material is a carbon fiber-reinforced polymer made of fibers and resin that is stronger than concrete and steel.

First, a number of steel rebars with heads are drilled into the foundation around the column and secured with an epoxy. Then two halves of a circular shell made of the composite fiber (that are just millimeters thick) are placed around the column and rebar and spliced together. Concrete is poured around the column and over the rebar with the composite fiber acting as a mold. The result is a repaired column with approximately the same structural integrity as the original column, Pantelides says.

“The circular shape gives you the best strength for the amount of material you are using. The stresses are distributed equally all around the periphery,” he says. “With this method, if there are future earthquakes or aftershocks the bridge will survive and damage will happen adjacent to the donut. This gives the bridge a second life.”

The process also could be used to retrofit bridges to make them more earthquake-safe, though it was specifically designed for repair. And it’s not limited to repairing just bridges. The procedure also can be used on damaged columns around a building. Pantelides and his team have filed patents on the process, and he says it can be utilized by construction companies on earthquake-ravaged areas immediately.

The research was funded by the Utah, New York and Texas departments of transportation and the Mountain Plains Consortium. The co-authors of the study are University of Utah civil and environmental engineering doctoral students Joel E. Parks and M.J. Ameli, and Dylan N. Brown, a bridge engineer at Michael Baker International in Madison, Wisconsin.

Note: The above post is reprinted from materials provided by University of Utah .

Origin of Earth’s oldest crystals

Origin of Earth's oldest crystals-GeologyPage
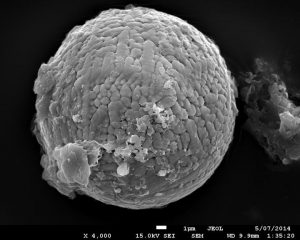
Scanning electron microscope picture of a zircon crystal from the Sudbury crater. Credit: Gavin Kenny, Trinity College Dublin.

New research suggests that the very oldest pieces of rock on Earth — zircon crystals — are likely to have formed in the craters left by violent asteroid impacts that peppered our nascent planet, rather than via plate tectonics as was previously believed. Rocks that formed over the course of Earth’s history allow geologists to infer things such as when water first appeared on the planet, how our climate has varied, and even where life came from. However, we can only go back in time so far, as the only material we have from the very early Earth comes in the form of tiny, naturally occurring zircon crystals.

Naturally then, the origin of these crystals, which are approximately the width of a human hair and more than four billion years old (the Earth being just over four and a half billion years old), has become a matter of major debate. Fifteen years ago these crystals first made headlines when they revealed the presence of water on the surface of the Earth (thought to be a key ingredient for the origin of life) when they were forming.

Ten years ago, a team of researchers in the US1 argued that the ancient zircon crystals probably formed when tectonic plates moving around on the Earth’s surface collided with each other in a similar fashion to the disruption taking place in the Andes Mountains today, where the ocean floor under the Pacific Ocean is plunging under South America.

However, current evidence suggests that plate tectonics — as we know it today — was not occurring on the early Earth. So, the question remained: Where did the crystals come from?

Recently, geologists suggested these grains may have formed in huge impact craters produced as chunks of rock from space, up to several kilometres in diameter, slammed into a young Earth. To test this idea, researchers from Trinity College Dublin decided to study a much younger impact crater to see if zircon crystals similar to the very old ones could possibly have formed in these violent settings.

In the summer of 2014, with the support of the Irish Reseach Council (IRC) and Science Foundation Ireland (SFI), the team collected thousands of zircons from the Sudbury impact crater, Ontario, Canada — the best preserved large impact crater on Earth and the planet’s second oldest confirmed crater at almost two billion years old.

After analysing these crystals at the Swedish Museum of Natural History in Stockholm, they discovered that the crystal compositions were indistinguishable from the ancient set.

PhD Researcher in Trinity’s School of Natural Sciences, Gavin Kenny, is first author of the article which explains these findings, and which has just been published in leading international journal, Geology.

He said: “What we found was quite surprising. Many people thought the very ancient zircon crystals couldn’t have formed in impact craters, but we now know they could have. There’s a lot we still don’t fully understand about these little guys but it looks like we may now be able to form a more coherent story of Earth’s early years — one which fits with the idea that our planet suffered far more frequent bombardment from asteroids early on than it has in relatively recent times.”

Gavin Kenny recently travelled to the annual Lunar and Planetary Science Conference (LPSC) in Houston, Texas, to present these findings to the space science community.

He added: “There was a lot of enthusiasm for our findings. Just two years ago a group2 had studied the likely timing of impacts on the early Earth and they suggested that these impacts might explain the ages of the ancient zircons. They were understandably very happy to see that the chemistry of the zircons from the Canadian impact crater matched the oldest crystals known to man.”

Reference:
Kenny GG, Whitehouse MJ, Kamber BS. Differentiated impact melt sheets may be a potential source of Hadean detrital zircon. Geology, 2016 DOI: 10.1130/G37898.1

Note: The above post is reprinted from materials provided by Trinity College Dublin.

Geochemical detectives use lab mimicry to look back in time

Geochemical detectives use-GeologyPage
An illustration of how laboratory techniques can tell scientists like Anat Shahar and her team about how elements such as iron behave under the extreme pressures found in the Earth’s core. Background image courtesy of Vadim Sadovski. Credit: Background image courtesy of Vadim Sadovski. Additional imagery courtesy of Anat Shahar.

New work from a research team led by Carnegie’s Anat Shahar contains some unexpected findings about iron chemistry under high-pressure conditions, such as those likely found in the Earth’s core, where iron predominates and creates our planet’s life-shielding magnetic field. Their results, published in Science, could shed light on Earth’s early days when the core was formed through a process called differentiation—when the denser materials, like iron, sunk inward toward the center, creating the layered composition the planet has today.

Earth formed from accreted matter surrounding the young Sun. Over time, the iron in this early planetary material moved inward, separating from the surrounding silicate. This process created the planet’s iron core and silicate upper mantle. But much about this how this differentiation process occurred is still poorly understood, due to the technological impossibility of taking samples from the Earth’s core to see which compounds exist there.

Seismic data show that in addition to iron, there are “lighter” elements present in the core, but which elements and in what concentrations they exist has been a matter of great debate. This is because as the iron moved inward toward the core, it interacted with various lighter elements to form different alloyed compounds, which were then carried along with the iron into the planet’s depths.

Which elements iron bonded with during this time would have been determined by the surrounding conditions, including pressure and temperature. As a result, working backward and determining which iron alloy compounds were created during differentiation could tell scientists about the conditions on early Earth and about the planet’s geochemical evolution.

The team—including Carnegie’s Jinfu Shu and Yuming Xiao—decided to investigate this subject by researching how pressures mimicking the Earth’s core would affect the composition of iron isotopes in various alloys of iron and light elements. Isotopes are versions of an element where the number of neutrons differs from the number of protons. (Each element contains a unique number of protons.)

Because of this accounting difference, isotopes’ masses are not the same, which can sometimes cause small variations in how different isotopes of the same element are partitioned in, or are “picked up” by, either silicate or iron metal. Some isotopes are preferred by certain reactions, which results in an imbalance in the proportion of each isotope incorporated into the end products of these reactions—a process that can leave behind trace isotopic signatures in rocks. This phenomenon is called isotope fractionation and is crucial to the team’s research.

Before now, pressure was not considered a critical variable affecting isotope fractionation. But Shahar and her team’s research demonstrated that for iron, extreme pressure conditions do affect isotope fractionation.

More importantly, the team discovered that due to this high-pressure fractionation, reactions between iron and two of the light elements often considered likely to be present in the core—hydrogen and carbon—would have left behind an isotopic signature in the mantle silicate as they reacted with iron and sunk to the core. But this isotopic signature has not been found in samples of mantle rock, so scientists can exclude them from the list of potential light elements in the core.

Oxygen, on the other hand, would not have left an isotopic signature behind in the mantle, so it is still on the table. Likewise, other potential core light elements still need to be investigated, including silicon and sulfur.

“What does this mean? It means we are gaining a better understanding of our planet’s chemical and physical history,” Shahar explained. “Although Earth is our home, there is still so much about its interior that we don’t understand. But evidence that extreme pressures affect how isotopes partition, in ways that we can see traces of in rock samples, is a huge step forward in learning about our planet’s geochemical evolution.”

Reference:
“Pressure-dependent isotopic composition of iron alloys” Science, DOI: 10.1126/science.aad9945

Note: The above post is reprinted from materials provided by Carnegie Institution for Science.

Language and earthquakes: Insights in disaster response

Language and earthquakes-GeologyPage
Yangchen Bista, part of a team of 16 locally originating trained field research assistants, interviews a quake survivor in Mustang District of Nepal. The roles taken on by this team included returning to their home districts to identify community members who were available and willing to either be interviewed or tell stories about their experiences. They were also tasked with preserving data and gathering related metadata, and working with two linguistics research assistants at Tribhuvan University in Kathmandu on translation and transcription of selected interviews and narratives. Credit: Kristine Hildebrandt, Department of English Language & Literature, Southern Illinois University Edwardsville; Sienna Craig, Department of Anthropology, Dartmouth College; Geoff Childs, Department of Anthropology, Washington University St Louis; Mark Donohue, College of Asia and the Pacific, Australian National University

The April 2015 Nepal earthquakes caused massive damage. Aid organizations responded to flattened villages, medical emergencies, and food and water shortages. But the 7.8 magnitude quake and aftershocks also traumatized and disrupted the country’s cultures and communities. These elements are harder to see, but play an important role in disaster recovery.

A team of linguists and anthropologists, supported by the National Science Foundation (NSF) Social, Behavioral, and Economic Sciences Directorate, is collaborating with local researchers in three mountain districts in central Nepal to see how people from these areas understood the earthquakes, how they’re rebuilding and how they relate to the lingering threat of extreme environmental disasters.

“We are witnessing how and to what ends people are making choices about rebuilding, and we are also learning very important lessons about the different ways that health and wellbeing—including mental health issues—are articulated in the wake of such an event,” said Geoff Childs, a cultural anthropologist on the faculty of Washington University in St. Louis and a researcher on this project.

Languages under threat of extinction

Nepal, the home of Mount Everest, is a poor, landlocked, mountainous nation that relies heavily on remittances from citizens who work abroad. Its economy also depends on tourism, especially in the Kathmandu Valley, a UNESCO World Heritage Site.

The earthquakes wiped out roads and damaged or destroyed monuments and other sites of rich cultural heritage. Nepal’s government and international aid agencies are working to recover after the physical damage, but the diverse languages of Nepal—especially the minority and endangered ones—may not all survive that process.

Between 100 and 115 distinct languages are spoken within Nepal’s borders. The three districts where the NSF-supported team is working all feature languages, and cultures, under threat of extinction, a situation the quakes exacerbated. Natural disasters can destabilize the linguistic landscape and diversity of an area. Nepal’s earthquake displaced entire populations, and some people may never return to their home villages, just as many residents of New Orleans resettled elsewhere after Hurricane Katrina. That means language can provide researchers with a window into the cultural impacts of these extreme events.

Thus far, the researchers have collected interviews and stories in 11 different Nepalese languages documenting local understanding of the disaster. That information not only provides a rich source of data on the languages themselves, it also helps researchers understand what locals do when a tragedy strikes and why—providing insight that can help policymakers prepare local populations for the next emergency.

“In addition to getting different sociocultural perspectives on questions of causality, we are also revealing knowledge and gaps in knowledge about how and why natural disasters occur from a scientific perspective,” said medical anthropologist Sienna Craig, of Dartmouth College. “What do villagers in Nepal seem to not know that they should about protecting themselves?”

The lens of culture

One issue that can have a profound effect on how people act during an earthquake is the reason they believe it’s happening, according to the researchers. Linguist Kristine Hildebrandt of Southern Illinois University Edwardsville reports that the people with whom the researchers spoke invoked a rich range of causal and cosmological reasons for the quake.

The local people believe earthquakes happen “when things fall out of balance,” Hildebrandt said. “Earthquakes are viewed as karmic payback for too much modernizing or for sin or for taking economic assistance from China.”

These belief systems endanger people’s lives when they lead to unsafe, even fatal, reactions during earthquakes. Understanding these factors can improve local preparations before disaster strikes and can better inform disaster response practices.

The linguistic studies also shed light on how some languages communicate space and motion completely differently than others. English speakers, for example, take directions like “up” and “across,” spatial relationships like “between,” and motion verbs like “walk,” “run” and “saunter,” and encode them into separate words.

Not all languages use that same approach. While researchers have data from Sino-Tibetan languages—a family of languages spoken in East Asia, Southeast Asia and South Asia—the approaches used in many Himalayan languages, including those spoken in Nepal, remain virtually unknown.

“When people talk about first experiencing the earthquake, they go outside and watch landslides happening. They themselves are falling, and things fall over,” Hildebrandt said. “That’s motion. That’s space.”

Collecting data that would show how those languages incorporate such concepts can prove challenging to collect in a natural way, such as by simply asking questions. Researchers therefore may use props or other techniques to elicit the information they need.

The resulting narratives and conversations constitute a rich source of data on the ways endangered languages communicate spatial relationships and motion. This work serves the dual purpose of building the researchers’ understanding of the languages themselves, and helping to provide clues about ways to effectively communicate about earthquake risk and response.

The types of issues the researchers are studying—how the lens of culture affects the way people view disasters, and the effects those catastrophes can have on culture and language—stretch beyond Nepal. Japan and Ecuador are currently recovering from major earthquakes that resulted in loss of life and created significant societal disruption.

The damage to infrastructure in those nations, and in Nepal, is visible. The trauma to the health and wellbeing of survivors is not—but it’s also important, and those social and behavioral factors can influence how quickly and effectively a community repairs its more tangible, physical harms. That makes the work this research team is doing by collecting real-time data on people’s resilience crucial. The insights they generate can help lead to disaster recovery that saves time, money—and, ultimately, lives.

Note: The above post is reprinted from materials provided by National Science Foundation.

Related Articles