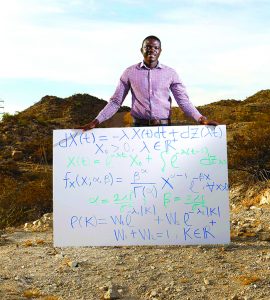
After going through a variety of financial models to find a good fit, Osei Tweneboah zeroed in on one called Ornstein-Uhlenbeck. His modeling will help analyze the effect that earthquakes from long ago have on present and future quakes. Credit: JR Hernandez, UTEP Communications
A UTEP computational science doctoral student has successfully tied a new mathematical modeling process to the study of earthquakes.
“The model that we applied to the earthquake data was originally applied to financial data,” said Osei Tweneboah, who received his master’s degree from UTEP in 2015. “Financial data is high frequency, which means there are a lot of fluctuations in the data. Earthquake data behaves like the financial data.”
After going through a variety of financial models to find a good fit, Tweneboah zeroed in on one called Ornstein-Uhlenbeck. His modeling will help analyze the effect that earthquakes from long ago have on present and future quakes. The hope is for better understanding of how tectonic stress decays and accumulates during long periods of time — and to potentially estimate when an earthquake could happen.
In May, Tweneboah presented his findings in a paper published in the journal Pure and Applied Geophysics.
Reference:
Maria C. Mariani, Osei K. Tweneboah, Hector Gonzalez-Huizar, Laura Serpa. Stochastic Differential Equation of Earthquakes Series. Pure and Applied Geophysics, 2016; 173 (7): 2357 DOI: 10.1007/s00024-016-1292-1
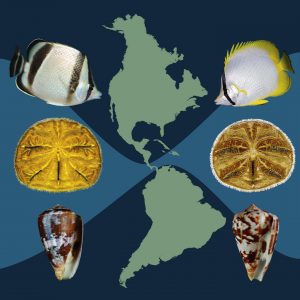
Split by the Isthmus of Panama: Species of butterfly fish, sand dollar and cone snail that today live on the Pacific and Caribbean coasts of Central America are very closely related. Genetic sequencing shows that only 4 to 3 million years ago, each pair was a single species, demonstrating that marine connections between the oceans must have existed until that time. Credit: Simon Coppard, Alexander Medvedev, Ross Robertson, Shellnut, Bob Fenne
Long ago, one great ocean flowed between North and South America. When the narrow Isthmus of Panama joined the continents about 3 million years ago, it also separated the Atlantic from the Pacific Ocean. If this took place millions of years earlier, as recently asserted by some, the implications for both land and sea life would be revolutionary. Aaron O’Dea, staff scientist at the Smithsonian Tropical Research Institute (STRI), and colleagues writing in Science Advances firmly set the date at 2.8 million years ago.
“Recent scientific publications proposing the isolation of the two oceans between 23 to 6 million years ago rocked the generally held model of the continental connection to its foundations,” said Jeremy Jackson, emeritus staff scientist at the Smithsonian. “O’Dea and his team set out to reevaluate in unprecedented, rigorous detail, all of the available lines of evidence — geologic, oceanographic, genetic and ecological data and the analyses that bear on the question of when the Isthmus formed.”
“The timing of the connection between continents and the isolation of the Pacific and Atlantic oceans is important for so many reasons,” O’Dea said. “Estimates of rates of evolutionary change, models of global oceans, the origin of modern-day animals and plants of the Americas and why Caribbean reefs became established all depend upon knowing how and when the isthmus formed.”
The team of researchers from 23 institutions, including nine current or emeritus staff scientists from STRI and the Smithsonian’s National Museum of Natural History and 13 current or previous Smithsonian post-doctoral fellows concluded that records from marine and terrestrial fossils, volcanic and marine rocks and the genes of marine animals split by the formation of the Isthmus all tell the same story. Three key pieces of evidence defined when the land bridge was finally in place:
Analysis of the family trees of shallow-water marine animals such as fish and sand dollars from the Pacific and Caribbean (Atlantic) sides of the isthmus show genetic mixing until after 3.2 million years ago.
Surface waters from the Pacific and Caribbean mixed until about 2.8 million years ago, as seen in deep-ocean sediments.
Massive migrations of land animals between North and South America began sometime before 2.7 million years ago.
The first paper to propose an earlier connection, published by Camilo Montes, professor at the Universidad de los Andes, and STRI staff scientist Carlos Jaramillo in 2015, asserted that tiny particles called zircons found in northern Colombia arrived there 15 million years ago via rivers from the Panama Arc along a land bridge. The authors of the new paper reveal that, in fact, there are several possible sources for these zircons, all of which require less convoluted travel to arrive at their resting place in the Magdalena basin.
The second paper to propose an earlier isthmus by Christine Bacon, post-doctoral fellow at the University of Gothenburg, suggested that molecular data from terrestrial animals and plants corresponded with geographic splits in marine animals, assuming the correspondence must have been due to a land bridge. The new study questions their use of a universal rate of evolution — “different species evolve at different rates” Harilaos Lessios, a coauthor, said. They also question their use of genetic splits for land animals as evidence of the continental connection because “a land bridge would not cause genetic divergence, but would, on the contrary, allow greater genetic mixing between the continents.”
In addition, the new paper mentions that Bacon et al.’s study omitted several important published genetic analyses, which skewed their results and when included, eliminate the main line of evidence that marine and terrestrial events coincided.
The authors concluded, “Our review and new analyses aims to clarify the issue by bringing together expertise from a wide array of different lines of evidence. Given all the available evidence, we strongly caution against the uncritical acceptance of the old isthmus hypothesis.”
Reference:
Jeremy B. C. Jackson et al. Formation of the Isthmus of Panama. Science Advances, August 2016 DOI: 10.1126/sciadv.1600883
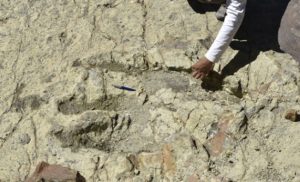
A 1.2-metre diameter footprint of a dinosaur found in Maragua Marka Quila Quila, 64 km northeast of Sucre, Bolivia on August 8, 2016
It’s not easy following in the footsteps of the largest animals ever to roam Earth.
There are no roads or even footpaths to get to the spot in Bolivia where researchers recently discovered a huge dinosaur footprint measuring 1.15 meters (nearly four feet) wide.
But Bolivian paleontologist Omar Medina hopes to turn this remote corner of southern Bolivia into a magnet of paleontology that will attract visitors from around the world.
The enormous footprint, roughly 80 million years old, was discovered last month by local guide Grover Marquina, who specializes in fossil tours.
It was left by an abelisaurid theropod dinosaur, a carnivorous biped that Medina estimates would have been about 15 meters tall.
The size and quality of the print are “impressive—never seen before,” Medina said.
“It allows us to position ourselves as a mecca of paleontology.”
The footprint, which dates to the Late Cretaceous Period, is just the most recent find in Bolivia’s Chuquisaca department, a hot bed of dinosaur fossils.
Visitors can also see dozens of dinosaur footprints that appear to scale the wall of a cliff. They were in fact left when the sheer rock face was flat ground, before the churning of the Earth’s plates turned it upright.
There are also fossils from what may have been the world’s last glyptodon, an enormous armadillo-like animal that lived during the Pleistocene era (11,700 to 2.6 million years ago).
“Every discovery is very important because every fossil we find isn’t just another fossil, it’s an icon for the world,” Medina told AFP.
Today, Chuquisaca sits in the landlocked South American country’s southern highlands, but millions of years ago it was a hot coastal region.
Paleontologists from around South America will visit Chuquisaca in October to study the region’s fossil treasures.
Bolivia is already known for the region’s Cal Orcko Park, one of the world’s largest beds of fossilized footprints, which has more than 10,000 prints left by nearly 300 species of dinosaur.
But Maragua, where Marquina discovered the giant abelisaurid theropod print, is far more remote.
“There are no basic services to bring people here to show them these paleontological riches,” Marquina said.
“We have to blaze a trail.”
Note: The above post is reprinted from materials provided by AFP.
Scientists use the fossil record to make judgments on the physiology and behavior of species. But are those interpretations correct? New research from a team of researchers led by Matthew Ravosa, professor of biology and concurrent professor of both aerospace and mechanical engineering and anthropology at the University of Notre Dame, puts into question how we interpret the behavior of extinct organisms from their fossil remains, and the greater role of plasticity—or the adaptive fine-tuning of the link between anatomy and behavior—in determining evolution diversity.
Marshaling multiple datasets from his lab’s work studying the role of diet on musculoskeletal growth in the mammalian skull and oral cavity, Ravosa pointed out that such long-term plasticity experiments can uniquely inform our understanding of how an anatomical structure functions during an organism’s lifetime in the wild. This in turn greatly enriches our ability to reconstruct the behaviors and lifestyles of extinct organisms. His new study offers several key findings in this regard.
“First, we observed that food mechanical properties have a surprisingly large effect on the development and function of the feeding complex in mammals,” he said. “During postnatal growth, we show that diet-related variation in chewing stresses induces a cascade of changes at the tissue, cellular, protein and genetic levels so as to maintain the integrity of craniomandibular structures involved in food processing. Interestingly, the magnitude of such changes varies from site to site and depends on the level of analysis. Thus, only certain skull bones and measures do a good job of conveying a dietary signal in the fossil record.
“Second, apart from pointing to a considerably greater role for adaptive plasticity in morphological evolution, our research offers novel insight into the limitations of functional interpretations of fossils. Because the palaeontological record largely consists of skeletal remains, we show that failure to account for disparities in the responses of hard versus soft tissues may also result in incorrect characterizations of adaptive changes in extinct mammals.”
“Third, given the long-term nature of our experiments, we are able to demonstrate that an early postnatal onset and protracted duration of a diet-related loading pattern can result in levels of variation in the jaws of a single species on par with that observed between species. Indeed, marked variation in jaw form and function can characterize adult conspecifics that differ solely in age, which greatly complicates palaeontological interpretations of feeding behavior.
“To impart a more naturalistic perspective to our lab-based plasticity studies, we recently modeled seasonal variation in food mechanical properties and altered loading in growing mammals. To track the influence of simulated ‘seasonal’ shifts in diet on plasticity responses in the oral cavity, we performed biweekly imaging of bone formation from weaning through adulthood. These longitudinal analyses show that the morphological effects of dietary ‘seasonality’ is detected at only some cranial sites, which further hinders our ability to accurately reconstruct the biology of fossil organisms represented by fragmentary and singular specimens.”
The study was both multidisciplinary and highly collaborative, involving postdoctoral fellows, research technicians, graduate students and undergraduates who applied modern imaging, cell biological and anatomical approaches.
Surprising as it may seem, the analysis Ravosa is performing on evolutionary processes can offer insights into conditions besetting us today, such as joint disease.
“Our experiments track connective tissue responses in animal models that exhibit similar feeding behaviors and patterns of bone growth as humans,” Ravosa said. “The long-term nature of this experimental research also informs us about postnatal bone formation, which is remarkably pronounced and quite variable between skeletal sites. Due to a focus on joint hard and soft tissues, we have been able to detail the coordinated responses of bone and cartilage subjected to altered stresses, much as occurs during an organism’s lifetime. This long-term, integrative perspective allows us to gain considerable insight into the onset and progression of joint diseases, implicating specific tissues and patterns of protein expression during aging.”
Reference:
Matthew J. Ravosa et al. Limitations of a morphological criterion of adaptive inference in the fossil record, Biological Reviews (2015). DOI: 10.1111/brv.12199
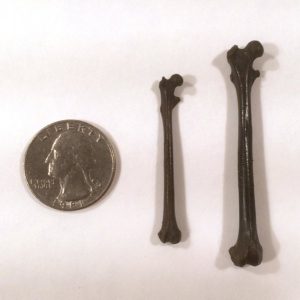
These are fossilized bones found in a coal mine in Gujarat, India. A femur bone from Marcgodinotius, an adapoid, left; a femur bone from Vastanomys, an omomyid, right. A US quarter is shown for size. Credit: Johns Hopkins Medicine
A cache of exquisitely preserved bones, found in a coal mine in the state of Gujarat, India, appear to be the most primitive primate bones yet discovered, according to an analysis led by researchers from The Johns Hopkins University and Des Moines University. Their assessment of the bones, belonging to ancient, rat-sized, tree-dwelling primates, bolsters the controversial idea that primates native to what is now India played an important role in the very early evolution of primates, mammals that include humans, apes and monkeys.
A description of the research was published online Aug. 7 in the Journal of Human Evolution.
“All other primate bones found so far around the world clearly belong to one or the other of the two primate groups, called clades: Strepsirrhini and Haplorhini,” says Kenneth Rose, Ph.D., professor emeritus in the Center for Functional Anatomy and Evolution at the Johns Hopkins University School of Medicine. “But many of the Gujarat bones show features that do not clearly belong to one clade or the other.”
According to Rose and lead author Rachel Dunn, Ph.D., an assistant professor of anatomy at Des Moines University, this suggests that the little primates represent a very early stage of primate evolution. That idea is counterintuitive, they say, because older primate fossils exist that show more specialized features, but they add that that situation is fairly common in the fossil record.
At the beginning of the Eocene Epoch, about 56 million years ago, the world was warming, encouraging the dispersal of mammals between northern continents. The oldest known primate fossils found appeared around then in North America, Europe and northern Asia, but they can already be categorized as either adapoids or omomyids, the most primitive members of Strepsirrhini and Haplorhini, respectively. Adapoids were relatives of current day lemurs, lorises and bushbabies, while omomyids were more closely related to living tarsiers, monkeys and apes.
The newly discovered group of 25 tiny bones, all from somewhere below the neck of the animals, are younger — some 54.5 million years old — but considerably more primitive than the oldest known primate fossil, Teilhardina, which first appears in deposits at the beginning of the Eocene, almost 56 million years old. They are also more primitive than a relatively complete skeleton of the primate Archicebus, found recently in China and dated to about 55 million years ago.
Their analysis, Rose says, suggests the Gujarat primates are close descendants of the common ancestor that gave rise to the adapoids and omomyids found on the northern continents. But the Gujarat primates date back to a time when what is now India was a drifting land mass — isolated from the northern continents and inching its way toward southern Asia.
“These are the best preserved and most primitive bones we have from the first 5 million years of primate evolution, but there’s not enough evidence currently for us to figure out when these primates reached India or where they came from,” says Rose. “They are similar enough to the early primates found on the northern continents to indicate that their ancestors migrated between the northern continents and what is now India — but in which direction isn’t clear.”
Rose says there are several possible scenarios to explain what they’ve suggested, but all his team can say with high confidence now is that the tiny primates occupied equatorial India prior to its collision with Asia.
Even though the researchers don’t have enough bones to reconstruct a whole skeleton, the bones weren’t embedded in rock so they could be thoroughly examined from every angle, providing insights into the evolution of primate anatomy.
Their analysis is that the Gujarat primates were adapted for climbing the tall dipterocarp trees of ancient rainforests but were less specialized than present-day leaping lemurs or slow-climbing lorises. Their limbs and joints suggest more generalized climbing, as in present-day mouse lemurs and dwarf lemurs.
Because of such features, Rose and his colleagues aren’t sure which clade some of the bones belonged to, suggesting that they represent the most primitive primate anatomy known. But a few of the bones do show the beginnings of features that would later distinguish the clades, like deep grooves where the thigh bone connects to the knee, which helps animals like lemurs to leap. Rose believes it’s possible that differences in hind limb-based movement led to the primates’ divergence into two clades.
Previously discovered teeth and jaws of these tiny animals suggest that these primates were also close to mouse lemurs and dwarf lemurs in size, about 150 to 300 grams in weight, or 0.5 pounds. Considered together with their generalized anatomy, the small size of the Gujarat primates is likely another primitive trait, with future primates tending to increase in size.
“Considering everything together, we think the most likely scenario is that more primitive primates arrived in what is now India and retained their primitive, generalized skeleton, while their relatives on the northern continents continued to evolve,” says Rose. “Hopefully future skeleton finds will make it all clearer.”
Reference:
Rachel H. Dunn, Kenneth D. Rose, Rajendra S. Rana, Kishor Kumar, Ashok Sahni, Thierry Smith. New euprimate postcrania from the early Eocene of Gujarat, India, and the strepsirrhine–haplorhine divergence. Journal of Human Evolution, 2016; 99: 25 DOI: 10.1016/j.jhevol.2016.06.006
The evolution of the first land plants including mosses may explain how Earth’s atmosphere became enriched with oxygen.
The evolution of the first land plants including mosses may explain a long-standing mystery of how Earth’s atmosphere became enriched with oxygen, according to an international study led by the University of Exeter.
Oxygen in its current form first appeared in Earth’s atmosphere some 2.4 billion years ago, in an incident known as the Great Oxidation Event. However, it was not until roughly 400 million years ago that this vital compound first approached modern levels in the atmosphere. This shift steered the trajectory of life on Earth and researchers have long debated how oxygen rose to modern concentrations.
In a study published in the journal Proceedings of the National Academy of Sciences, Professor Tim Lenton, of the University of Exeter, and his colleagues theorised that the earliest land plants, which colonised the land from 470 million years ago onwards, are responsible for the levels of oxygen that sustains our lives today. Their emergence and evolution permanently increased the flux of organic carbon into sedimentary rocks, the primary source for atmospheric oxygen, thus driving up oxygen levels in a second oxygenation event and establishing a new, stable oxygen cycle.
Earth’s early plant biosphere consisted of simple bryophytes, such as moss, which are non-vascular — meaning they do not have vein-like systems to conduct water and minerals around the plant. Using computer simulations, the researchers first estimated that these plants could have generated roughly 30% of today’s global terrestrial net primary productivity by about 445 million years ago.
When the properties of modern bryophytes were taken into account, including their elemental composition and effects on rock weathering, they found that modern levels of atmospheric oxygen were achieved by 420 to 400 million years ago, consistent with independent evidence.
These findings therefore suggest that the first land plants, such as the humble moss, created the stable oxygen-rich atmosphere that allowed large, mobile, intelligent animal life, including humans, to evolve.
Professor Tim Lenton, of the University of Exeter, said: “It’s exciting to think that without the evolution of the humble moss, none of us would be here today. Our research suggests that the earliest land plants were surprisingly productive and caused a major rise in the oxygen content of Earth’s atmosphere.”
Reference:
Timothy M. Lenton, Tais W. Dahl, Stuart J. Daines, Benjamin J. W. Mills, Kazumi Ozaki, Matthew R. Saltzman, Philipp Porada. Earliest land plants created modern levels of atmospheric oxygen. Proceedings of the National Academy of Sciences, 2016; 201604787 DOI: 10.1073/pnas.1604787113
A researcher at Ben-Gurion University of the Negev (BGU) has identified that the eastern Mediterranean Sea contains the world’s oldest oceanic crust still in place and could be almost 340 million years-old.
The study reported in Nature Geoscience was conducted by Dr. Roi Granot, a senior lecturer in the BGU Department of Geology and Environmental Sciences.
Some of the fundamental tectonic characteristics of the eastern Mediterranean remain unresolved due to the extremely thick sedimentary cover (10 to 15 km) and the lack of accurate magnetic anomaly data. The researchers towed magnetic sensing equipment to collect 7,000 km (4,300 miles) of marine magnetic profiles across the Herodotus and Levant Basins, eastern Mediterranean, to study the nature and age of the underlying igneous crust.
Dr. Granot used the magnetic data to analyze the nature of the crust in the Herodotus Basin, and found that the rocks are characterized by magnetic stripes — the hallmark of oceanic crust formed at a mid-ocean ridge. As magma at a mid-ocean ridge axis cools, magnetization of the minerals in the newly forming rocks align with the direction of Earth’s magnetic field.
“Changes in the magnetic field’s orientation over time are recorded in the ocean floors, creating a unique barcode that provides a time stamp for crust formation,” Dr. Granot says. “The results shed new light on the tectonic architecture and evolution of this region and have important implications on various geodynamic processes.”
By using this principle and identifying skewed patterns in the magnetic stripes, Dr. Granot showed that the oceanic crust in the Herodotus Basin could be as much as 340 million years old.
Oceanic crust is typically recycled back into Earth’s mantle relatively rapidly at subduction zones due to its high density, thus most oceanic crust is less than 200 million years old.
“The area is covered by thick sedimentary coverage, making it unclear precisely how old the crust is and whether it is even oceanic at all,” Dr. Granot says. With the new geophysical data, we could make a big step forward in our geological understanding of the area.”
He suggests that the crust might be a remnant of the ancient Tethys Ocean, which existed long before the Atlantic and Indian Oceans. If correct, this implies the ocean formed much earlier than previously thought.
Reference:
Roi Granot. Palaeozoic oceanic crust preserved beneath the eastern Mediterranean. Nature Geoscience, August 2016 DOI: 10.1038/ngeo2784
Researchers at the Moscow Institute of Physics and Technology (MIPT) have developed mathematical models and software enabling Russian shale oil producers to reduce development costs. Multiple hydraulic fracturing (aka hydrofracking) is a standard shale oil extraction technique.
It involves the high-pressure injection of fluid into a horizontal borehole. The fluid used is typically water with sand or other specially designed additives (called proppants). The rock formation is first fractured by water, allowing oil to flow freely into the borehole. When the pressure is released, the fractures are held open by the proppant. This speeds up oil extraction and increases production output. However, this technique relies on preliminary calculations; if these are ignored, enormous financial losses could result.
In multiple hydrofracking, the precise manner in which fractures are formed (their shape, aperture, and geometry) is determined based on very complex calculations that predict how rock will respond to stress. These predictions belong, scientifically speaking, to the domain of material failure theory. Currently, rock mechanics offers no unified theory to describe the process of material failure.
For this reason, predicting the behavior of hydraulically fractured rock is a challenging task. Failing to correctly predict crack propagation and rock failure can lead to well flooding or disturbance of the gas layer. In both cases, development costs far exceed the revenue. To simulate the behavior of fractured rock and thus eliminate potential risks, computer modelling is normally used.
The restrictions imposed on Russian oil-related services by the E.U. and the U.S. in 2014, along with the main Western sanctions package, included the prohibition of the export of specialized software to Russia. Thus, there were no alternatives to this software available on the Russian market. In view of this, experts have predicted that any shale oil projects in Russia would become unprofitable, which in turn would damage the oil industry as a whole.
The MIPT researchers succeeded in designing the necessary software, which is unlike that offered by Western competitors. Focusing on industrial applications, MIPT cooperated with the Gazpromneft Scientific and Technical Centre, a Gazpromneft subsidiary.
Ivan Zavialov and Natalia Zavialova, researchers at the Department of Applied Mechanics of Moscow Institute of Physics and Technology talked about the benefits of the software: “Based on mathematical calculations, our software suite tells you how fractures will affect each other and what their propagation trajectories will be. It predicts new physical properties acquired by the fractured rock formation. In hydrofracking, it is necessary to make sure that the formation of a new fracture does not cause compression of a previously formed fracture. This maximizes oil recovery.”
Using the data obtained with the help of MIPT’s simulator, oil company engineers can model multiple hydraulic fracturing solutions for any oilfield. This technology will ensure maximum profitability of the Russian businesses that work with unconventional oil (classified as “hard-to-recover” in Russia), while minimizing the associated environmental risks. Perhaps it could even make Russia a leading producer of shale oil.
Artistic reconstruction of a pod of Arktocara yakataga, swimming offshore of Alaska during the Oligocene, about 25 million years ago, with early mountains of Southeast Alaska in the background. The authors speculate that Arktocara may have socialized in pods, like today’s oceanic dolphins, while possessing a much longer snout, like its closest living relative in the freshwater rivers of South Asia. Credit: Linocut print art by Alexandra Boersma
A fossil that has been in the collection of the Smithsonian’s National Museum of Natural History since it was discovered in 1951 is today helping scientists piece together the evolutionary history of whales and dolphins, including the origins of the endangered South Asian river dolphin.
According to Nicholas D. Pyenson, the museum’s curator of fossil marine mammals, and Alexandra Boersma, a researcher in his lab, the fossil belonged to a dolphin that swam in subarctic marine waters around 25 million years ago. It represents a new genus and species, which Pyenson and Boersma have named Arktocara yakataga.
The researchers reported their findings Aug. 16 in the journal PeerJ. They have also produced a digital three-dimensional model of the fossil that can be explored at http://3d.si.edu/model/usnm214830.
The fossil, a partial skull about 9 inches long, was discovered in southeastern Alaska by Donald J. Miller, a geologist with the United States Geological Survey. It then spent decades in the Smithsonian’s collection. With more than 40 million specimens in the museum’s Department of Paleobiology, “We are always learning new things about the vast legacy built by our predecessors at the museum,” Pyenson said. But earlier this year, he and Boersma were captivated by and focused their attention on what Boersma calls “this beautiful little skull from Alaska.”
By studying the skull and comparing it to those of other dolphins, both living and extinct, Boersma determined that A. yakataga is a relative of the South Asian river dolphin Platanista, which is the sole surviving species of a once large and diverse group of dolphins. The skull, which is among the oldest fossils ever found from that group, called Platanistoidea, confirms that Platanista belongs to one of the oldest lineages of toothed whales still alive today.
The South Asian river dolphin—a species that includes both the Ganges river dolphin and the Indus river dolphin—is of great interest to scientists. It is an unusual creature that swims on its side, cannot see and uses echolocation to navigate murky rivers in Nepal, India, Bangladesh and Pakistan. Unlike its known ancestors, it lives only in fresh water. But human activities, including the use of fishing nets, pollution and disruption of it’s habitat, have decimated the species to only a few thousand remaining individuals. The group’s endangered status makes the dolphins difficult to study.
“One of the most useful ways we can study Platanista is by studying its evolutionary history, by looking at fossils that are related to it to try to get a better sense of where it’s coming from,” Boersma said. “Exactly how that once diverse and globally widespread group dwindled down to a single species in Southeast Asia is still somewhat a mystery, but every little piece that we can slot into the story helps.”
Based on the age of nearby rocks, the scientists estimate that the Arktocara fossil comes from the late Oligocene epoch, around the time ancient whales diversified into two groups—baleen whales (mysticetes) and toothed whales (odontocetes).
“It’s the beginning of the lineages that lead toward the whales that we see today,” Boersma said. “Knowing more about this fossil means that we know more about how that divergence happened.”
Fossils from Platanista’s now extinct relatives have been found in marine deposits around the world, but the Arktocara fossil is the northernmost find to date. The name of the new species highlights its northern habitat: Arktocara is derived from the Latin for “the face of the north,” while yakataga is the indigenous Tlingit people’s name for the region where the fossil was found.
“Considering the only living dolphin in this group is restricted to freshwater systems in Southeast Asia, to find a relative that was all the way up in Alaska 25 million years ago was kind of mind-boggling,” Boersma said.
Pyenson notes that some conservation biologists argue that the South Asian river dolphin should be prioritized for protection to preserve its evolutionary heritage. “Some species are literally the last of a very long lineage,” he said. “If you care about evolution, that is one basis for saying we ought to care more about the fate of Platanista.”
Chesapeake Testing provided X-ray scanning and support for digital-image processing. Materialise provided technical support with 3-D model rendering.
Reference:
Boersma and Pyenson (2016). Arktocara yakataga, a new fossil odontocete (Mammalia, Cetacea) from the Oligocene of Alaska and the antiquity of Platanistoidea. PeerJ. 4:e2321; DOI: 10.7717/peerj.2321
Scientists are using the new Geoscience Atom Probe Facility at Curtin University to study mineral deposits containing locked resources of gold in refractory ores.
Curtin WA School of Mines Research Associate in Applied Geology Dr Denis Fougerouse and fellow researchers have found metallic gold nanoparticles only a few nanometres in diameter within the mineral arsenopyrite – a common mineral found in Australian mines.
Dr Fougerouse said the study was believed to be one of the first of its kind, and the discovery challenges the understanding of nanoparticle formation and allowed the team to establish the main controls on gold incorporation in sulphides.
“The application of atom probe microscopy in geosciences is relatively new. The technique is based on field-evaporation of atoms from tiny, needle-shaped specimens to provide three dimensional sub-nanometre scale information of the position and type of individual atoms in the specimen in the mineral,” Dr Fougerouse said.
“Typically, the amount of material analysed is really, really small – a single grain of salt is over a billion times larger than a typical analysis.”
Dr Fougerouse explained large resources of these nanoparticles are ‘locked’ in gold-bearing arsenopyrite, an iron arsenic sulphide, which can be found in mines across the world.
“Arsenopyrite is a very common mineral found in Australian and other mines, and although not every arsenopyrite contains gold, it is common to find gold locked inside this mineral,” he said.
“Our results show that gold can be hosted either as nanoparticles or as individual atoms in different parts of the crystal structure, and the different types of gold yield important information about the controls on gold deposition as the ore body forms.”
Dr Fougerouse explained this study demonstrated the capability of atom probe microscopy in geosciences.
“Our research shows the Geoscience Atom Probe has potential to characterise gold deposition processes at the atomic level. In turn this could help unlock hidden gold resources in known deposits, and will enhance gold recovery,” Dr Fougerouse said.
“Nanogeoscience is a new, but rapidly growing research field. Through this research and use of the Geoscience Atom Probe, we can show that tiny observations can yield big results that have potential economic importance.”
Research from the Curtin WA School of Mines has led scientists to believe that volcanic eruptions that occurred more than 100 million years ago were so powerful that they could project sand-sized crystals from the east coast of Australia to as far away as Western Australia.
The study, led by Dr Milo Barham of the Department of Applied Geology, originally set out to examine WA grains to find out how the southern margin of Australia evolved during and after separation from Antarctica. However, the work took on a new direction after the discovery of sand-sized zircon crystals unlike any previously found in WA.
Using advanced geochemical fingerprinting of individual crystals, as well as in-depth analysis of the sediments and their fossils (for the age and original environment of the deposit), Dr Barham and his colleagues were able to deduce that the crystals found in WA were the products of volcanic air fall — despite being 2300km away from the remnants of their source volcanoes in eastern Australia.
Dr Barham said the grains, which were sourced from boreholes drilled beneath the Nullarbor Plain in remote south-eastern WA, implied the occurrence of super-eruptions — extremely explosive events with magnitudes tens to hundreds of times greater than anything in documented human history.
“Such distal projection of a unique volcanic mineral population demonstrates that super-eruptions were occurring in eastern Australia approximately 106 million years ago, during the break-up of the supercontinent Gondwana,” Dr Barham said.
“The arrangement of land masses and atmospheric circulation at the time indicates that the recorded eruptions occurred during the southern hemisphere winter, when strong winds from the east would have pushed volcanic ejecta towards the west.”
Dr Barham said these super-eruptions were capable of spreading tera-tonnes of volcanic material over thousands of kilometres, while affecting global climate systems.
“These super explosions are well known from the relatively recent past and have even been implicated in the evolution of our species,” Dr Barham said.
“However, the incomplete nature of geological sequences means that recognising these earth-shattering volcanic events is difficult in deeper geological time, millions to billions of years ago.
“If an event of this magnitude were to happen today it would have devastating effects on our society and likely would drive massive crop failures, famine and war.”
The new study has been published in the August 2016 edition of the journal, Geology.
Reference:
M. Barham, C.L. Kirkland, M.J. O’Leary, N.J. Evans, H. Allen, P.W. Haines, R.M. Hocking, B.J. McDonald, E. Belousova and J. Goodall. The answers are blowin’ in the wind: Ultra-distal ashfall zircons, indicators of Cretaceous super-eruptions in eastern Gondwana. DOI: 10.1130/G38000.1
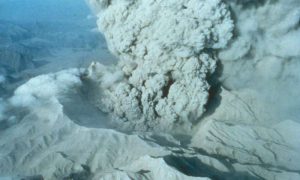
Mount Pinatubo’s 1991 eruption and its effects masked sea level rise. Credit: USGS
The cataclysmic 1991 eruption of Mount Pinatubo in the Philippines masked the full impact of greenhouse gases on accelerating sea level rise, according to a new study.
“These scientists have disentangled the major role played by the volcanic eruption of Mount Pinatubo on trends in global mean sea level,” said Anjuli Bamzai, program director in the National Science Foundation’s Division of Atmospheric and Geospace Sciences, which funded the research. “This research is vital as society prepares for the potential effects of climate change.”
Satellite observations of the ocean surface, which began in 1993, indicated the rate of sea level rise was holding fairly steady at about 3 millimeters per year. As the pace of warming oceans and melting glaciers and ice sheets accelerated, scientists expected to see a corresponding increase in the rate of sea level rise. Analysis of the satellite record has not borne that out, however.
Researchers have now determined that the expected increase in sea level rise due to climate change was likely hidden because of a happenstance of timing: Pinatubo erupted in 1991, two years before the first satellite observations of the ocean began. The eruption, which temporarily cooled the planet, caused sea levels to drop and effectively distorted calculations of sea level rise in subsequent decades.
The study lends support to climate model projections that show the rate of sea level rise escalating over time as the climate warms. The findings were published today in the open-access journal Scientific Reports, published by Nature Publishing Group.
“When we used climate model runs designed to remove the effect of the Pinatubo eruption, we saw the rate of sea level rise accelerating in our simulations,” said National Center for Atmospheric Research (NCAR) scientist John Fasullo, who led the study. “Now that the impacts of Pinatubo have faded, this acceleration should become evident in the satellite measurements in the coming decade, barring another major volcanic eruption.”
Study co-author Steve Nerem of the University of Colorado Boulder, added: “The study shows that large volcanic eruptions can significantly impact the satellite record of global average sea level change. So we must be careful to consider these effects when we look for the effects of climate change in the satellite-based sea level record.”
The findings have implications for the extent of sea level rise this century and may be useful to coastal communities planning for the future. Decision-makers have debated whether communities should make plans based on the steady rate of sea level rise as measured by satellites in recent decades, or based on the accelerated rate expected in the future as predicted by climate scientists.
Reconstructing a pre-Pinatubo world
Fasullo and Nerem, along with Benjamin Hamlington of Old Dominion University, wanted to pin down how quickly sea levels were rising in the decades before the satellite record began.
Prior to the launch of the international TOPEX/Poseidon satellite mission in late 1992, sea level was mainly measured using tide gauges. For the researchers, variations in measurement technique and location meant that the pre-satellite record was best used to get a ballpark estimate of global mean sea level.
To complement the historic record, the research team ran the NCAR-based Community Earth System model 40 times with slightly different — but historically plausible — starting conditions. The resulting simulations characterize the range of natural variability in the factors that affect sea levels. The model was run on the Yellowstone system at the NCAR-Wyoming Supercomputing Center.
A separate set of model runs that omitted volcanic aerosols — particles spewed into the atmosphere by an eruption — was also assessed. By comparing the two sets of runs, the scientists were able to pick out a signal (in this case, the effect of Mount Pinatubo’s eruption) from the noise (natural variations in ocean temperature and other factors that affect sea level).
“You can’t do it with one or two model runs — or even three or four,” Fasullo said. “There’s just too much accompanying climate noise to understand precisely what the effect of Pinatubo was. We could not have done it without large numbers of runs.”
Using models to understand observations
Analyzing the simulations, the research team found that Pinatubo’s eruption caused the oceans to cool and sea levels to drop by about 6 millimeters immediately before TOPEX/Poseidon began making observations.
As the sunlight-blocking aerosols from Mount Pinatubo dissipated in the simulations, sea levels began to slowly rebound to pre-eruption levels. This rebound swamped the acceleration caused by the warming climate and made the rate of sea level rise higher in the mid- and late 1990s than it otherwise would have been.
This higher-than-normal rate of sea level rise in the early part of the satellite record made it appear as though the rate of sea level rise was not accelerating over time. In fact, according to the study, if the Pinatubo eruption had not occurred — leaving sea level at a higher starting point in the early 1990s — the satellite record would have shown a clear acceleration.
“The satellite record is unable to account for everything that happened before the first satellite was launched,” Fasullo said. “This study is a great example of how computer models can give us the historical context that’s needed to understand some of what we’re seeing in the satellite record.”
Understanding whether the rate of sea level rise is accelerating or remaining constant is important because it drastically changes what sea levels might look like in 20, 50 or 100 years.
Because the study’s findings suggest that acceleration due to climate change is already under way, the acceleration should become evident in the satellite record in the coming decade, Fasullo said.
Since the original TOPEX/Poseidon mission, newer satellites, including the recently launched Jason-3, will continue to track sea level.
“Sea level rise is potentially one of the most damaging effects of climate change, so it’s critical that we understand how quickly it will rise in the future,” Fasullo said. “Measurements from Jason-3 will help us evaluate what we’ve learned in this study and help us better plan for the future.”
NASA and the U.S. Department of Energy also funded the study.
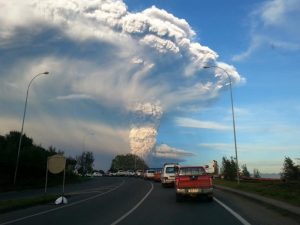
The Calbuco volcano in Chile erupted on 22 April 2015, producing an ash cloud that rose at least 15 kilometers into the atmosphere. Credit: Aeveraal, CC BY SA 4.0
When the Earth absorbs solar radiation, the planet heats up. Some of that energy escapes back into space as electromagnetic radiation, but certain gases in the atmosphere can trap the electromagnetic radiation, warming the planet like a blanket.
A longstanding question involves whether gases emitted by volcanoes help trap energy on a global scale. Specifically, water vapor—which traps more radiation in the atmosphere than any other gas, alone accounting for half of the greenhouse gas effect—is of great interest to scientists studying volcanoes and global climate change. In theory, the force of eruptions could inject water vapor into the stratosphere, where the water vapor could reside for months and cause significant warming. Days after Mount St. Helens erupted in 1980, for example, researchers measured increased water vapor in the stratosphere, but little evidence has emerged since then that moderately explosive eruptions significantly increase the amount of water vapor in the stratosphere. Still, numerous studies have attempted to model the impact that water vapor spewed from volcanoes has on the global climate.
Here Sioris et al. took measurements from the 2015 eruption of the Calbuco volcano in Chile to see how much vapor a moderate-sized volcanic eruption would spew into the stratosphere. The researchers used the Aura satellite to take samples of the water vapor in the volcanic plume following the eruption. This is the first time that satellite observations have been used to determine the total amount of water vapor injected into the stratosphere by a volcanic eruption, giving researchers a more representative data reading than in situ observations used in an earlier study.
The satellite data revealed that the ratio of water vapor to dry air reached 14 parts per million by volume in the stratosphere days after the eruption. The researchers found that this significant vapor enhancement from Calbuco, as had been observed following Mount St. Helens, persisted for only a few days in the stratosphere. Using the data in this study and the measurements of other eruptions, the authors confirm that moderate-sized volcanic eruptions do not deliver enough water vapor to the stratosphere on timescales long enough to consistently contribute to the greenhouse effect.
Reference:
Direct injection of water vapor into the stratosphere by volcanic eruptions. DOI: 10.1002/2016GL069918
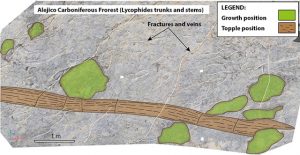
Fig. 6 Schematic cartoon of tThe Alejico Carboniferous forest depicting the different fossil remains and the fracture sets present in the studied outcrop
The study that we have done has a dual function. On the one hand will enable you to preserve the remains of the petrified forest where different species of trees and plants that populated our province makes 300 Ma. On the other hand, the paper provides information on the nature and the environmental conditions of this type of forests with major implications at the scientific level and educational.
In this case we have used new technological tools as the drones to obtain three-dimensional models to analyze in detail the characteristics of fossils and above all, monitoring the outcrop, with a view to its future preservation.
To be a mountain area, where the climatic conditions play a very important role in the conservation status of the outcrop, affected by a strong process of weathering and human action (as the spoliation), it was necessary to carry out this study. In the last 5 years has greatly deteriorated the outcrop, losing some remains of great scientific value for the diversity of its remains and the amount of information they provide. For example, in the outcrop are distinguished fossil remains of trees that came to exceed a height of 15 m. Some have been preserved integers in position lying while can still be distinguished remains such as stumps and roots of the same in position of life.
The drones have allowed to work in one of the slopes in which are located the fossils that are available almost vertical and several meters of height, difficult to access another way. In addition, allowed the elaboration of models textured that provide information about the size and geometry of the debris, facilitating the taking of specific measures to facilitate their description.
The area is located outside of the Park of the Picos de Europa and presents no directive of preservation, we decided to make this work to be able to have a record that allows to take future actions for its preservation. The results will also allow its use for educational outreach, since we have obtained a model fotorealístico that allows you to view Fossils preserved in the rock from any angle and perspective, facilitating their interpretation by the public.
Abstract
The Alejico coalbeds represent a well-preserved Carboniferous fossils site characterised by the presence of tree trunks in life position and parallel to bedding. The area, located near the Picos de Europa National Park (Spain), between the León and Asturias provinces, lacks of any kind of preservation directives, thus being influenced by weathering, erosion and anthropogenic destruction. We present a photogrammetric study carried out through terrestrial and UAV-assisted technology in order to collect digital 3D information for fossil analysis and future preservation. A general overview of the steep wall of the outcrop and a detailed section of the fossil forest have been implemented into a reliable and accurate point cloud. Qualitative and quantitative information was obtained from a georeferenced high-resolution digital 3D model used for the characterisation of the different outcrop features, which aimed specially at the fossil conservation. The results provide useful information on the nature and paleoenvironment of carboniferous forests with important implication for scientific and educational interests. These technologies provide new possibilities for better preservation and diffusion of geologic heritage locations prone to be damaged, and enables public awareness for the protection of fossil sites with high scientific and cultural value.
Photo
Fig. 1 a Carboniferous outcrops of the Iberian Peninsula (based on Colmenero et al. 2002). b Tectono-stratigraphic zonation of the Cantabrian Zone and location of the Sabero Coal Basin (red star) (after Alonso et al. 2009)Fig. 2 (a) Panoramic view of the outcrop across the open-pit bank. (b) Fragment of tree trunk. (c) Deformed iron-rich nodules as a result of compactation, including plant fragments. (d) Fragment of calamites-tree bark laying bedding parallel over the sandy strata, in dead position. (e) Calamites-tree bark preserved in iron-rich sandy matrix. f Stump cast in growth positionFig. 4 (a) 3D model of the main outcrop obtained through UAVassisted photogrammetry. (b) Detailed 3D model generated by terrestrial photogrammetryFig. 5 a Detailed map of the main fossil outcrop over 3D texture model. b Digital model of the main outcrop. c Fossil cast of a trunk preserved in growth position and horizontal trunk laying over the strata (see the bark imprints, white arrow), viewed from the texture 3D model (left) and quantitative analysis of the feature over the digital model shown in inset-C, in Fig.5a (right). d External cast of fossil trunk, where stumps can be still recognised from the texture 3D model (left) and the quantitative analysis of the fossil remains shown in inset-D, in Fig. 5a (right)
Video
Reference:
Javier Fernández-Lozano, Gabriel Gutiérrez-Alonso. The Alejico Carboniferous Forest: a 3D-Terrestrial and UAV-Assisted Photogrammetric Model for Geologic Heritage Preservation. DOI: 10.1007/s12371-016-0193-0
Note: The above post is reprinted from materials provided by Javier Fernández Lozano.
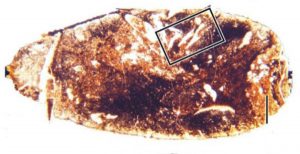
Image of a thin-section through an Orthacanthus coprolite with a black box indicating the tooth of an Orthacanthus. Credit: Aodhán Ó Gogáin (Trinity College Dublin)
Scientists have discovered macabre fossil evidence suggesting that 300 million-year-old sharks ate their own young, as fossil poop of adult Orthacanthus sharks contained the tiny teeth of juveniles. These fearsome marine predators used protected coastal lagoons to rear their babies, but it seems they also resorted to cannibalising them when other food sources became scarce.
Three hundred million years ago, Europe and North America lay on the equator and were covered by steamy jungles (the remains of which are now compacted into coal seams). The top predators of these so-called “Coal Forests” were not land animals, but huge sharks that hunted in the oily waters of coastal swamps.
The fossil evidence for shark cannibalism comes from distinctive spiral-shaped coprolites (fossil poop) found in the Minto Coalfield of New Brunswick, Canada. The poop is known to have been excreted by Orthacanthus because this shark had a special corkscrew rectum that makes identification easy. The poop is packed full of the teeth of juvenile Orthacanthus, confirming that these sharks fed on their own babies. This is called “fillial cannibalism.”
PhD candidate in the School of Natural Sciences, Trinity College Dublin, Aodhán Ó Gogáin, made the extraordinary discovery. His findings have just been published in the journal Palaeontology. He said: “Orthacanthus was a three-metre-long xenacanth shark with a dorsal spine, an eel-like body, and tricusped teeth. There is already evidence from fossilised stomach contents that ancient sharks like Orthacanthus preyed on amphibians and other fish, but this is the first evidence that these sharks also ate the young of their own species.”
Professor Mike Benton, University of Bristol, is a co-author of the study. He said: “As palaeontologists cannot observe predator-prey relationships directly in the way that a zoologist can, they have to use other methods to interpret ancient food webs. One method is by probing the contents of coprolites [fossil poop] as we have done here.”
Dr Howard Falcon-Lang, Royal Holloway University of London is another co-author. He said: “We don’t know why Orthacanthus resorted to eating its own young. However, the Carboniferous Period was a time when marine fishes were starting to colonise freshwater swamps in large numbers. It’s possible that Orthacanthus used inland waterways as protected nurseries to rear its babies, but then consumed them as food when other resources became scarce.”
Aodhán Ó Gogáin added: “Orthacanthus was probably a bit like the modern day bull shark, in that it was able to migrate backwards and forwards between coastal swamps and shallow seas. This unusual ecological adaptation may have played an important role in the colonisation of inland freshwater environments.”
The Minto Coalfield in Canada, where the fossils were discovered, is of considerable historical importance, being the first place in North America where settlers mined coal in the early 17th Century.
Reference:
Aodhán Ó Gogáin, Howard J. Falcon-Lang, David K. Carpenter, Randall F. Miller, Michael J. Benton, Peir K. Pufahl, Marcello Ruta, Thomas G. Davies, Steven J. Hinds, Matthew R. Stimson. Fish and tetrapod communities across a marine to brackish salinity gradient in the Pennsylvanian (early Moscovian) Minto Formation of New Brunswick, Canada, and their palaeoecological and palaeogeographical implications. Palaeontology, 2016; DOI: 10.1111/pala.12249
Starry sky through trees. When massive stars with more than ten solar masses have, at the end of their evolution, consumed all of their nuclear fuel supply, they collapse under their gravity and terminate in so-called core-collapse supernovae. Credit: kaalimies / fotolia
Physicists from the Technical University of Munich (TUM) have succeeded in detecting a time-resolved supernova signal in Earth’s microfossil record. As the group of Prof. Shawn Bishop could show, the supernova signal was first detectable at a time starting about 2.7 Million years ago. According to the researcher’s analyses, our solar system spent one Million years to transit trough the remnants of a supernova.
When massive stars with more than ten solar masses have, at the end of their evolution, consumed all of their nuclear fuel supply, they collapse under their gravity and terminate in so-called core-collapse supernovae. Thereby they eject huge amounts of matter into their surroundings. If a supernova occurs sufficiently close to our solar system, it should leave traces of supernova debris on Earth, in the form of specific radioisotopes.
Supernova-iron on Earth
Among the elemental species known to be produced in these stars, the radioisotope Fe-60 stands out: This radioisotope has no natural, terrestrial production mechanisms; thus, a detection of Fe-60 atoms within terrestrial reservoirs is proof for the direct deposition of supernova material within our solar system.
Increased concentration also found in lunar samples
An excess of Fe-60 was already observed in around two million year old layers of a ferromanganese (FeMn) crust retrieved from the Pacific Ocean and, most recently, in lunar samples. These Fe-60 signals have been attributed to depositions of supernova ejecta. However, due to the slow growth rate of the FeMn crust, the Fe-60 signal had a poor temporal resolution; while lunar regolith cannot record time information because sedimentation does not occur on the moon.
Now for the first time, physicists of the group of Shawn Bishop, TUM Professor on Nuclear Astrophysics, succeeded in discovering a time-resolved supernova signal in Earth’s microfossil record, residing in biogenically produced crystals from two Pacific Ocean sediment drill cores. The onset of the Fe-60 signal occurs at around 2.7 Million years and is centered at around 2.2 Million years. The signal significantly ends around 1.7 Million years.
“Obviously, the solar system spent one Million years to transit through the debris of a supernova,” says Shawn Bishop, who is also a principal investigator at the Excellence Cluster Universe.
Samples with excellent stratigraphic resolution
To analyse the entire temporal structure of the Fe-60 signal in terrestrial samples, a geological reservoir with an excellent stratigraphic resolution and high Fe-60 sequestration and low Fe mobility is required, which preserves the Fe-60 fluxes nearly so as they were at the time of deposition, apart from Fe-60 radioactive decay.
Analyses at the Tandem accelerator in Garching
These conditions are fulfilled in the marine sediments from the Pacific Ocean used in this study. At the time of the Fe-60 deposition, iron-sequestering bacteria that live in the ocean sediments incorporated the Fe-60 within their intracellularly-grown chains of magnetite nanocrystals (Fe3O4). After cell death they have fossilized into microfossils. These sediments have grown with a constant sedimentation rate, preserving the intrinsic temporal shape of the supernova signal. “Nevertheless, the Fe-60 concentration in these fossils is so low that it is detectable only by means of ultrasensitive accelerator mass spectroscopy (AMS),” says Dr. Peter Ludwig, researcher in the group of Shawn Bishop. At the tandem accelerator at the Maier-Leibnitz Laboratory in Garching the physicists could refine the sensitivity of the method so that this discovery was possible the first time ever.
Supernova event at a distance of at least 300 light years
The most plausible progenitor star that gave rise to this supernova likely originated in the Scorpius-Centaurus OB association, as analyses of its relative motion have shown. Around 2.3 million years ago it was located at a minimum distance of about 300 light years to the solar system. Over the course of the last 10 to 15 million years, a succession of 15 to 20 supernovae has occurred in this star association. This series of massive stellar explosions has produced a largely matter-free cavity in the interstellar medium of a galactic arm of the Milky Way. Astronomers call this cavity, in which our solar system is located, the Local Bubble.
Reference:
Peter Ludwig, Shawn Bishop, Ramon Egli, Valentyna Chernenko, Boyana Deneva, Thomas Faestermann, Nicolai Famulok, Leticia Fimiani, José Manuel Gómez-Guzmán, Karin Hain, Gunther Korschinek, Marianne Hanzlik, Silke Merchel, Georg Rugel. Time-resolved 2-million-year-old supernova activity discovered in Earth’s microfossil record. Proceedings of the National Academy of Sciences, 2016; 201601040 DOI: 10.1073/pnas.1601040113
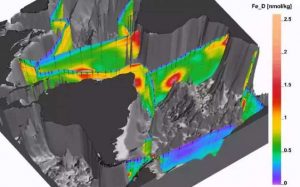
GEOTRACES was established to map trace elements and nutrients, from seafloor to surface, in all oceans. This view of the Atlantic shows concentrations of dissolved iron. Credit: eGEOTRACES Atlas
Human actions are changing the oceans’ chemistry. Pollution washes in from the coasts, iron-laden dust blows in from increasingly arid land, greenhouse gases raise surface temperatures and carbon dioxide levels. To predict how marine ecosystems are going to respond to these changes, we need to understand how marine biology and ocean chemistry interact.
Until recently, too little data existed about the distribution of trace elements and nutrients in the oceans to provide a global picture. In 2002, a group of scientists connected with Columbia University’s Lamont-Doherty Earth Observatory set out to fill those gaps. They launched GEOTRACES, an extraordinary international mission to consistently map the oceans’ vital trace elements using cutting-edge technology. Today, data collected through GEOTRACES is revealing areas of excesses and shortages of nutrients, such as iron, zinc and cobalt, that support marine ecosystems around the world.
This week, scientists from several countries gathered at Lamont to focus on the next phase of GEOTRACES. While ocean sampling continues, the scientists now have enough data to begin combining their expertise across the disciplines to analyze data in ways that individual scientists couldn’t do alone.
Setting priorities
One research priority among several that emerged from the Lamont workshop involves expanding our understanding of nutrient cycling. When algae die, they sink, and through decomposition, nutrients are recycled back into the ocean. Determining how fast and at what depths that happens provides important information about how quickly nutrients are returned to populations at the surface. Changes in that rate, which could be caused by changes in ocean chemistry, circulation or temperature, for example, could affect entire ecosystems.
Another priority will be to determine the sensitivity of algae to various nutrients in regions around the world. Using cutting edge tools of molecular biology, investigators can measure specific proteins to tell if organisms in certain areas are stressed by lack of nutrients, while geochemists can determine how much of the nutrient is present at different depths, even at ultra-low concentrations.
The scientists can bring a variety of analysis and modeling techniques together to begin answering questions in those and other areas.
“Through this work, we can begin to understand the chemical-biological coupling that controls the whole structure – the health, the fertility of marine ecosystems,” said geochemist Bob Anderson, Ewing Lamont Research Professor at Lamont and a founder of GEOTRACES.
Three tracks
GEOTRACES is focusing its collaborative analysis on three tracks: The interplay between chemicals in the ocean and ecosystems, which was the focus of the Lamont workshop this week; the interaction between ocean chemicals and the environment, including sediments, air, land and volcanoes; and what we can learn about past changes in the oceans and climate using the suite of chemicals now being measured worldwide by GEOTRACES scientists.
Gideon Henderson, a geochemist at the University of Oxford who worked at Lamont in the 1990s and was one of the scientists who teamed up with Anderson to create GEOTRACES, expects the first papers on connections to sediment, land, air and volcanoes to be published in December.
“We had such sparse data before GEOTRACES, and now we have these complete cross sections, full depth across the oceans. You can see all the processes that are operating. It’s a really rich data set,” Henderson said. The 3D image above, for example, combined with basic knowledge of ocean physics, chemistry and biology, tells marine geochemists quite a bit about the distribution of iron in the ocean.
The long-term goal is to better understand and predict how the base of the food web and the ocean ecosystems are going to respond to human changes such as rising temperatures, acidification of the waters, and aridification of large areas of the world that create more dust, Anderson said. “These are basic things that affect ecosystems in the oceans,” he said. “We are generating a lot of new information about how the chemical environment responds to these changes.”
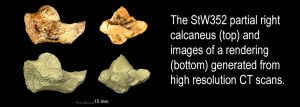
The StW352 partial right calcaneus (top) and images of a rendering (bottom) generated from high resolution CT scans. Credit: Wits University
A new study that for the first time examined the internal anatomy of a fossil human relative’s heel bone, or calcaneus, shows greater similarities with gorillas than chimpanzees.
The study, titled: Trabecular architecture in the StW 352 fossil hominin calcaneus and published in the Journal of Human Evolution, was undertaken by a team of international researchers from the University of the Witwatersrand in South Africa, Duke University, University of Southern California and Indiana University in the US.
The team examined the internal anatomy of our human relative, the StW 352 Australopithecus africanus fossil, from South Africa’s rich fossil record in the Cradle of Humankind World Heritage Site, some 40km from Johannesburg.
They analyzed the structure and orientation of trabecular struts – the spongy material inside a bone – in the fossil from Sterkfontein Member 4, demonstrating greater similarities between it and the heel bone of gorillas rather than humans or chimpanzees.
In doing this, the team revealed new insights into how our ancestors moved through and interacted with their environment approximately 2 – 2.5 million years ago. Similarities between the fossil from Sterkfontein and gorillas indicate that Australopithecus africanus, the species of human ancestor (or hominin) also represented by the Taung Child, or at least this individual member of the species, exhibited gorilla-like levels of joint mobility and structural reinforcement.
Results of the new study were surprising because other recent studies of the australopithecine calcaneus, focusing on its external anatomy, have emphasised similarities with chimpanzees or humans.
However, since the organisation of trabecular bone is determined in part by how an animal interacts with its environment during its lifetime, the gorilla-like features observed in the present study are particularly compelling in revising how we view behavioural reconstructions of our australopithecine ancestors.
Lowland gorillas are generally regarded as less arboreal than chimpanzees – they spend less time in trees and generally less time climbing – although it is important to remember that even gorillas depend on arboreal resources for their survival. Humans are the only truly terrestrial primate still alive today. Thus, the gorilla-like features in the Australopithecus africanus calcaneus substantiate claims that our hominin ancestors depended on arboreal resources for their survival, but importantly, it provides evidence that gorilla-like foot function should be considered more frequently when discussing the evolution of human feet and how they functioned within the environment.
Ultimately, whether internal structure of the Australopithecus africanus calcaneus from Sterkfontein indicates gorilla-like levels of arboreal resource exploitation, or whether it reveals greater variability (mobility) in foot interactions with uneven terrain compared to those characterising modern human feet, awaits follow-up research that the investigators are currently undertaking.
In this Aug. 8, 2016 photo, Geoffrey Hargreaves, curator of the National Ice Core Laboratory, carries an arctic ice core inside the minus-33 degree Fahrenheit environment of the lab’s archive warehouse, in Lakewood, Colo. Using a wide range of data, from ice cores to trace gas analysis and other methods, scientists are attempting to measure the past and present so they can better model the near and distant future of our planet. Credit: AP Photo/Brennan Linsley
Inside a huge walk-in freezer in suburban Denver, a college student in a thick parka shoots a jolt of electricity through a yard-long column of ice extracted from Antarctica.
Just outside the freezer, in a much warmer room, a computer wired to the ice registers a sudden spike in a jagged red line crawling across the screen.
“Hey, we got a volcano,” says T.J. Fudge, a University of Washington researcher. The electric current has detected a thin layer of volcanic residue in the ice, deposited by an eruption about 8,000 years ago.
This is the National Ice Core Laboratory in Lakewood, where ice pulled from the depths of Antarctica and Greenland is sliced up, photographed and tested. Most of it is shipped to other labs, where researchers do more experiments looking for clues about Earth’s past and future.
Smooth and milky white, the 4- to 5-inch-diameter pieces—called ice cores—provide scientists with a wealth of historical information, from air temperature to greenhouse gases to evidence of cosmic events. The record reaches as far back as 800,000 years.
The ice is the remnant of centuries of snowfall, compressed by the weight of successive years of accumulation.
“You can drill into it, and it’s much like looking at tree rings,” Fudge said. “It’s just year after year after year of climate information that’s preserved out in the ice sheet.”
Specialized drilling rigs pull the cores from as deep as 9,800 feet below the surface of the ice sheets. Crews then tuck them into protective tubes, pack them in chilled containers and ship them to the U.S. Refrigerated trucks haul them to Colorado lab, which is funded by the National Science Foundation.
In a bustling, white-walled workroom in the Lakewood freezer—kept at about minus 11 Fahrenheit—workers push the cores through a series of saws on metal frame benches, divvying up the ice according to a prearranged pattern for different experiments.
Part of every ice core is archived in another, larger room at about minus 33 degrees, so future researchers can verify old results or try new tests. The archive contains nearly 56,000 feet of ice.
Scientists tease data from the ice in various ways. Differences in the weight of molecules in the frozen water hold clues about the air temperature at the time the snow fell.
Air trapped in bubbles can be analyzed to measure how much carbon dioxide and other gases were in the atmosphere when the ice formed.
A solar flare or other cosmic events can leave distinctive radioactive atoms on the snow. Dust blown in from distant continents offers clues about atmospheric circulation.
“The ice sheets are in direct contact with the atmosphere,” said Mark Twickler, the lab’s science director. “Everything that’s in the atmosphere we capture as time goes by, and it gets buried in snow.”
The depth of the core and evidence of volcanoes help determine how old the ice is.
Scientists already know when major eruptions occurred, so a layer of volcanic residue indicates the year the adjacent ice formed. That becomes a reference point for annual layers above and below.
The record is remarkably precise, even reflecting seasonal changes, scientists say.
“It’s as if we’re standing on the ice sheet writing down the temperature for the last 800,000 years,” said Bruce Vaughn, a University of Colorado-Boulder lab manager who works with the ice. “It’s that good.”
Without a record of its depth and age, the ice has little research value, said Geoffrey Hargreaves, curator of the Lakewood lab.
“An ice core without any depth references—I shouldn’t say this—it’s good for margaritas,” he said, poker-faced.
No, Hargreaves said, scientists don’t actually do that.
“There’s drill fluids in these things that you really don’t want to drink,” he said.
Some experiments are done only on ice from the core’s interior, away from the fluids.
Ice cores have led scientists to significant conclusions about climate, including that CO2 levels in the atmosphere today are higher than at any other time recorded in the ice.
“The only reason we can make that statement is because we have the ice core air archived,” said Murat Aydin, a researcher at the University of California-Irvine.
Ice cores also help refine computer models used to make climate predictions.
“If we run them backwards with the parameters that we measure in the ice core and we get it right, that gives us a lot more confidence in the climate models going forward,” Vaughn said.
As technology improves, researchers find new ways to analyze the ice. A technique called continuous flow analysis allows them to slowly melt a one-yard stick of ice and analyze it drop-by-drop, instead of cutting it into small pieces, melting them one-by-one and averaging the results. The new technique gives scientists up to 2,400 measurements per yard instead of 20, Vaughn said.
“There’ll be science for dozens of years with researchers who are maybe only now getting their degrees or learning about this,” Vaughn said. “It’s exciting. How could you not be excited about it?”
The caldera of Mount Pinatubo on June 22, 1991. Credit: Courtesy of USGS.
Greenhouse gases are already having an accelerating effect on sea level rise, but the impact has so far been masked by the cataclysmic 1991 eruption of Mount Pinatubo in the Philippines, according to a new study led by the National Center for Atmospheric Research (NCAR).
Satellite observations, which began in 1993, indicate that the rate of sea level rise has held fairly steady at about 3 millimeters per year. But the expected acceleration due to climate change is likely hidden in the satellite record because of a happenstance of timing: The record began soon after the Pinatubo eruption, which temporarily cooled the planet, causing sea levels to drop.
The new study finds that the lower starting point effectively distorts the calculation of sea level rise acceleration for the last couple of decades.
The study lends support to climate model projections, which show the rate of sea level rise escalating over time as the climate warms. The findings were published today in the open-access Nature journal Scientific Reports.
“When we used climate model runs designed to remove the effect of the Pinatubo eruption, we saw the rate of sea level rise accelerating in our simulations,” said NCAR scientist John Fasullo, who led the study. “Now that the impacts of Pinatubo have faded, this acceleration should become evident in the satellite measurements in the coming decade, barring another major volcanic eruption.”
Study co-author Steve Nerem, from the University of Colorado Boulder, added: “This study shows that large volcanic eruptions can significantly impact the satellite record of global average sea level change. So we must be careful to consider these effects when we look for the effects of climate change in the satellite-based sea level record.”
The findings have implications for the extent of sea level rise this century and may be useful to coastal communities planning for the future. In recent years, decision makers have debated whether these communities should make plans based on the steady rate of sea level rise measured in recent decades or based on the accelerated rate expected in the future by climate scientists.
The study was funded by NASA, the U.S. Department of Energy, and the National Science Foundation, which is NCAR’s sponsor.
Reconstructing a pre-Pinatubo world
Climate change triggers sea level rise in a couple of ways: by warming the ocean, which causes the water to expand, and by melting glaciers and ice sheets, which drain into the ocean and increase its volume. In recent decades, the pace of warming and melting has accelerated, and scientists have expected to see a corresponding increase in the rate of sea level rise. But analysis of the relatively short satellite record has not borne that out.
To investigate, Fasullo, Nerem, and Benjamin Hamlington of Old Dominion University worked to pin down how quickly sea levels were rising in the decades before the satellite record began.
Prior to the launch of the international TOPEX/Poseidon satellite mission in late 1992, sea level was mainly measured using tide gauges. While records from some gauges stretch back to the 18th century, variations in measurement technique and location mean that the pre-satellite record is best used to get a ballpark estimate of global mean sea level.
To complement the historic record, the research team used a dataset produced by running the NCAR-based Community Earth System Model 40 times with slightly different—but historically plausible—starting conditions. The resulting simulations characterize the range of natural variability in the factors that affect sea levels. The model was run on the Yellowstone system at the NCAR-Wyoming Supercomputing Center.
A separate set of model runs that omitted volcanic aerosols—particles spewed into the atmosphere by an eruption—was also assessed. By comparing the two sets of runs, the scientists were able to pick out a signal (in this case, the impact of Mount Pinatubo’s eruption) from the noise (natural variations in ocean temperature and other factors that affect sea level).
“You can’t do it with one or two model runs—or even three or four,” Fasullo said. “There’s just too much accompanying climate noise to understand precisely what the effect of Pinatubo was. We could not have done it without large numbers of runs.”
Using models to understand observations
Analyzing the simulations, the research team found that Pinatubo’s eruption caused the oceans to cool and sea levels to drop by about 6 millimeters immediately before TOPEX/Poseidon began recording observations.
As the sunlight-blocking aerosols from Mount Pinatubo dissipated in the simulations, sea levels began to slowly rebound to pre-eruption levels. This rebound swamped the acceleration caused by the warming climate and made the rate of sea level rise higher in the mid- to late 1990s than it would otherwise have been.
This higher-than-normal rate of sea level rise in the early part of the satellite record makes it appear that the rate of sea level rise has not accelerated over time and may actually have decreased somewhat. In fact, according to the study, if the Pinatubo eruption had not occurred—leaving sea level at a higher starting point in the early 1990s—the satellite record would have shown a clear acceleration.
“The satellite record is unable to account for everything that happened before the first satellite was launched, ” Fasullo said. “This study is a great example of how computer models can give us the historical context that’s needed to understand some of what we’re seeing in the satellite record.”
Understanding whether the rate of sea level rise is accelerating or remaining constant is important because it drastically changes what sea levels might look like in 20, 50, or 100 years.
“These scientists have disentangled the major role played by the 1991 volcanic eruption of Mt. Pinatubo on trends in global mean sea level,” said Anjuli Bamzai, program director in the National Science Foundation’s Division of Atmospheric and Geospace Sciences, which funded the research. “This research is vital as society prepares for the potential effects of climate change.”
Because the study’s findings suggest that acceleration due to climate change is already under way, the acceleration should become evident in the satellite record in the coming decade, Fasullo said.
Since the original TOPEX/Poseidon mission, other satellites have been launched—Jason-1 in 2001 and Jason-2 in 2008—to continue tracking sea levels. The most recent satellite, Jason-3, launched on Jan. 17 of this year.
“Sea level rise is potentially one of the most damaging impacts of climate change, so it’s critical that we understand how quickly it will rise in the future,” Fasullo said. “Measurements from Jason-3 will help us evaluate what we’ve learned in this study and help us better plan for the future.”
Reference:
J.T. Fasullo, R. S. Nerem, and B. Hamlington, “Is the detection of sea level rise imminent?,” Scientific Reports, DOI: 10.1038/srep31245