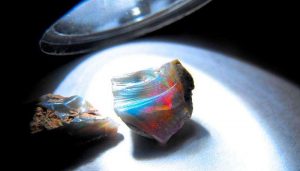
An ideal example how light interacts with the small structures of colloidal particles—the Opal. Credit: Yagan Kiely
Be it in phyics, mettalurgy, gemology or engineering, the applications of crystals are very broad. A research team including Christos Likos and Lorenzo Rovigatti from the Faculty of Physics of the University of Vienna, in collaboration with the National Institute of Standards and Technology (NIST, USA) and Princeton University (USA) has developed a new method to assemble large, periodic crystals. The results have been publihsed in the jounral ACS Nano.
Crystals are solid materials composed of microscopic building blocks arranged in highly ordered patterns. They have countless applications, ranging from metallurgy to jewellery to electronics. Many of the properties that make crystals useful depend on the detailed pattern of arrangement of their constituents, which, in turn, is highly sensitive to the details of the interaction between the building blocks. In molecular and atomic crystals the interparticle forces are fixed by Nature, and the only way of tuning the microscopic arrangement is to either vary the external conditions (temperature, pressure, etc.) or change the particles themselves.
By contrast, insoft matter Physics , where the building blocks are orders of magnitude larger and much more complex than atoms, it is possible to design and engineer building blocks with extremely tunable properties. Consequently, much effort has been devoted to the synthesis of colloids that self-assemble into highly symmetric patterns with technologically relevant properties. For instance, there exist specific crystal lattices that exhibit very exciting optical properties, the so-called photonic crystals – periodic structures that allow certain bands of wavelengths of light to propagate through their interior while blocking other ones.
A natural example of a photonic crystal is the opal, whose fascinating coloration is due to the way the light interacts with its microscopic structure of colloidal particles arranged on a regular lattice. The multicolored iridescence of the precious opal, the source of its charming appearance, is due to the presence of several small crystals, known as crystallites, which are randomly oriented with respect to the one another. In addition, the assembly of colloidal crystals is often confounded by polymorphism: “Different structures are characterised by comparable thermodynamic stabilities, making it difficult to produce a single morphology at will”, says Christos Likos from the Faculty of Physics of the University of Vienna.
The resulting lack of long-range order is detrimental for many applications. Accordingly, strategies need to be developed that enhance the growth of long-ranged, monocrystalline samples in (real or numerical) experiments. Accordingly, scientists have been working hard to deveop strategies that enhance the growth of large, monocrystaline structures.
Employing computer simulations, a new method has now meen deveoped that allows the assembly of technologically relavant, non-polymorphic crystals. “The system crystallises into a mixture of difference micocrystals. However, the competing structures assembled by the colloids have different geometries and different internal void distributions. This difference can be exploited by tuning the size of polymer additive to interact uniquely with the void symmetry of the desired crystal, effectively stabilising it against the competitor”, explains Lise-Meitner Fellow Lorenzo Rovigatti, working at the group of Christos Likos.
The results of the research team serve not only to illustrate an alternative to existing approaches which, in many cases, produce unsatisfactory results, but also to guide experimental realizations of highly-ordered colloidal open crystals in the near future.
Reference:
Nathan A. Mahynski et al. Bottom-Up Colloidal Crystal Assembly with a Twist, ACS Nano (2016). DOI: 10.1021/acsnano.6b01854
Note: The above post is reprinted from materials provided by University of Vienna.
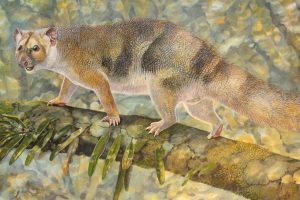
Reconstruction by palaeoartist Peter Schouten of Microleo attenboroughi prowling along the branches of rainforest trees in search of prey. Credit: Peter Schouten
The fossil remains of a new tiny species of marsupial lion which prowled the lush rainforests of northern Australia about 18 million years ago have been unearthed in the Riversleigh World Heritage Area of remote north-western Queensland.
The UNSW discovery team has named the new species Microleo attenboroughi for its small size and to honour the famous broadcaster and naturalist Sir David Attenborough, in recognition of his support for the Riversleigh World Heritage Area, which he has described as one of the four most important fossil areas in the world.
The new species was much smaller than the other members of this extinct marsupial lion family, including its most famous but younger relative — the lion-sized Thylacoleo carnifex.
“Microleo attenboroughi would have been more like the cute, but still feisty kitten of the family,” says study lead author UNSW’s Dr Anna Gillespie.
“It was not lion-size or even bob-cat-size. Weighing only about 600 grams, it was more like a ringtail possum in size.”
The news species is described in the journal Palaeontologia Electronica, based on a fossil specimen of part of its skull and teeth. Its dentition includes an elongate, lethally sharp, knife-like premolar in front of basined molars — specialised features which are common to all members of this extraordinary family of marsupial carnivores, the Thylacoleonidae.
Microleo attenboroughi was recovered from a limestone deposit believed to have formed in a pool within a rainforest landscape about 19 million years ago, during the Miocene.
The fossil deposit, named Neville’s Garden Site, has already revealed a rich fauna including at least six different kinds of bandicoots, many kinds of possums and kangaroos, toothed platypuses, diminutive koalas, thousands of bats, fish, turtles, lizards, pythons and birds including storks, logrunners and the earliest-known Australian parrot.
“Despite its relatively small size compared with the Pleistocene Thylacoleo carnifex — the last surviving megafaunal marsupial lion — the new species was one of the larger flesh-eaters existing in its ancient community of rainforest creatures at Riversleigh,” says team member UNSW Professor Mike Archer.
The diversity of marsupial lions alive at this time at Riversleigh is unmatched in the fossil record from anywhere else on the continent.
“Microleo shared these northern Miocene rainforests with two larger species of marsupial lion, one cat-sized and the other dog-sized,” says Dr Gillespie.
“Although it is possible they competed with one other, the size differences probably means they each specialised on a different size range of prey.
“It’s likely that Microleo scampered amongst the tree-tops, gobbling insects as well as small vertebrates such as lizards and birds while simultaneously trying to avoid becoming a prey item for its larger relatives,” she says.
Study co-author UNSW Professor Suzanne Hand says: “The early Miocene of northern Australia, as documented by the thousands of fossils from Riversleigh, was a time of mild, very wet climatic conditions with mammal diversity more like that seen in Borneo than anywhere in Australia today.”
Intriguingly, although many thousands of bones and teeth have been recovered in the 40 years of research at Riversleigh, only one specimen of this small flesh-eater has been recovered.
“Tantalising questions about the rest of its skull and skeleton which could further clarify aspects of its lifestyle — such as whether it had an enlarged ‘killing’ thumb claw like its Pleistocene relative — must await discovery of more complete specimens,” says Professor Archer.
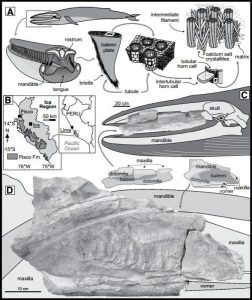
A: Main baleen features of an extantrorqual, at different scales; tubule diameter ~0.5 mm (modified and redrawn from Szewciw et al., 2010). B: Location of Cerro Colorado, Peru (detailed map in Fig. DR1). C: Left baleen rack of the balaenopteroid specimen M1 as found in the field, with drawing showing the original position in the whale skull. D: Right baleen rack of specimen M1. Credit: Anna Gioncada and Geology
In Cerro Colorado, located in the Ica Desert of Peru, sedimentary sequences dating back nine million years have been found to host the fossil skeletons of hundreds of marine vertebrates. In 2008, remains of a giant raptorial sperm whale, Livyatan melvillei, were discovered at this site. In September 2014, the same international team of researchers, guided by Giovanni Bianucci from Pisa University (Italy), found a partial skeleton of a mysticete whale in a rock boulder.
Besides fossil bones of the skull and mandibles, the rock containing the skeleton showed perfect casts of the whale baleen. The exceptionality of the finding is that the casts provide details at the submillimetric scale, revealing under the microscope the subtle structure of the baleen bristles. Indeed, fossilized baleen bristles have been studied for the first time by chemical and mineralogical analyses. The data obtained allow researchers to compare the Miocene whale feeding habits to those of the extant sea whale, and strengthen the preservation potential of the Ica desert for the marine vertebrate fossil record.
Reference:
Anna Gioncada, Alberto Collareta, Karen Gariboldi, Olivier Lambert, Claudio Di Celma, Elena Bonaccorsi, Mario Urbina, Giovanni Bianucci. Inside baleen: Exceptional microstructure preservation in a late Miocene whale skeleton from Peru. Geology, 2016; G38216.1 DOI: 10.1130/G38216.1
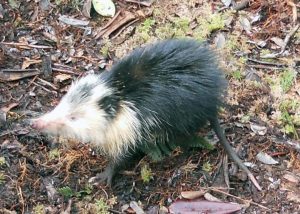
A Cuban solenodon (Body length=30cm, Tail length=20cm, Weight=ca.800g). Credit: Copyright Hokkaido University
The Caribbean islands form a natural laboratory for the study of evolution due to their unique biological and geological features. There has been heated discussion since the early 20th century on how species appeared on the islands.
The Cuban solenodon is a small, rare, endangered animal, belonging to the mammalian order Eulipotyphla. It is a mole-like nocturnal animal with a long snout that feeds on insects and is found in only a few fragmented locations in Cuba. Its evolutionary origins have been widely contested and have remained relatively elusive because they have been so difficult to capture and examine.
In 2012, a team of researchers successfully captured seven living Cuban solenodons and collected DNA samples before releasing them. They analysed five specific protein-coding genes and compared them to the same genes in another 35 species belonging to the same order.
While another research group had suggested that solenodons lived with dinosaurs in the Cretaceous period, this team found that the solenodon family evolved from its ancestor around 59 million years ago, long after the dinosaur extinction. The team’s analysis also revealed that the Cuban solenodon and the Hispaniolan solenodon (the other existing solenodon species) diverged from each other in the Early Pliocene Epoch (3.7 to 4.8 million years ago), while the previous study set the divergence at 25 million years ago. Hispaniola is the second largest island in the Caribbean and is currently home to the Dominican Republic and Haiti.
The team now suggests that a much-later divergence time in addition to information on ocean-current patterns in the area indicate that the Cuban solenodon travelled over water (on floating plants or rafts, for example) to Cuba from Hispaniola, rather than evolutionarily diverging from them due to the much-earlier geological separation of the islands.
Together with results from other studies, the researchers believe that smaller invertebrates and some vertebrates (like butterflies and toads respectively) originated in the Caribbean islands via a land bridge between them and South America some 34 million years ago. On the other hand, many of the larger vertebrates, who would have been more capable of surviving the high-risk passage, may have originated in the islands via over-water travel.
The team’s research is published in the August 8 edition of the journal Scientific Reports.
Reference:
Jun J. Sato, Satoshi D. Ohdachi, Lazaro M. Echenique-Diaz, Rafael Borroto-Páez, Gerardo Begué-Quiala, Jorge L. Delgado-Labañino, Jorgelino Gámez-Díez, José Alvarez-Lemus, Son Truong Nguyen, Nobuyuki Yamaguchi, Masaki Kita. Molecular phylogenetic analysis of nuclear genes suggests a Cenozoic over-water dispersal origin for the Cuban solenodon. Scientific Reports, 2016; 6: 31173 DOI: 10.1038/srep31173
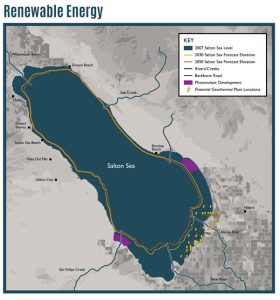
In some parts of Southern California’s Brawley Seismic Zone, geothermal energy production may be increasing the background seismicity rate, but changes in earthquake rates elsewhere in the area seem to have natural causes, according to a report published online August 23 in the Bulletin of the Seismological Society of America.
Geothermal energy production in the Salton Trough’s Brawley Seismic Zone does not have as dramatic of an impact on local seismicity as oil and gas production has had in parts of the central and eastern United States. There, the injection of massive volumes of wastewater from hydrocarbon production has increased the number of earthquakes and aftershocks in states like Oklahoma and Arkansas.
“It’s difficult to broadly say that all the earthquakes that occur within a certain space and time at these Salton geothermal fields are going to be induced, because it’s much more complicated than that,” said U.S. Geological Survey (USGS) seismologist Andrea Llenos. “You have a lot of other natural processes here going on at the same time.”
After applying several models to investigate the earthquake behavior from two areas of geothermal production in the Brawley Zone, Llenos and her USGS co-author Andrew Michael concluded that geothermal production is connected to a significant increase in the background seismicity rate in the Salton Sea Geothermal Field (SSGF). The increase in the background rate at the SSGF occurred around 1988, coinciding with a “ramp-up” in geothermal operations in the field that may have led to a net depletion of fluids in the crust there.
But Llenos and Michael found no clear connection between changes in seismicity and geothermal production in the North Brawley Geothermal Field (NBGF). They also found no significant increase in aftershocks in either field that could be connected to production.
The seismologists developed their models using earthquake data collected from within 5 to 10 kilometers of each field, between 1975 and 2012 for the SSGF and 1980 and 2012 for the NBGF.
Unlike the seismically quiet central U.S., the Salton Trough has long been the scene of significant seismic activity. The trough marks a transition between extensional rifting — where the crust is stretching and thinning beneath the Gulf of California to the south — to strike-slip motion along the San Andreas Fault system to the north. The area is prone to earthquake swarms, including an August 2012 swarm of more than 600 small earthquakes that occurred over two days near the town of Brawley.
High heat flow through the crust in the Salton Trough makes it an attractive area for geothermal energy production, with four active geothermal fields that together generate more than 650 megawatts of power. Geothermal energy is produced when hot water is extracted from the ground as steam that powers generators. The water from the condensed steam is then injected back into the ground.
At the time of the 2012 Brawley swarm, Llenos and Michael were finishing up a study of earthquake rate changes in Oklahoma and Arkansas, published in 2013, to evaluate whether those changes were induced by wastewater injection. “We wanted to see then if the tools we were using in the eastern and central U.S., which were working pretty well to distinguish natural and induced seismicity, would work as well or at all in the Salton Trough,” Llenos explained.
The energy production techniques differ considerably in the two regions. In the oilfields of Oklahoma, for example, the wastewater produced during oil recovery and injected back into the ground “increases the volume of fluids significantly at depth” Llenos said. “But for geothermal energy production, the field operators try to maintain a net fluid balance.” In some fields, almost 90 percent of the fluids used in geothermal production get injected back into the ground shortly after they are extracted, Llenos noted.
This difference may in part affect the production of aftershocks in each region, Llenos suggested. “In places like Oklahoma, the sudden changes in pressure at depth might bring many faults closer to their failure threshold,” she said. “So if all these faults around an earthquake are closer to failure, we found that many more aftershocks are triggered as a result. We don’t see that kind of drastic change in the Brawley Seismic Zone.”
Because the scientists had access to a much richer set of earthquake data in California than was available for the central U.S., “we were able to use more sophisticated models and tests here,” Llenos said. “For example, we could analyze how aftershock triggering varies with distance between earthquakes much better here than we were able to in the central and eastern U.S.”
Since their 2013 study, however, more instruments have been placed and more seismicity data have been collected in the central U.S. “Now that there’s more seismic network coverage in places like Oklahoma, we may someday be able to take the kinds of models we used here and reapply them in the central states,” said Llenos.
Reference:
Andrea L. Llenos, Andrew J. Michael. Characterizing Potentially Induced Earthquake Rate Changes in the Brawley Seismic Zone, Southern California. Bulletin of the Seismological Society of America, 2016; DOI: 10.1785/0120150053
Australian National University researcher Associate Professor Nerilie Abram. Credit: Stuart Hay, ANU
An international research project has found human activity has been causing global warming for almost two centuries, proving human-induced climate change is not just a 20th century phenomenon.
Lead researcher Associate Professor Nerilie Abram from The Australian National University (ANU) said the study found warming began during the early stages of the Industrial Revolution and is first detectable in the Arctic and tropical oceans around the 1830s, much earlier than scientists had expected.
“It was an extraordinary finding,” said Associate Professor Abram, from the ANU Research School of Earth Sciences and ARC Centre of Excellence for Climate System Science.
“It was one of those moments where science really surprised us. But the results were clear. The climate warming we are witnessing today started about 180 years ago.”
The new findings have important implications for assessing the extent that humans have caused the climate to move away from its pre-industrial state, and will help scientists understand the future impact of greenhouse gas emissions on the climate.
“In the tropical oceans and the Arctic in particular, 180 years of warming has already caused the average climate to emerge above the range of variability that was normal in the centuries prior to the Industrial Revolution,” Associate Professor Abram said.
The research, published in Nature, involved 25 scientists from across Australia, the United States, Europe and Asia, working together as part of the international Past Global Changes 2000 year (PAGES 2K) Consortium.
Associate Professor Abram said anthropogenic climate change was generally talked about as a 20th century phenomenon because direct measurements of climate are rare before the 1900s.
However, the team studied detailed reconstructions of climate spanning the past 500 years to identify when the current sustained warming trend really began.
Scientists examined natural records of climate variations across the world’s oceans and continents. These included climate histories preserved in corals, cave decorations, tree rings and ice cores.
The research team also analysed thousands of years of climate model simulations, including experiments used for the latest report by the UN’s Intergovernmental Panel on Climate Change (IPCC), to determine what caused the early warming.
The data and simulations pinpointed the early onset of warming to around the 1830s, and found the early warming was attributed to rising greenhouse gas levels.
Co-researcher Dr Helen McGregor, from the University of Wollongong’s School of Earth and Environmental Sciences, said humans only caused small increases in the level of greenhouse gases in the atmosphere during the 1800s.
“But the early onset of warming detected in this study indicates the Earth’s climate did respond in a rapid and measureable way to even the small increase in carbon emissions during the start of the Industrial Age,” Dr McGregor said.
The researchers also studied major volcanic eruptions in the early 1800s and found they were only a minor factor in the early onset of climate warming.
Associate Professor Abram said the earliest signs of greenhouse-induced warming developed during the 1830s in the Arctic and in tropical oceans, followed soon after by Europe, Asia and North America.
However, climate warming appears to have been delayed in the Antarctic, possibly due to the way ocean circulation is pushing warming waters to the North and away from the frozen continent.
Reference:
Nerilie J. Abram, Helen V. McGregor, Jessica E. Tierney, Michael N. Evans, Nicholas P. McKay, Darrell S. Kaufman, Kaustubh Thirumalai, Belen Martrat, Hugues Goosse, Steven J. Phipps, Eric J. Steig, K. Halimeda Kilbourne, Casey P. Saenger, Jens Zinke, Guillaume Leduc, Jason A. Addison, P. Graham Mortyn, Marit-Solveig Seidenkrantz, Marie-Alexandrine Sicre, Kandasamy Selvaraj, Helena L. Filipsson, Raphael Neukom, Joelle Gergis, Mark A. J. Curran, Lucien von Gunten. Early onset of industrial-era warming across the oceans and continents. Nature, 2016; 536 (7617): 411 DOI: 10.1038/nature19082
Arctic Sunset. Taken in Tromsø Kommune, Troms Fylke Credit: P J Hansen/Flickr
Extreme global warming 252 million years ago caused a severe mass extinction of life on Earth. It took life up to 9 million years to recover. New study finds clues in the Arctic as to why this recovery took so long.
96 percent of marine species, and 70 percent of terrestrial life died off in the Permian-Triassic extinction event, as geologists know it. It is also known as The Great Dying Event for obvious reasons.
“The mass extinction was likely triggered by a explosive event of volcanic eruptions in what is now Siberia. These eruptions lasted for a million years and emitted enormous amounts of volatiles, such as carbon dioxide and methane, which made our planet unbearably hot.” says Jochen Knies, researcher at Centre for Arctic Gas Hydrate, Environment and Climate at UiT The Arctic University of Tromsø.
Life took an extraordinary amount of time to recover from this extinction, from 5 to 9 million years. Why recovery was so delayed, has remained a mystery.
Clues are in the Arctic
Knies is the co-author of a study in Geology that took to the Arctic to look for clues as to what limited return of life to world´s oceans. The results of the study illustrate potential long-term impacts on marine ecosystems in response to global warming.
“What used to be the northwestern continental margin of the supercontinent Pangaea is now Canadian High Arctic. There we found evidence in geological records for a significant nutrient gap during this period. This means that global oceans were severely poor in nutrients such as nitrogen,” says Knies.
This nutrient gap is most likely the result of extremely high ocean surface temperatures in the aftermath of the extinction.
Be cool — stay alive
Our oceans are not a single body of water. They are comprised of layers and boundaries based on temperature (thermocline) and nutrients (nutricline) among others.
“The high temperatures caused deepening of the thermocline and nutricline in the ocean so that upwelling of nutrients from the bottom to the surface of ocean ceased. With that the marine algae productivity was stalled,” according to Knies.
And without algae, which are the base of the food chain, the life in the ocean did not thrive.
Once oceans finally started cooling 6-7 million years after the extinction, nutrient rich waters returned.
“The boundaries that kept the nutrients from reaching the surface were weakened and the ocean waters were mixed. This caused the upwelling of nutrients, resuscitating the oceans, and leading to an explosion of life. The ecosystem voids created by the worst mass extinction in Earth history were finally filled.” states Jochen Knies.
In many ways the Permian-Triassic mass extinction reset the evolution of life, and paved the way for evolution of dinosaurs. They, in turn, died off in another mass extinction 66 million years ago. Today some scientists argue that we are facing a new mass extinction period, mostly caused by human activities.
Reference:
Stephen E. Grasby, Benoit Beauchamp, Jochen Knies. Early Triassic productivity crises delayed recovery from world’s worst mass extinction. Geology, 2016; 44 (9): 779 DOI: 10.1130/G38141.1
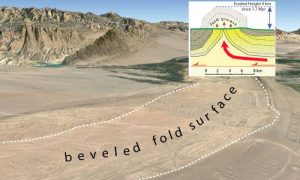
In China’s Tarim Basin, the entire top of a fold has been beveled from bottom of the image up to the water gap where the river cuts through. Credit: Digiglobe Image Landsat/Google
Sometimes the answers to our most persistent questions are found in the most unexpected places. Just ask Douglas Burbank.
After working in China for more than a decade, the UC Santa Barbara earth science professor and his graduate students finally confirmed how the Tarim Basin’s unusual topography was formed. And they did it from 6,000 miles away, in a laboratory in Minnesota.
Despite lying in arid desert and being the site of rapidly growing, elongated folds of stratified rock called anticlines, the Tarim Basin region features huge flat surfaces that have been beveled across the tops of those folds. The folds are caused by the ongoing convergence between India and Asia. Some anticlines have risen 3 miles in less than 2 million years—the blink of an eye in geologic time. And despite the desert climate and rapid uplift, huge expanses—hundreds of square miles—have been beveled by rivers. Today these rivers lie in narrow gorges cut across these growing folds.
So how did they erode such huge areas in the recent past, geologically speaking?
To answer that question, graduate student and lead author Aaron Bufe turned to St. Anthony Falls Laboratory (SAFL) in Minneapolis. There, with SAFL director and co-author Chris Paola, Bufe built a 160-square-foot stream table that could progressively “grow” a mechanically driven fold across which small “rivers” flowed, causing erosion. The experiment simulated conditions believed to be the cause of the beveling—the most recent episode of which occurred during the period of deglaciation following the last Ice Age, about 18,000 years ago. The researchers’ findings appear in the journal Nature Geoscience.
“The beveling has been pulsed through time, so we think that it was climatically modulated,” co-author Burbank explained. “When there is more discharge of sediment and water in the rivers, that’s when the beveling had to take place. But it had to be incredibly powerful and effective because of the huge areas—up to 77 square miles on a single fold—that were eroded.”
This erosion was so effective due to a process called channel switching. When the fluctuating flow of heavy sediment gets trapped in the channel and the river floods again, the water is diverted by the trapped sediment, so it moves laterally into another area.
“This sort of channel switching had to happen at a prolonged, rapid and spatially large scale for it to jump across and be able to erode such broad beveled zones,” Burbank said. “We hypothesized that when there was more sediment, the channel switched positions more often and therefore a larger fraction of the fold was beveled off.”
To test the hypothesis, Bufe designed an experiment to better understand how this process could occur and what combination of uplift rate, sediment flux, water flux and channel mobility could enable such erosion. During the up to 100 hours that a single experiment ran, the fold mechanism was incrementally cranked up as water ran over it. Every hour, the flow was stopped and the topography scanned with lasers to produce highly accurate measurements. Photos were taken every minute and analyzed by computer code that distinguished among wet sand, dry sand and water in order to track the shifting of the channels and how much of the area was beveled off through time.
“Our theory posited that the degree of fold beveling—rather than being simply incised vertically by the ‘river’—would be determined by the amount of channel mobility, how rapidly the channels switched back and forth across the stream table,” Burbank said. “Moreover, we thought that this mobility was likely to be a function of the sediment-to-water ratio: More sediment would cause more rapid channel shifting. And in fact, this is what the experiments showed.”
Reference:
Aaron Bufe et al. Fluvial bevelling of topography controlled by lateral channel mobility and uplift rate, Nature Geoscience (2016). DOI: 10.1038/ngeo2773
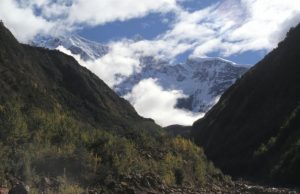
Namche Barwa in the eastern Himalayas viewed from the west. Credit: Jean-Pierre Burg, ETH Zurich
Earth’s climate interacts with so called surface processes — such as landslides or river erosion — and tectonics to shape the landscape that we see. In some regions, the sheer force of these processes has led scientists to believe that they may even influence the development of tectonics. An international team of researchers headed by the Cologne-based geographer Dr. Georgina King have now disproved this assumption. The results of their study, “Northward migration of the eastern Himalayan syntaxis revealed by OSL-thermochronometry,” will appear in Science on 19 August 2016.
In the eastern Himalaya, mountains exceeding 7,000 meters are coincident with extremely powerful rivers such as the Yarlung-Tsangpo, which is known as the “Everest of Rivers” and runs through the deeply incised Tsangpo gorge. “In this region the dramatic topography coupled with highly erosive rivers means that if surface processes can control tectonics, we should be able to record it here,” says King.
Dr. Georgina King heads the luminescence laboratory at the University of Cologne’s Institute of Geography. She and her team used a new technique called luminescence thermochronometry to measure the cooling histories of rocks as they move towards the Earth’s surface (exhumation). Their research revealed that surface processes do not control the location of tectonic deformation, but rather are responding to changing tectonics. The team measured the most recent stages of exhumation, that is, the final 1-2 km of the Earth’s crust, which have risen to the surface over approximately the past 1 million years. In geological terms this is a quite recent period. The results show that in this time period, the rate of exhumation in the northward part of the eastern Himalayas increased.
The scientists compared this record to plausible climatic and tectonic explanations. Using their data and data from other studies, they were able to show that this increased exhumation rate reflected tectonic changes and associated changes in river shape. “Our findings fit very well with previous hypotheses for this region, namely that there is tectonic, rather than climatic control over the pattern of erosion rates,” King notes.
Since surface processes can also influence the carbon cycle, this new research technique can also make valuable contributions to climate research. “As we improve our understanding of the role of surface processes in the dynamic evolution of mountains, it will give us insights into the associated carbon fluxes and how these influence global climate,” King concludes.
Reference:
G. E. King, F. Herman, B. Guralnik. Northward migration of the eastern Himalayan syntaxis revealed by OSL thermochronometry. Science, 2016; 353 (6301): 800 DOI: 10.1126/science.aaf2637
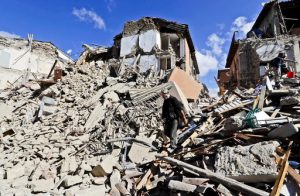
A man walks amid rubbles after an earthquake struck in Amatrice Italy, Wednesday, Aug. 24, 2016. The magnitude 6 quake struck at 3:36 a.m. (0136 GMT) and was felt across a broad swath of central Italy, including Rome where residents of the capital felt a long swaying followed by aftershocks.(AP Photo/Alessandra Tarantino)
The Latest on the earthquake in central Italy (all times local):
2:30 p.m.
A geologist in Poland says that the magnitude 6 earthquake in central Italy was caused by the slow but constant under-surface movement of the African Plate toward Europe.
Jerzy Zaba of the Silesian University in Katowice, in southern Poland, said Wednesday that a wedge-shaped front of the African Plate is pressing into the Eurasian Plate in the Adriatic Sea region and pushes into the neighboring regions, like Italy’s Apennine Mountains. The tension that accumulates leads to a sudden release in the form of under-surface rock movement that causes earth tremors.
Zaba told Polish PAP agency that the African Plate is moving northwards at the speed of up to 5 centimeters (2 inches) a year.
2:15 p.m.
A resident of the hamlet of Illica, north of hard-hit Amatrice, reached for a literary reference to describe the scene after the earthquake hit.
Agostino Severo, a Rome resident visiting Illica, said: “We came out to the piazza, and it looked like ‘Dante’s Inferno.’ People crying for help, help. Rescue workers arrived after one hour… one and a half hours.”
1:30 p.m.
The quake-hit Italian city of Amatrice is famed as the birthplace of one of the most famous Roman dishes: spaghetti all’amatriciana, a hearty dish of pasta made with bacon-like bits of cured pork jowl, pecorino cheese and tomato.
Amatrice, in fact, was due to have its annual festival honoring its namesake food on Aug. 27-28 in the historic center now rendered to rubble.
Legend has it that the amatriciana sauce was originally prepared only with the pork — known as guanciale — and sheep-milk pecorino available to peasants, and that tomatoes were added at a later date.
1:10 p.m.
The mayor of quake-devastated Amatrice says rescue teams are trying to reach all 69 hamlets around his central Italian city and that so far 17 deaths have been confirmed in Amatrice alone.
But Mayor Sergio Pirozzi tells The Associated Press: “I believe the number will rise.”
Pirozzi, wearing a blue sweatshirt with “Amatrice” on it, said he had given rescue teams indications of which hamlets might have people still trapped under debris.
Italy’s civil protection service says the preliminary toll from Wednesday’s 6 magnitude quake is 38.
12:30 p.m.
Italian Premier Matteo Renzi says the priority for the coming days is to rescue any survivors of the devastating earthquake and that he will head to the zone later in the day.
In brief remarks, Renzi thanked rescue workers who dug through debris, some with their bare hands, to reach residents crushed by their homes.
Renzi says that in times of trouble, Italy shows its true face. He says: “No family, no city, no hamlet will be left alone.”
12:20 p.m.
German leaders have offered condolences and assistance to Italy following the devastating earthquake.
Foreign Minister Frank-Walter Steinmeier said that “if it is wanted, we are of course ready to provide support.”
Chancellor Angela Merkel expressed “the deep sympathy of the German people” in a message Wednesday to Italian Premier Matteo Renzi. She wrote that “the pictures of the devastation are shocking.”
12:05 p.m
French President Francois Hollande is offering Italy “all the help that might be necessary” after the deadly earthquake in Umbria.
Calling it a “terrible tragedy” in a statement after a special security meeting Wednesday, Hollande offered the support of “all the French people.” He didn’t elaborate on what help France is offering.
11:59 a.m.
The European Union’s top crisis management official says Italy has requested satellite images of earthquake-hit parts of the country as Rome tries to establish the scope of the damage.
Commissioner Christos Stylianides said Wednesday that the EU emergency response center is in contact with Italian civil protection authorities to see what additional help might be required.
Stylianides conveyed the EU’s condolences and expressed solidarity with Italy, saying that its “thoughts are also with the first responders and all those involved in the rescue operations.”
11:55 a.m.
Italy’s civil protection agency says at least 37 people have died in the magnitude 6 quake that struck central Italy.
The agency, which is coordinating the rescue effort, gave the preliminary toll as rescue teams continued to claw through debris in hard-hit towns.
Previously, reports and officials had said at least 23 were dead.
11:15 a.m.
Israel’s leader says he has offered Italy rescue assistance following the magnitude 6 earthquake that shook the country.
A statement from the office of Prime Minister Benjamin Netanyahu on Wednesday says he offered the help to his Italian counterpart Matteo Renzi. The statement says he sends his condolences to the people of Italy.
Italy and Israel are close allies. Israel often offers and sends rescue assistance to countries that have experienced temblors.
11:05 a.m.
Italy’s forestry police say they have extracted dozens of people alive from hard-hit Pescara del Tronto in Italy’s Le Marche region, but rescue crews still haven’t reached the nearby hamlet of Peracchia di Acqua Santa Terme.
The forestry police joined Italian carabinieri, firefighters, civil protection crews, Red Cross workers, army and Alpine troops in the rescue effort in towns hit by the magnitude 6 quake in central Italy. Pescara del Tronto was one of the hardest-hit towns, along with Accumoli and Amatrice.
10:50 a.m.
Residents say another town in central Italy has been devastated by the 6 magnitude quake: Pescara del Tronto in the province of Ascoli Picenza, in eastern Le Marche region.
The ANSA news agency reported 10 dead there, but there was no official confirmation.
The main road into and out of the town was covered in debris, making rescue difficult; residents were digging their neighbors out by hand. Photos taken from the air by regional firefighters showed much of the tiny town essentially flattened
10:40 a.m.
Pope Francis has skipped his catechism lesson during his Wednesday general audience and instead led pilgrims in praying the rosary for the victims of Italy’s earthquake.
Holding a rosary in his right hand, Francis told the crowd that he was stunned by the devastation of the magnitude 6 temblor that struck central Italy early Wednesday. He said he wanted to express his pain and solidarity with the victims.
The crowd in St. Peter’s Square recited the prayer along with him.
7 a.m.
The ANSA news agency says two bodies have been pulled from the rubble of quake-hit Amatrice in central Italy after a strong quake levelled buildings as residents slept.
Many buildings in center of Amatrice were razed by the 6.1 magnitude quake, which struck at 3:36 a.m. Wednesday. As dawn broke, residents with shovels and emergency workers with bulldozers were beginning to try to reach people trapped under the debris and clear blocked roads.
The two bodies mark the first known victims of the quake, although the mayor of the other hard-hit town of Accumoli, Stefano Petrucci, says a family of four is buried without any signs of life.
6:15 a.m.
The mayor of the quake-hit town of Accumoli says a family of four has been located under the debris of a collapsed building and but there are no signs of life.
Mayor Stefano Petrucci told state-run RaiNews24 that there was also another victim in the town, which is close to the epicenter of Italy’s 6.1 magnitude quake.
Officials say Accumoli and Amatrice have been the hardest hit by the quake. Residents across a broad swath of central Italy felt the temblor, which struck at 3:36 a.m. and sent people running into the streets.
5 a.m.
The mayor of the Umbrian town of Amatrice, hit hard by the 6.1 magnitude quake, says residents are buried under the debris of collapsed buildings and that “the town isn’t here anymore.”
Sergio Pirozzi told state-run RAI radio and Sky TG24 that he needs heavy equipment to clear rubble-clogged streets to get to the injured.
Asked if there were any dead he said: “Look there are houses that aren’t here anymore. I hope we get some help.”
The quake struck central Italy, near Rieti, shortly after 3:30 a.m. and was followed by several aftershocks.
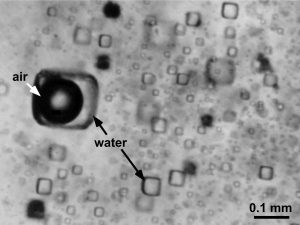
Microscopic view of halite (i.e. salt) with cubic fluid inclusions containing trapped ancient water and air. Credit: Kathleen Benison
Ancient air trapped in rock salt for 813 million years is changing the timeline of atmospheric changes and life on Earth.
Defining past atmospheric compositions is an important yet daunting task for geologists. Most methods for determining past Earth surface conditions rely on indirect proxies gleaned from ancient sedimentary rocks. Further complicating matters, sedimentary rocks are notoriously difficult to date because they contain remnants of other rocks formed at various times.
As a result, oxygenation, or the rise of oxygen in the Earth’s atmosphere, has been presumed to occur about 550 million years ago near the boundary between the Precambrian and Paleozoic geologic periods.
West Virginia University geologist Kathleen Benison is part of a research team using new direct methods to measure the Earth’s oxygenation.
The team’s study identifies, for the first time, exactly how much oxygen was in Earth’s atmosphere 813 million years ago — 10.9 percent. This finding, they say, demonstrates that oxygenation on Earth occurred 300 million years earlier than previously concluded from indirect measurements.
“Diversity of life emerges right around this time period,” Benison said. “We used to think that to have diversity of life we needed specific things, including a certain amount of oxygen. (The findings) show that not as much oxygen is required for organisms to develop.”
Fluid inclusions, the microscopic bubbles of liquids and gases in rock salt, can contain trapped air. Analysis of this trapped air allows researchers to understand past surface conditions and how oxygen has changed over the course of geologic history.
The team used a quadrupole mass spectrometer to study the air pockets. Carefully crushing minute rock salt crystals released water and gases into the mass spectrometer, which then analyzed for various compounds of oxygen and other gases.
“There are a lot of different environmental conditions specific from the past that we can find occurring in modern samples,” Benison said. “This tells us about the range of conditions on Earth and also has implications for Mars.”
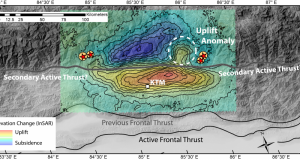
The earthquake uplifted the foothills around Kathmandu (KTM) (warm colors) and down-dropped the High Himalaya (cool colors), except for the highlighted uplift anomaly associated with slip on the secondary thrust. Elevation change determined by InSAR. Epicenters of the mainshock and three large aftershocks shown with red stars. Credit: Arizona State University
The earthquake triggered numerous rock slides and avalanches, including one that obliterated the mountain village of Langtang, leaving few survivors. Elsewhere, entire villages were flattened by intense shaking, leaving thousands of people homeless and many hundreds missing.
“The days immediately after the earthquake were intense. We were very stressed by the rising death toll, and concerned for the many Nepalese guides and researchers we had worked with over the years,” Whipple said.
Despite the well-known association between seismic activity and mountain ranges, the Gorkha earthquake actually worked against long-term mountain building by uplifting the foothills and down-dropping the mountains. By studying this event and its counter-intuitive outcome, ASU researchers shed new light on the mechanisms of mountain building.
Building Earth’s highest mountain range
The Himalaya, the most dramatic mountain range on Earth, is a manifestation of the ongoing collision between India and Asia. Exactly how the Himalaya were built, however, has long been debated.
The conundrum is that major thrust faults that accommodate convergence between tectonic plates are usually relatively flat, tilted no more than a few degrees from horizontal, and thus do not produce much uplift.
How, then, can we explain the existence of dramatic mountain ranges like the Himalaya?
Some collisional mountain ranges grow because there are “ramps” or steep segments on major thrust faults that produce the rock uplift that builds high topography.
In the Himalaya, the region of high topography is set back some 80 kilometers north of the active frontal thrust, leading to the conventional wisdom that the Himalaya grow by slip on a ramp beneath the High Himalaya. Whipple and colleagues realized that the Gorkha earthquake, while tragic, provided an opportunity to test this hypothesis.
Satellite data provide clues to how the Himalayas were built
Even when seismic ruptures occur ~10 kilometers beneath the surface, as was the case of the Gorkha event, an earthquake causes patterns of deformation (uplift, subsidence and lateral shifts) that can reveal the geometry of the fault surface, or surfaces, involved.
Using data from Global Positioning System (GPS) stations and Interferometric Synthetic Aperture Radar (InSAR) images collected during successive satellite fly-overs, ASU researchers were able to measure changes in surface elevation during a time period spanning the main Gorkha event, and several major aftershocks, with centimeter accuracy.
“Within hours of the event, it was clear from seismic data that the main rupture had occurred on a gently sloping thrust fault, but just 10 days later InSAR data was suggesting a more complex scenario—and a possible resolution of an old debate,” said Whipple.
ASU researchers modeled these changes to show that the major active thrust fault remains relatively flat underneath the High Himalaya, inconsistent with the existence of the ramp often hypothesized to explain uplift of the range. This is fundamentally why the Gorkha earthquake actually uplifted the foothills and down-dropped the mountains.
So how are the Himalaya built?
With the newly collected data, the researchers could see, in exquisite detail, physical evidence of a likely secondary rupture during the earthquake and its aftershocks that actually uplifted a portion of the High Himalaya northeast of Kathmandu. The secondary fault implicated is directly analogous to the fault responsible for the devastating 2005 Kashmir earthquake that claimed more than 85,000 lives in Pakistan.
It appears that slip on this structure, and perhaps others like it, may contribute more to the continued growth of the mountains than large ruptures on the main active thrust fault. Interestingly, steep secondary thrusts may develop in response to rapid erosion focused in the High Himalaya.
Ultimately, these findings not only provide a greater understanding of the mountain building process, they also may help anticipate seismic hazards in advance of devastating earthquakes by improving our ability to remotely identify active faults.
“To those that live at the foot of the Himalaya and other tectonically active mountain ranges, understanding the seismic hazard is of tantamount importance,” said Whipple.
Reference:
Kelin X. Whipple et al, Active shortening within the Himalayan orogenic wedge implied by the 2015 Gorkha earthquake, Nature Geoscience (2016). DOI: 10.1038/ngeo2797
KAUST researchers at the site of the volcanic unrest in Harrat Lunayyir, Saudi Arabia. The team believes that fracturing and subsidence on the surface caused by magmatic activity below actually prevented a volcanic eruption taking place in 2009. Credit: Sabrina Metzger
A rare period of volcanic unrest in the rural Harrat Lunayyir region of Saudi Arabia in 2009 allowed researchers at King Abdullah University of Science and Technology (KAUST) to piece together details of how activity within the crust can interact with the land surface. These insights may help inform predictions for regions under threat of potential volcanic activity, such as the Saudi city of Medina.
The movement of magma beneath the Earth’s surface increases the chances of earthquakes and volcanic activity and can trigger significant land surface deformation. Such activity largely occurs where continental plates are separating, which usually occurs deep under the sea where it is difficult to monitor the activity. As a result, scientists are unsure precisely how magmatic activity, faults and surface stresses interact.
“The short but intense period of earthquake activity in Harrat Lunayyir led to the evacuation of 40,000 people,” explained Sigurjón Jónsson from the University’s Physical Science and Engineering Division. Jónsson worked on the project with KAUST Ph.D. graduate Wenbin Xu and scientists from Italy. “After six weeks of increasing earthquakes the area went quiet—the magmatic activity had stalled and no eruption occurred, but we didn’t know why.”
Jónsson’s team used interferometric synthetic aperture radar (InSAR) satellite images and found a few snapshots of the area taken during the six weeks. Although these were not all high-resolution pictures, they were sufficient to begin to unravel what had happened.
The images revealed fracturing and faulting on the land surface and the formation of a “grabe”—a wedge-shaped piece of land that had subsided between two fault lines. Jónsson’s team also visited the site to observe the deformation first-hand.
“By enhancing the InSAR data, we generated computer models to verify what happened beneath the surface,” Jónsson said. “Our results show that a dike a few meters thick—molten magma rising in a vertical sheet through cracks in the rocks—came within two kilometers of the surface in the first month. The dike then rapidly increased in volume over a few days and came within a kilometer of the surface. The associated stresses formed the graben.”
The researchers replicated the scenario in a sandbox experiment and found an artificial dike created the same surface deformation patterns. Interestingly, the team believes that the stresses caused by the graben and faulting actually caused the dike to stall, preventing a volcanic eruption.
This study provides a rare insight into subsurface and surface interactions during volcanic unrest and could inform predictions for other geologically-active areas.
Reference:
Wenbin Xu et al. Graben formation and dike arrest during the 2009 Harrat Lunayyir dike intrusion in Saudi Arabia: Insights from InSAR, stress calculations and analog experiments, Journal of Geophysical Research: Solid Earth (2016). DOI: 10.1002/2015JB012505
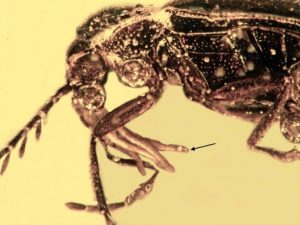
This is a fossil ptilodactyline beetle found in amber from Mexico. The black arrow points to pollinia attached to the beetle’s mouthparts. Credit: Entomological Society of America
When most people hear the word “pollinator,” they think of bees and butterflies. However, certain beetles are known to pollinate plants as well, and new fossil evidence indicates that they were doing so 20 million years ago.
A new study in American Entomologist by George Poinar, Jr. (Oregon State University) describes beetles found in fossilized amber with orchid pollen in their mouthparts.
“My paper points out that beetles may play a more important role in pollinating orchids than originally thought, and that they have been doing so for some 20 million years,” Poinar said.
Some present-day beetles use orchids for nectar, but no fossil evidence has ever been found showing beetles in the evolutionary past pollinating orchids — until now.
The first specimen was a hidden-snout beetle (subfamily Cryptorhynchinae) found in amber from the Dominican Republic. This Dominican specimen had pollinaria from an orchid described as Cylindrocites browni attached to its thorax. The other specimen was a toe-winged beetle (family Ptilodactylidae) that was found in amber from Mexico. This toe-winged beetle had pollinaria from an orchid described as Annulites mexicana attached to its mouthparts.
The beetle in Dominican amber was estimated to be from 20 to 45 million years old, and the beetle in Mexican amber was in strata estimated to be from 22 to 26 million years old.
While other beetles are known to pollinate plants, no current-day hidden-snout beetles have been seen visiting orchid plants, and no current-day toe-winged beetles have been seen with pollinaria.
According to Poinar, the reason may lie in the beetles’ secretive behavior, which makes it difficult to collect data about them.
“While no present-day cryptorhynchid weevils or ptilodactyline beetles are known to carry pollinaria, past and future collections of these and other beetles should be examined to search for attached pollinaria,” Poinar said. “Orchids may have evolved beneficial associations with a much wider range of beetles and other insects than we thought possible.”
Reference:
George Poinar. Beetles with Orchid Pollinaria in Dominican and Mexican Amber. American Entomologist, 2016; 62 (3): 172 DOI: 10.1093/ae/tmw055
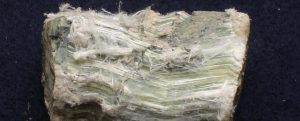
Chrysotile, one of the six types of asbestos. Credit: Eurico Zimbres/WikiMedia
A new study led by Scripps Institution of Oceanography at the University of California San Diego scientist Jane Willenbring challenges the long-held belief that asbestos fibers cannot move through soil. The findings have important implications for current remediation strategies aimed at capping asbestos-laden soils to prevent human exposure of the cancer-causing material.
Willenbring, along with University of Pennsylvania postdoctoral researcher Sanjay Mohanty, and colleagues tested the idea that once capped by soil, asbestos waste piles are locked in place. Instead they found that dissolved organic matter contained within the soil sticks to the asbestos particles, creating a change of the electric charge on the outside of the particle that allows it to easily move through the soil.
“Asbestos gets coated with a very common substance that makes it easier to move,” said Willenbring, an associate professor in the Geosciences Research Division at Scripps. “If you have water with organic matter next to the asbestos waste piles, such as a stream, you then have a pathway from the waste pile and possibly to human inhalation.”
Willenbring will present the new research during her presentation “The Fate of Asbestos in Soil: Remediation Prospects and Paradigms” at the 2016 American Chemical Society Meeting in Philadelphia on Monday, Aug. 22 at 2:10 p.m. in the Philadelphia Downtown Courtyard by Marriott Juniper’s Ballroom.
Asbestos is comprised of six naturally occurring minerals that are formed by thin fibers. Asbestos mining in the U.S. began in the late 19th century and was widely used in a variety of products from insulation to car brake pads.
The U.S. Environmental Protection Agency currently caps asbestos waste piles with soil to avoid human exposure to the toxic dust that causes a rare cancer called mesothelioma.
The National Institute of Environmental Health Sciences (NIEHS) Superfund Research Program funded the research.
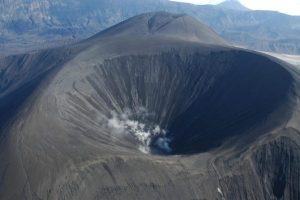
A team of scientists are using a process like a geological CAT scan to map the the inside of Okmok Volcano. Credit: Alaska Volcano observatory, USGS/Wikimedia Commons
In the rich volcanic landscape of the Aleutians, Okmok volcano on Umnak Island has drawn special attention this summer.
Matt Haney, a research geophysicist with the Alaska Volcano Observatory, is part of a team trying to create an image of the inside of Okmok. The process is like a geological CAT scan, mapping the earth rather than the body.
Last summer, the team set out an array of seismometers – sensors that pick up the same seismic waves that characterize earthquakes – on and around the volcano.
The seismometers measure how fast these waves travel through the earth, which gives scientists an idea of what kind of material, like magma, rocks, or groundwater, might make up the inside of Okmok.
Seismic waves travel faster through dense rock, and slower through liquids like magma and water.
“At Okmok, from previous work, we know there’s a shallow magma chamber,” Haney said. “So from these new data, we should see – are there other chambers deeper in the crust? What does it look like really deep?”
Haney hopes a clear image of the inside of Okmok will help us understand future eruptions.
In 2008, Okmok erupted in an entirely new way, breaking a historical pattern and surprising scientists.
The work done by Haney’s team might shed more light on that unusual eruption.
“Maybe by having an image of the deeper structure, we can see what is the driver of this change in eruptive activity,” he said. “Should we expect the next eruption to follow this new pattern, or will it return to the pattern it had before?”
Haney’s work at Okmok is only one of several studies conducted in the area this summer.
There’s also a team studying Mount Cleveland, and another group measuring tectonic tremors, a newly discovered type of earthquake, on Unalaska.
Haney says he hopes data can be shared across projects like these to create a more complete picture of the seismic environment in the Aleutians.
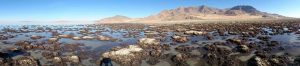
Microbialites are widespread in modern and fossil hypersaline environments, where they provide a unique sedimentary archive. Authigenic mineral precipitation in modern microbialites results from a complex interplay between microbial metabolisms, organic matrices and environmental parameters.
Here, we combined mineralogical and microscopic analyses with measurements of metabolic activity in order to characterise the mineralisation of microbial mats forming microbialites in the Great Salt Lake (Utah, USA). Our results show that the mineralisation process takes place in three steps progressing along geochemical gradients produced through microbial activity.
First, a poorly crystallized Mg-Si phase precipitates on alveolar extracellular organic matrix due to a rise of the pH in the zone of active oxygenic photosynthesis. Second, aragonite patches nucleate in close proximity to sulfate reduction hotspots, as a result of the degradation of cyanobacteria and extracellular organic matrix mediated by, among others, sulfate reducing bacteria.
A final step consists of partial replacement of aragonite by dolomite, possibly in neutral to slightly acidic porewater. This might occur due to dissolution-precipitation reactions when the most recalcitrant part of the organic matrix is degraded. The mineralisation pathways proposed here provide pivotal insight for the interpretation of microbial processes in past hypersaline environments.
Reference:
Aurélie Pace, Raphaël Bourillot, Anthony Bouton, Emmanuelle Vennin, Serge Galaup, Irina Bundeleva, Patricia Patrier, Christophe Dupraz, Christophe Thomazo, Pierre Sansjofre, Yusuke Yokoyama, Michel Franceschi, Yannick Anguy, Léa Pigot, Aurélien Virgone & Pieter T. Visscher (2016). Microbial and diagenetic steps leading to the mineralisation of Great Salt Lake microbialites. Scientific Reports, 31495. DOI:10.1038/srep31495.
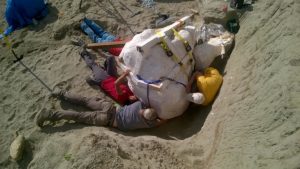
Paleontologists prepare to remove a Tyrannosaurus rex skull from a fossil dig site in northern Montana and transport it to the Burke Museum at the University of Washington. Credit: Dave DeMar/Burke Museum/University of Washington
Paleontologists with the Burke Museum of Natural History and Culture and the University of Washington have discovered a Tyrannosaurus rex, including a very complete skull. The find, which paleontologists estimate to be about 20 percent of the animal, includes vertebrae, ribs, hips and lower jaw bones.
The team, led by Burke Museum Adjunct Curator of Vertebrate Paleontology and UW biology professor Gregory P. Wilson, discovered the T. rex during an expedition to the Hell Creek Formation in northern Montana — an area that is world-famous for its fossil dinosaur sites. Two Burke Museum paleontology volunteers, Jason Love and Luke Tufts, initially discovered pieces of fossilized bone protruding from a rocky hillside. The bones’ large size and honeycomb-like structure indicated they belonged to a carnivorous dinosaur. Upon further excavation, the team discovered the T. rex skull along with ribs, vertebrae, and parts of the jaw and pelvis.
T. rex was one of the largest meat-eating dinosaurs to ever roam Earth. Measuring an average of 40-feet long and 15 to 20-feet tall, T. rex was a fierce predator with serrated teeth and large jaws. Fossil evidence shows it ate other dinosaurs like Edmontosaurus and Triceratops, with crushed bones from the animals even showing up in the its fossilized poop. T. rex lived about 66-68 million years ago in forested river valleys in western North America during the late Cretaceous Period.
The T. rex found by the Burke/UW team is nicknamed the “Tufts-Love Rex” in honor of the two volunteers who discovered it. The skull is about 4 feet long weighs about 2,500 pounds in its protective plaster jacket. Excavation in the field revealed the right side of the skull from base to snout, including teeth. Burke paleontologists believe it is very probable the other side of the skull is present, but will need to carefully remove the rock surrounding the fossil before they can determine its completeness.
“We think the Tufts-Love Rex is going to be an iconic specimen for the Burke Museum and the state of Washington and will be a must-see for dinosaur researchers as well,” said Wilson.
Based on the size of its skull, Burke paleontologists estimate this dinosaur is about 85 percent the size of the largest T. rex found to date. At the hips, the T. rex would have been nearly as tall as a city bus, and as long as a bus from tail to head.
The Tufts-Love Rex is 66.3 million years old. T. rex lived at the end of the Cretaceous Period, 145-66 million years ago, and became extinct during the Cretaceous-Paleogene mass extinction 66 million years ago. Burke paleontologists could determine that the Tufts-Love Rex lived at the very end of the Cretaceous because it was found at the bottom of a hill; a rock layer at the top of that hill marks the Cretaceous-Paleogene mass extinction. Based on the size of the skull — a good indicator of T. rex age — the team estimates the dinosaur was about 15 years old when it died. Adult T. rex lived up to 25-30 years.
Although arguably the most iconic and well-known dinosaur, T. rex fossils are rare. This remarkable find is one of only about 25 of this level of completeness. The skull is the 15th reasonably complete T. rex skull known to exist in the world. Next summer, Burke paleontologists will search for additional parts of the dinosaur at the site.
More than 45 people helped excavate the T. rex over the course of a month this summer. The team was collecting fossils in the area for the Hell Creek Project, a multi-disciplinary project examining vertebrates, invertebrates, plants and geology of the area to learn more about the final 2 million years of the dinosaur era, the mass-extinction event that killed off the dinosaurs, and the first 1.5 million years post-extinction that gave rise to the age of mammals. The project, currently led by Wilson, was founded by Jack Horner and Nathan Myhrvold. Burke paleontologists, volunteers, undergraduate and graduate students from the UW and other universities and K-12 educators participating in the Burke’s DIG Field School contribute to the project.
“This is really great news. The Hell Creek Project is responsible for finding the most T. rex specimens in the world, with 11 to date,” said Myhrvold, Intellectual Ventures CEO and Paleontologist. “The T. rex has always been my favorite dinosaur and I’m really pleased that this one is going to make its home at the Burke Museum.”
“Having seen the ‘Tufts-Love Rex’ during its excavation I can attest to the fact that it is definitely one of the most significant specimens yet found, and because of its size, is sure to yield important information about the growth and possible eating habits of these magnificent animals,” said Horner, former curator of paleontology at the Museum of the Rockies and current Burke Museum research associate.
The T. rex skull and other bones are currently covered in a plaster jacket — similar to a cast used to cover a broken bone — in order to protect the skull during transport. The public can see the plaster-covered T. rex skull, along with other T. rex fossils and paleontology field tools, in a lobby display at the Burke Museum from August 20 to October 2. Special T. rex-themed activities will take place over Labor Day Weekend and on Sunday, September 25.
After removing the fossil from display, the Burke’s paleontology team will begin preparing the fossil by removing the rock surrounding the bone, which may take a year or more. The museum plans to display the T. rex skull in the New Burke Museum when it opens in 2019.
Note: The above post is reprinted from materials provided by University of Washington. The original item was written by Andrea Godinez.
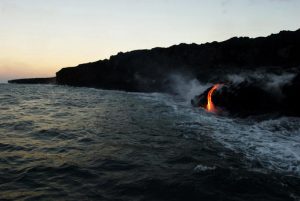
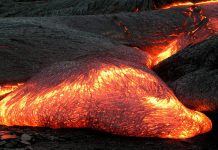
In this Tuesday, Aug. 9, 2016 photo, lava from Kilauea, an active volcano on Hawaii’s Big Island, flows into the ocean as seen from a boat operated by Lava Ocean Tours off the coast of Volcanoes National Park near Kalapana, Hawaii. The current lava flow erupted from a vent on the volcano in May and made its way to the sea in late July. Visitors can hike about 10 miles round trip to see the lava flow, or take a boat or helicopter tour to see the flow. (AP Photo/Caleb Jones)
For the first time in three years, lava from a volcano on Hawaii’s Big Island has crept down miles of mountainside and is dripping into the Pacific Ocean, where it’s creating new land and putting on a crackling, hissing, fire-spitting show.
Thousands of visitors from around the world have swarmed Volcanoes National Park by land, sea and air to take in the spectacle.
The billowy, bright-orange lava pops and sizzles, and reeks of sulfur and scorched earth, as it oozes across rugged terrain and eventually off a steep seaside cliff. When the hot rocks hit the water, they expel plumes of steam and gas—and sometimes explode, hurling chunks of searing debris.
The 2,000-degree molten rock is from Kilauea, one of the world’s most active volcanoes. Its Puu Oo vent began erupting in the 1980s and periodically pushes enough lava seaward that people can access it.
Reaching the latest flow requires a boat, a helicopter or strong legs—the hike to the entry point, where the lava meets the sea, is 10 miles roundtrip on a gravel road surrounded by miles of treacherous, hard lava rock.
Pablo Aguayo, of Santiago, Chile, took a sunrise boat tour of the flow earlier this month.
“It’s pretty amazing,” he said. “You start in the middle of the ocean in the darkness, and you end up in this beautiful lava falls.”
Aguayo said he could feel the lava’s heat, and it smelled “super funny.”
“It’s like welding something,” he said. “We have many volcanoes back home in Chile. We have plenty. But nothing like this.”
His tour boat was a 42-foot aluminum catamaran operated by Lava Ocean Tours owner Shane Turpin, who said he navigates to within a few yards of the entry point for the best view.
On Aug. 9, a second branch of lava started to spill into the sea, giving Turpin’s passengers a look at two lava flows about 200 yards apart.
“Just to have one drip (of lava) touching the ocean is awesome,” Turpin said as people snapped photos of the dual flows. “But to get a show like you’re getting this morning, well, it sets the bar pretty high for a second trip.”
Volcanoes National Park has seen an increase of about 1,000 to 1,500 visitors per day since the current lava flow reached the sea in late July, boosting attendance to about 6,000 people daily, officials said.
Park spokeswoman Jessica Ferracane warns the area can be dangerous.
Hikers can get close enough that the soles of their shoes get hot. Also, the area is flanked by hardened lava rock as sharp as glass. Many people have suffered lacerations while trying to cross the jagged landscape, Ferracane said.
“Everybody wants to see the lava flow, but not everybody should be hiking out there,” she said.
Additionally, when the lava touches the ocean, it reacts with the saltwater and produces harmful hydrochloric acid, which wafts into the air, said Janet Babb, a U.S. Geological Survey geologist at the Hawaiian Volcano Observatory.
The lava then quickly solidifies and creates a new landscape. According to the U.S. Geological Survey, the Puu Oo vent alone has created about 500 acres of new land since it began erupting a few decades ago. The latest flow, which began in May, has created about 8 new acres.
Most of Kilauea’s activity has been nonexplosive, but a 1924 eruption spewed ash and 10-ton rocks into the sky and left a man dead.
Puu Oo’s 1983 eruption resulted in lava fountains soaring over 1,500 feet high. In the decades since, the lava flow has buried 48 square miles of land and destroyed many homes.
In 2008, after a series of small earthquakes rattled the island, Kilauea’s summit crater opened and gushed lava and rock over 75 acres of the mountain, damaging a nearby visitor overlook.
It’s hard to predict when the volcano will inflate or when the current flow will stop, Babb said. It could slow down any day or keep cascading into the sea for months.
Note: The above post is reprinted from materials provided by The Associated Press.
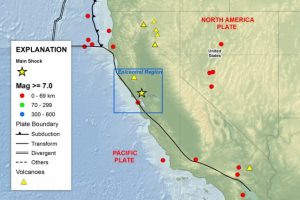
A map shows the location of the August 24, 2014 earthquake just south of Napa, California. In a new report, scientists from MIT and elsewhere detail how, even after the earthquake’s main tremors and aftershocks died down, earth beneath the surface was still actively shifting and creeping — albeit much more slowly — for at least four weeks after the main event. Credit: Gareth Funning/University of California, Riverside
Nearly two years ago, on August 24, 2014, just south of Napa, California, a fault in the Earth suddenly slipped, violently shifting and splitting huge blocks of solid rock, 6 miles below the surface. The underground upheaval generated severe shaking at the surface, lasting 10 to 20 seconds. When the shaking subsided, the magnitude 6.0 earthquake—the largest in the San Francisco Bay Area since 1989—left in its wake crumpled building facades, ruptured water mains, and fractured roadways.
But the earthquake wasn’t quite done. In a new report, scientists from MIT and elsewhere detail how, even after the earthquake’s main tremors and aftershocks died down, earth beneath the surface was still actively shifting and creeping—albeit much more slowly—for at least four weeks after the main event. This postquake activity, which is known to geologists as “afterslip,” caused certain sections of the main fault to shift by as much as 40 centimeters in the month following the main earthquake.
This seismic creep, the scientists say, may have posed additional infrastructure hazards to the region and changed the seismic picture of surrounding faults, easing stress along some faults while increasing pressure along others.
The scientists, led by Michael Floyd, a research scientist in MIT’s Department of Earth, Atmospheric and Planetary Sciences, found that sections of the main West Napa Fault continued to slip after the primary earthquake, depending on the lithology, or rock type, surrounding the fault. The fault tended to only shift during the main earthquake in places where it ran through solid rock, such as mountains and hills; in places with looser sediments, like mud and sand, the fault continued to slowly creep, for at least four weeks, at a rate of a few centimeters per day.
“We found that after the earthquake, there was a lot of slip that happened at the surface,” Floyd says. “One of the most fascinating things about this phenomenon is it shows you how much hazard remains after the shaking has stopped. If you have infrastructure running across these faults—water pipelines, gas lines, roads, underground electric cables—and if there’s this significant afterslip, those kinds of things could be damaged even after the shaking has stopped.”
Floyd and his colleagues, including researchers from the University of California at Riverside, the U.S. Geological Survey, the University of Leeds, Durham University, Oxford University, and elsewhere, have published their results in the journal Geophysical Research Letters.
Right time, right place
Floyd and co-author Gareth Funning, of UC Riverside, have been studying fault motions in northern California for the past seven years. When the earthquake struck, at about 3:20 a.m. local time, they just happened to be stationed 75 miles north of the epicenter.
“At the time, I did stir, thinking, ‘C’mon, go back to sleep!'” Floyd says. “When we woke up, we turned on the news, figured out what happened, and immediately got back in our cars, picked up the instruments we had in the field, drove down the freeway to American Canyon, and started to put out instruments at sites we had measured just a few weeks before.”
Those instruments made up a network of about a dozen GPS receivers, which the team placed on either side of the fault line, as close to the earthquake’s epicenter as they could. They left most of the instruments out in the field, where they recorded data every 30 seconds, continuously, for three weeks, to observe the distance the ground moved.
“The key difference between this study and other studies of this earthquake is that we had the additional GPS data very close to the epicenter, whereas other groups have only been able to access data from sites farther away,” Floyd says. “We even had one point that was 750 meters from the surface rupture.”
Creeping faults, silent shadows
The team combined its GPS data with satellite measurements of the region to reconstruct the ground movements along the fault and near the epicenter in the weeks following the main earthquake. They found that the fault continued to slip—one side of the fault sliding past the other, like sandpaper across wood—at a steady rate of several centimeters per day, for at least four weeks.
“The widespread and rapid afterslip along the West Napa Fault posed an infrastructure hazard in its own right,” the authors write in the paper. “Repeated repairs of major roads crosscut by the rupture were required, and in some areas, water pipes that survived the [main earthquake] were subsequently broken by the afterslip.”
The earthquake and the afterslip took many scientists by surprise, as seismic data from the area showed no signs of movement along the fault prior to the main shock.
“I think we need to be more alert to the possibility that even faults without previously known surface fault creep may respond differently for reasons of material properties in the near surface geology,” says James Lienkaemper, a researcher with the United States Geological Survey at Menlo Park, California, who was not involved in the study. “We need to be aware that afterslip can occur in circumstances not previously expected.”
Regarding the afterslip’s possible effects on surrounding faults, the researchers found that it likely redistributed the stresses in the region, lessening the pressure on some faults. However, the researchers note that the afterslip may have put more stress on one particular region near the Rodgers Creek Fault, which runs through the city of Santa Rosa.
“Right now, we don’t think there’s any significantly heightened risk of quakes happening on other nearby faults, although the risk always exists,” Floyd says.
Curiously, the scientists identified a large region beneath the West Napa Fault, just northwest of Napa, which they’ve dubbed the “slip and aftershock shadow”—a zone that was strangely devoid of any motion during both the earthquake and afterslip. Floyd says this shadow may indicate a buildup in seismic pressure.
“The fact that nothing happened there is almost more cause for concern for us than where things actually happened,” Floyd says. “It would produce a fairly small quake if that area was to rupture, but there’s just no knowing if it would continue on to start something more.”
Floyd says that in developing seismic hazard assessments, it’s important to consider afterslip and slowly creeping faults, which occur often and over long periods of time following the more obvious earthquake.
“There are some earthquakes where we think we might be seeing some activity even 15 years after the main quake,” Floyd says. “So the more examples of an earthquake happening followed by afterslip that we can study, the better we can understand the entire process.”
This research was supported, in part, by NASA and the National Science Foundation.