Researchers are exploring a blue hole in the waters of the Paracel Islands in the South China Sea. Data obtained by an underwater robot showed the hole is about 984 feet deep, making it the deepest blue hole ever to be discovered. (July 28)
Door to Hell “Gate to Hell”
The “Door to Hell” is a natural gas field in Derweze, Turkmenistan, that collapsed into an underground cavern in 1971, becoming a natural gas crater. Geologists set it on fire to prevent the spread of methane gas, and it has been burning continuously since then. The diameter of the crater is 69 metres (226 ft), and its depth is 30 metres (98 ft).
The crater is a popular tourist attraction. In the past five years 50,000 tourists have visited the site. The gas crater has a total area of 5,350 m2, the size of an American football field. The surrounding area is also popular for wild desert camping.
Amazing ‘Smiling Volcano’ in Hawaii
The active volcano Kilauea on the south of Hawaii Island erupted on Friday, forging a smiley face from lava bursting from the volcano’s crater.
The last time Kilauea erupted was in 2013, when the lava flowed down the volcano and reached the Pacific Ocean just one day after erupting for the first time in nearly three years, vaporing mass amount of steams before becoming new “ground.”
Courtesy: Paradise Helicopters / Photo credit: Kawika Singson
Video: Cave of Crystals “Giant Crystal Cave”
Cave of the Crystals or Giant Crystal Cave is a cave connected to the Naica Mine 300 metres (980 ft) below the surface in Naica, Chihuahua, Mexico.
One of the world’s most spectacular geographical discoveries was the cave of giant crystals with its selenite crystals of a size never seen before. most of them measure six meters in length, with some of them reaching eleven meters. the temperature at this depth varies from 45°C to 50°C, while the percentage of humidity ranges from 90 to 100%, meaning that human beings cannot survive there for longer than two hours.
Read More: Cave of Crystals “Giant Crystal Cave”
One vent just isn’t enough for some volcanoes
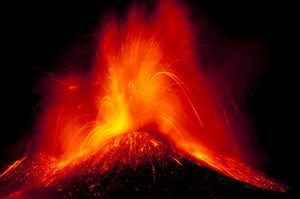
Volcanoes are geology at its most exciting. They seem so fiery, dangerous and thrillingly explosive. That may be true, but most old and mature volcanoes are surprisingly stuck in their ways and even if when they will blow is difficult to forecast, where they will blow from is often more predictable.
The majority of volcanoes look as they do in a child’s drawing; like a steep mountain with its head cut off. They have a summit crater and, if they erupt, it is from this rocky orifice that lava and ash spews. But this is not the case with Mount Etna on the Island of Sicily, Italy, a study published in the open-access journal Frontiers in Earth Science found.
Etna has been collecting new summits as though they are Pokémon. It is as if the mountain has had an outbreak of acne, with multiple cones forming in a geologically short space of time. According to Professor Valerio Acocella, of Roma Tre University and his colleagues from Ingv Catania, this makes Etna “perfect for study.”
Valerio and his fellow researchers have been using data collected over the past ten years from thermal imaging satellites, ground measurements and onsite monitoring of the volcano to document its unruly behavior and try and work out why it has more vents than most volcanoes.
Valerio claims that “the fact that Etna is continuously active allows us to capture many evolutionary processes, within a decade or less, which, at any other volcano would (only) be seen over much larger spans of decades or centuries.” As a consequence, “Etna is probably one of the best monitored and studied volcanoes in the world.”
The team observed how over the past few decades eruptions have moved from a central crater to a new one developed to its south, before that too was soon abandoned and another cone, to the southeast, quickly formed and rose to dominance. The researchers attribute this wandering eruptive activity to an instability on the volcano’s eastern flank.
It is as if the mountain is suffering subsidence, with the weight of the summit being undercut by the movement of the volcano’s lower portion to the east. This is causing new stresses and pressures to the structure as a whole. But this is more than just an academic study seeking to understand the history of a world famous and fascinating volcano.
Being able to calculate where and when Etna might erupt in the future is of pivotal importance to the people who live near it. Valerio and his colleagues warn that the new zones of weakness recently formed on the volcano summit may result from these processes and may an increase the chance of volcanic eruptions and landslide hazards.
Reference:
Valerio Acocella, Marco Neri, Boris Behncke, Alessandro Bonforte, Ciro Del Negro, Gaetana Ganci. Why Does a Mature Volcano Need New Vents? The Case of the New Southeast Crater at Etna. Frontiers in Earth Science, 2016; 4 DOI: 10.3389/feart.2016.00067
Note: The above post is reprinted from materials provided by Frontiers.
A rare small specimen discovered from the age of flying giants
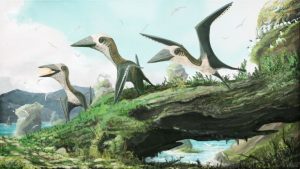
A rare small-bodied pterosaur, a flying reptile from the Late Cretaceous period approximately 77 million years ago, is the first of its kind to have been discovered on the west coast of North America.
Pterosaurs are the earliest vertebrates known to have evolved powered flight.
The specimen is unusual as most pterosaurs from the Late Cretaceous were much larger with wingspans of between four and eleven metres (the biggest being as large as a giraffe, with a wingspan of a small plane), whereas this new specimen had a wingspan of only 1.5 metres.
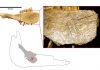
The fossils of this animal are the first associated remains of a small pterosaur from this time, comprising a humerus, dorsal vertebrae (including three fused notarial vertebrae) and other fragments. They are the first to be positively identified from British Columbia, Canada and have been identified as belonging to an azhdarchoid pterosaur, a group of short-winged and toothless flying reptiles which dominated the final phase of pterosaur evolution.
Previous studies suggest that the Late Cretaceous skies were only occupied by much larger pterosaur species and birds, but this new finding, which is reported in the Royal Society journal Open Science, provides crucial information about the diversity and success of Late Cretaceous pterosaurs.
Lead author of the study Elizabeth Martin-Silverstone, a Palaeobiology PhD Student at the University of Southampton, said: “This new pterosaur is exciting because it suggests that small pterosaurs were present all the way until the end of the Cretaceous, and weren’t outcompeted by birds. The hollow bones of pterosaurs are notoriously poorly preserved, and larger animals seem to be preferentially preserved in similarly aged Late Cretaceous ecosystems of North America. This suggests that a small pterosaur would very rarely be preserved, but not necessarily that they didn’t exist.”
The fossil fragments were found on Hornby Island in British Columbia in 2009 by a collector and volunteer from the Royal British Columbia Museum, who then donated them to the Museum. At the time, it was given to Victoria Arbour, a then PhD student and dinosaur expert at the University of Alberta. Victoria, as a postdoctoral researcher at North Carolina State University and the North Carolina Museum of Natural Sciences, then contacted Elizabeth and the Royal BC Museum sent the specimen for analysis in collaboration with Dr Mark Witton, a pterosaur expert at the University of Portsmouth.
Dr Witton said: “The specimen is far from the prettiest or most complete pterosaur fossil you’ll ever see, but it’s still an exciting and significant find. It’s rare to find pterosaur fossils at all because their skeletons were lightweight and easily damaged once they died, and the small ones are the rarest of all. But luck was on our side and several bones of this animal survived the preservation process. Happily, enough of the specimen was recovered to determine the approximate age of the pterosaur at the time of its death. By examining its internal bone structure and the fusion of its vertebrae we could see that, despite its small size, the animal was almost fully grown. The specimen thus seems to be a genuinely small species, and not just a baby or juvenile of a larger pterosaur type.”
Elizabeth Martin-Silverstone added: “The absence of small juveniles of large species — which must have existed — in the fossil record is evidence of a preservational bias against small pterosaurs in the Late Cretaceous. It adds to a growing set of evidence that the Late Cretaceous period was not dominated by large or giant species, and that smaller pterosaurs may have been well represented in this time. As with other evidence of smaller pterosaurs, the fossil specimen is fragmentary and poorly preserved: researchers should check collections more carefully for misidentified or ignored pterosaur material, which may enhance our picture of pterosaur diversity and disparity at this time.”
Reference:
Elizabeth Martin-Silverstone, Mark P. Witton, Victoria M. Arbour, Philip J. Currie. A small azhdarchoid pterosaur from the latest Cretaceous, the age of flying giants. Royal Society journal Open Science, 2016 DOI: 10.1098/rsos.160333
Note: The above post is reprinted from materials provided by University of Southampton.
Life thrived on young Earth: scientists discover 3.7 billion year old fossils
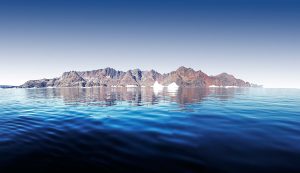
In an extraordinary find, a team of Australian researchers have uncovered the world’s oldest fossils in a remote area of Greenland, capturing the earliest history of the planet and demonstrating that life on Earth emerged rapidly in the planet’s early years.
Led by the University of Wollongong’s (UOW) Professor Allen Nutman, the team discovered 3.7-billion-year-old stromatolite fossils in the world’s oldest sedimentary rocks, in the Isua Greenstone Belt along the edge of Greenland’s icecap.
The findings are outlined in a study published in Nature, with co-authors Associate Professor Vickie Bennett from The Australian National University (ANU), the University of New South Wales’ (UNSW) Professor Martin Van Kranendonk, and Professor Allan Chivas, from UOW.
The discovery of the Isua stromatolite fossils provides a greater understanding of early diversity of life on Earth and researchers said could have implications for our understanding of life on Mars. Professor Nutman, from UOW’s School of Earth and Environmental Sciences, said the Isua stromatolite fossils predated the world’s previous oldest stromatolite fossils — which were found in Western Australia — by 220 million years.
The discovery pushes back the fossil record to near the start of Earth’s geological record and points to evidence of life on Earth very early in its history. The Isua stromatolites, which were exposed by the recent melting of a perennial snow patch, were laid down in shallow sea, providing the first evidence of an environment in which early life thrived.
For much of Earth’s history, life was just single cells, and stromatolite fossils are mounds of carbonate constructed by these communities of microbes.
“The significance of stromatolites is that not only do they provide obvious evidence of ancient life that is visible with the naked eye, but that they are complex ecosystems,” Professor Nutman said.
“This indicates that as long as 3.7 billion years ago microbial life was already diverse. This diversity shows that life emerged within the first few hundred millions years of Earth’s existence, which is in keeping with biologists’ calculations showing the great antiquity of life’s genetic code.”
Co-lead investigator Associate Professor Vickie Bennett, from ANU, said this study provided a new perspective into the history of Earth.
“This discovery turns the study of planetary habitability on its head,” Associate Professor Bennett said.
“Rather than speculating about potential early environments, for the first time we have rocks that we know record the conditions and environments that sustained early life. Our research will provide new insights into chemical cycles and rock-water-microbe interactions on a young planet.”
Professor Martin Van Kranendonk, Director of the Australian Centre for Astrobiology at UNSW, of which Professor Nutman is also an Associate Member, said it was a groundbreaking find that could point to similar life structures on Mars, which 3.7 billion years ago was a damp environment.
“The structures and geochemistry from newly exposed outcrops in Greenland display all of the features used in younger rocks to argue for a biological origin,” Professor Van Kranendonk said.
“This discovery represents a new benchmark for the oldest preserved evidence of life on Earth. It points to a rapid emergence of life on Earth and supports the search for life in similarly ancient rocks on Mars.”
The investigation, conducted by the Australian science team in collaboration with a UK partner, was funded by a grant from the Australian Research Council.
Reference:
Allen P. Nutman, Vickie C. Bennett, Clark R. L. Friend, Martin J. Van Kranendonk, Allan R. Chivas. Rapid emergence of life shown by discovery of 3,700-million-year-old microbial structures. Nature, 2016; DOI: 10.1038/nature19355
Note: The above post is reprinted from materials provided by University of Wollongong.
An exceptional palaeontological site going back 100,000 years is unearthed in Arrasate
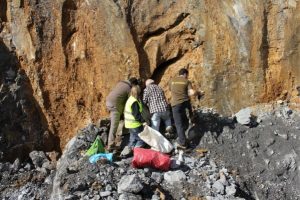
A multidisciplinary UPV/EHU team made up of researchers from the Department of Geography, Prehistory and Archaeology and from the Department of Stratigraphy and Palaeontology has presented the discovery of the new Artazu VII site located in the Kobate Quarry in Arrasate.
The site was discovered in 2012 by quarry workers after carrying out a blasting operation. When they spotted the presence of a great many fossil remains in the clay that filled the cave, they halted the works and contacted Prof Alvaro Arrizabalaga of the Department of Geography, Prehistory and Archaeology. After confirming the importance of the site, Alvaro Arrizabalaga and Maria Jose Iriarte decided in 2013 to carry out an emergency excavation in collaboration with the company exploiting the quarry to retrieve the bone remains in the context at the site named Artazu VII.
In the Cantabrian Region and on the Iberian Peninsula there are very few sites belonging to the Upper Pleistocene such as Artazu VII without signs of human activity. And even fewer with such an abundance and wealth of species in an exceptional state of preservation and in which a multidisciplinary study has been conducted like the one being carried out in this project. The discovery of this site has been published in the journal Comptes Rendus Palevol led by the pre-doctoral researcher Aitziber Suárez-Bilbao, who is currently writing up her thesis at the UPV/EHU.
The Pleistocene is a critical phase in human history. Specifically, this epoch is characterised by the fact that it saw various climate changes on a global as well as regional scale. Artazu VII is of interest because it is a chasm which at the time functioned as a natural trap into which various animals fell by chance. This fact means this site is of great palaeontological and palaeoecological interest. This is because it is an accumulation produced not by human beings or by any other biological agent, and so the faunal assemblage retrieved has not been biased by the trophic appetites of any organism. In other words, the reason for the build-up of the bone remains was the accidental falling of organisms into a chasm, and not the accumulation of the remains of organisms hunted by a predator. So the assemblage retrieved reflects in a more precise way the fauna in the area at the moment when the chasm was filled. Therefore, the use of precise bioindicators at this site is enabling high resolution palaeoecological and palaeoenvironmental work to be carried out.
In the preliminary study published in the international journal, the taxonomic list numbers at least 40 species, including micro- and macro-vertebrates present at Artazu VII. Furthermore, most of the remains have been recovered whole or with post-depositional fractures and many of the bones have been preserved in anatomical connection. So the presence of species that are currently extinct or which today are absent because they have shifted geographically has been confirmed in the surroundings of Arrasate during a period dating back 100,000 years ago. The appearance of the following stand out: the cave lion (Panthera spelaea) and the leopard (Panthera pardus) among the carnivores, and the steppe bison (Bison priscus) and the red deer (Cervus elaphus) among the angulates. The research conducted so far on the micro-vertebrates (mammals, amphibians and reptiles) has confirmed a series of warm events at the moment the chasm at Artazu VII was filled.
The study of this site is part of the PhD thesis by the geologist Aitziber Suárez at the UPV/EHU-University of the Basque Country and supervised by Dr Alvaro Arrizabalaga and Dr Xabier Murelaga. The scientific nature and previous experience of the members that make up the research team is allowing a novel, integral study to be made. The main aims of the study are to carry out combined geological analyses (Sedimentology and Stratigraphy) of a palaeontological nature of the macrofauna and microfauna (Palaeobiology and Palaeoecology) and of a geochemical nature (Palaeodiets and fauna migrations) and thus enable a detailed palaeoenvironmental reconstruction of this site to be produced. Other researchers from different institutions have also collaborated in the paper published: Jone Castaños, Naroa Garcia and Maria Jose Iriarte of the UPV/EHU, Pedro Castaños of the Aranzadi Society of Sciences, and José Eugenio Ortiz and Trinidad Torres of the Polytechnic University of Madrid (UPM).
Reference:
Aitziber Suárez-Bilbao, Naroa Garcia-Ibaibarriaga, Jone Castaños, Pedro Castaños, María-José Iriarte-Chiapusso, Álvaro Arrizabalaga, Trinidad Torrese, José Eugenio Ortiz, Xabier Murelaga. A new Late Pleistocene non-anthropogenic vertebrate assemblage from the northern Iberian Peninsula: Artazu VII (Arrasate, Basque Country). Comptes Rendus Palevol, 2016; DOI: 10.1016/j.crpv.2016.05.002
Note: The above post is reprinted from materials provided by University of the Basque Country.
Fossil pollen ‘sneeze’ caught by research team
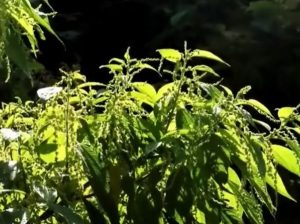
Like capturing a sneeze, researchers including a University of Guelph scientist have recorded the only known example of prehistoric pollen caught in explosive mid-discharge from a fossil flower.
The team describes this “freeze-frame” fossilized pollen release — preserved in amber more than 20 million years ago — in a paper describing a new genus of fossil nettle plants.
The researchers captured on camera pollen explosions.
The paper is co-authored by Peter Kevan, emeritus professor in the School of Environmental Sciences. It appears in the journal Botany alongside another paper by a second team that also includes the U of G researcher.
That second paper looks at a modern-day plant relative in Latin America that is surprising researchers with its use of explosive pollen release, a fair-weather dispersal method seemingly ill-suited to its home in humid tropical rainforests.
In their fossil paper, Kevan and his co-authors describe a new genus (Ekrixanthera, meaning “explosive anther”) containing two new species of extinct plants related to modern-day nettles.
These fossil plants were preserved during the mid-Tertiary period, said Kevan. By then, dinosaurs were long-extinct and non-human mammals roamed Earth.
The samples came from the Dominican Republic and Mexico.
One Mexican sample has preserved pollen grains caught in mid-discharge from the male plant’s anther.
This pollen burst normally takes less than one-tenth of a second, said Kevan. “It’s remarkable that it was captured. It’s like catching a sneeze.”
He was asked to help identify the plants by lead author George Poinar Jr., an expert on amber fossils at Oregon State University.
“We ended up with the new genus because the flowers do not match those of any modern species,” said Kevan. “This tells us something about how old that group of plants is, and that this pollination mechanism goes back a long way.”
That form of pollen dispersal is also described in the second paper about modern-day tropical nettles. Boehmeria caudata grows from southern North America to northern Argentina.
Explosive pollen release is “something you don’t expect in the rainforest. Pollen blasted into the air is likely to get rained out.”
Most tropical plants rely instead on such creatures as insects, bats and birds rather than wind pollination, said Kevan.
In this group of nettles, the male plant disperses its pollen during short dry periods. Even during the rainy season, short sunny periods of high heat and low humidity trigger pollen release.
Drying causes parts of its stamens to shrink unevenly. Physical tension ruptures the anther to release an explosive burst of pollen.
That quick-release mechanism propels pollen into air currents and allows the male flowers to react to short-term weather conditions.
Kevan’s co-authors are students at the University of Sao Paulo led by Paula Maria Montoya-Pfeiffer. They studied Boehmeria during a pollination course taught in Brazil by Kevan in late 2014.
He and colleagues have taught that course in several Latin American countries for decades.
Reference:
George Poinar, Peter G. Kevan, Betsy R. Jackes. Fossil species in Boehmerieae (Urticaceae) in Dominican and Mexican amber: a new genus (Ekrixanthera) and two new species with anemophilous pollination by explosive pollen release, and possible lepidopteran herbivory1. Botany, 2016; 94 (8): 599 DOI: 10.1139/cjb-2016-0006
Note: The above post is reprinted from materials provided by University of Guelph.
Sediments control methane release to the ocean
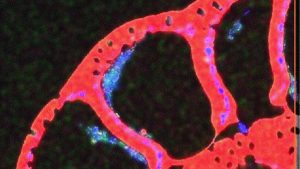
Methane is stored under the sea floor, concentrated in form of hydrates, crystalline ice structures that stay stable under high pressure and in low temperatures.
Several studies suggest that as the ocean warms, the hydrates might melt and potentially release methane into the ocean waters and atmosphere. This potent climate gas is profusely leaking from the seafloor in an area offshore western Svalbard, which is close to the gas hydrate stability zone.
There, scientists have discovered over 250 methane flares in water depths from 90 to 240 meters.
“Previous studies indicate that these seeps could be linked to gas hydrate dissociations. We suspected that dissociation of gas hydrate is not the primary control on seafloor methane seepage. We suggest that there is a strong lithological control on methane seepage.” says Dr. Giuliana Panieri, scientist at CAGE.
Lithology is physical characteristics of a given geological feature, such as texture, composition or size of the grains in a sediment.
Giuliana Panieri is the first author of a study published in Geochemistry, Geophysics, Geosystems. The study examines geochemistry of foraminifera and other proxies as a record of methane seepage in an area of ongoing ocean warming.
Hydrates destabilised as the ice retreated
The study focused on two cores that were collected from sediments at present day seeps off Western Svalbard. There methane hydrate is hypothesised to have destabilised within the last 30 years.
“ In addition two other cores were collected from shallower water depths, which would have been within the stability zone for gas hydrate in the past, As the last ice age ended, some 11000 years ago, the hydrates that were stable under the ice sheets for millennia started to dissolve as the ice sheets disappeared. Methane would have leaked out at some point in this location after the last glacial maximum. But we found no evidence of past methane seepage within the foraminifera tests and other proxies in sediments recovered from cores at the shallower depths,” says Panieri.
Foraminifera are single celled organisms that can be found in all the oceans in the world. If you have walked on a beach, the odds are that you have been walking on billions upon billions of foraminifera tests.
These tests are extremely sensitive to environmental changes. By reading the isotopic composition of the fossilised tests, the scientists can determine whether methane was released when the test was forming or immediately after.
In addition to foraminifera Panieri and her colleagues studied sediment geochemistry and magnetic susceptibility in the four sediment cores they collected in the area.
Sediments stand in the way
This implies that melting of gas hydrate is not the primary control on seafloor methane seepage on the upper continental margin.
“We suggest that there is a strong lithological control on methane seepage. This means that the sediment lithology determines whether the methane will escape or not.“ says Panieri.
A more extensive coring survey is required to determine if seafloor seepage of methane has always been absent at these water depths. Also more seismic surveys need to be conducted to determine the links between the sediment properties and the gas migration pathways.
“As Arctic Ocean bottom waters continue to warm, such surveys are imperative to calculate the potential for methane release to the water column possibly due to melting of the hydrate.”
Reference:
Giuliana Panieri, Carolyn A. Graves, Rachael H. James. Paleo-methane emissions recorded in foraminifera near the landward limit of the gas hydrate stability zone offshore western Svalbard. Geochemistry, Geophysics, Geosystems, 2016; 17 (2): 521 DOI: 10.1002/2015GC006153
Note: The above post is reprinted from materials provided by University of Tromso (Universitetet i Tromsø – UiT).
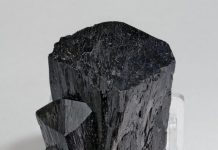
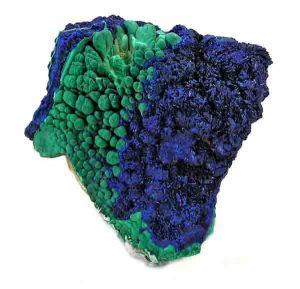
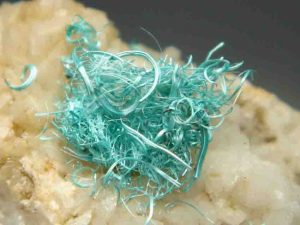
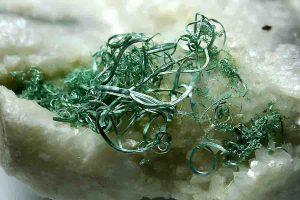
Malachite

Formula: Cu2CO3(OH)2
System: Monoclinic
Colour: Bright green, with …
Lustre: Adamantine, Vitreous, Silky, Dull, Earthy
Hardness: 3½ – 4
Name: Named in antiquity (see Pliny the Elder, 79 CE) molochitus after the Greek μαλαχή, “mallows,” in allusion to the green color of the leaves. Known in the new spelling, malachites, at least by 1661.
Locality: Nizhne-Taglisk, Ural Mountains, Russia.
System: Monoclinic
Colour: Bright green, with …
Lustre: Adamantine, Vitreous, Silky, Dull, Earthy
Hardness: 3½ – 4
Name: Named in antiquity (see Pliny the Elder, 79 CE) molochitus after the Greek μαλαχή, “mallows,” in allusion to the green color of the leaves. Known in the new spelling, malachites, at least by 1661.
Locality: Nizhne-Taglisk, Ural Mountains, Russia.
Malachite is a copper carbonate hydroxide mineral, with the formula Cu2CO3(OH)2. This opaque, green banded mineral crystallizes in the monoclinic crystal system, and most often forms botryoidal, fibrous, or stalagmitic masses, in fractures and spaces, deep underground, where the water table and hydrothermal fluids provide the means for chemical precipitation. Individual crystals are rare but do occur as slender to acicular prisms. Pseudomorphs after more tabular or blocky azurite crystals also occur.
Physical Properties of Malachite
Cleavage: {201} Perfect, {010} Fair
Color: Green, Dark green, Blackish green.
Density: 3.6 – 4, Average = 3.8
Diaphaneity: Translucent to subtranslucent to opaque
Fracture: Uneven – Flat surfaces (not cleavage) fractured in an uneven pattern.
Hardness: 3.5-4 – Copper Penny-Fluorite
Luminescence: Non-fluorescent.
Luster: Vitreous – Silky
Streak: light green
Photos


Feeling the force between sand grains
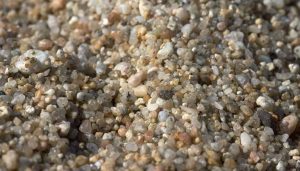
For the first time, Lawrence Livermore National Laboratory (LLNL) researchers have measured how forces move through 3D granular materials, determining how this important class of materials might pack and behave in processes throughout nature and industry.
Granular materials such as sand, rice and soil exist everywhere around us. However, scientists and engineers do not yet fully understand how external forces move through these materials. The ability to quantify that force transmission is missing, yet critical in efforts to predict material behavior.
Using X-ray diffraction, computed tomography and new mathematical analysis, the team measured how forces move through a slowly compressed, opaque 3D granular material. The new technique confirmed that forces move spatially through granular materials in patterns that agree with theory and simulations, and tend to behave more uniformly as load is increased.
“Understanding how forces move through granular materials is important for building models and predicting the behavior of geologic materials such as sands and soils (e.g., when they fracture and flow during hydraulic fracturing and when they are penetrated to defeat buried enemy targets),” said Ryan Hurley, an LLNL scientist and lead author of the study appearing in the Aug. 19 edition of the journal, Physical Review Letters.
Hurley also said that the research is relevant to the packing properties of everything from pharmaceutical pills, food grains in silos and additive manufacturing powders.
In their experiments, the researchers found that the various mathematical tools scientists use to understand these patterns are incomplete and often conflicting.
“The research sets the stage for further characterizing forces in larger 3D granular systems under more varied loading conditions,” Hurley said. “This characterization will enable more predictive modeling of processes throughout nature and industry.”
Note: The above post is reprinted from materials provided by DOE/Lawrence Livermore National Laboratory.
Seeing inside an ancient Australian Indigenous artefact non-invasively
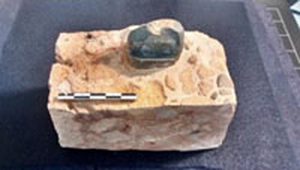
Nuclear techniques have allowed archaeologists to see into an embedded section of an ancient Australian Indigenous stone artefact non-invasively—suggesting important information about its origin and use.
ANSTO instrument scientist Floriana Salvemini used neutron tomography on Dingo to reconstruct high resolution images of an artefact that was found by archaeologists embedded in a limestone reef on Barrow Island, off the northwest coast of Western Australia.
The stone tool was made of chert, an ‘exotic lithic’ which is high in silica and not found on Barrow Island. This led researchers from the University of Western Australia to deduce that it had come from the mainland, possibly transported by early Australians.
Dating of sediments from an overlying dune on Barrow Island undertaken at the University of Oxford provided an age estimate of 41,000 ka (years before the present time) for the chert.
The image reconstruction provided evidence of an absence of fractures on the surface of an embedded section of the core.
The authors, led by Ingrid Ward of the University of Western Australia, said the findings suggested that the chert had undergone some level of transport and/or exposure and weathering before it was embedded in the reef sometime been 41 ka and 14.5 ka.
Barrow Island was connected to the mainland by a land bridge until about 7.4 ka, when rising sea levels cut it off.
The study has published in the Journal of Archaeological Science: Reports.
The authors noted that it was unusual for a core to retain the amount of mass seen in this chert, let alone remain relatively unmodified.
In stone toolmaking, techniques are used to reduce sections from a core within a desirable raw material to fracture it into shell-like curves or shape the core itself into a tool.
The final product might be a flake, axe head, spear point, grinding tool or other functional stone implement.
A used core usually has characteristic marks on its surface, produced by the blows of a hammerstone or hollows where there were once sections of material.
Instead the investigated piece has very few signs of edge modification. This means it was probably lost early in its transport cycle to the island, likely from the Pilbara region, and incorporated into a sand body – to eventually become embedded in the calcarenite.
Dingo’s thermal neutrons probe can penetrate stone non-invasively while providing high resolution images of large samples. Because the chert and the limestone encasing absorb neutrons at different rates the two materials can be differentiated by neutron imaging.
“Neutron tomography is a powerful tool to study the inner structure and morphology of such rarely preserved artefacts without damaging them. By using complementary non-invasive methods, we were able to preserve the association between the artefact-archaeological unit and the connected interface layer for future investigations,” said Salvemini.
The paper authors note that there are only two other known embedded chert artefacts in Western Australia, one from Rottnest Island and another form Point Peron. Their future study can help researchers to understand more about early Australians.
Video
Reference:
I. Ward et al. 3D visualisation and dating of an embedded chert artefact from Barrow Island, Journal of Archaeological Science: Reports (2016). DOI: 10.1016/j.jasrep.2016.05.023
Note: The above post is reprinted from materials provided by Australian Nuclear Science and Technology Organisation (ANSTO).
300 Teeth: Duck-billed dinosaurs would have been dentist’s dream
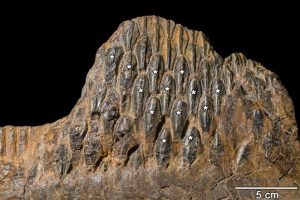
Imagine how much dental care you’d need if you had 300 or more teeth packed together on each side of your mouth.
Duck-billed dinosaurs (hadrosaurs), who lived in the Cretaceous period between 90 million and 65 million years ago, sported this unique dental system, which had never been fully understood until it was examined at the microscopic level through recent research conducted by Aaron LeBlanc, a University of Toronto Mississauga PhD candidate; his supervisor, Professor Robert Reisz, the University of Toronto Mississauga vice-dean, graduate, and colleagues at the Royal Ontario Museum and the Museum of the Rockies.
Rather than shedding teeth and replacing them with new ones like other reptiles, hadrosaurs’ mouths contain several parallel stacks of six or more teeth apiece, forming a “highly dynamic network” of teeth that was used to grind and shear tough plant material. Although hadrosaur teeth appear to be fused in place, LeBlanc and his colleagues show that the newest teeth were constantly pushed towards the chewing surface by a complex set of ligaments. When viewed under the microscope, the columns of teeth are not physically touching and are held together by the sand and mud that can get in between the teeth following the decay of the soft ligaments after the animals died.
“Hadrosaur teeth are actually similar to what we have because our teeth are not solidly attached to our jaws. Like us, hadrosaur teeth would have had some fine-scale mobility as they chewed thanks to this ligament system that suspended the teeth in place,” says Reisz.
As they reached the grinding surface, hadrosaur teeth were essentially dead, filled with hard tissue — unlike humans, whose teeth have an inner core filled with blood vessels and nerves.
“Since the teeth were already dead, they could be ground down to little nubbins,” Reisz says.
LeBlanc says this tooth structure — with its tough grinding surface — was “well-adapted to break down tough plant material for digestion,” through both shearing and grinding. This adaptation may have contributed to the hadrosaurs’ longevity and proliferation.
Reisz says that hadrosaurs had “probably the most complex dental system ever made.”
“It’s very elegant — not a single brick of teeth working as a solid unit,” he says. “It’s more like chain mail, providing flexibility as well as strength.”
LeBlanc notes that the duck-billed dinosaur has been known for over 150 years and its dental system has long been recognized as unique, but no one had taken a look inside it at the microscopic level previously. He created thin sections of entire dental assemblies from the upper and lower jaws, that he then ground down, polished and examined under a powerful microscope. Working with their museum colleagues, he and Reisz were also able to explore how hadrosaur teeth form in embryos and hatchlings, providing a more complete picture of this unique model of dental evolution and development.
“The amazing thing is how consistently these dental assemblies conform to our hypothesis of how the system works,” LeBlanc says. “Even in the youngest specimens, the same processes that maintained dental assemblies in the adults were visible.”
Reference:
Aaron R. H. LeBlanc, Robert R. Reisz, David C. Evans, Alida M. Bailleul. Ontogeny reveals function and evolution of the hadrosaurid dinosaur dental battery. BMC Evolutionary Biology, 2016; 16 (1) DOI: 10.1186/s12862-016-0721-1
Note: The above post is reprinted from materials provided by University of Toronto.
A Mammoth Undertaking
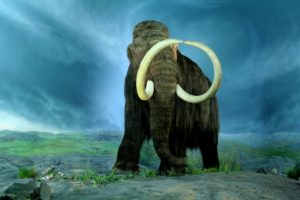
Can the woolly mammoth be brought back from the dead? Scientists say it’s only a matter of time.
In fact this year, the International Union for Conservation of Nature issued its first official set of guidelines on resurrecting extinct species. What’s more, university research labs and non-governmental agencies have projects in motion to bring back extinct species. But is all of this a good idea?
A new paper by UC Santa Barbara researchers explores de-extinction — the process of resurrecting an extinct species — as a potential win for conservation and suggests how to make it so.
In an analysis in the journal Functional Ecology, UCSB ecologist Douglas McCauley and colleagues recommend several ways in which the science of de-extinction would have to evolve in order to make it maximally benefit ecological communities and ecosystems.
“The idea of de-extinction raises a fundamental and philosophical question: Are we doing it to create a zoo or recreate nature?” said co-author Benjamin Halpern, director of UCSB’s National Center for Ecological Analysis and Synthesis. “Both are reasonable answers, but restoring species to a natural state will be a much, much harder endeavor. We offer guidelines for how to make ecological de-extinction more successful and how to avoid creating ‘eco-zombies.’ ”
Bringing back species useful for conservation requires big-picture thinking. For example, the grassland ecosystem in which the mammoth once lived looks totally different today. For a variety of reasons — human population expansion among them — some areas where these creatures once roamed cannot be restored to their former ecology.
“What some are proposing to do with de-extinction will be like manufacturing a part from the engine of a Model T and trying to shove it into a Tesla,” said lead author McCauley, an assistant professor in UCSB’s Department of Ecology, Evolution and Marine Biology. “You just can’t take a part and put it into a brand new system and expect it to work without considering how its ecological context has changed.
“Good conservation is a holistic science that acknowledges the fact that many species interact in complex ways,” McCauley added. “The rules in that complex web of life don’t stay static but evolve dynamically.”
The UCSB team developed three recommendations for restoring ecological function through de-extinction. The first suggests resurrecting recently extinct species rather than those that disappeared thousands of years ago. These creatures may fit more seamlessly into their ecosystems because there has been less time for change to occur. The researchers offer several examples of these “young” extinctions, including the Christmas Island pipistrelle bat, the Réunion giant tortoise and Australia’s lesser stick-nest rat.
Secondly, the group advises choosing animals whose ecological jobs are truly irreplaceable. For example, the Christmas Island pipistrelle bat was once the only insect-eating bat in its habitat. Its de-extinction would plug a hole in an ecosystem that nature would otherwise have a hard time filling.
Ditto for the Réunion giant tortoise, which dispersed seeds throughout its Indian Ocean island habitat before being driven extinct by hungry mariners. Those plants still exist, although they are moving closer to extinction without the tortoises to perform their ecological function as seed distributors.
The third guideline, according to co-author Molly Hardesty-Moore, a graduate student in McCauley’s lab, is to bring back species that can be restored to functionally meaningful abundance levels. “You need to have enough individuals to perform their function well enough to affect the ecosystem,” she said. “One wolf hunting and killing has minimal impact, but hundreds of wolves performing that function will change the ecosystem.”
Rather than oppose de-extinction outright, the UCSB scientists hope to start a conversation in the scientific community about how to make the process more ecologically smart. “Can we thoughtfully use this tool to do real conservation?” McCauley asked. “Answering that question is going to require a lot of perspectives, not only from the geneticists who are leading the process, but also from other types of scientists — ecologists, conservation biologists, ecosystem managers.”
Reference:
Douglas J. McCauley, Molly Hardesty-Moore, Benjamin S. Halpern, Hillary S. Young. A mammoth undertaking: harnessing insight from functional ecology to shape de-extinction priority setting. Functional Ecology, 2016; DOI: 10.1111/1365-2435.12728
Note: The above post is reprinted from materials provided by University of California – Santa Barbara. The original item was written by Julie Cohen.
Large-scale metamaterials combat earthquakes in 3-D model
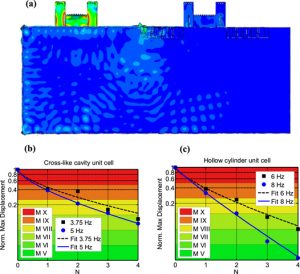
Numerical analysis considers both surface and guided waves, accounts for soil dissipation, and provides design guidelines for implementing earthquake protection using an array of ground-based cavities.
Metamaterials — artificial structures that exhibit extraordinary vibrational properties — could come to the rescue of regions threatened by earthquakes, according to new results published in the New Journal of Physics. The study, performed by researchers in Europe and involving detailed computer simulations, shows that large-scale metamaterials can attenuate the energy and amplitude of harmful low-frequency vibrations associated with seismic shocks.
Today, large structures such as bridges and office blocks are protected against earthquakes through vibration isolation strategies. However, these approaches can be difficult to implement retrospectively, especially in historical buildings, and only apply locally. Shielding vulnerable structures using large-scale metamaterials — which inhibit the propagation of incoming seismic waves through interference effects — could help to protect a much wider area without any direct modification to existing buildings in the region.
One of the simplest and most effective seismic shields proposed by the team involves digging 2-3 rows of equally spaced cross-shaped cavities in the ground. “The exact dimensions will depend on the soil type and the frequency range of the shield,” explained Marco Miniaci of the Universities of Torino and Le Havre. “For sandy conditions and low-frequency seismic excitations, the width, spacing and depth of the cavities, which should be lined with concrete to prevent the surrounding soil from collapsing, could reach 10 metres.”
To extend the performance of the protective structure, the group proposes adding a number of smaller cylindrical cavities measuring 2m in diameter. There are other tweaks that can be applied too. By scaling down the size of the array, the shield’s properties could be redirected towards similar problems occurring at higher frequency ranges. Scenarios include vibration prevention in the vicinity of high-speed train networks or heavy tramways. Blast protection could be another potential application.
“The next steps should involve experimental tests using scaled models in specialized geotechnical seismic and vibration labs,” said Miniaci. “This would provide further validation of the proposed structures and help to build on earlier work in the field.”
Other researchers contributing to the project include Anastasiia Krushynska and Federico Bosia of the University of Torino, and Nicola Pugno of the University of Trento, FBK Trento and Queen Mary University of London.
Reference:
Marco Miniaci, Anastasiia Krushynska, Federico Bosia, Nicola M Pugno. Large scale mechanical metamaterials as seismic shields. New Journal of Physics, 2016; 18 (8): 083041 DOI: 10.1088/1367-2630/18/8/083041
Note: The above post is reprinted from materials provided by IOP Publishing.
Post-disaster optimization technique capable of analyzing entire cities

Some problems, says Paolo Bocchini, cannot be solved through intuition.
“If you are trying to solve a problem that has, say, ten possible outcomes — you can probably find a way to figure out which one is optimal,” says Bocchini, assistant professor of civil and environmental engineering at Lehigh University. “But what if the possible solutions number as high as 10 to the 120th power?”
To illustrate the size of that figure, 10 to the 120th power, in long form, is written as a “1” followed by 120 zeroes.
That is the massive number of possible recovery options with which civic leaders and engineers would be faced in the aftermath of a major catastrophic event, such as a hurricane or an earthquake.
“In a post-disaster recovery period, there may be one, large, very important bridge to repair that would take as long as a year to restore to full functionality,” says Bocchini. “During that year, you could restore four smaller bridges which might have an even greater impact on getting the city back up and running. So, how do you figure out which choice is optimal?”
He adds: “Computational models that predict what might work for one bridge or five bridges, simply don’t work when you try to scale up to 100 bridges.”
To address this, Bocchini and his colleague Aman Karamlou, a doctoral assistant and structural engineering Ph.D. candidate, created a novel method that represents a major improvement in existing computational models and optimization methodologies. Their technique, Algorithm with Multiple-Input Genetic Operators — or AMIGO, for short — is described in a paper that was recently published in Engineering Structures.
Designed to consider very complex objectives while keeping computational costs down, AMIGO makes the search process more efficient and expedites the convergence rate (the speed at which the sequence approaches its limit). It does this by taking advantage of the additional data in the genetic operators which are used to guide the algorithm toward a solution.
In addition to being the first model to factor in so many elements, AMIGO is unique for its versatility.
“AMIGO takes the topology or characteristics of a network — as well as the damage — and then develops optimal recovery strategies. It can be used to solve a variety of scheduling optimization problems common in different fields including construction management, the manufacturing industry and emergency planning,” says Bocchini.
A San Diego simulation
To demonstrate the effectiveness of their algorithm, Bocchini and Karamlou conducted a large-scale numerical analysis using an imagined earthquake scenario in the City of San Diego, California.
They chose San Diego for the size of its transportation network — it contains 238 highway bridges — as well as its importance and value as a U.S. strategic port. The total value of the port’s imports and exports in 2013 has been estimated to be more than $7 billion.
The researchers identified the 80 bridges that would sustain the most serious damage based on the seismicity of the region, and used AMIGO to calculate the best restoration strategy.
In a post-disaster situation, after the initial emergency response, those responsible for the recovery of a city or region must plan a repair schedule that balances mid-term and long-term recovery goals. Because every action will have an impact on the recovery, the trade-offs of each possible action must be considered.
AMIGO is of the class of optimization solvers that uses what are called heuristic techniques and evolutionary algorithms that are inspired by the process of natural selection. These techniques are particularly useful for solving multi-objective optimization problems using a Pareto-based approach. The approach, which describes a method of assessing a set of choices, is named after Vilfredo Pareto (1848-1923), an Italian engineer and economist who used the concept in his studies of economic efficiency and income distribution.
While the total number of feasible solutions in the imagined San Diego bridge network restoration scenario is considerably large, the results show that AMIGO managed to find a set of near optimal Pareto solutions in a small number of trials (about 25 generations).
From the study: “Moreover, a new bridge recovery model is proposed. Compared to the previous studies, this recovery model is more realistic, as it takes advantage of the available restoration functions obtained by experts’ surveys and scaling factors that account for the bridge cost.”
The researchers compared the performance of their optimization formulation with their previous optimization techniques. The results show significant improvement both in terms of optimality of the solution and convergence rate.
“This is of great importance, since for large realistic networks, the traffic analysis procedure can be computationally very expensive,” they write. “Therefore, reducing the number of required generations for convergence can considerably affect the computational cost of the problem and make this approach finally applicable to real-size networks. Compared to previous formulations, the use of operational resource constraints and the new recovery model yield the generation of more realistic schedules.”
Restore power or fix roads? Addressing interdependencies
This paper was the first to be published under a project called Probabilistic Resilience Assessment of Interdependent Systems (PRAISys), a collaboration between Lehigh, Florida Atlantic University and Georgia State University. The team was awarded a grant of $2.2 million by the National Science Foundation (NSF) last year, as part of NSF’s $20 million investment in new fundamental research to transform infrastructure.” It is part of the Obama administration’s “Smart Cities” initiative to help communities tackle local challenges and improve city services.
The interdisciplinary Lehigh team — led by Bocchini and made of up of faculty members with specialties in civil engineering, systems engineering, computer science and economics — is looking at how interdependent systems work together during and after a disaster. The goal is to establish and demonstrate a comprehensive framework that combines models of individual infrastructure systems with models of their interdependencies for the assessment of interdependent infrastructure system resilience for extreme events under uncertainty using a probabilistic approach.
“In the post-disaster phase, leaders are faced with tough choices. The impact of each decision will affect so many other areas so it’s important to go beyond looking at one system — such as transportation — and look at how they all work together,” said Bocchini.
Reference:
Aman Karamlou, Paolo Bocchini. Sequencing algorithm with multiple-input genetic operators: Application to disaster resilience. Engineering Structures, 2016; 117: 591 DOI: 10.1016/j.engstruct.2016.03.038
Note: The above post is reprinted from materials provided by Lehigh University.
Scientists solve puzzle of converting gaseous carbon dioxide to fuel
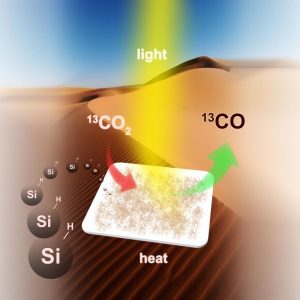
Every year, humans advance climate change and global warming — and quite likely our own eventual extinction — by injecting about 30 billion tonnes of carbon dioxide into the atmosphere.
A team of scientists from the University of Toronto (U of T) believes they’ve found a way to convert all these emissions into energy-rich fuel in a carbon-neutral cycle that uses a very abundant natural resource: silicon. Silicon, readily available in sand, is the seventh most-abundant element in the universe and the second most-abundant element in the earth’s crust.
The idea of converting carbon dioxide emissions to energy isn’t new: there’s been a global race to discover a material that can efficiently convert sunlight, carbon dioxide and water or hydrogen to fuel for decades. However, the chemical stability of carbon dioxide has made it difficult to find a practical solution.
“A chemistry solution to climate change requires a material that is a highly active and selective catalyst to enable the conversion of carbon dioxide to fuel. It also needs to be made of elements that are low cost, non-toxic and readily available,” said Geoffrey Ozin, a chemistry professor in U of T’s Faculty of Arts & Science, the Canada Research Chair in Materials Chemistry and lead of U of T’s Solar Fuels Research Cluster.
In an article in Nature Communications published August 23, Ozin and colleagues report silicon nanocrystals that meet all the criteria. The hydride-terminated silicon nanocrystals — nanostructured hydrides for short — have an average diameter of 3.5 nanometres and feature a surface area and optical absorption strength sufficient to efficiently harvest the near-infrared, visible and ultraviolet wavelengths of light from the sun together with a powerful chemical-reducing agent on the surface that efficiently and selectively converts gaseous carbon dioxide to gaseous carbon monoxide.
The potential result: energy without harmful emissions.
“Making use of the reducing power of nanostructured hydrides is a conceptually distinct and commercially interesting strategy for making fuels directly from sunlight,” said Ozin.
The U of T Solar Fuels Research Cluster is working to find ways and means to increase the activity, enhance the scale, and boost the rate of production. Their goal is a laboratory demonstration unit and, if successful, a pilot solar refinery.
Reference:
Wei Sun, Chenxi Qian, Le He, Kulbir Kaur Ghuman, Annabelle P. Y. Wong, Jia Jia, Abdinoor A. Jelle, Paul G. O’Brien, Laura M. Reyes, Thomas E. Wood, Amr S. Helmy, Charles A. Mims, Chandra Veer Singh, Geoffrey A. Ozin. Heterogeneous reduction of carbon dioxide by hydride-terminated silicon nanocrystals. Nature Communications, 2016; 7: 12553 DOI: 10.1038/ncomms12553
Note: The above post is reprinted from materials provided by University of Toronto.
Japan scientists detect rare, deep-Earth tremor
Scientists who study earthquakes in Japan said Thursday they have detected a rare deep-Earth tremor for the first time and traced its location to a distant and powerful storm.
The findings, published in the US journal Science, could help experts learn more about the Earth’s inner structure and improve detection of earthquakes and oceanic storms.
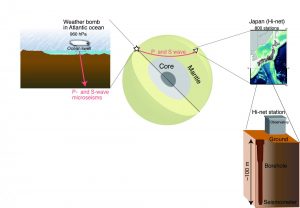
The storm in the North Atlantic was known as a “weather bomb,” a small but potent storm that gains punch as pressure quickly mounts.
Groups of waves sloshed and pounded the ocean floor during the storm, which struck between Greenland and Iceland.
Using seismic equipment on land and on the seafloor that usually detects the Earth’s crust crumbling during earthquakes, researchers found something they had not detected before—a tremor known as an S wave microseism.
Microseisms are very faint tremors.
Another kind of tremor, known as P waves, or primary wave microseisms, can be detected during major hurricanes.
P waves are fast-moving, and animals can often sense them just before an earthquake hits.
The elusive S waves, or secondary waves, are slower, and move only through rock, not liquid. Humans feel them during earthquakes.
Using more than 200 stations operated by the National Research Institute for Earth Science and Disaster Prevention in Japan’s Chugoku district, researchers Kiwamu Nishida and Ryota Takagi “successfully detected not only P wave microseisms triggered by a severe and distant North Atlantic storm, known as a weather bomb, but also S wave microseisms, too,” said the study.
“The discovery marks the first time scientists have observed… an S wave microseism.”
Microseism S waves are so faint that they occur in the 0.05 to 0.5 Hz frequency range.
The study in the journal Science details how researchers traced the direction and distance to the waves’ origins, and the paths they traveled.
The discovery “gives seismologists a new tool with which to study Earth’s deeper structure,” said Peter Gerstoft and Peter Bromirski of the University of California, San Diego in an accompanying Perspective article.
Learning more about microseismic S waves may “add to our understanding of the deeper crust and upper mantle structure.”
Reference:
K. Nishida et al. Teleseismic S wave microseisms, Science (2016). DOI: 10.1126/science.aaf7573
Note: The above post is reprinted from materials provided by AFP.
How shallow, deep earthquakes differ
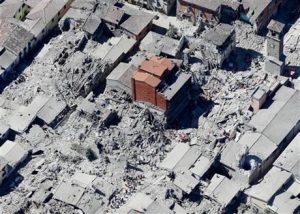
Italy’s earthquake was a lot weaker than the one in Myanmar, but it did far more damage because it happened at a shallower depth. The Associated Press explains the difference between shallow and deep earthquakes.
___
EARTHQUAKE MAGNITUDE IS MORE THAN JUST A NUMBER
A quake’s destructive force depends not only on its strength, but also on location, distance from the epicenter and depth. Quakes can strike near the surface or deep within the Earth. Most quakes occur at shallow depths, according to the U.S. Geological Survey. Italy’s quake was very shallow, originating between 2 1/2 miles (4 kilometers) and 6 miles (10 kilometers) underground, according to Italy’s geological service and the USGS. The magnitude measurements also varied slightly — between magnitude 6 and 6.2. By contrast, the 6.8 quake in Myanmar was deeper — at 52 miles (84 kilometers), which is considered an intermediate depth.
___
SHALLOW QUAKES ARE LIKE ‘A BOMB’
Shallow quakes generally tend to be more damaging than deeper quakes. Seismic waves from deep quakes have to travel farther to the surface, losing energy along the way. Shaking is more intense from quakes that hit close to the surface like setting off “a bomb directly under a city,” said Susan Hough, a USGS seismologist. The Italy quake devastated three towns, home to medieval structures built before there were building codes. Many buildings were made of brick or stone, which can fall apart during shaking. “They’re very quaint, but they don’t withstand earthquakes very well,” Hough said.
___
DEEP QUAKES STRIKE FAR AND WIDE
While deep quakes may be less damaging, they’re usually more widely felt. Most of the destruction in the Myanmar quake was centered in the tourist town of Bagan where nearly 100 brick pagodas dating back centuries were damaged. At least four people were killed in the Myanmar temblor, which also shattered ancient Buddhist pagodas.
Note: The above post is reprinted from materials provided by The Associated Press. The original article was written by ALICIA CHANG.