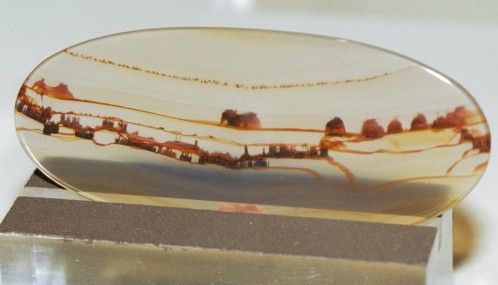
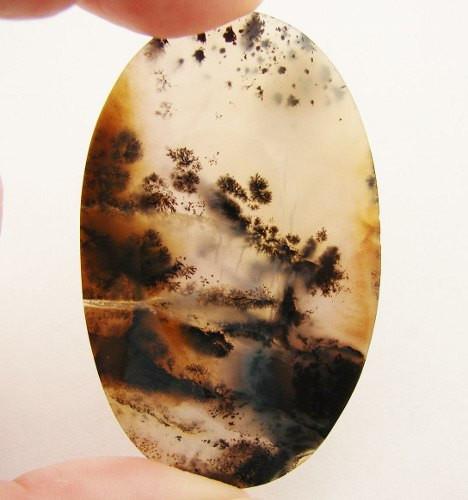
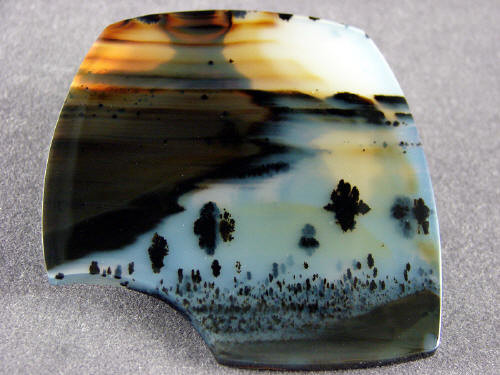
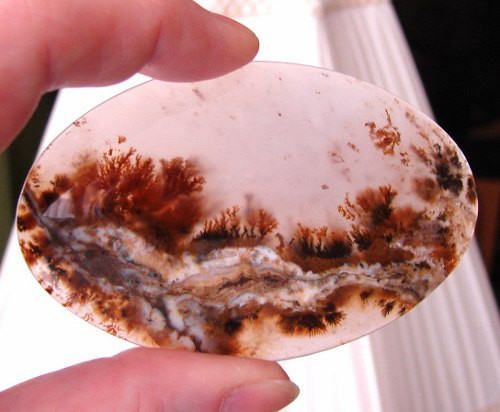
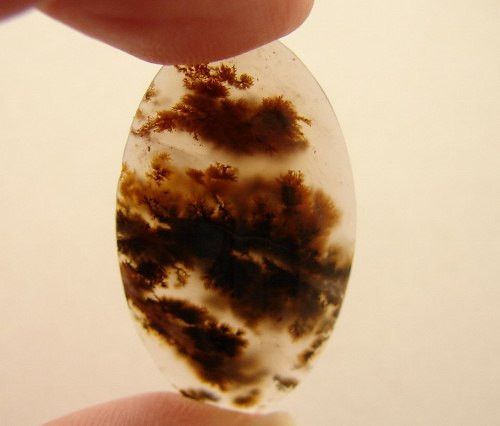
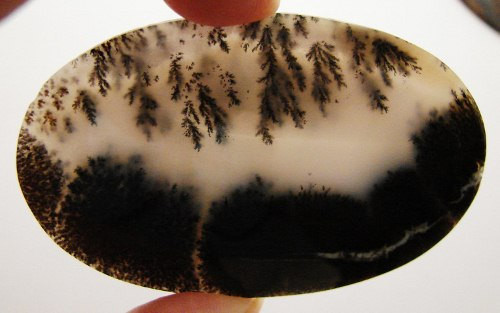
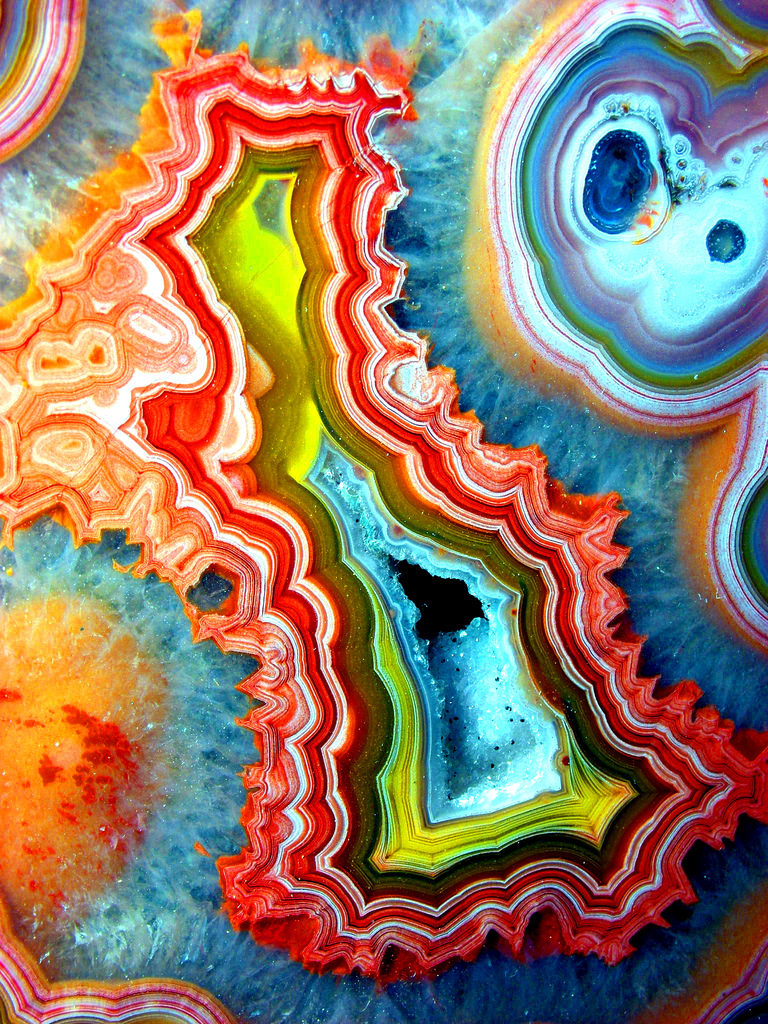
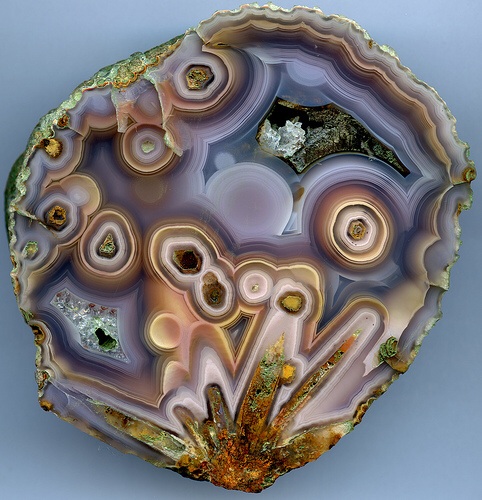
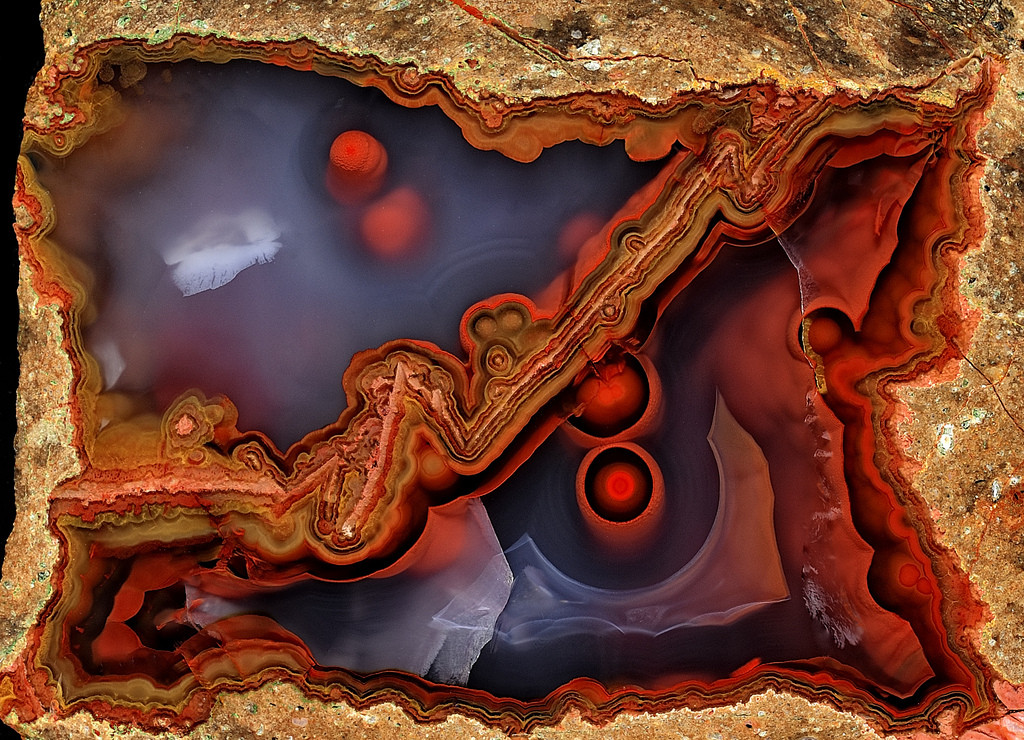
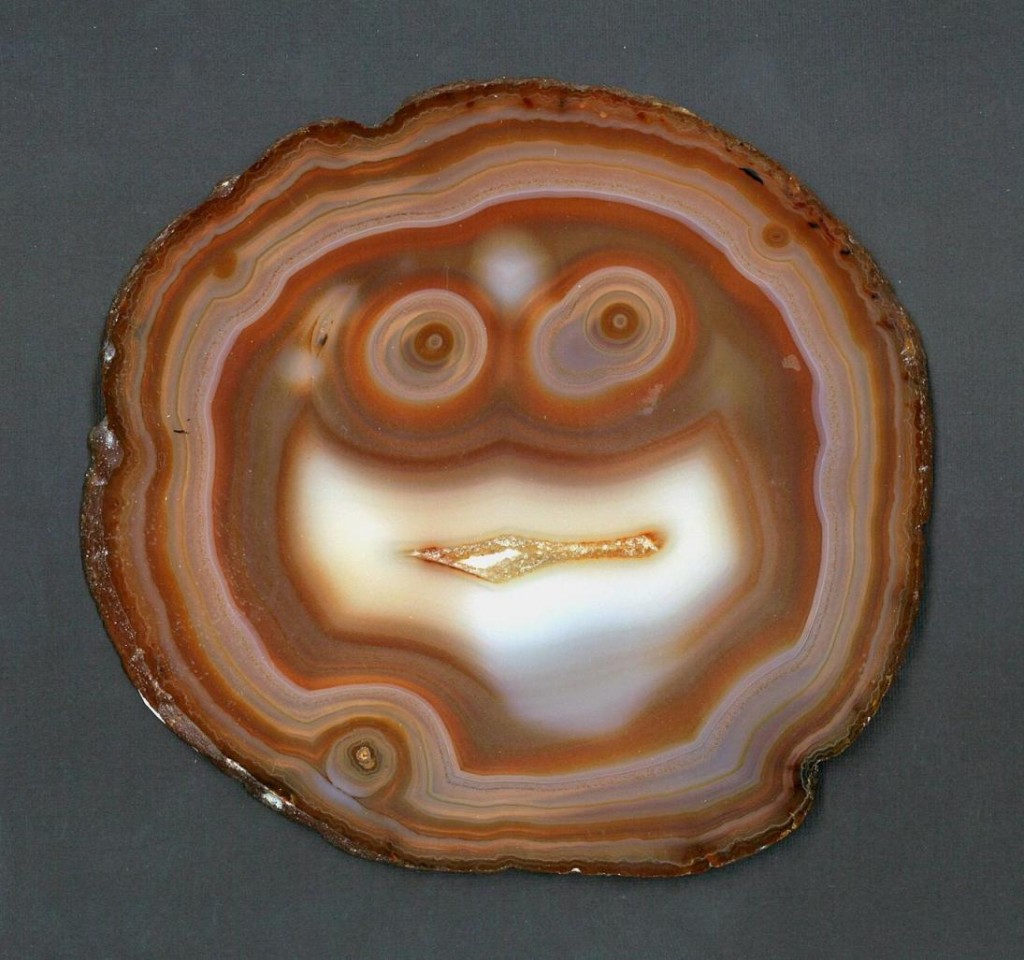
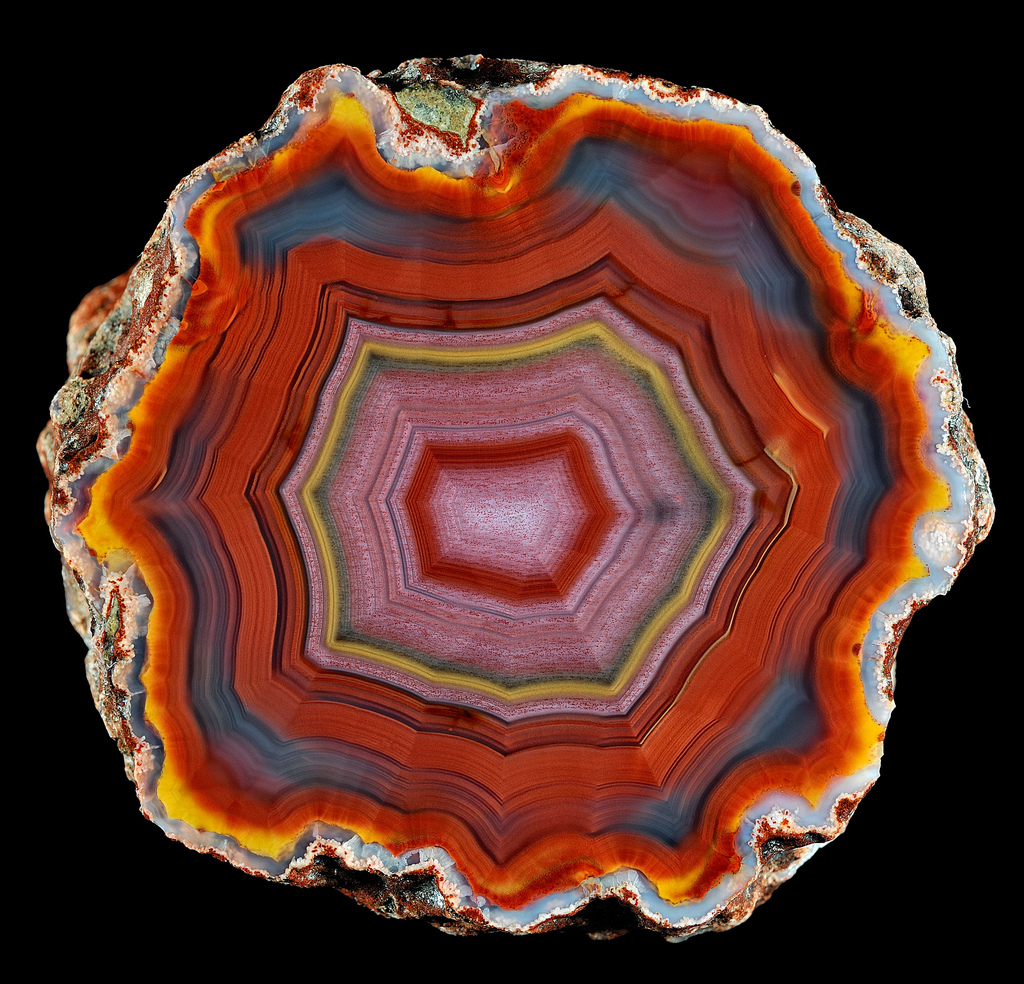
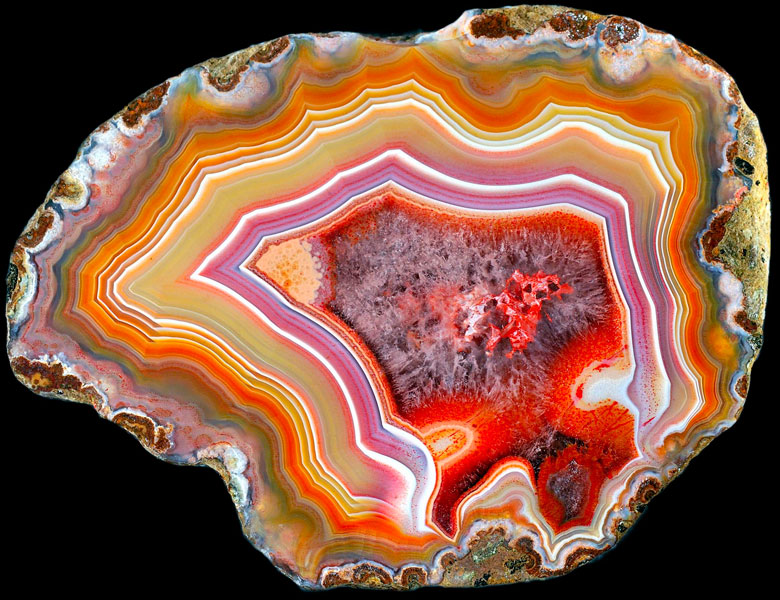
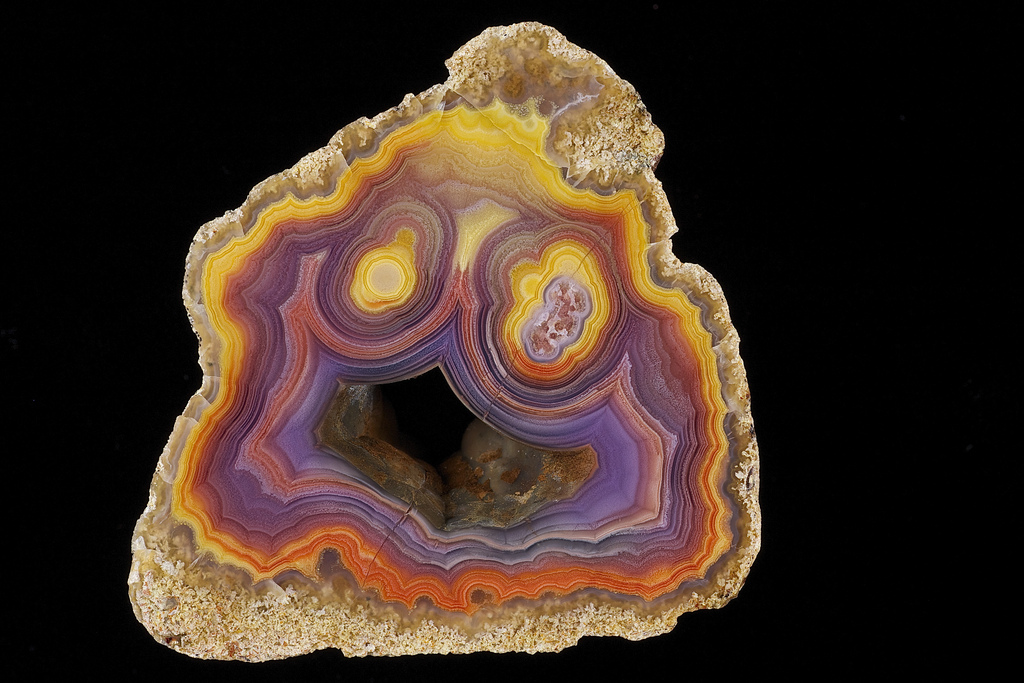
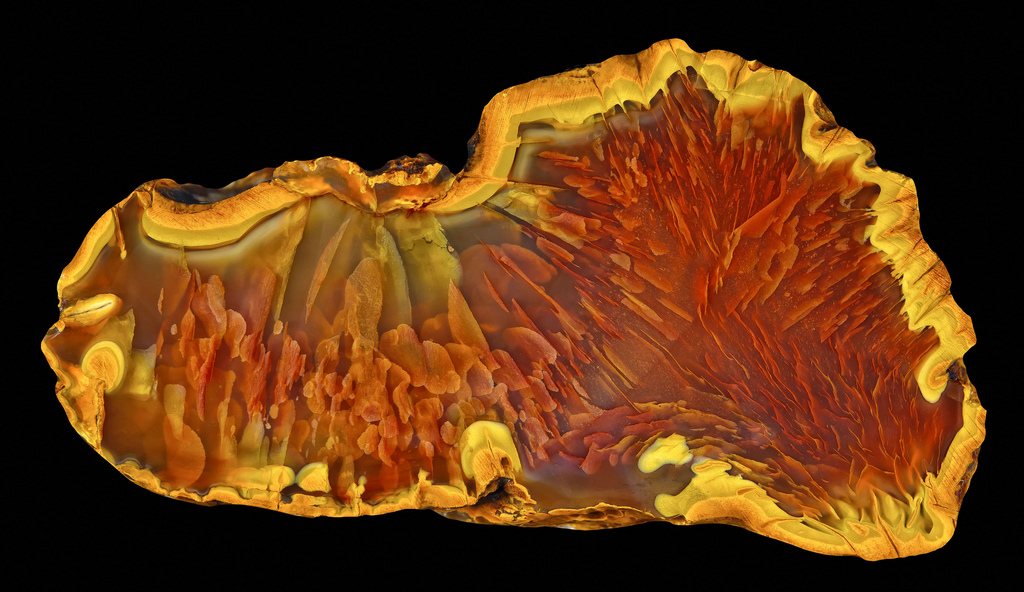
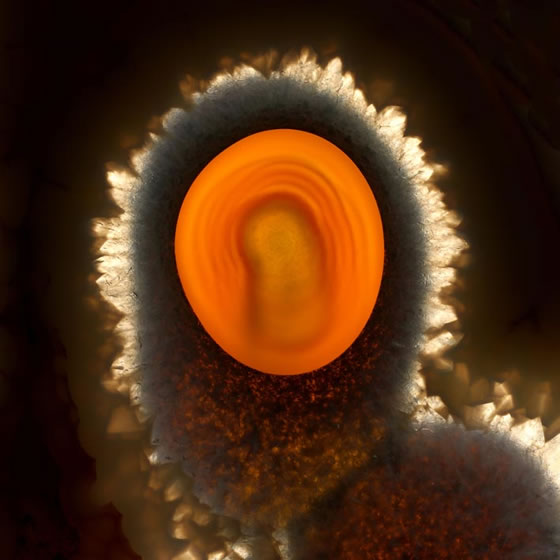
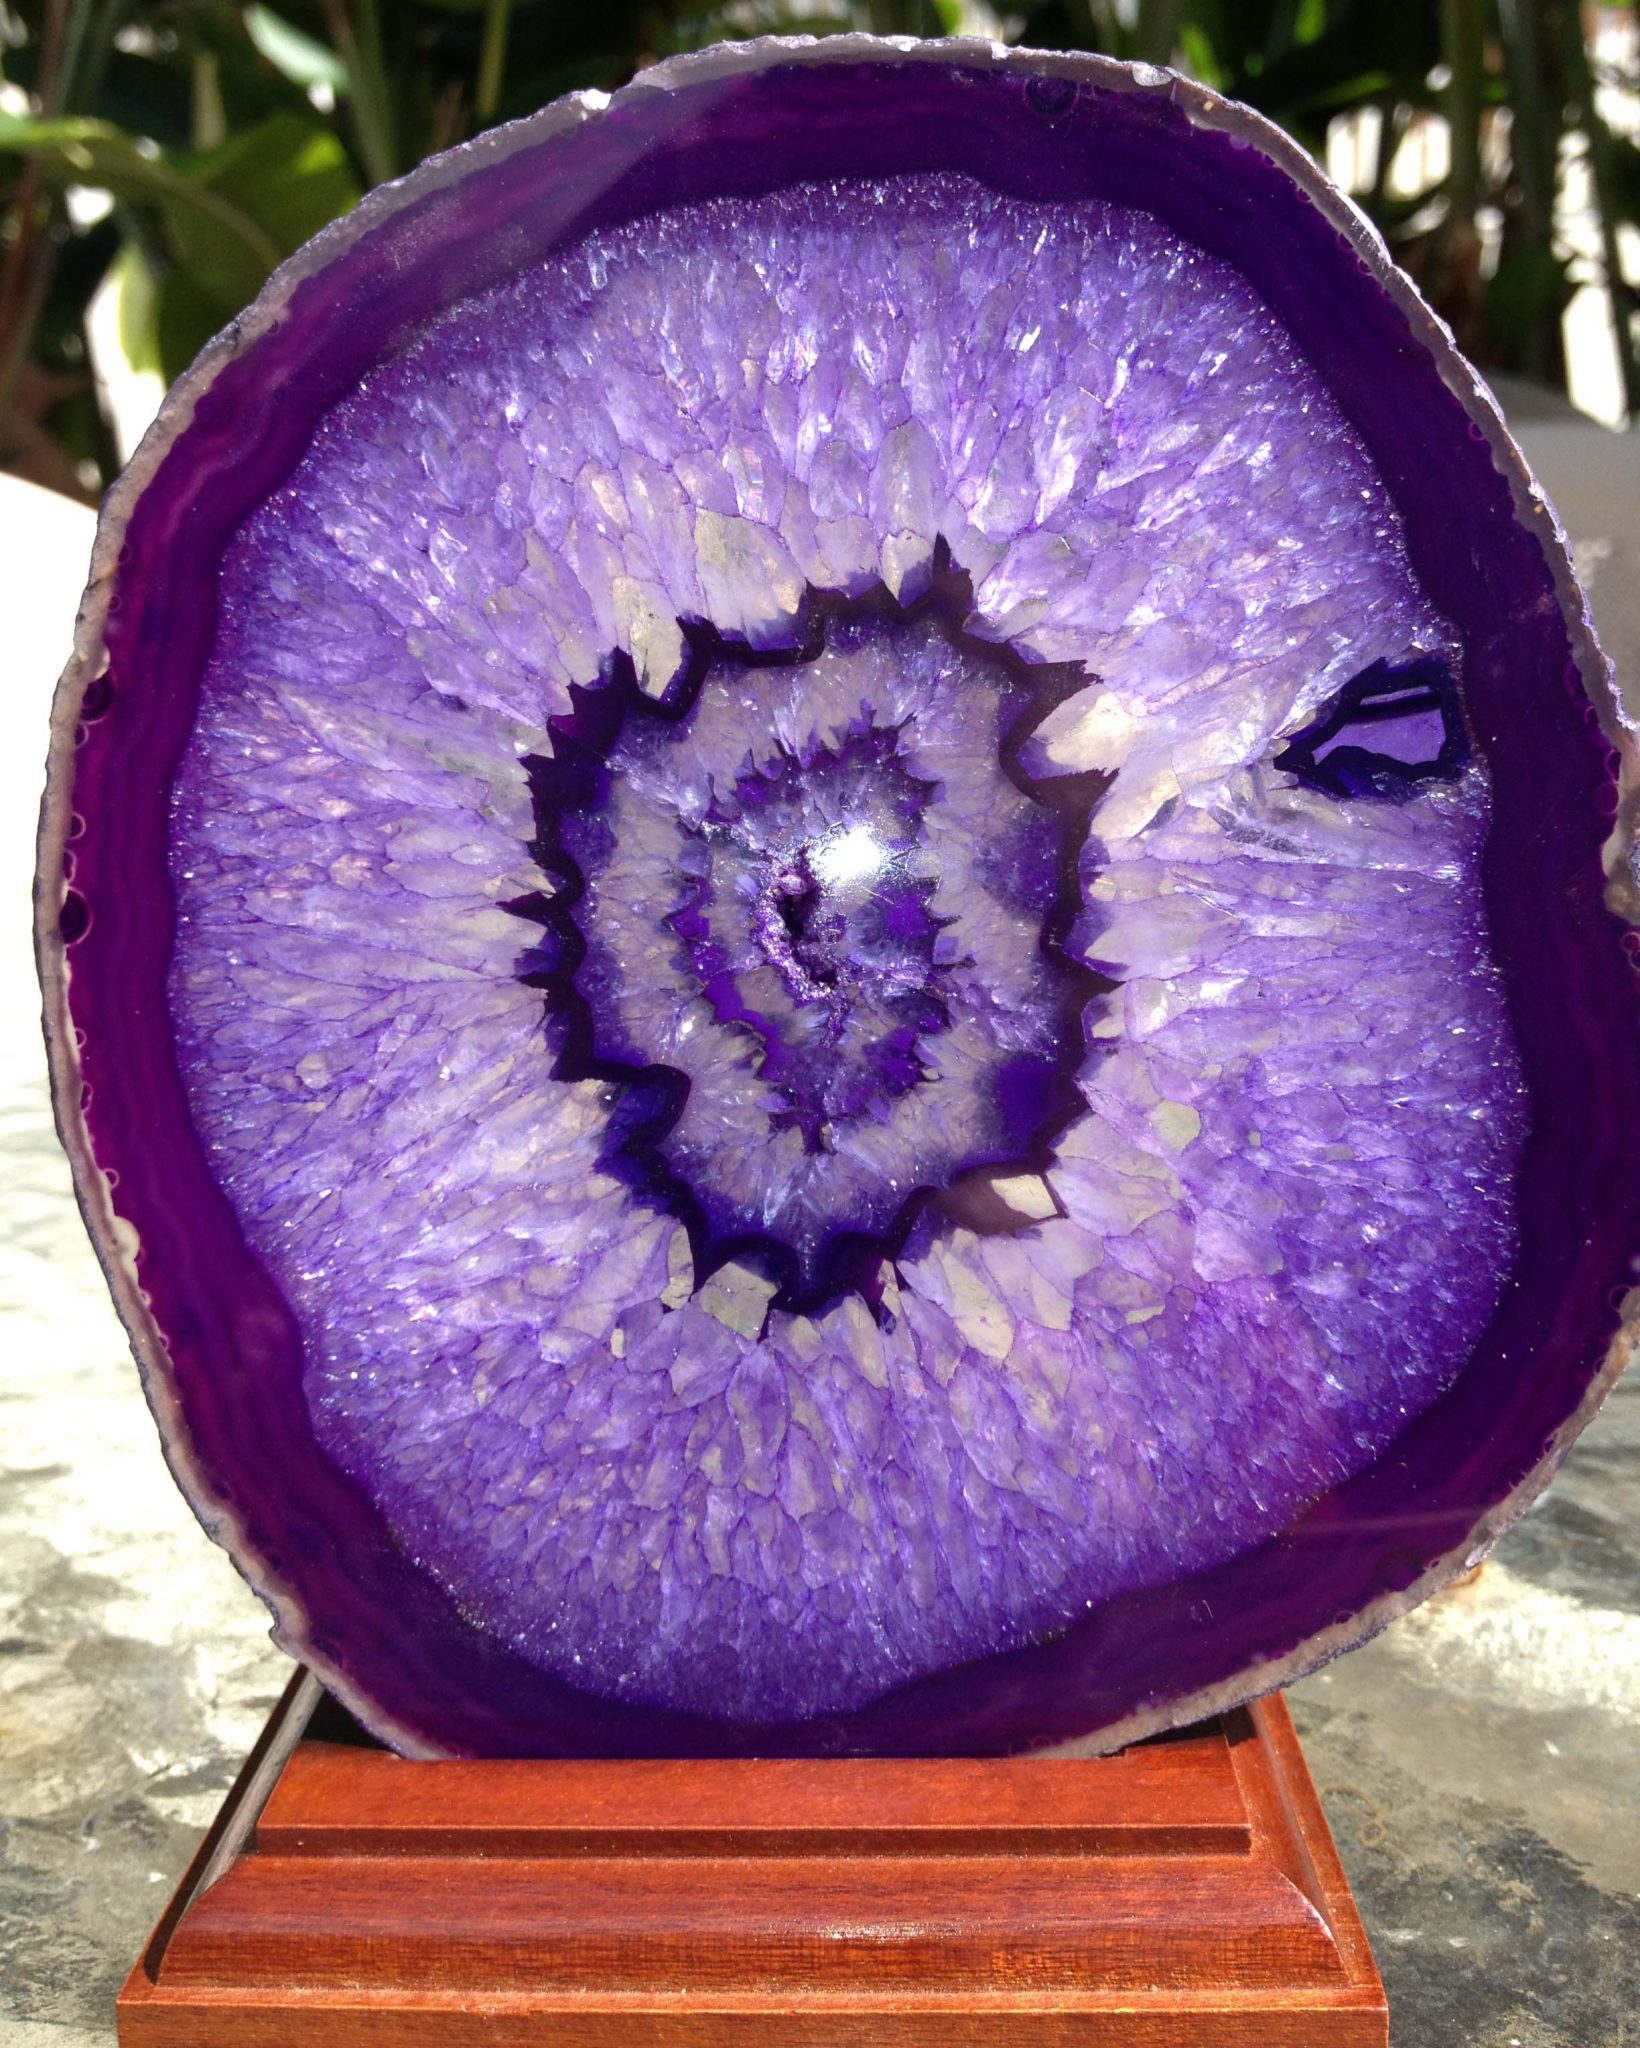
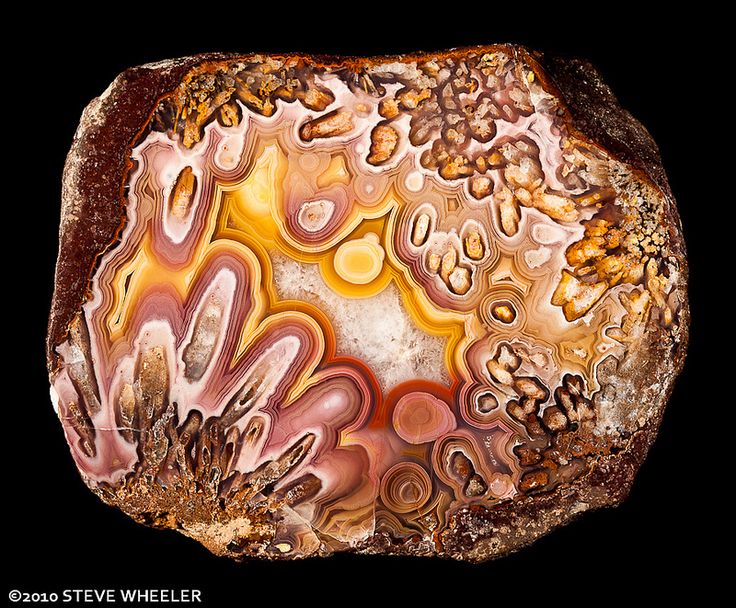
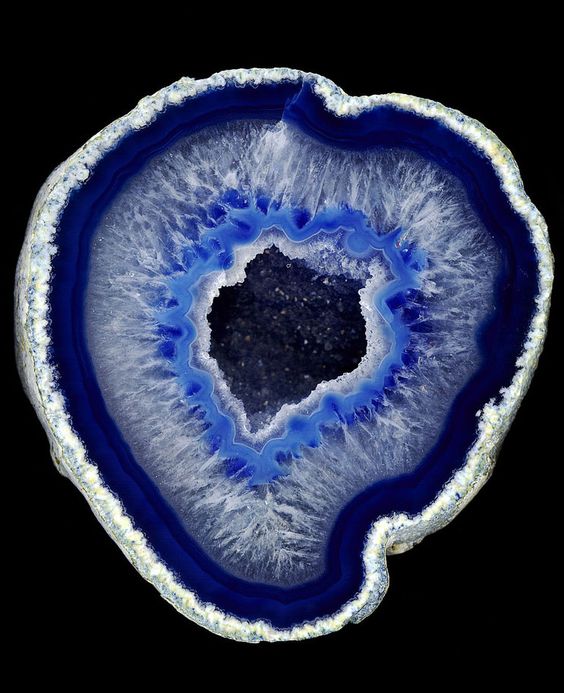
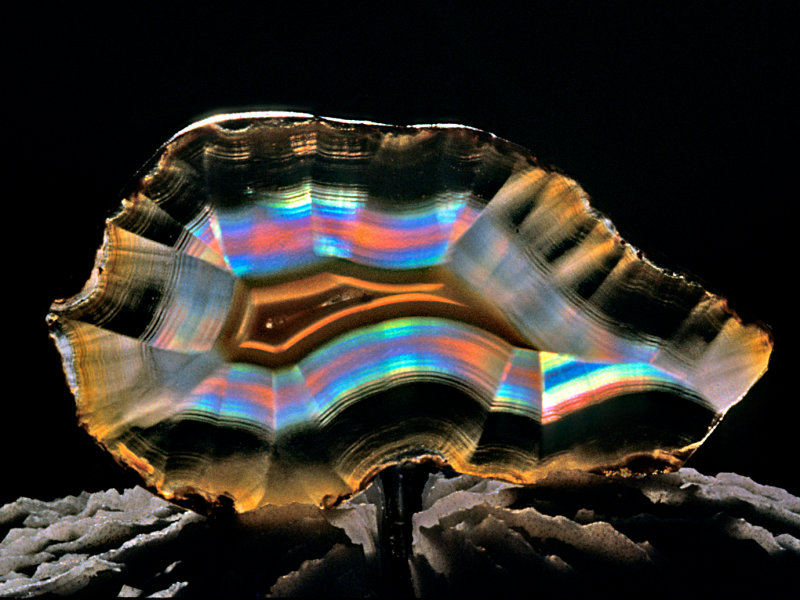
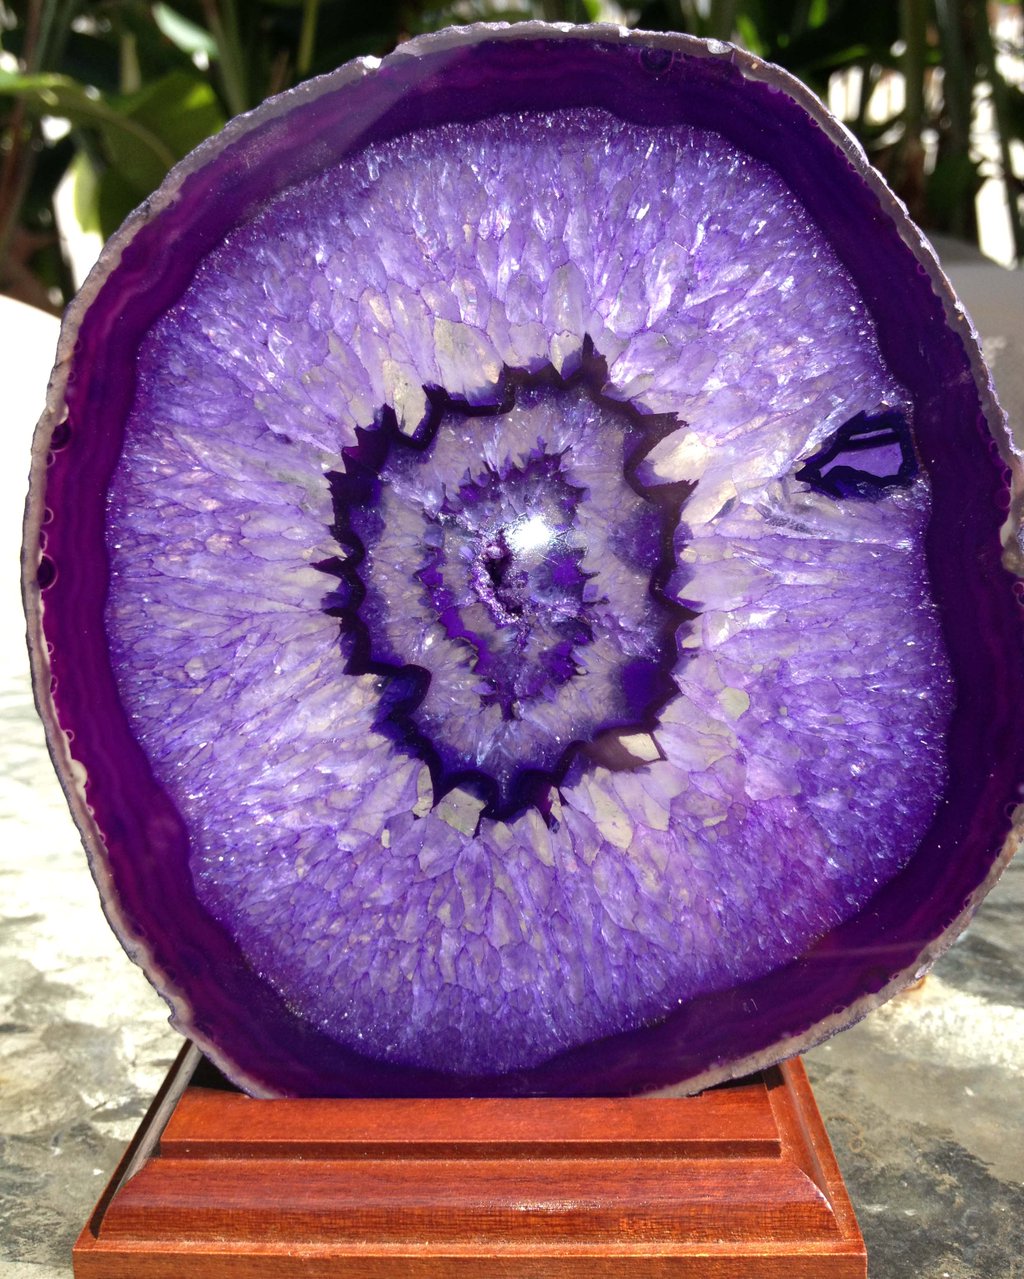
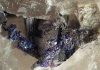
Agate is a cryptocrystalline variety of silica, chiefly chalcedony, characterised by its fineness of grain and brightness of color. Although agates may be found in various kinds of rock, they are classically associated with volcanic rocks and can be common in certain metamorphic rocks.
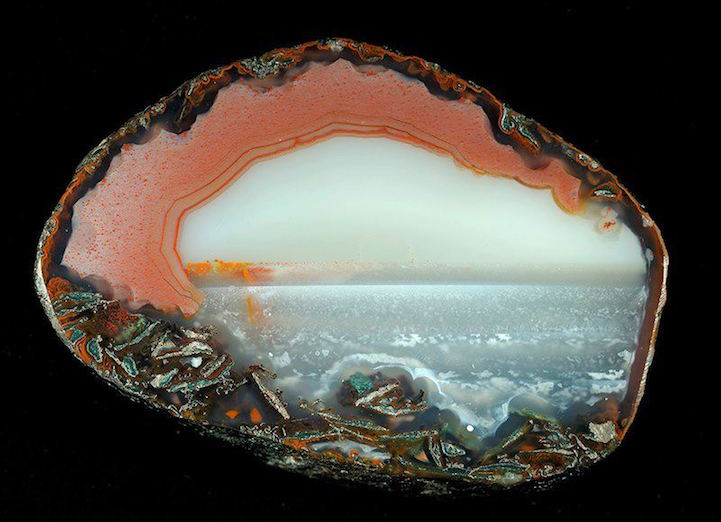
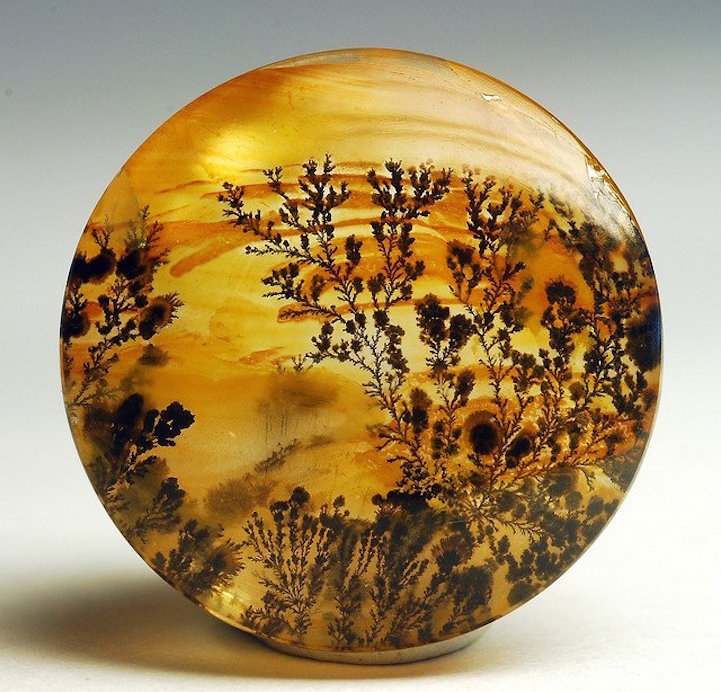
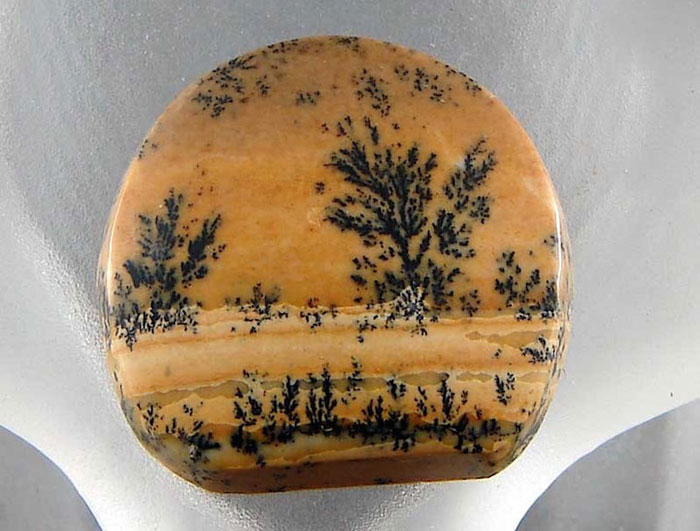
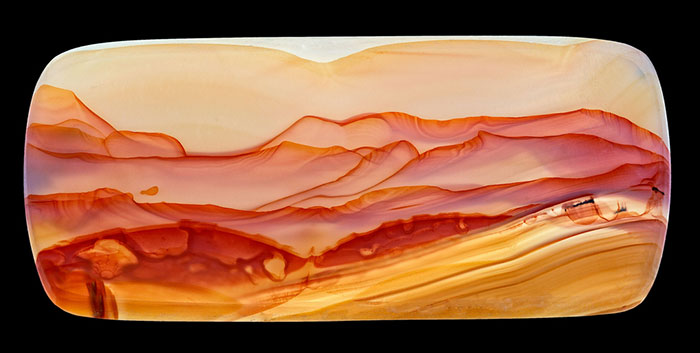
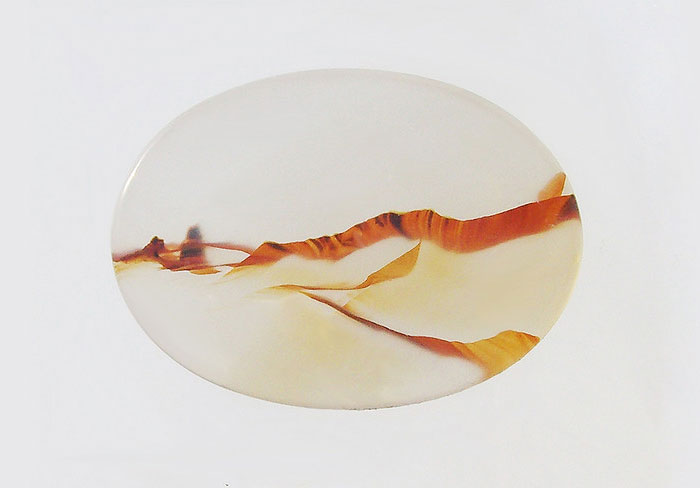
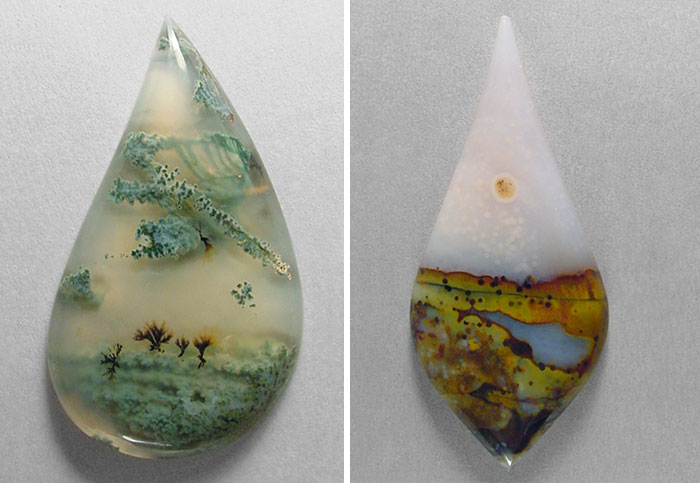
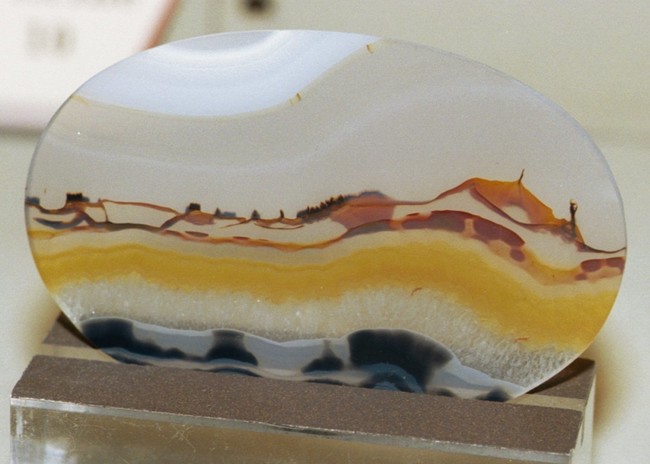
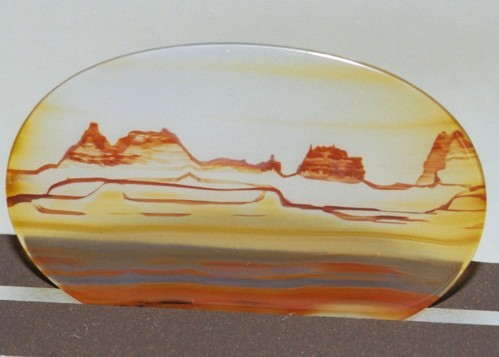
Landscape agate is chalcedony with a number of different mineral impurities making the stone resemble landscapes.
Agate is a cryptocrystalline variety of silica, chiefly chalcedony, characterised by its fineness of grain and brightness of color. Although agates may be found in various kinds of rock, they are classically associated with volcanic rocks and can be common in certain metamorphic rocks.
September 8, 2016 ـــــ The Volcano Goddess Pele continues battle with her sister Na Maka, the Goddess of the Sea, broadening her flow further into Hawaii Volcanoes National Park and at numerous points in the Pacific Ocean.
Pele’s fluid pahoehoe flows now cover the better part of a mile of recently completed access road, as she has spread into the park. Pele rolled over the Pali six weeks ago, mostly between Hawaii Volcanoes National Park and the abandoned Royal Gardens subdivision. This new flow, dubbed 61G is now about 6 miles long, and the ocean entry is within the boundary of Hawaii Volcanoes National Park.
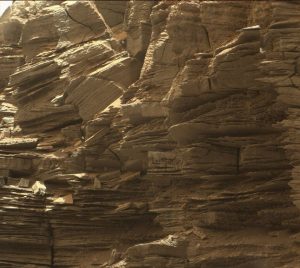
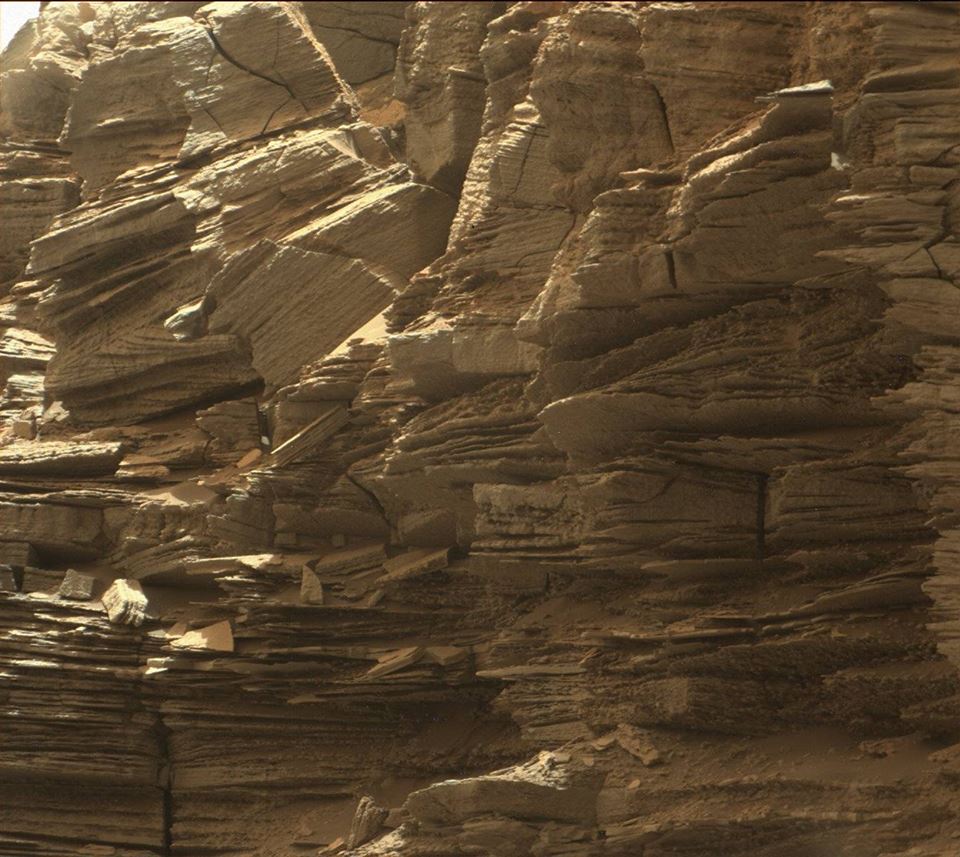
This closeup view from NASA’s Curiosity rover shows finely layered rocks, deposited by wind long ago as migrating sand dunes. Image Credit: NASA/JPL-Caltech/MSSS
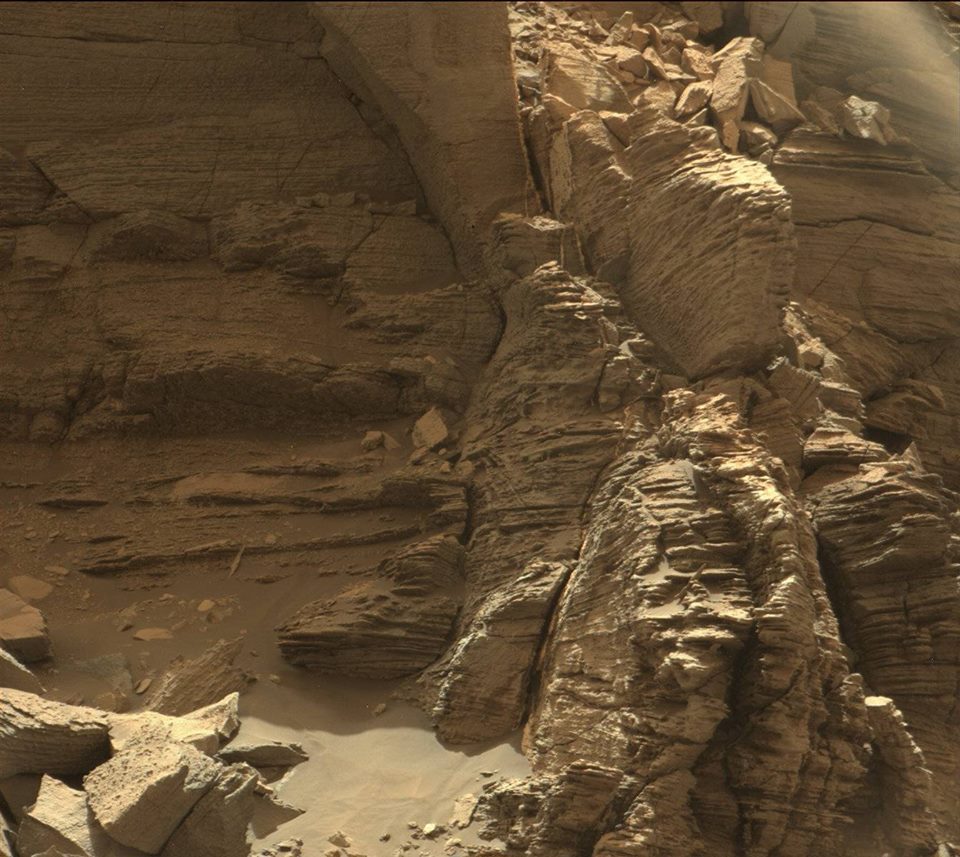
The layered geologic past of Mars is revealed in stunning detail in new color images returned by NASA’s Curiosity Mars rover, which is currently exploring the “Murray Buttes” region of lower Mount Sharp. The new images arguably rival photos taken in U.S. National Parks.
Curiosity took the images with its Mast Camera (Mastcam) on Sept. 8. The rover team plans to assemble several large, color mosaics from the multitude of images taken at this location in the near future.
“Curiosity’s science team has been just thrilled to go on this road trip through a bit of the American desert Southwest on Mars,” said Curiosity Project Scientist Ashwin Vasavada, of NASA’s Jet Propulsion Laboratory, Pasadena, California.
The Martian buttes and mesas rising above the surface are eroded remnants of ancient sandstone that originated when winds deposited sand after lower Mount Sharp had formed.
“Studying these buttes up close has given us a better understanding of ancient sand dunes that formed and were buried, chemically changed by groundwater, exhumed and eroded to form the landscape that we see today,” Vasavada said.
The new images represent Curiosity’s last stop in the Murray Buttes, where the rover has been driving for just over one month. As of this week, Curiosity has exited these buttes toward the south, driving up to the base of the final butte on its way out. In this location, the rover began its latest drilling campaign (on Sept. 9). After this drilling is completed, Curiosity will continue farther south and higher up Mount Sharp, leaving behind these spectacular formations.
Curiosity landed near Mount Sharp in 2012. It reached the base of the mountain in 2014 after successfully finding evidence on the surrounding plains that ancient Martian lakes offered conditions that would have been favorable for microbes if Mars has ever hosted life. Rock layers forming the base of Mount Sharp accumulated as sediment within ancient lakes billions of years ago.
On Mount Sharp, Curiosity is investigating how and when the habitable ancient conditions known from the mission’s earlier findings evolved into conditions drier and less favorable for life.
Mars Rover Views Spectacular Layered Rock Formations
1 of 5
Curiosity got close to this outcrop on Sept. 9, 2016, which displays finely layered rocks. Image Credit: NASA/JPL-Caltech/MSSS
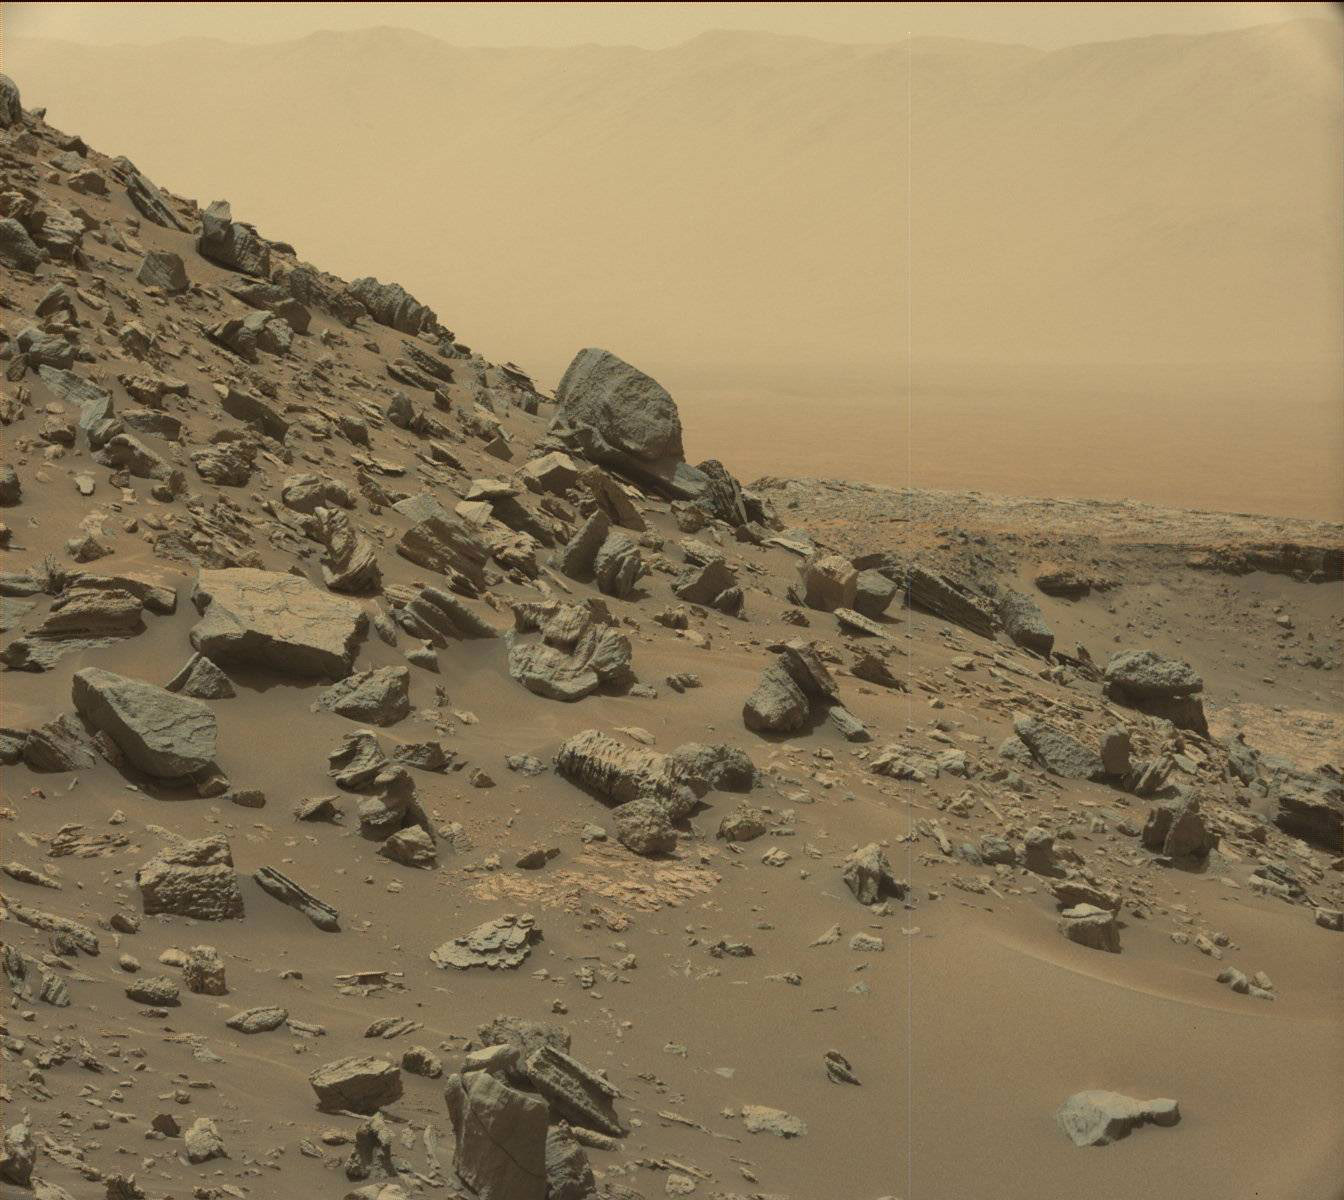
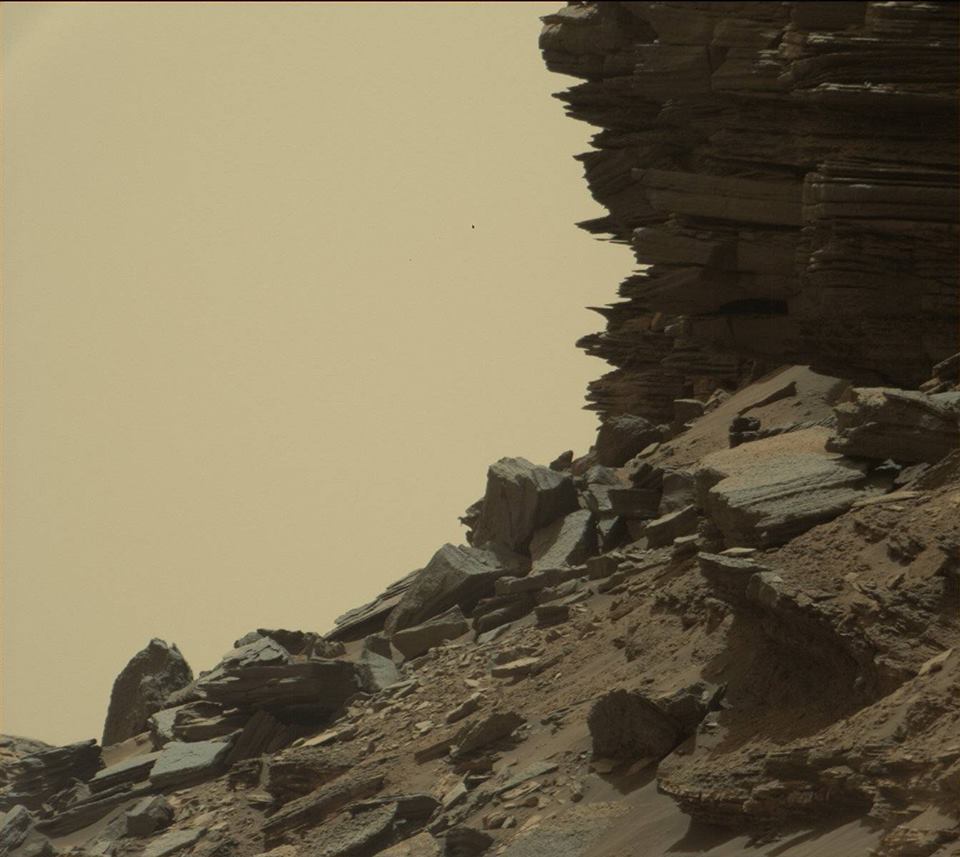
The rim of Gale Crater is visible in the distance, through the dusty haze, in this Curiosity view of a sloping hillside on Mount Sharp. Image Credit: NASA/JPL-Caltech/MSSS
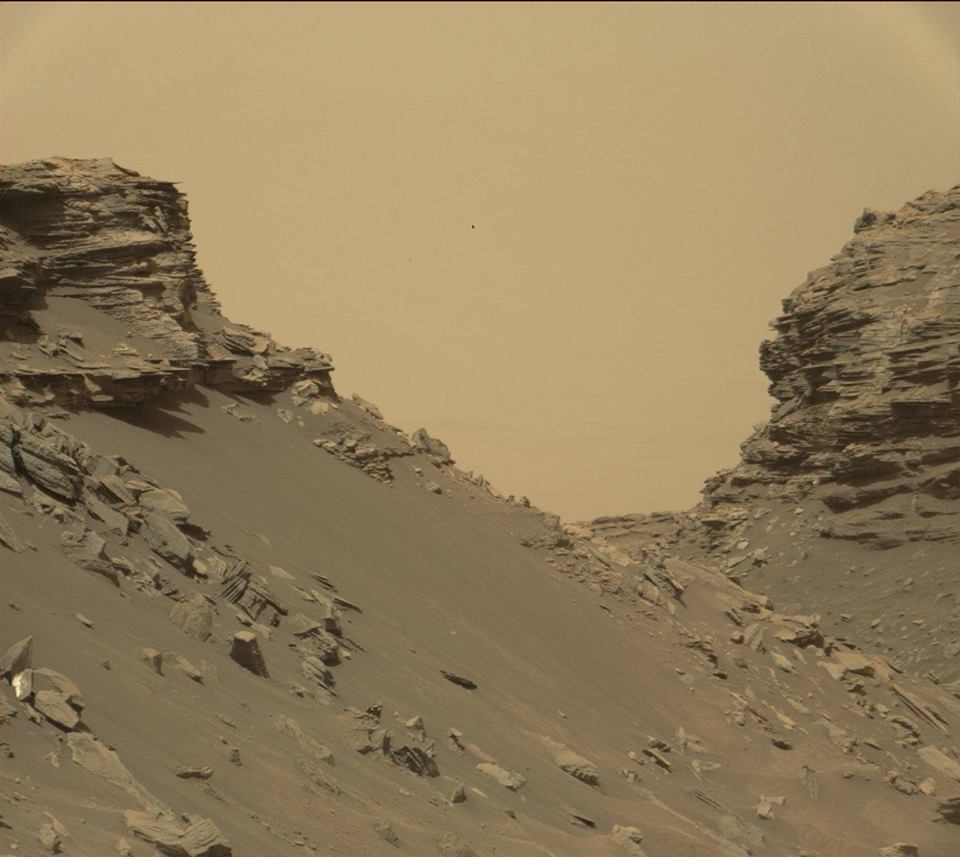
Curiosity viewed sloping buttes and layered outcrops as it exited the "Murray Buttes" region on lower Mount Sharp, Sept. 9, 2016. Image Credit: NASA/JPL-Caltech/MSSS
This closeup view from NASA's Curiosity rover shows finely layered rocks, deposited by wind long ago as migrating sand dunes. Image Credit: NASA/JPL-Caltech/MSSS
This view from Curiosity shows a dramatic hillside outcrop with sandstone layers that scientists refer to as "cross-bedding." Image Credit: NASA/JPL-Caltech/MSSS
Note: The above post is reprinted from materials provided by NASA.
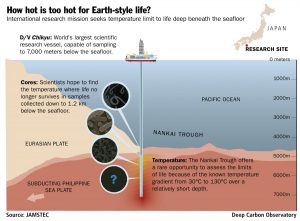
International research mission to explore limits of life deep beneath the seafloor. Credit: Deep Carbon Observatory
Mission seeks to answer key questions: How deep is Earth’s habitable zone? How deep is the deep subseafloor biosphere? How does the deep biosphere affect life at the surface? Could life have originated deep and moved upward?
Destination:
Nankai Trough, ~120 kilometers off the coast of Japan, where the ocean depth is 4.7 kilometers, and drilling will penetrate a further 1.2 kilometers beneath the seafloor, where layers of sediment and rock reach temperatures of 130°C (266°F), far above water’s boiling point at Earth’s surface.
Mission elements:
31 researchers from 8 nations
World’s largest, most stable scientific research ship
Helicopters to speed fresh samples from ship to shore
Super-clean lab on shore to prevent sample contamination
“Over the next 60 days, we have an unprecedented opportunity to learn more about when temperatures become too hot for microbial life to survive below the seafloor,” said Dr. Verena Heuer, expedition co-chief scientist.
The ocean floor is teeming with worms (nematodes) and other eukaryotic organisms, which live in sediments together with a myriad of microbes representing the three domains of life (Archaea, Bacteria, and Eukaryotes). As the sediments get deeper and warmer, microbial forms become less abundant.
During this expedition, scientists will look for as few as 100 cells per cm3, or roughly the equivalent of 100 sand grains floating in an Olympic-sized swimming pool. Finally, in the deepest samples retrieved on this research cruise, the team expects samples beyond the borders of life where current knowledge predicts that no living cells persist. This is the first attempt to explore this boundary, the biotic fringe, in detail. The team aims to determine whether it is sharp, diffuse, or exists at all.
With scientists working simultaneously on land and at sea, the research is part of the International Ocean Discovery Program’s (IODP) Expedition 370: T-Limit of Deep Biosphere off Muroto, and targets many of the science goals of the Deep Carbon Observatory, an international multidisciplinary research program investigating the role of deep carbon in planetary function.
Interested individuals can engage with the mission by guessing the temperature limit of life under the seafloor in the Deep Carbon Observatory’s “How hot is too hot?” contest at https://deepcarbon.net/feature/how-hot-is-too-hot.
Limits to life
“We know the microbial biomass living under the seafloor compares to that found in the global ocean,” explained co-chief scientist Dr. Fumio Inagaki. “Yet, there are many unknowns about this mass of life deep below the seafloor, including its diversity, borders, and the factors limiting its survival.”
Previous research at hot vents in the seafloor suggests life can survive temperatures a little above 120°C. DNA molecules, at least under surface conditions, lose their integrity at temperatures between 120-140°C, and without DNA, life as we know it cannot exist. Yet we know that carbon, hydrogen, and other essential building blocks of life are plentiful under even more extreme temperatures deep inside Earth.
“We have the extraordinary opportunity to explore the depth at which sediments and rocks become too hot for life, even for microbes that can live at temperatures greater than 85°C,” said co-chief scientist Heuer. “The gradual increase in temperature from approximately 30°C to 130°C in the sampled sediments will give us the opportunity to explore how microbial life changes with increasing temperatures and ultimately ceases to exist. Is this lower boundary of the subseafloor’s habitable zone like a rigid brick wall or is it like a leaky fence?”
Simultaneous shipboard and land-based science
On 12 September 2016, an international team of 25 researchers will board the drilling vessel (D/V) Chikyu, the world’s largest scientific research vessel, in Shimizu Port in Shizuoka, Japan, to begin a 60-day quest to determine the limits of life below the ocean’s floor. Working with six additional shore-based scientists, the team will attempt to define the temperature limits to deep life in marine sediments and to clarify key factors, including pressure, limiting Earth’s underground habitable zone.
A unique aspect of this endeavor involves investigations occurring simultaneously onboard the Chikyu and on land at the Kochi Core Center. For the first time, helicopters will speed fresh core samples from the Chikyu to the state-of-the-art research facilities in the Kochi Core Center. There, members of the shore-based science team, led by co-chief scientist Dr. Yuki Morono, will analyze samples to determine the geochemical and microbiological characteristics of the sediments, and painstakingly count minuscule and sparse cells.
The team also will use next-generation DNA sequencing technology to determine which organisms can survive in deep subseafloor sediments and their ancestry. Genetic data like these will provide clues showing how resident microbes adapt to such extreme environments.
Explained Morono, “Looking for life in core samples is like looking for a needle in a haystack. At the surface, the sediments are teeming with microbial cells, but in samples from deeper in the core, the cells become far more sparse.”
The state-of-the-art Japanese drilling vessel Chikyu will travel to the central Nankai Trough, ~120 kilometers off the coast of Japan where the ocean is 4.7 kilometers deep, and drill a further 1.2 kilometers beneath the ocean’s floor to collect sediment and rock cores. The total distance from the ocean’s surface to the target sample depth is equivalent to the height of 18 Eiffel Towers. Carefully selected samples from those cores then will be sent on a one-hour helicopter ride for further investigation by the shore-based science team. The team will search for life within the cores at the super-clean laboratory space of the Kochi Core Center, which is run jointly by the Japan Agency for Marine-Earth Science and Technology (JAMSTEC) and Kochi University.
When the 60-day mission ends around 10 November, the shipboard and shore-based investigators will unite at the Kochi Core Center for a day of debriefing. Then the land-based team will spend a further two weeks analyzing samples.
“This expedition is as complex as a mission to outer space might be,” explained Dr. Kai-Uwe Hinrichs, MARUM, University of Bremen, and lead author of the scientific proposal behind the expedition. “It requires the technology to ‘land’ the coring bit on the right spot in over 4 kilometer-deep water, drill through ancient ocean sediments to collect samples far below the ocean floor, bring them back onboard intact, then transport them by helicopter to the super-clean geomicrobiology laboratory to ensure no contamination. Like a space mission, this expedition is fraught with complexity, danger, and vast opportunity for discovery.”
The Nankai Trough off Cape Muroto offers unique conditions where temperatures can approach ~130°C as cores are collected from 1.2 kilometers depth below the seafloor. Based on previous data from deep-sea hydrothermal vents, researchers expect the upper limit of life in the seafloor near 120°C. The hottest life currently catalogued on Earth includes Geogemma barossii, a single-celled organism thriving in hydrothermal vents on the sea floor. Its cells, tiny microscopic spheres, grow and replicate at 121°C. Scientists found the organism, also known as strain 121, in a sample collected during a 2003 expedition to the Juan de Fuca Ridge off the northwest USA coast and named it after Deep Carbon Observatory scientist John Baross (University of Washington, USA), who provided the sample. At pressure characteristic of about 2000-4000 meters deep (20-40 megapascals), scientists reported cell growth and methane production of a competitor for most heat tolerant organism, Methanopyrus kandleri strain 116, up to 122°C.
The Trough is located on the Eurasian plate, where heat flow is particularly high, near its boundary with the subducting young, hot Philippine Sea tectonic plate. At the targeted site, the geothermal gradient is about four times steeper than elsewhere in the Pacific Ocean. Reaching these temperatures in other areas would require collecting cores from ~4 kilometers below the seafloor, rather than 1.2 kilometers as planned.
Researchers found the site in Nankai Trough 15 years ago but now return with a renewed purpose and more advanced technologies, coupled with analysis capabilities of the Kochi Core Center and other top laboratories around the world. Investigators will also consider existing data to learn how cell concentrations drop to zero, or if life continues at a slower pace or with different forms of microbes with different energy needs.
Three co-chief scientists are leading the mission: Drs. Verena Heuer (MARUM, University of Bremen), Fumio Inagaki (Kochi Institute for Core Sample Research/Research and Development Center for Ocean Drilling Science, JAMSTEC), and Yuki Morono (Kochi Institute for Core Sample Research, JAMSTEC). The co-chief scientists, Hinrichs, and many others on the science team are members of the Deep Carbon Observatory.
IODP Expedition 370 will address some of the Deep Carbon Observatory’s fundamental objectives regarding deep life, which include mapping the abundance and diversity of subsurface marine microorganisms in time and space as a function of their genomic and biogeochemical properties, and their interactions with deep carbon.
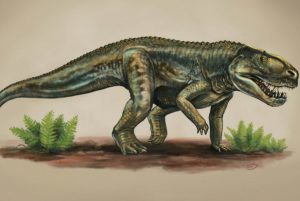
This is an artist’s rendering of a Vivaron haydeni that lived more than 200 million years. Credit: Image by Matt Celeskey
An extinct reptile related to crocodiles that lived 212 million years ago in present day New Mexico has been named as a new species, Vivaron haydeni, in a paper published this week by Virginia Tech’s Department of Geosciences researchers.
Leading the paper that names the previously unknown animal is undergraduate researcher Emily Lessner of Kennett Square, Pennsylvania, a double major in the departments of Geosciences and Biological Sciences, both in the Virginia Tech College of Science. Lessner’s paper detailing the fossil of the animal — jawbones, other skull fragments, and hip-bones — appears in this week’s open science journal, PeerJ.
Vivaron haydeni was found in Ghost Ranch, New Mexico, in 2009 during an excavation co-led by Sterling Nesbitt, then a postdoctoral researcher at the University of Texas at Austin, and now an assistant professor of geosciences at Virginia Tech. Some of the fossils remained sealed in protective plaster jackets until 2014, when they were transported to Blacksburg for study. That’s where Lessner enters.
At the time a sophomore majoring in Biological Sciences with a minor in Geosciences, she was seeking an independent research experience that piqued her interest and provided a challenge. She found it with the Paleobiology Research Group in Derring Hall.
Nesbitt had not arrived on campus yet and was looking for students interested in conducting research projects. When Lessner heard of the opportunity and the chance to work with Nesbitt and Michelle Stocker, also a newly arriving paleontologist in the college, Lessner jumped at the chance.
“Initially, I cleaned fossils in the lab and worked on a project reconstructing soft tissue structures using computed tomographic, or CT, scans on the computer,” said Lessner, now a senior. “I began looking at Vivaron pretty soon after.”
The name of the new species came from Lessner. Vivaron haydeni is named for a famed, monstrous snake — 30 feet long — of Ghost Ranch lore, a story passed around campfires more than a century ago, and John Hayden, a hiker who in 2002 discovered the New Mexico quarry from which the fossils were collected.
The fossil represents the sixth species of rauisuchid found thus far, and the second found in what is now the American Southwest, but was once part of the western portion of the supercontinent Pangea.
Vivaron was a carnivorous archosaur — a large set of animals that includes crocodilians and dinosaurs, as mammals includes humans and dogs. Vivaron itself measured 12 to 18 feet long, and walked on four legs. Thus far, three jaw bones, other skull fragments, and hip-bones from at least three individuals — two large, one smaller — have been found.
“These were some of the biggest predators at the time, all dinosaurs were much smaller,” added Nesbitt, speaking of the Triassic Period, more than 200 million years ago.
Vivaron is distinguishable by its upper jaw bone, which is smoother in appearance than other rauisuchid species. Other features of the animal must be inferred from close relatives. The New Mexico location in which it was found is a hot spot for paleontology research. Other parts of Vivaron may still be there.
“It is possible that other bones were not preserved, were previously collected, or are still in the ground,” said Lessner, who added geosciences as a second major soon after beginning work on Vivaron.
Bones of Vivaron that Lessner took apart, cleaned, and are on hand in the paleontology lab, some kept in protective sleeves and plaster jackets as they are thin and incredibly fragile. The detailed cleaning process was as much a learning process as any part of Lessner’s work with the lab. “When you look at anything so long, so close, you realize extra details and patterns you would not otherwise notice,” she added.
Reference:
Emily J. Lessner, Michelle R. Stocker, Nathan D. Smith, Alan H. Turner, Randall B. Irmis, Sterling J. Nesbitt. A new rauisuchid (Archosauria, Pseudosuchia) from the Upper Triassic (Norian) of New Mexico increases the diversity and temporal range of the clade. PeerJ, 2016; 4: e2336 DOI: 10.7717/peerj.2336
A fossilised remnant of the early Milky Way harbouring stars of hugely different ages has been revealed by an international team of astronomers. This stellar system resembles a globular cluster, but is like no other cluster known. It contains stars remarkably similar to the most ancient stars in the Milky Way and bridges the gap in understanding between our galaxy’s past and its present.
Terzan 5, 19,000 light-years from Earth, has been classified as a globular cluster for the forty-odd years since its detection. Now, an Italian-led team of astronomers have discovered that Terzan 5 is like no other globular cluster known.
The team scoured data from the Advanced Camera for Surveys and the Wide Field Camera 3 on board Hubble, as well as from a suite of other ground-based telescopes [1]. They found compelling evidence that there are two distinct kinds of stars in Terzan 5 which not only differ in the elements they contain, but have an age-gap of roughly 7 billion years [2].
The ages of the two populations indicate that the star formation process in Terzan 5 was not continuous, but was dominated by two distinct bursts of star formation. “This requires the Terzan 5 ancestor to have large amounts of gas for a second generation of stars and to be quite massive. At least 100 million times the mass of the Sun,” explains Davide Massari, co-author of the study, from INAF, Italy, and the University of Gröningen, Netherlands.
Its unusual properties make Terzan 5 the ideal candidate for a living fossil from the early days of the Milky Way. Current theories on galaxy formation assume that vast clumps of gas and stars interacted to form the primordial bulge of the Milky Way, merging and dissolving in the process.
“We think that some remnants of these gaseous clumps could remain relatively undisrupted and keep existing embedded within the galaxy,” explains Francesco Ferraro from the University of Bologna, Italy, and lead author of the study. “Such galactic fossils allow astronomers to reconstruct an important piece of the history of our Milky Way.”
While the properties of Terzan 5 are uncommon for a globular cluster, they are very similar to the stellar population which can be found in the galactic bulge, the tightly packed central region of the Milky Way. These similarities could make Terzan 5 a fossilised relic of galaxy formation, representing one of the earliest building blocks of the Milky Way.
This assumption is strengthened by the original mass of Terzan 5 necessary to create two stellar populations: a mass similar to the huge clumps which are assumed to have formed the bulge during galaxy assembly around 12 billion years ago. Somehow Terzan 5 has managed to survive being disrupted for billions of years, and has been preserved as a remnant of the distant past of the Milky Way.
“Some characteristics of Terzan 5 resemble those detected in the giant clumps we see in star-forming galaxies at high-redshift, suggesting that similar assembling processes occurred in the local and in the distant Universe at the epoch of galaxy formation,” continues Ferraro.
Hence, this discovery paves the way for a better and more complete understanding of galaxy assembly. “Terzan 5 could represent an intriguing link between the local and the distant Universe, a surviving witness of the Galactic bulge assembly process,” explains Ferraro while commenting on the importance of the discovery. The research presents a possible route for astronomers to unravel the mysteries of galaxy formation, and offers an unrivaled view into the complicated history of the Milky Way.
Notes
[1] The researchers also used data from the Multi-conjugate Adaptive Optics Demonstrator at ESO’s Very Large Telescope and the Near Infrared Camera 2 at the W. M. Keck Observatory (http://www.keckobservatory.org/).
[2] The two detected stellar populations have ages of 12 billion years and 4.5 billion years respectively.
Reference:
F.r. Ferraro, D. Massari, E. Dalessandro, B. Lanzoni, L. Origlia, R. M. Rich, A. Mucciarelli. The age of the young bulge-like population in the stellar system Terzan 5: linking the Galactic bulge to the high-z Universe. Astrophysical Journal, 2016
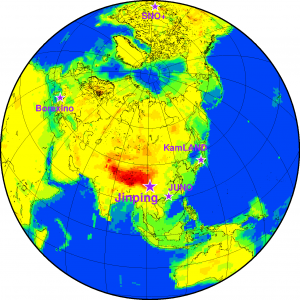
By 2022, scientists expect to be able to detect at least 536 antineutrino events per year at these five underground detectors: KamLAND in Japan, Borexino in Italy, SNO+ in Canada, and Jinping and JUNO in China. Credit: Ondrej Sramek
Earth requires fuel to drive plate tectonics, volcanoes and its magnetic field. Like a hybrid car, Earth taps two sources of energy to run its engine: primordial energy from assembling the planet and nuclear energy from the heat produced during natural radioactive decay. Scientists have developed numerous models to predict how much fuel remains inside Earth to drive its engines—and estimates vary widely—but the true amount remains unknown.
In a new paper, a team of geologists and neutrino physicists boldly claims it will be able to determine by 2025 how much nuclear fuel and radioactive power remain in the Earth’s tank. The study, authored by scientists from the University of Maryland, Charles University in Prague and the Chinese Academy of Geological Sciences, was published on September 9, 2016, in the journal Scientific Reports.
“I am one of those scientists who has created a compositional model of the Earth and predicted the amount of fuel inside Earth today,” said one of the study’s authors William McDonough, a professor of geology at the University of Maryland. “We’re in a field of guesses. At this point in my career, I don’t care if I’m right or wrong, I just want to know the answer.”
To calculate the amount of fuel inside Earth by 2025, the researchers will rely on detecting some of the tiniest subatomic particles known to science—geoneutrinos. These antineutrino particles are byproducts of nuclear reactions within stars (including our sun), supernovae, black holes and human-made nuclear reactors. They also result from radioactive decay processes deep within the Earth.
Detecting antineutrinos requires a huge detector the size of a small office building, housed about a mile underground to shield it from cosmic rays that could yield false positive results. Inside the detector, scientists detect antineutrinos when they crash into a hydrogen atom. The collision produces two characteristic light flashes that unequivocally announce the event. The number of events scientists detect relates directly to the number of atoms of uranium and thorium inside the Earth. And the decay of these elements, along with potassium, fuels the vast majority of the heat in the Earth’s interior.
To date, detecting antineutrinos has been painfully slow, with scientists recording only about 16 events per year from the underground detectors KamLAND in Japan and Borexino in Italy. However, researchers predict that three new detectors expected to come online by 2022—the SNO+ detector in Canada and the Jinping and JUNO detectors in China—will add 520 more events per year to the data stream.
“Once we collect three years of antineutrino data from all five detectors, we are confident that we will have developed an accurate fuel gauge for the Earth and be able to calculate the amount of remaining fuel inside Earth,” said McDonough.
The new Jinping detector, which will be buried under the slopes of the Himalayas, will be four times bigger than existing detectors. The underground JUNO detector near the coast of southern China will be 20 times bigger than existing detectors.
“Knowing exactly how much radioactive power there is in the Earth will tell us about Earth’s consumption rate in the past and its future fuel budget,” said McDonough. “By showing how fast the planet has cooled down since its birth, we can estimate how long this fuel will last.”
Reference:
“Revealing the Earth’s mantle from the tallest mountains using the Jinping Neutrino Experiment,” DOI: 10.1038/srep33034
Could RNA have formed in hydrothermal vents or deep beneath the surface of early Earth? Credit: Rensselaer Polytechnic Institute
Where did life begin—in a shallow lagoon, or in a vent of superheated water spewing from the ocean floor? If we knew, we might know where to look for life elsewhere in the universe. The “RNA World” hypothesis, which suggests that ribonucleic acid (RNA) was the original prebiotic molecule, has traditionally looked to a shallow, sunlit pool of water. But researchers at Rensselaer Polytechnic Institute say other environments on early Earth could have supported the formation of RNA.
“There’s research to suggest that the surface of the early Earth was an inhospitable place, and that the deep oceans or deep within the crust would have been much more protected locations,” said Karyn Rogers, associate director of the New York Center for Astrobiology at Rensselaer (NYCA). “If an RNA World could have been much more widespread on early Earth than has been traditionally thought, then the location of life’s origin could have been equally widespread.”
Rogers, an expert in extremophiles and assistant professor of earth and environmental sciences, is part of a team of researchers exploring alternate environments in which RNA could have formed. She is joined in the research by Rensselaer professors Linda McGown, an analytical chemist, and Bruce Watson, a geochemist with expertise in early Earth environments and director of the NYCA. Their work is supported by a $438,000 grant from the National Aeronautics and Space Administration (NASA), and expands upon a long history of Rensselaer research concerning the chemistry of early life in extreme environments.
At Rensselaer, this research fulfills the vision of The New Polytechnic, a paradigm for higher education which recognizes that global challenges and opportunities are so great they cannot be addressed by the most talented person working alone. Rensselaer serves as a crossroads for collaboration—working with partners across disciplines, sectors, and geographic regions—to address complex global challenges, using the most advanced tools and technologies, many of which are developed at Rensselaer. Research at Rensselaer addresses some of the world’s most pressing technological challenges—from energy security and sustainable development to biotechnology and human health. The New Polytechnic is transformative in three fundamental ways: in the global impact of research, innovative pedagogy, and in the lives of students at Rensselaer.
RNA is the lesser known, and most likely older, cousin of DNA. Like DNA, the molecule is composed of a chain of nucleotides, molecular subunits connected along a backbone of sugars and phosphates. The RNA World hypothesis rests on the fact that RNA is able to both store genetic information and catalyze reactions, two functions critical to the most basic definition of life. But in order for RNA to perform these biological functions, the chain must first attain a minimum length of at least several dozen nucleotides. In modern life, complex biochemical pathways can make long chains of RNA; however, it is not known how such lengthy chains might have formed on early Earth prior to life’s emergence.
Some existing research, including research conducted at Rensselaer, suggests that RNA can polymerize under specific conditions, although most experimental products are only 15 nucleotides or less, far less than what is needed for these RNA polymers to catalyze reactions. Most of these experiments were conducted under conditions that resemble shallow surface pools, using minerals from the clay montmorillonite as a non-biological catalyst.
If RNA polymerized in environments such as deep sea hydrothermal vents or deep within the Earth’s crust, an entirely different set of conditions would predominate. For example, the felsic mineral montmorillonite, would not be common, but mafic minerals would.
“We decided to start playing in this realm, and look at environments other than the surface,” Rogers said. “We looked at what condition would be more common in the deep sea or deep crust—pressure, temperature, minerals—and we designed experiments that attempted to polymerize RNA under those conditions.” Their results indicate that other conditions can lead to RNA polymerization.
“What we’ve found is that montmorillonite is not the only mineral that is catalytic for RNA polymerization, and some minerals that are not catalytic at ambient pressures are catalytic as you increase pressure,” Rogers said. The team will publish their preliminary research results in the coming months. The NASA-funded research follows those leads by investigating RNA polymerization in early Earth environments.
The range of possible parameters—such as temperature, mineralogy, pressure, salinity, pH, and redox state—is staggering. But with expertise in early Earth environments, Watson will narrow the field to those conditions most likely to have existed at the dawn of life on Earth. McGown will analyze the results of each experiment, searching for RNA and determining the length, and perhaps the sequence, of any strands that are produced.
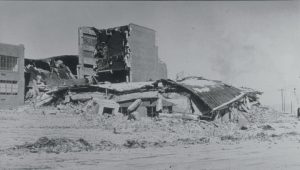
This is a photograph of damage to Helena High School, which collapsed following a major aftershock of the 1935 Helena magnitude 6.2 earthquake in Montana. Credit: NOAA National Geophysical Data Center
According to a new study by scientists at Scripps Institution of Oceanography at the University of California San Diego, a large earthquake on one fault can trigger large aftershocks on separate faults within just a few minutes. These findings have important implications for earthquake hazard prone regions like California where ruptures on complex fault systems may cascade and lead to mega-earthquakes.
In the study, published in the Sept. 9 issue of the journal Science, Scripps geophysicist Peter Shearer and Scripps graduate student Wenyuan Fan discovered 48 previously unidentified large aftershocks from 2004 to 2015 that occurred within seconds to minutes after magnitude 7 to 8 earthquakes on faults adjacent to the mainshock ruptures.
In one instance along the Sundra arc subduction zone, where the magnitude 9 Sumatra-Andaman mega-earthquake occurred off the coast of Indonesia in 2004, a magnitude 7 quake triggered two large aftershocks over 200 kilometers (124 miles) away. These aftershocks miles away reveal that stress can be transferred almost instantaneously by the passing seismic waves from one fault to another within the earthquake fault system.
“The results are particularly important because of their seismic hazard implications for complex fault systems, like California,” said Fan, the lead author of the study. “By studying this type of triggering, we might be able to forecast hosting faults for large earthquakes.”
Large earthquakes often cause aftershock sequences that can last for months. Scientists generally believe that most aftershocks are triggered by stress changes caused by the permanent movement of the fault during the main seismic event, and mainly occur near the mainshock rupture where these stress changes are largest. The new findings show that large early aftershocks can also be triggered by seismic wave transients, where the locations of the main quake and the aftershock may not be directly connected.
“Multiple fault system interactions are not fully considered in seismic hazard analyses, and this study might motivate future modeling efforts to account for these effects,” said Shearer, the senior author of the study.
Reference:
W. Fan, P. M. Shearer. Local near instantaneously dynamically triggered aftershocks of large earthquakes. Science, 2016; 353 (6304): 1133 DOI: 10.1126/science.aag0013
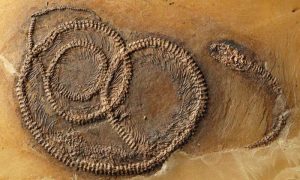
Snake with lizard and beetle: The rare tripartite fossil food chain from the Messel Pit. Credit: Springer Heidelberg
In cooperation with CONICET in Argentina, Senckenberg scientists examined a spectacular discovery from the UNESCO World Heritage site Messel Pit: A fossil snake in whose stomach a lizard can be seen, which in turn had consumed a beetle. The discovery of the approximately 48-million-year-old tripartite fossil food chain is unique for Messel; worldwide, only one single comparable piece exists. The study was recently published in Senckenberg’s scientific journal Palaeobiodiversity and Palaeoenvironments.
It is no secret that the Messel Pit is home to a plethora of fantastic fossils — but some of the findings are so sensational that they even awe veteran Messel researchers. “In the year 2009, we were able to recover a plate from the pit that shows an almost fully preserved snake,” says Dr. Krister Smith of the Department for Messel Research at the Senckenberg Research Institute in Frankfurt, and he continues, “And as if this was not enough, we discovered a fossilized lizard inside the snake, which in turn contained a fossilized beetle in its innards!”
Fossil food chains are extremely rarely preserved; due to the excellent level of preservation at the fossil site, leaves and grapes from the stomach of a prehistoric horse, pollen grains in a bird’s intestinal tract and remains of insects in fossilized fish excrements had previously been discovered at Messel. “However, until now, we had never found a tripartite food chain — this is a first for Messel!” exclaims Smith elatedly. To this day, only one other example of such fossil preservation has been found worldwide — in a 280-million-year-old shark.
Using a high-resolution computer tomograph, Smith and his colleague Agustín Scanferla from Argentina were able to identify both the snake and the lizard to the species level. Smith comments, “The fossil snake is a member of Palaeophython fischeri; the lizard belongs to Geiseltaliellus maarius, which has only been found at Messel to date.”
The snake measures 103 centimeters in length and is thus significantly smaller than other specimens of this species, which can reach two meters or more. Smith therefore assumes that the fossil represents a juvenile of this relative of the modern-day boas.
The lizard measures approximately 20 centimeters from the head to the tip of its tail — and some of the snake’s ribs, which overlap the arboreal reptile, clearly indicate that the lizard is located inside the snake. Geiseltaliellus maarius was presumably equipped with a small sagittal crest. It had the ability to shed its tail in case of danger, but did not lose it when it fell prey to the snake. “Unfortunately, we were unable to unambiguously identify the beetle — it was not well enough preserved to do so,” adds the Messel researcher from Frankfurt.
Nonetheless, the small crawler offers insights into the previously barely known feeding behavior of these lizards from Messel: The stomachs of previously discovered reptiles only contained the remains of plants; the fact that the lizards also fed on insects indicates an omnivorous diet.
The unique discovery came from a layer dating to the Middle Eocene with an approximate age of 48 million years. “Since the stomach contents are digested relatively fast and the lizard shows an excellent level of preservation, we assume that the snake died no more than one to two days after consuming its prey and then sank to the bottom of the Messel Lake, where it was preserved,” explains Smith. Too bad for the snake — but a stroke of luck for science!
Reference:
Krister T. Smith, Agustín Scanferla. Fossil snake preserving three trophic levels and evidence for an ontogenetic dietary shift. Palaeobiodiversity and Palaeoenvironments, 2016; DOI: 10.1007/s12549-016-0244-1
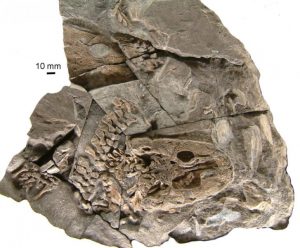
This is a picture of the Acanthostega fossil. Credit: Jennifer CLack
This week in the journal Nature, a team of researchers from Uppsala University in Sweden, the European Synchrotron Radiation Facility (ESRF) in France and the University of Cambridge in the United Kingdom shows that fossils of the 360 million-year-old tetrapod Acanthostega, one of the iconic transitional forms between fishes and land animals, are not adults but all juveniles. This conclusion, which is based on high-resolution synchrotron X-ray scans of fossil limb bones performed at the ESRF sheds new light on the life cycle of Acanthostega and the so-called conquest of land by tetrapods.
The tetrapods are four-limbed vertebrates, which are today represented by amphibians, reptiles, birds and mammals. Early tetrapods of the Devonian period (419-359 million years ago) are of great interest to palaeontologists: they were the earliest vertebrate animals that ventured onto land, paving the way for all future vertebrate life on land. The move from water to land must have affected every aspect of the biology of these animals, but until now there has been no serious attempt to investigate their life histories — how long they lived or whether they had an aquatic juvenile stage, for example. Well-preserved skeletons are rare and it has simply been assumed that they represent adults.
The single richest locality for Devonian tetrapods is a so-called mass-death deposit of Acanthostega, discovered in 1987 in Greenland by Jennifer Clack, one of the authors of the study and leading teams from the Universities of Cambridge and Copenhagen, where dozens of skeletons lie packed together like sardines in a tin. It looks like the tetrapods all died together when a small stream within an “inland delta” (like the modern Okavango in Botswana) dried out. The team decided to look at the life history of these fossils by investigating the internal structure of their humeri (upper arm bones). “Using the tremendous power of synchrotron X-rays, we were able to access microscopic details in these dense specimens as on real histological slices, but without damaging these unique fossils” says Paul Tafforeau from the ESRF.
The microscopic structures in the bones of these fossil tetrapods are almost perfectly preserved. “Like a growing tree, a limb bone is marked by seasonal rhythms and lays down annual growth rings” says Sophie Sanchez, the lead author of the publication, working at Uppsala University and the ESRF. “These growth rings, which can be seen in both fossil and living tetrapods, are informative about the development and age of the individual.”
The powerful X-ray beam of the ESRF revealed that all studied fossils of Acanthostega were immature individuals, even though they were at least 6 years old and probably older. Their growth had not yet begun to slow down as it does at sexual maturity. In addition, the researchers showed that Acanthostega’s foreleg remained cartilaginous until late during its development.
In contrast to bone, cartilage is a non-mineralised tissue, elastic and far too weak to allow the forelegs to sustain the weight of the animal’s body out of the water. “This suggests that the Acanthostega mass-death deposit represents a school of aquatic juveniles that included few or no adults” says Per Ahlberg from Uppsala University. So where were the adult Acanthostega living? Were there segregated distributions of juveniles and adults at least at certain times? This remains to be discovered. The scans done at ESRF ID19 beamline also show that the absolute size at which limb ossification began differs greatly between individuals, suggesting the possibility of sexual dimorphism, adaptive strategies or competition-related size variation.
The tetrapods’ move onto land was arguably one of the most radical adaptive shifts in vertebrate evolutionary history. “Our study provides a first glimpse of the life-history traits of an early tetrapod. We plan to undertake a more complete survey of early-tetrapod life histories which should have a significant impact on theories depicted in all textbooks” concludes Sophie Sanchez.
This research was supported by an ERC grant and a grant from the Vetenskapsradet.
Reference:
Sophie Sanchez, Paul Tafforeau, Jennifer A. Clack, Per E. Ahlberg. Life history of the stem tetrapod Acanthostega revealed by synchrotron microtomography. Nature, 2016; DOI: 10.1038/nature19354
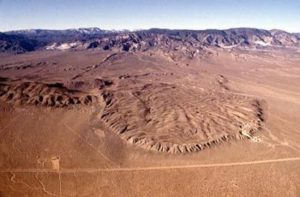
The final deposit of the Blackhawk landslide in Southern California. This landslide originated in the mountains in the background and flowed out many times its initial flow height over near-flat ground. Credit: Kerry Sieh.
During the 1990s, Charles S. Campbell, now a professor in the Department of Aerospace and Mechanical Engineering at the University of Southern California, began exploring why large landslides flow great distances with apparently little friction, and the larger the volume of flowing rock the lesser the friction.
A landslide is a large-scale example of a granular flow, in which solid particles move like a fluid — think sand flowing through an hourglass. Large-scale computer simulations revealed that friction in landslides behaved in a way that ran contrary to all existing theories for granular flow, and this inspired a quest to track down the “missing physics” in action during landslides.
A key piece of the puzzle was discovered by Campbell in 2002 and 2005 when he tapped the elastic properties of particles to draw a flow map for all granular flows by splitting it into two separate régimes: an “elastic régime” dominated by force chains — heavily loaded quasi-linear “columns” of particles that form internally to the flowing granules — that are strongly dependent on elastic properties versus an “inertial régime” free of force chains.
The latest discovery, which Campbell and graduate student Tontong Guo report this week in Physics of Fluids, by AIP Publishing, involves using annular shear cell measurements of granular flows to confirm that the two flow régimes exist.
An annular shear cell is a device for measuring particle flow properties, and Campbell and Guo ran tests on four different kinds of plastic spherical particles at constant volume flow rates and constant applied stress flows.
“These experiments were difficult to perform,” Campbell acknowledged.
But it was well worth the effort, because “it confirmed our results from 2002 and 2005 — we were able to observe the various régimes and the transitions between them,” said Campbell. “In the recently discovered ‘elastic-inertial régime,’ which is part of the elastic régime, the apparent friction increases with shear rate and is probably where the landslide simulations were operating, although the effect might not be strong enough to explain the low friction observed in long-runout landslides.”
Whereas the earlier work was done using discrete particle computer simulations, the most recent work used direct experimentation.
The implications of this work are significant because almost all solid materials in industries ranging from mining to pharmaceuticals are handled or processed in granular form.
“Granular materials flow under gravity and gravity-driven chutes and hoppers are often used to move materials around these plants. Unfortunately, little is known about how these materials flow so these devices are often designed by trial, which is very expensive,” Campbell explained. “Our current work adds to the basic understanding of granular flow properties.”
What’s next for the group?
“The discrete particle computer simulations used in the early stages of our work are now ubiquitous, and modern computers can be used to model the granular flow through entire processing plants, so they’re starting to be used during the design process for factories,” said Campbell. “Material properties of the particles are the inputs to such programs. We plan to compare the data from these experiments with simulations as a way to assess the most important material properties and how closely we need to match the input properties to get reasonable results from the simulations.”
Reference:
Tongtong Guo and Charles S. Campbell, An experimental study of the elastic theory for granular flows. DOI: 10.1063/1.4961096
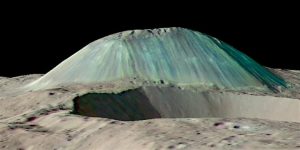
Volcanic dome Ahuna Mons rises above a foreground impact crater, as seen by NASA’s Dawn spacecraft with no vertical exaggeration. Eruptions of salty, muddy water built the mountain by repeated eruptions, flows and freezing. Streaks from falls of rocks and debris run down its flanks, while overhead views show fracturing across its summit. Credit: Dawn Science Team and NASA/JPL-Caltech/GSFC
Ahuna Mons is a volcano that rises 13,000 feet high and spreads 11 miles wide at its base. This would be impressive for a volcano on Earth. But Ahuna Mons stands on Ceres, a dwarf planet less than 600 miles wide that orbits the Sun between Mars and Jupiter. Even stranger, Ahuna Mons isn’t built from lava the way terrestrial volcanoes are — it’s built from ice.
“Ahuna is the one true ‘mountain’ on Ceres,” said David Williams, associate research professor in Arizona State University’s School of Earth and Space Exploration. “After studying it closely, we interpret it as a dome raised by cryovolcanism.”
This is a form of low-temperature volcanic activity, where molten ice — water, usually mixed with salts or ammonia — replaces the molten silicate rock erupted by terrestrial volcanoes. Giant mountain Ahuna is a volcanic dome built from repeated eruptions of freezing salty water.
Williams is part of a team of scientists working with NASA’s Dawn mission who have published papers in the journal Science this week. His specialty is volcanism, and that drew him to the puzzle of Ahuna Mons.
“Ahuna is truly unique, being the only mountain of its kind on Ceres,” he said. “It shows nothing to indicate a tectonic formation, so that led us to consider cryovolcanism as a method for its origin.”
Dawn scientist Ottaviano Ruesch, of NASA’s Goddard Space Flight Center, Greenbelt, Maryland, is the lead author on the Science paper about Ceres volcanism. He says, “This is the only known example of a cryovolcano that potentially formed from a salty mud mix, and which formed in the geologically recent past.”
Williams explained that “Ahuna has only a few craters on its surface, which points to an age of just couple hundred million years at most.”
According to the Dawn team, the implications of Ahuna Mons being volcanic in origin are enormous. It confirms that although Ceres’ surface temperature averages almost -40° (Celsius or Fahrenheit; the scales converge at this temperature), its interior has kept warm enough for liquid water or brines to exist for a relatively long period. And this has allowed volcanic activity at the surface in recent geological time.
Ahuna Mons is not the only place where icy volcanism happens on Ceres. Dawn’s instruments have spotted features that point to cryovolcanic activity that resurfaces areas rather than building tall structures. Numerous craters, for example, show floors that appear flatter than impacts by meteorites would leave them, so perhaps they have been flooded from below. In addition, such flat-floored craters often show cracks suggesting that icy “magma” has pushed them upward, then subsided.
A few places on Ceres exhibit a geo-museum of features. “Occator Crater has several bright spots on its floor,” said Williams. “The central spot contains what looks like a cryovolcanic dome, rich in sodium carbonates.” Other bright spots, he says, occur over fractures that suggest venting of water vapor mixed with bright salts.
“As the vapor has boiled away,” he explained, “it leaves the bright 1salts and carbonate minerals behind. ”
Looking inside
Although volcanic-related features appear across the surface of Ceres, for scientists perhaps the most interesting aspect is what these features say about the interior of the dwarf world. Dawn observations suggest that Ceres has an outer shell that’s not purely ice or rock, but rather a mixture of both.
Recently, Williams was involved in research that discovered that large impact craters are missing, presumably erased by internal heat, but smaller craters are preserved. “This shows that Ceres’ crust has a variable composition — it’s weak at large scales but strong at smaller scales,” he said. “It has also evolved geologically.”
In the big picture, said Williams, “Ceres appears differentiated internally, with a core and a complex crust made of 30 to 40 percent water ice mixed with silicate rock and salts.” And perhaps pockets of brine still exist in its interior.
“We need to continue studying the data to better understand the interior structure of Ceres,” said Williams.
Ceres is the second port of call for the Dawn mission, which was launched in 2007 and visited another asteroid, Vesta, from 2011 to 2012. The spacecraft arrived at Ceres in March 2015. It carries a suite of cameras, spectrometers, and gamma-ray and neutron detectors. These were built to image, map, and measure the shape and surface materials of Ceres, and they collect information to help scientists understand the history of these small worlds and what they can tell us of the solar system’s birth.
NASA plans for Dawn to continue orbiting Ceres and collecting data for another year or so. The dwarf planet is slowly moving toward its closest approach to the Sun, called perihelion, which will come in April 2018. Scientists expect that the growing solar warmth will produce some detectable changes in Ceres’ surface or maybe even trigger volcanic activity.
“We hope that by observing Ceres as it approaches perihelion, we might see some active venting. This would be an ideal way to end the mission,” said Williams.
Reference:
O. Ruesch, T. Platz, P. Schenk, L. A. McFadden, J. C. Castillo-Rogez, L. C. Quick, S. Byrne, F. Preusker, D. P. O’Brien, N. Schmedemann, D. A. Williams, J.-Y. Li, M. T. Bland, H. Hiesinger, T. Kneissl9, A. Neesemann, M. Schaefer2, J. H. Pasckert, B. E. Schmidt, D. L. Buczkowski, M. V. Sykes, A. Nathues, T. Roatsch8, M. Hoffmann, C. A. Raymond, C. T. Russell, Cryovolcanism on Ceres. DOI: 10.1126/science.aaf4286
These are deep-sea worms inhabiting a white methane ice hydrate structure from the Gulf of Mexico. Credit: NOAA Okeanos Explorer Program, Gulf of Mexico 2012 Expedition
New research, led by the University of Southampton, suggests that the release of methane from the seafloor was much slower than previously thought during a rapid global warming event 56 million years ago.
The study, published in the journal Geophysical Research Letters, could allow scientists to better understand the potential effects of rising ocean temperatures worldwide on current and future climate change.
During the Paleocene-Eocene Thermal Maximum (PETM), temperatures in the deep ocean rose by about five degrees Celsius and sea surface temperatures increased by up to nine degrees Celsius. This hot period lasted for about 100,000 years and caused the extinction of many species.
Based on evidence from tiny fossils deposited in sediments at the bottom of the ocean, which record information about the chemical composition of the ocean in their shells, current theories suggest that at the same time as the warming there was a massive release of methane gas from the solid earth into the ocean and atmosphere. A large proportion of Earth’s methane is stored beneath the oceans in the form of an ice-like material called hydrate. This hydrate can melt if the ocean above warms, and melting of hydrate provides a widely accepted mechanism for the methane outburst.
However, the research from the University of Southampton and the National Oceanography Centre casts doubt on this mechanism.
Using computer models of the warming process, the researchers simulated the effects of PETM ocean warming on sediments that may have contained methane hydrate and tracked how methane transport mechanisms would have affected its release into seawater.
Professor Tim Minshull, from Ocean and Earth Science at the University of Southampton and lead author of the study, said: “Our results show that hydrate melting can indeed be triggered by ocean temperature change, but the result is not necessarily a rapid outburst of methane.
“This is because the methane gas formed by hydrate melting below the sea floor takes time to travel up to the seabed, and on the way it can refreeze or dissolve and then be consumed by microbes that live below the seabed. Only a fraction of the methane may escape into the ocean and the part that does escape may take thousands of years to do so.”
“To explain the geological observations by melting of hydrate, much more hydrate must have been present globally than is perhaps reasonable for such a warm late Palaeocene Ocean,” said co-author Professor Paul Wilson, Head of the Palaeoceanography and Palaeoclimate Research Group at the University of Southampton. “And special transport routes would have been needed — perhaps cracks and fissures — to allow the methane to rise to the seabed quickly,” he added.
Professor Minshull said: “Our findings challenge the hypothesised role of methane hydrates for the PETM. They raise important questions about the potential for breakdown of present-day methane hydrates to exacerbate climate change, though current warming rates are much higher even than those during the PETM.”
“Observations of present-day hydrate melting and methane release in several parts of the world have led to suggestions that this process might be happening right now.”
Reference:
T. A. Minshull, H. Marín-Moreno, D. I. Armstrong McKay, P. A. Wilson. Mechanistic insights into a hydrate contribution to the Paleocene-Eocene carbon cycle perturbation from coupled thermohydraulic simulations. Geophysical Research Letters, 2016; DOI: 10.1002/2016GL069676
The ratio of volatile elements in Earth’s mantle suggests that virtually all of the planet’s life-giving carbon came from a collision with an embryonic planet approximately 100 million years after Earth formed. Credit: A. Passwaters/Rice University based on original courtesy of NASA/JPL-Caltech
Research by Rice University Earth scientists suggests that virtually all of Earth’s life-giving carbon could have come from a collision about 4.4 billion years ago between Earth and an embryonic planet similar to Mercury.
In a new study this week in Nature Geoscience, Rice petrologist Rajdeep Dasgupta and colleagues offer a new answer to a long-debated geological question: How did carbon-based life develop on Earth, given that most of the planet’s carbon should have either boiled away in the planet’s earliest days or become locked in Earth’s core?
“The challenge is to explain the origin of the volatile elements like carbon that remain outside the core in the mantle portion of our planet,” said Dasgupta, who co-authored the study with lead author and Rice postdoctoral researcher Yuan Li, Rice research scientist Kyusei Tsuno and Woods Hole Oceanographic Institute colleagues Brian Monteleone and Nobumichi Shimizu.
Dasgupta’s lab specializes in recreating the high-pressure and high-temperature conditions that exist deep inside Earth and other rocky planets. His team squeezes rocks in hydraulic presses that can simulate conditions about 250 miles below Earth’s surface or at the core-mantle boundary of smaller planets like Mercury.
“Even before this paper, we had published several studies that showed that even if carbon did not vaporize into space when the planet was largely molten, it would end up in the metallic core of our planet, because the iron-rich alloys there have a strong affinity for carbon,” Dasgupta said.
Earth’s core, which is mostly iron, makes up about one-third of the planet’s mass. Earth’s silicate mantle accounts for the other two-thirds and extends more than 1,500 miles below Earth’s surface. Earth’s crust and atmosphere are so thin that they account for less than 1 percent of the planet’s mass. The mantle, atmosphere and crust constantly exchange elements, including the volatile elements needed for life.
If Earth’s initial allotment of carbon boiled away into space or got stuck in the core, where did the carbon in the mantle and biosphere come from?
“One popular idea has been that volatile elements like carbon, sulfur, nitrogen and hydrogen were added after Earth’s core finished forming,” said Li, who is now a staff scientist at Guangzhou Institute of Geochemistry, Chinese Academy of Sciences. “Any of those elements that fell to Earth in meteorites and comets more than about 100 million years after the solar system formed could have avoided the intense heat of the magma ocean that covered Earth up to that point.
“The problem with that idea is that while it can account for the abundance of many of these elements, there are no known meteorites that would produce the ratio of volatile elements in the silicate portion of our planet,” Li said.
In late 2013, Dasgupta’s team began thinking about unconventional ways to address the issue of volatiles and core composition, and they decided to conduct experiments to gauge how sulfur or silicon might alter the affinity of iron for carbon. The idea didn’t come from Earth studies, but from some of Earth’s planetary neighbors.
“We thought we definitely needed to break away from the conventional core composition of just iron and nickel and carbon,” Dasgupta recalled. “So we began exploring very sulfur-rich and silicon-rich alloys, in part because the core of Mars is thought to be sulfur-rich and the core of Mercury is thought to be relatively silicon-rich.
“It was a compositional spectrum that seemed relevant, if not for our own planet, then definitely in the scheme of all the terrestrial planetary bodies that we have in our solar system,” he said.
The experiments revealed that carbon could be excluded from the core—and relegated to the silicate mantle—if the iron alloys in the core were rich in either silicon or sulfur.
“The key data revealed how the partitioning of carbon between the metallic and silicate portions of terrestrial planets varies as a function of the variables like temperature, pressure and sulfur or silicon content,” Li said.
The team mapped out the relative concentrations of carbon that would arise under various levels of sulfur and silicon enrichment, and the researchers compared those concentrations to the known volatiles in Earth’s silicate mantle.
“One scenario that explains the carbon-to-sulfur ratio and carbon abundance is that an embryonic planet like Mercury, which had already formed a silicon-rich core, collided with and was absorbed by Earth,” Dasgupta said. “Because it’s a massive body, the dynamics could work in a way that the core of that planet would go directly to the core of our planet, and the carbon-rich mantle would mix with Earth’s mantle.
“In this paper, we focused on carbon and sulfur,” he said. “Much more work will need to be done to reconcile all of the volatile elements, but at least in terms of the carbon-sulfur abundances and the carbon-sulfur ratio, we find this scenario could explain Earth’s present carbon and sulfur budgets.”
Reference:
Carbon and sulfur budget of the silicate Earth explained by accretion of differentiated planetary embryos, Nature Geoscience, nature.com/articles/doi:10.1038/ngeo2801
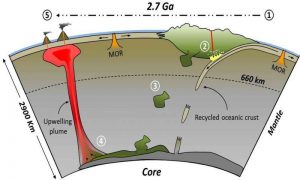
The authors of a new paper believe that raw materials for diamonds and certain unusual oceanic islands come from the same places. From right to left: 1) ocean crust subducts into earth’s mantle deep under a continent; 2) the carbon-rich crust interacts with, and alters, the continental root; 3) part of the altered root drops off and sinks to the mantle/core boundary; 4) the material is taken up in a hot plume that rises back to the surface; 5) the plume erupts from under the seabed to form islands. The scientists estimate the process might take 2.7 billion years. Credit: Y. Weiss et al., Nature 2016
The raw materials of some volcanic islands are shaped by some of the same processes that form diamonds deep under the continents, according to a new study. The study asserts that material from diamond-forming regions journeys nearly to earth’s core and back up to form such islands, a process that could take two and a half billion years or longer—more than half of earth’s entire history. The research challenges some prevailing notions about the workings of the deep earth, and their connections to the surface. The study, led by researchers at Columbia University’s Lamont-Doherty Earth Observatory, appears this week in the scientific journal Nature.
In line with the theory of plate tectonics, scientists believe that many islands far out in the oceans are the product of mantle plumes—hot spots of material welling up from the vast region below earth’s thin crust to erupt on the ocean floor. Examples include the Hawaiian and Galápagos chains. Prevailing thought says the raw material is recycled ocean crust made of the volcanic rock basalt that has been shoved down, or subducted, under the lighter rocks of the continents. This material is then thought to sink as far as 1,800 miles to the mantle’s boundary with earth’s core, then rise back up.
The new study leaves this basic story intact, but adds an intriguing chapter for some lavas with peculiar compositions known as “HIMU,” meaning high μ, the Greek letter geochemists use as shorthand for the ratio of uranium to lead. The solid rocks of the continents stick down into the mantle like teeth set in gums. Thin ocean crust subducting under them often drags along carbon-rich limestone, a common ocean-floor sedimentary rock. Once near the continental roots, some of that carbon gets expelled as a fluid, interacting with and altering rocks there. A hundred miles or more down, this process forms diamond, a pure crystalline form of carbon that sometimes reaches the surface in rapid, explosive eruptions. The new study says chunks of the altered roots may also drop off and sink, to later re-emerge as part of an island-forming eruption.
The key to the finding: a connection between the chemistry of tiny bits of carbon-rich fluids, or inclusions, trapped within diamonds, and that of the lavas that form the HIMU islands. Diamond inclusions comprise the original carbon-rich fluid from which the diamond crystallized, and this fluid contains dozens of other elements that form characteristic abundance patterns. A defining characteristic of the fluids: a high ratio of calcium to aluminum. On the islands studied, the researchers found similarly high calcium-to-aluminum ratios in olivine, a mineral that crystallized from the magmas. They compared the abundance patterns of 28 other elements in the lavas, from cesium to lutetium, and found that the patterns also matched those within diamond inclusions. The conclusion: the diamonds and the lavas came from the same stuff. “It’s not every day that new observations force us to completely rethink a concept that has been accepted for decades,” said coauthor Cornelia Class, a Lamont-Doherty geochemist.
“Trace elements are the fingerprints of geologic processes,” said lead author Yaakov Weiss, a Lamont-Doherty geochemist who studies diamond inclusions. “The key link is that carbon-rich fluids in diamonds that formed 100 miles below the surface and magmas that welled up from 1,800 miles down have the same unique chemical signatures. We can look at diamonds as time capsules, as messengers from a place we have no other way of seeing.” Weiss last year published a study concluding that inclusions showed ancient seawater was involved in the formation of some diamonds.
The scientists analyzed HIMU lavas from the Cook-Austral islands in the south Pacific, and Grand Comore island, in the Indian Ocean. Most samples were taken by coauthor Takeshi Hanyu of the Japan Agency for Marine-Earth Science and Technology, who has previously studied the Cook-Austral rocks. (Another HIMU island, which the team did not study, is the Atlantic Ocean’s St. Helena, where Napoleon was imprisoned following his downfall.) All of these islands formed 20 million years ago or less, meaning that while they themselves are geologically young, their source material is extremely ancient.
The findings are bolstered by previous research from others showing that diamond inclusions and HIMU lavas both contain unique combinations of isotopes of the element sulfur that were common in earth’s atmosphere before 2 billion years ago, after which respiration from photosynthetic algae caused oxygen to accumulate in the air. This shows that the material for both diamonds and HIMU lavas came from the surface long ago.
“The idea that the subcontinental mantle contributes significantly to mantle plumes has been around for over 30 years, but never found general acceptance,” said coauthor Steven Goldstein, also a geochemist at Lamont-Doherty. “While this is likely not the last piece to the HIMU puzzle, it signals a major shift in our view of deep earth dynamics.”
One thing the study does not suggest: that diamonds might be found on oceanic islands. They might have been present in the continental root at the start of its journey, but would have been destroyed along the way.
Reference:
Yaakov Weiss et al, Key new pieces of the HIMU puzzle from olivines and diamond inclusions, Nature (2016). DOI: 10.1038/nature19113
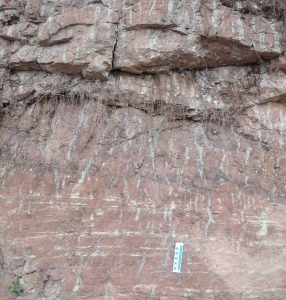
A 410-million-year-old soil shows extensive rhizome traces of Drepanophycus, an early vascular plant related to modern club mosses. Credit: Jinzhuang Xue, Peking University
Plants — even relatively small ones — played a crucial role in establishing a beachhead for life on land, according to recent work by an international team from China, the U.S., the U.K., and the University of Saskatchewan.
The team, led by paleobiologist Jinzhuang Xue from Peking University in Beijing, looked at paleosols — ancient soils that have turned to stone over millions of years — from the Xujiachong Formation of Yunnan, China. The site is unusual in that it has preserved traces of rhizomes, that is the underground systems of plants, that grew there 410 million years ago.
Team member Jim Basinger, a paleobiologist at the U of S, explained that below-ground traces of plant life are not often preserved in the geological record since soils are prone to erosion and disturbance over time.
“Soils are subject to a lot of reworking by physical processes such as erosion and redistribution of sediments, as well as biological processes like invertebrates digging through them,” he said. “Rather than protecting the remains of plants, soil environments actually promote destruction of plant remains.”
The Yunnan site is doubly unusual in that evidence of both rhizomes and above-ground stems of the plant were preserved.
The team found that early in the history of Earth’s terrestrial biosphere, a small plant called Drepanophycus, similar to modern club mosses, was already deeply rooted. This kept soils from washing away and even allowed build up as the resilient above-ground parts of the plants caught silt during floods. These plants — typically a metre long at most — helped form deep, stable soils where other plants could thrive.
“Rhizomes have been around for a long time, but their role in stabilizing sediment has not been recognized, since they have generally been assumed to be shallow or surficial,” Basinger said, explaining that the Yunnan paleosols show rhizomes extending deeply into the soil — something that was assumed to have not happened until much later, when trees appeared.
“This effect was a feature of rhizomes of small and non-woody plants at a time early in the colonization of land,” Basinger said, adding this would have paved the way for more complex forest ecosystems to follow.
These ancient groves would have looked quite alien to modern eyes. Drepanophycus was a lycopsid, one of the oldest lineages of land plants. Descendants of these early lycopsids grew many metres tall, covering vast tracts of land and sharing the landscape with tree ferns and primitive woody plants to form early forests, long before forests familiar to us would evolve. Lycopsids live on today as the diminutive club mosses.
The research team’s findings are featured as the cover article of the August 23 issue of the Proceedings of the National Academy of Sciences (PNAS).
Reference:
Jinzhuang Xue, Zhenzhen Deng, Pu Huang, Kangjun Huang, Michael J. Benton, Ying Cui, Deming Wang, Jianbo Liu, Bing Shen, James F. Basinger, Shougang Hao. Belowground rhizomes in paleosols: The hidden half of an Early Devonian vascular plant. Proceedings of the National Academy of Sciences, 2016; 113 (34): 9451 DOI: 10.1073/pnas.1605051113
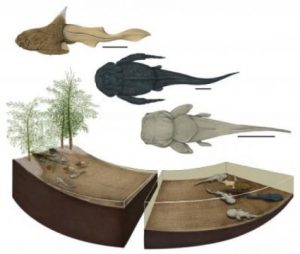
An artist’s depiction of what the Strud nursery ecosystem may have looked like, including the three different placoderm species discovered at the site. The species pictured, from top to bottom, Turrisaspis strudensis (left lateral view), Grossilepis rikiki (dorsal view), Phyllolepis undulata (dorsal view). Credit: Image by Justine Jacquot-Hameon/PLOS-One.
An international team of scientists has described a rare fossil site that is believed to be among the earliest evidence of different fish species using a common nursery — much like ones utilized by some fish today.
A quarry in Strud, Belgium, that was excavated between 2004 and 2015 yielded fossils of multiple species of placoderms, which are extinct, armored fish that represent some of the earliest jawed vertebrates on Earth. Dating back to the Devonian period, an era predating the dinosaurs by hundreds of millions of years, the site yielded smaller-sized fossils that show immature placoderms occupied the area. At the same time, larger placoderm fossils, indicating mature fish, were not found.
“These sorts of juvenile-only assemblages are rare in the fossil record,” said Ted Daeschler, PhD, vice president of the Academy of Natural Sciences of Drexel University, who served as a co-author on the study published in PLOS ONE. “We are quite sure that the juvenile-only placoderm assemblage is not the result of sorting of small material by water currents because there are larger skeletal elements of other kinds of fish. We believe this points to a nursery.”
The study was led by Sébastien Olive, a vertebrate paleontologist in the Royal Belgian Institute of Natural Sciences who is now on a post-doctoral fellowship at the Academy of Natural Sciences of Drexel University. By studying a site like Strud, Olive feels it will help give a more complete picture of ancient life.
“Reconstructing life histories of extinct organisms is a rare opportunity to go beyond simply describing the anatomy of ancient life,” Olive said. “With these sorts of records, we can actually begin to understand aspects of behavior and life history of organisms that went extinct hundreds of millions of years ago.”
The Strud site, which dates to the late part of the Devonian period (more than 360 million years ago), features many pieces of immature fish skeletons that were largely intact despite being small and fragile. As such, this pointed toward slow-moving and shallow water. An environment like that would have been — and remains, for present-day fish — ideal for the development of the young.
“Adult placoderms may have used the nursery of Strud only to lay eggs and/or give live birth, and would have generally lived away from the nursery in deeper waters,” wrote the research team, which also included paleontologists Gaël Clément of the Museum national d’Histoire Naturelle in Paris, and Vincent Dupret, of Uppsala University in Sweden.
An added benefit of the nursery site would have been its protection from predators, thanks to the “large, hard and sometimes spiny” vegetation that was found fossilized on-site.
While the find at Strud is now one of the oldest-known nurseries in the world, similar records exist in Pennsylvania, especially at a site called Red Hill. During the Devonian period, the Pennsylvania and Strud sites would have been relatively close to each other since the Atlantic Ocean hadn’t begun to open to separate them. Daeschler and Olive’s work focused largely on comparing the Red Hill site to Strud, noting many similarities between the two and using the size and shape of placoderm fossils from Red Hill, housed at the Academy of Natural Sciences, to establish the relative maturity of samples found in Strud.
With three different types of placoderm fossils discovered at Strud — Grossilepis rikiki, Turrisaspis strudensis and Phyllolepis undulata — it opens a question for scientists like Daeschler.
“This is the first time that it can be demonstrated that several species seem to have used a common nursery,” Daeschler said. “It makes us wonder: Has that always been a common reproductive strategy?”
Although placoderms are long extinct, getting glimpses of their lives puts more pieces together in the evolutionary puzzle.
“In the case of placoderms like these, we’re looking at some of the earliest jawed vertebrates,” Olive said. “Understanding their life history can give us an idea of the primitive condition from which all other jawed vertebrates evolved.”
Ultimately, Olive and Daeschler hope the Strud site provides a lens through which scientists can study current conditions.
“By studying the past, with the ability to see a moment in time and changes through time, we are better able to understand ecosystems and the organisms that live in them today,” Olive said. “Geologists say that the present is the key to understanding the past. But we can also say that the past is the key to understanding the future.”
Reference:
Sébastien Olive, Gaël Clément, Edward B. Daeschler, Vincent Dupret. Placoderm Assemblage from the Tetrapod-Bearing Locality of Strud (Belgium, Upper Famennian) Provides Evidence for a Fish Nursery. PLOS ONE, 2016; 11 (8): e0161540 DOI: 10.1371/journal.pone.0161540
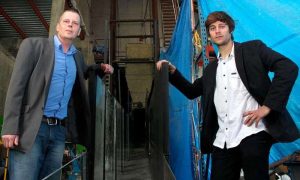
Dr Lube (left) and Dr Breard stand beside the eruption simulator on the Massey Manawatū campus. Credit: Massey University
Massey University researchers have made the first observations of the internal structure of volcanic flows, which are responsible for fifty per cent of volcanic fatalities and endanger half a billion people worldwide.
Co-authored by Dr Eric Breard and Dr Gert Lube from Massey’s Institute of Agriculture and Environment, the paper Coupling of turbulent and non-turbulent flow regimes within pyroclastic density currents has been published in Nature Geoscience.
Pyroclastic density currents (also called pyroclastic flows) are formed during volcanic eruptions and send avalanches of fast-moving clouds of hot ash, rock and gas down the flanks of volcanoes. For years, the inner workings of these flows have been a hotbed of debate between earth scientists, geophysicists, and applied mathematicians, each offering their own explanations of what may be occurring inside.
The infamous city of Pompeii is just one example in a long line of life-claiming incidents involving these flows and Dr Lube describes them as, “amongst the most destructive phenomena on Earth.
“Pyroclastic flows are the most common and lethal volcanic threat, and by analysing the internal structure we are laying the foundations to understand how they will behave in an eruption,” says Dr Lube.
The research sought to create a quantitative view inside the flows to define how the two separate transport regimes (non-turbulent underflow and fully turbulent ash cloud-regions) were able to harmonise and control the severity of the flow itself. However, measuring the inside of an avalanche of several tonnes of rock, gas and ash has proven impossible because of the heat and destructive force of the flows.
“We decided that if they could not see inside one of these flows, then maybe we could replicate one,” says Dr Lube.
This involved using Massey’s one-of-a-kind eruption simulator to synthesise the natural behaviour of the flows in unique large-scale experiments. The simulator works by dropping ash and pumice down a narrow channel while high-speed cameras and sensors capture the data.
Meeting in the middle
The results indicated that the currents met in a previously unrecognised turbulent middle zone, meaning there were not two currents but three.
“Inside this middle zone, the gas-particle mixture behaved fundamentally different from the turbulent suspension cloud above and the particle-rich avalanche of pumice below. Instead, the volcanic particle spontaneously associated in a pattern of dendritic particle clusters called mesoscale clusters.
“Intriguingly, these mesoscale turbulence clusters control how the internal structure and the damage potential of pyroclastic flows evolves during volcanic event,” says Dr Lube.
“This opens a new path towards reliable predictions of their motion, and will be particularly topical for hazard scientists and decision makers, because they will lead to major revisions of volcanic hazard forecasts and ultimately more effective measures for keeping people safe,” says Dr Lube.
Reference:
Eric C. P. Breard et al. Coupling of turbulent and non-turbulent flow regimes within pyroclastic density currents, Nature Geoscience (2016). DOI: 10.1038/ngeo2794