A team of researchers has discovered a flaw in the way past ocean temperatures have been estimated up to now. Their findings could mean that the current period of climate change is unparalleled over the last 100 million years.
According to the methodology widely used by the scientific community, the temperature of the ocean depths and that of the surface of the polar ocean 100 million years ago were around 15 degrees higher than current readings. This approach, however, is now being challenged: ocean temperatures may in fact have remained relatively stable throughout this period, which raises serious concerns about current levels of climate change. These are the conclusions of a study conducted by a team of French researchers from the French National Center for Scientific Research (CNRS), Sorbonne University and the University of Strasbourg, and Swiss researchers from the Swiss Federal Institute of Technology in Lausanne (EPFL) and the University of Lausanne. The study has just been published in Nature Communications.
“If we are right, our study challenges decades of paleoclimate research,” says Anders Meibom, the head of EPFL’s Laboratory for Biological Geochemistry and a professor at the University of Lausanne. Meibom is categorical: “Oceans cover 70% of our planet. They play a key role in Earth’s climate. Knowing the extent to which their temperatures have varied over geological time is crucial if we are to gain a fuller understanding of how they behave and to predict the consequences of current climate change more accurately.”
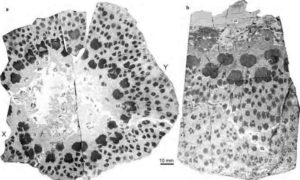
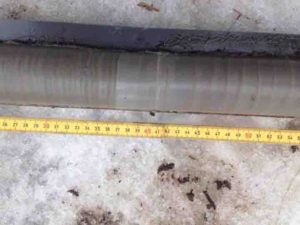
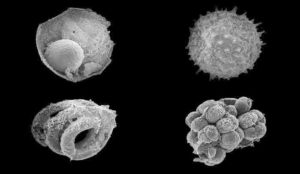
How could the existing methodology be so flawed? The study’s authors believe that the influence of certain processes was overlooked. For over 50 years, the scientific community based its estimates on what they learned from foraminifera, which are the fossils of tiny marine organisms found in sediment cores taken from the ocean floor. The foraminifera form calcareous shells called tests in which the content of oxygen-18 depends on the temperature of the water in which they live. Changes in the ocean’s temperature over time were therefore calculated on the basis of the oxygen-18 content of the fossil foraminifera tests found in the sediment. According to these measurements, the ocean’s temperature has fallen by 15 degrees over the past 100 million years.
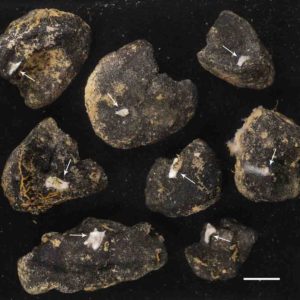
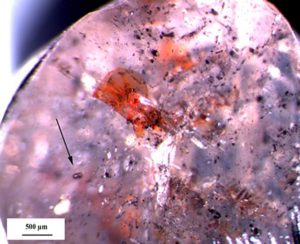
Yet all these estimates are based on the principle that the oxygen-18 content of the foraminifera tests remained constant while the fossils were lodged in the sediment. Indeed, until now, nothing indicated otherwise: no change is visible to the naked eye or under the microscope. To test their hypothesis, the authors of this latest study exposed these tiny organisms to high temperatures in artificial sea water that contained only oxygen-18. Using a NanoSIMS (nanoscale secondary ion mass spectrometer), an instrument used to run very small-scale chemical analyses, they then observed the incorporation of oxygen-18 in the calcareous shells. The results show that the level of oxygen-18 present in the foraminifera tests can in fact change without leaving a visible trace, thereby challenging the reliability of their use as a thermometer: “What appeared to be perfectly preserved fossils are in fact not. This means that the paleotemperature estimates made up to now are incorrect,” says Sylvain Bernard, a CNRS researcher at the Paris-based Institute of Mineralogy, Materials Physics and Cosmochemistry and the study’s lead author.
For the French and Swiss team of researchers, rather than showing a gradual decline in ocean temperatures over the past 100 million years, these measurements simply reflect the change in oxygen-18 content in the fossil foraminifera tests. And this change appears to be the result of a process called re-equilibration: during sedimentation, temperatures rise by 20 to 30°C, causing the foraminifera tests to re-equilibrate with the surrounding water. Over the course of some ten million years, this process has a significant impact on paleotemperature estimates, especially those based on foraminifera that lived in cold water. Computer simulations run by the researchers suggest that paleotemperatures in the ocean depths and at the surface of the polar ocean have been overestimated.
For Meibom, the next steps are clear: “To revisit the ocean’s paleotemperatures now, we need to carefully quantify this re-equilibration, which has been overlooked for too long. For that, we have to work on other types of marine organisms so that we clearly understand what took place in the sediment over geological time.” The article’s authors are already hard at work.
Reference:
S. Bernard, D. Daval, P. Ackerer, S. Pont, A. Meibom. Burial-induced oxygen-isotope re-equilibration of fossil foraminifera explains ocean paleotemperature paradoxes. Nature Communications, 2017; 8 (1) DOI: 10.1038/s41467-017-01225-9
Note: The above post is reprinted from materials provided by Ecole Polytechnique Fédérale de Lausanne.