The East Asian summer monsoon and desertification in Eurasia is driven by fluctuating Northern Hemisphere ice volume and global sea level during the Ice Age, as shown in a study published in Nature Communications. Today, two thirds of the world’s population is dependent on agriculture sustained by rains of the East Asian summer monsoon, and future climate change in this region can therefore have a major impact on global food production.
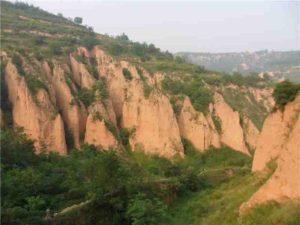
Huge areas of central China is covered by a plateau consisting of a fine grained soil type called loess — a sediment deposited here by winds during the Ice Age. The soils formed on loess are very fertile and have been one of the key factors driving cultural development and population growth in China for thousands of years. Additionally, the loess plateau also contains a geological archive that can be used to decipher past climate changes.
Through detailed examination of the loess sediments, a group led by researchers at Uppsala Univirsity together with colleagues from Denmark has identified how changes in climatological phenomena such as ice volume and sea level also affected the extent of deserts in China, as well as the behavior of the East Asian summer monsoon.
“We have conducted the most detailed dating of the loess to date, which has enabled us to identify changes in the monsoon and desertification processes in more detail and with much greater accuracy than previously possible. We can now compare these changes to other known climate changes such as variation in ice volume, sea level and even the Earth’s orbit during the Ice Age,” says Dr. Thomas Stevens, first author and researcher at Uppsala University.
“We can now show that when ice volume decreased and sea level rose, the summer monsoon rainfalls in East Asia intensified and spread further inland, while sandy deserts in China retreated,” says Dr. Stevens.
With today’s shrinking ice caps and rising sea levels, this has implications for how the Eurasian continent will once again experience changes in the summer monsoon rainfall and desertification.
Reference:
T. Stevens, J.-P. Buylaert, C. Thiel, G. Újvári, S. Yi, A. S. Murray, M. Frechen, H. Lu. Ice-volume-forced erosion of the Chinese Loess Plateau global Quaternary stratotype site. Nature Communications, 2018; 9 (1) DOI: 10.1038/s41467-018-03329-2
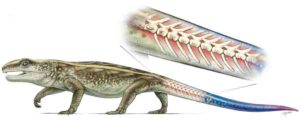
This is an illustration of Captorhinus showing breakable tail vertebrae. Credit: Courtesy Robert Reisz
Imagine that you’re a voracious carnivore who sinks its teeth into the tail of a small reptile and anticipates a delicious lunch, when, in a flash, the reptile is gone and you are left holding a wiggling tail between your jaws.
A new study by the University of Toronto Mississauga research team led by Professor Robert Reisz and PhD student Aaron LeBlanc, published March 5 in the open source journal, Scientific Reports, shows how a group of small reptiles who lived 289 million years ago could detach their tails to escape the grasp of their would-be predators — the oldest known example of such behaviour. The reptiles, called Captorhinus, weighed less than 2 kilograms and were smaller than the predators of the time. They were abundant in terrestrial communities during the Early Permian period and are distant relatives of all the reptiles today.
As small omnivores and herbivores, Captorhinus and its relatives had to scrounge for food while avoiding being preyed upon by large meat-eating amphibians and ancient relatives of mammals. “One of the ways captorhinids could do this,” says first author LeBlanc, “was by having breakable tail vertebrae.” Like many present-day lizard species, such as skinks, that can detach their tails to escape or distract a predator, the middle of many tail vertebrae had cracks in them.
It is likely that these cracks acted like the perforated lines between two paper towel sheets, allowing vertebrae to break in half along planes of weakness. “If a predator grabbed hold of one of these reptiles, the vertebra would break at the crack and the tail would drop off, allowing the captorhinid to escape relatively unharmed,” says Reisz, a Distinguished Professor of Biology at the University of Toronto Mississauga.
The authors note that being the only reptiles with such an escape strategy may have been a key to their success, because they were the most common reptiles of their time, and by the end of the Permian period 251 million years ago, captorhinids had dispersed across the ancient supercontinent of Pangaea. This trait disappeared from the fossil record when Captorhinus died out; it re-evolved in lizards only 70 million years ago.
They were able to examine more than 70 tail vertebrae — both juveniles and adults — and partial tail skeletons with splits that ran through their vertebrae. They compared these skeletons to those of other reptilian relatives of captorhinids, but it appears that this ability is restricted to this family of reptiles in the Permian period.
Using various paleontological and histological techniques, the authors discovered that the cracks were features that formed naturally as the vertebrae were developing. Interestingly, the research team found that young captorhinids had well-formed cracks, while those in some adults tended to fuse up. This makes sense, since predation is much greater on young individuals and they need this ability to defend themselves.
This study was possible thanks to the treasure trove of fossils available at the cave deposits near Richards Spur, Oklahoma.
Reference:
A. R. H. LeBlanc, M. J. MacDougall, Y. Haridy, D. Scott, R. R. Reisz. Caudal autotomy as anti-predatory behaviour in Palaeozoic reptiles. Scientific Reports, 2018; 8 (1) DOI: 10.1038/s41598-018-21526-3
The risk of human-made earthquakes due to fracking is greatly reduced if high-pressure fluid injection used to crack underground rocks is 895m away from faults in the Earth’s crust, according to new research.
The recommendation, from the ReFINE (Researching Fracking) consortium, is based on published microseismic data from 109 fracking operations carried out predominantly in the USA.
Jointly led by Durham and Newcastle Universities, UK, the research looked at reducing the risk of reactivating geological faults by fluid injection in boreholes.
Researchers used microseismic data to estimate how far fracking-induced fractures in rock extended horizontally from borehole injection points.
The results indicated there was a one per cent chance that fractures from fracking activity could extend horizontally beyond 895m in shale rocks.
There was also a 32 per cent chance of fractures extending horizontally beyond 433m, which had been previously suggested as a horizontal separation distance between fluid injection points and faults in an earlier study.
The research is published in the journal Geomechanics and Geophysics for Geo-Energy and Geo-Resources.
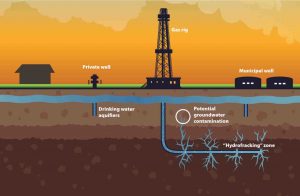
Fracking — or hydraulic fracturing — is a process in which rocks are deliberately fractured to release oil or gas by injecting highly pressurised fluid into a borehole. This fluid is usually a mixture of water, chemicals and sand.
In 2011 tremors in Blackpool, UK, were caused when injected fluid used in the fracking process reached a previously unknown geological fault at the Preese Hall fracking site.
Fracking is now recommencing onshore in the UK after it was halted because of fracking-induced earthquakes.
Research lead author Miles Wilson, a PhD student in Durham University’s Department of Earth Sciences, said: “Induced earthquakes can sometimes occur if fracking fluids reach geological faults. Induced earthquakes can be a problem and, if they are large enough, could damage buildings and put the public’s safety at risk.
“Furthermore, because some faults allow fluids to flow along them, there are also concerns that if injected fluids reach a geological fault there is an increased risk they could travel upwards and potentially contaminate shallow groundwater resources such as drinking water.
“Our research shows that this risk is greatly reduced if injection points in fracking boreholes are situated at least 895m away from geological faults.”
The latest findings go further than a 2017 ReFINE study which recommended a maximum distance of 433m between horizontal boreholes and geological faults. That research was based upon numerical modelling in which a number of factors, including fluid injection volume and rate, and fracture orientation and depth, were kept constant.
Researchers behind the latest study said that changing these parameters might lead to different horizontal extents of fractures from fluid injection points.
The researchers added that this did not mean the modelling results of the previous study were wrong. Instead they said the previous study was approaching the same problem using a different method and the new study provided further context.
In the latest research the researchers used data from previous fracking operations to measure the distance between the furthest detected microseismic event — a small earthquake caused by hydraulic fracturing of the rock or fault reactivation — and the injection point in the fracking borehole.
From the 109 fracking operations analysed, the researchers found that the horizontal extent reached by hydraulic fractures ranged from 59m to 720m.
There were 12 examples of fracking operations where hydraulic fractures extended beyond the 433m proposed in the 2017 study.
According to the new study, the chance of a hydraulic fracture extending beyond 433m in shale was 32 per cent and beyond 895m was one per cent.
The research also found that fracking operations in shale rock generally had their furthest detected microseismic events at greater distances than those in coal and sandstone rocks.
Microseismic data was used in previous Durham University research from 2012. This suggested a minimum vertical distance of 600m between the depth of fracking and aquifers used for drinking water, which now forms the basis of hydraulic fracturing regulation in the UK’s Infrastructure Act 2015.
Professor Richard Davies, Newcastle University, who leads the ReFINE project, said: “We strongly recommend that for the time being, fracking is not carried out where faults are within 895m of the fracked borehole to avoid the risk of fracking causing earthquakes and that this guideline is adopted world-wide.”
ReFINE is led jointly by Durham and Newcastle Universities and has been funded by the Natural Environment Research Council (UK), Total, Shell, Chevron, GDF Suez, Centrica and Ineos.
Working closely with a global network of leading scientists and institutions, ReFINE focuses on researching the potential environmental risks of hydraulic fracturing for shale gas and oil exploitation.
Reference:
M. P. Wilson, F. Worrall, R. J. Davies, S. Almond. Fracking: How far from faults? Geomechanics and Geophysics for Geo-Energy and Geo-Resources, 2018; DOI: 10.1007/s40948-018-0081-y
Note: The above post is reprinted from materials provided by Durham University.
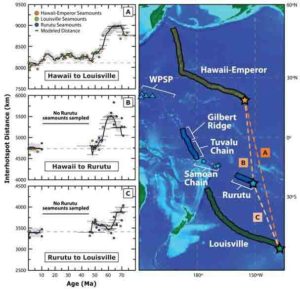
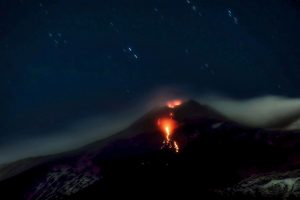
The graph shows the dates of volcanoes of the three volcanic chains in the Pacific and their relative movement over time (left). The location of the three volcanic chains shown in the map (right). The stars mark the youngest end or the active volcanoes today. Credit: Nature Communications, Kevin Konrad et al.
The island chain of Hawaii consists of several volcanoes, which are fed by a “hotspot.” In geosciences a “hotspot” refers to a phenomenon of columnar shaped streams, which transport hot material from the deep mantle to the surface. Like a blow torch, the material burns through the Earth’s crust and forms volcanoes. For a long time, it was assumed that these hotspots are stationary. If the tectonic plate moves across it, a chain of volcanoes evolves, with the youngest volcano at one end, the oldest at the other.
This concept was initially proposed for the Hawaiian Islands. They are the youngest end of the Hawaiian-Emperor chain that lies beneath the Northwest Pacific. But soon there was doubt over whether hotspots are truly stationary. The biggest contradiction was a striking bend of about 60 degrees in this volcanic chain, which originated 47 million years ago. “If you try to explain this bend with just a sudden change in the movement of the Pacific Plate, you would expect a significantly different direction of motion at that time relative to adjacent tectonic plates,” says Bernhard Steinberger of the GFZ German Research Center for Geosciences. “But we have not found any evidence for that.” Recent studies have suggested that apparently two processes were effective: On the one hand, the Pacific Plate has changed its direction of motion. On the other hand, the Hawaiian hotspot moved relatively quickly southward in the period from 60 to about 50 million years ago — and then stopped. If this hotspot motion is considered, only a smaller change of Pacific plate motions is needed to explain the volcano chain.
This hypothesis is now supported by work in which Steinberger is also involved. First author Kevin Konrad, Oregon State University in Corvallis, Oregon, and his team have evaluated new rock dating of volcanoes in the Rurutu volcanic chain, including, for example, the Tuvalu volcanic islands in the Western Pacific. Furthermore, they added similar data from the Hawaiian-Emperor chain and the Louisville chain in the Southern Pacific. Based on the geography and the age of volcanoes in these three chains, researchers can look into the geological past and see how the three hotspots have moved relative to each other over millions of years.
The new data published in the journal Nature Communications shows that the relative motion of hotspots under the Rurutu and Louisville is small while the Hawaiian-Emperor hotspot displays strong motion between 60 and 48 million years ago relative to the other two hotspots. “This makes it very likely that mainly the Hawaii hotspot has moved,” says Steinberger. According to his geodynamic modelling the Hawaiian hotspot moved at a rate of several tens of kilometers per million years. Paleomagnetic data support this interpretation, says Steinberger. “Our models for the motion of the Pacific Plate and the hotspots therein still have some inaccuracies. With more field data and information about the processes deep in the mantle, we hope to explain in more detail how the bend in the Hawaiian-Emperor chain has evolved.”
Reference:
Kevin Konrad, Anthony A. P. Koppers, Bernhard Steinberger, Valerie A. Finlayson, Jasper G. Konter, Matthew G. Jackson. On the relative motions of long-lived Pacific mantle plumes. Nature Communications, 2018; 9 (1) DOI: 10.1038/s41467-018-03277-x
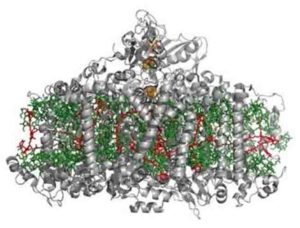
This image is the crystal structure of Photosystem I. Credit: Image courtesy of Elsevier
The earliest oxygen-producing microbes may not have been cyanobacteria.
Ancient microbes may have been producing oxygen through photosynthesis a billion years earlier than we thought, which means oxygen was available for living organisms very close to the origin of life on earth. In a new article in Heliyon, a researcher from Imperial College London studied the molecular machines responsible for photosynthesis and found the process may have evolved as long as 3.6 billion years ago.
The author of the study, Dr. Tanai Cardona, says the research can help to solve the controversy around when organisms started producing oxygen — something that was vital to the evolution of life on earth. It also suggests that the microorganisms we previously believed to be the first to produce oxygen — cyanobacteria — evolved later, and that simpler bacteria produced oxygen first.
“My results mean that the process that sustains almost all life on earth today may have been doing so for a lot longer than we think,” said Dr. Cardona. “It may have been that the early availability of oxygen was what allowed microbes to diversify and dominate the world for billions of years. What allowed microbes to escape the cradle where life arose and conquer every corner of this world, more than 3 billion years ago.”
Photosynthesis is the process that sustains complex life on earth — all of the oxygen on our planet comes from photosynthesis. There are two types of photosynthesis: oxygenic and anoxygenic. Oxygenic photosynthesis uses light energy to split water molecules, releasing oxygen, electrons and protons. Anoxygenic photosynthesis use compounds like hydrogen sulfide or minerals like iron or arsenic instead of water, and it does not produce oxygen.
Previously, scientists believed that anoxygenic evolved long before oxygenic photosynthesis, and that the earth’s atmosphere contained no oxygen until about 2.4 to 3 billion years ago. However, the new study suggests that the origin of oxygenic photosynthesis may have been as much as a billion years earlier, which means complex life would have been able to evolve earlier too.
Dr. Cardona wanted to find out when oxygenic photosynthesis originated. Instead of trying to detect oxygen in ancient rocks, which is what had been done previously, he looked deep inside the molecular machines that carry out photosynthesis — these are complex enzymes called photosystems. Oxygenic and anoxygenic photosynthesis both use an enzyme called Photosystem I. The core of the enzyme looks different in the two types of photosynthesis, and by studying how long ago the genes evolved to be different, Dr. Cardona could work out when oxidative photosynthesis first occurred.
He found that the differences in the genes may have occurred more than 3.4 billion years ago — long before oxygen was thought to have first been produced on earth. This is also long before cyanobacteria — microbes that were thought to be the first organisms to produce oxygen — existed. This means there must have been predecessors, such as early bacteria, that have since evolved to carry out anoxygenic photosynthesis instead.
“This is the first time that anyone has tried to time the evolution of the photosystems,” said Dr. Cardona. “The result hints towards the possibility that oxygenic photosynthesis, the process that have produced all oxygen on earth, actually started at a very early stage in the evolutionary history of life — it helps solve one of the big controversies in biology today.”
One surprising finding was that the evolution of the photosystem was not linear. Photosystems are known to evolve very slowly — they have done so since cyanobacteria appeared at least 2.4 billion years ago. But when Dr. Cardona used that slow rate of evolution to calculate the origin of photosynthesis, he came up with a date that was older than the earth itself. This means the photosystem must have evolved much faster at the beginning — something recent research suggests was due to the planet being hotter.
“There is still a lot we don’t know about why life is the way it is and how most biological process originated,” said Dr. Cardona. “Sometimes our best educated guesses don’t even come close to representing what really happened so long ago.”
Dr. Cardona hopes his findings may also help scientists who are looking for life on other planets answer some of their biggest questions.
Reference:
Tanai Cardona. Early Archean origin of heterodimeric Photosystem I. Heliyon, 2018; 4 (3): e00548 DOI: 10.1016/j.heliyon.2018.e00548
Note: The above post is reprinted from materials provided by Elsevier.
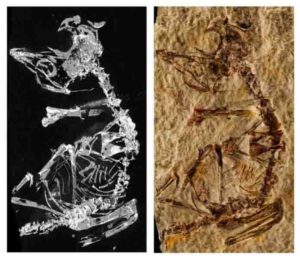
“Enantiornithes” Phosphorous mapping image and photo of fossil. Credit: Dr. Fabien Knoll
The tiny fossil of a prehistoric baby bird is helping scientists understand how early avians came into the world in the Age of Dinosaurs.
The fossil, which dates back to the Mesozoic Era (250-65 million years ago), is a chick from a group of prehistoric birds called, Enantiornithes. Made up of a nearly complete skeleton, the specimen is amongst the smallest known Mesozoic avian fossils ever discovered.
It measures less than five centimetres — smaller than the little finger on an average human hand — and would have weighed just three ounces when it was alive. What makes this fossil so important and unique is the fact it died not long after its birth. This is a critical stage in a bird’s skeletal formation. That means this bird’s extremely short life has given researchers a rare chance to analyse the species’ bone structure and development.
Studying and analysing ossification — the process of bone development — can explain a lot about a young bird’s life the researchers say. It can help them understand everything from whether it could fly or if it needed to stay with its parents after hatching or could survive on its own.
The lead author of the study, Fabien Knoll, from The University of Manchester’s Interdisciplinary Centre for Ancient Life (ICAL), School of Earth and Environmental Sciences, and the ARAID — Dinopolis in Spain explains: ‘The evolutionary diversification of birds has resulted in a wide range of hatchling developmental strategies and important differences in their growth rates. By analysing bone development we can look at a whole host of evolutionary traits.’
With the fossil being so small the team used synchrotron radiation to picture the tiny specimen at a ‘submicron’ level, observing the bones’ microstructures in extreme detail.
Knoll said: ‘New technologies are offering palaeontologists unprecedented capacities to investigate provocative fossils. Here we made the most of state-of-the-art facilities worldwide including three different synchrotrons in France, the UK and the United States.’
The researchers found the baby bird’s sternum (breastplate bone) was still largely made of cartilage and had not yet developed into hard, solid bone when it died, meaning it wouldn’t have been able to fly.
The patterns of ossification observed in this and the other few very young enantiornithine birds known to date also suggest that the developmental strategies of this particular group of ancient avians may have been more diverse than previously thought.
However, the team say that its lack of bone development doesn’t necessarily mean the hatchling was over reliant on its parents for care and feeding, a trait known as being ‘altricial’. Modern day species like love birds are highly dependent on their parents when born. Others, like chickens, are highly independent, which is known as ‘precocial’. Although, this is not a black-and-white issue, but rather a spectrum, hence the difficulty in clarifying the developmental strategies of long gone bird species.
Luis Chiappe, from the LA Museum of Natural History and study’s co-author added: ‘This new discovery, together with others from around the world, allows us to peek into the world of ancient birds that lived during the age of dinosaurs. It is amazing to realise how many of the features we see among living birds had already been developed more than 100 million years ago.’
Reference:
Fabien Knoll, Luis M. Chiappe, Sophie Sanchez, Russell J. Garwood, Nicholas P. Edwards, Roy A. Wogelius, William I. Sellers, Phillip L. Manning, Francisco Ortega, Francisco J. Serrano, Jesús Marugán-Lobón, Elena Cuesta, Fernando Escaso, Jose Luis Sanz. A diminutive perinate European Enantiornithes reveals an asynchronous ossification pattern in early birds. Nature Communications, 2018; 9 (1) DOI: 10.1038/s41467-018-03295-9
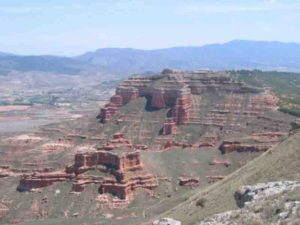
This is the Calatayud-Daroca Basin in Central Spain. Credit: Michael Hren
New research, published in Scientific Reports, has outlined a new methodology for estimating ancient atmospheric water content based on fossil plant leaf waxes.
As the Earth’s surface and atmosphere warm, the amount of moisture — water vapour — in the atmosphere will increase. Understanding the size of this increase is important for predicting future climates as water vapour is a significant greenhouse gas. Atmospheric moisture content also influences the patterns and intensity of rainfall events.
The relationship between temperature and moisture content can be explored by the study of intervals in Earth’s history when climates where significantly warmer than those seen in modern times, which necessitates a method for estimating ancient atmospheric moisture content.
Dr Yvette Eley, from the University of Birmingham, explained, “If we want to understand how the Earth would work with a climate substantially warmer than today, we have to study intervals millions of years in the past — made difficult because these warm climates are much older than our oldest climate records from Antarctic ice cores (less than one million years old).”
To try and understand climate properties related to the atmosphere — like rainfall and atmospheric moisture content — in such ancient times is very challenging. Existing methods, using calcium carbonate concretions that form in soils, or the chemistry of fossilised mammal teeth, are both hampered by their relative rarity in ancient sediments.
Dr Eley added, “Our new approach to quantifying ancient atmospheric moisture content relies on the fundamental properties of plant leaves, and how they alter their protective waxy coverings in response to water stress. These leaf waxes are tough and resistant, and are regularly found as what we call biomarker compounds in ancient river, lake and even marine sediments.”
A method of estimating ancient moisture content based on these plant wax compounds overcomes the limitations of other methods because plant waxes are commonly found in soils and sediments stretching back tens or even hundreds of millions of years and across many environments.
The validity of this new tool was proven in studies of modern soils across the US and Central America, carried out by the research team of Associate Professor Michael Hren in the Center for Integrative Geosciences at the University of Connecticut. These studies showed a clear relationship between the chemistry of these waxy compounds and the amount of moisture in the atmosphere.
“What we see is that the distribution of organic compounds preserved in soils seems to be strongly related to the difference between how much water is in an air mass, and how much the air mass can hold, or what is known as the vapour pressure deficit,” says Dr Hren.
Eley and Hren then applied their new proxy to reconstruct atmospheric moisture content in Central Spain during an interval 15 to 17 million years ago.
Although consistently much warmer than pre-industrial conditions, this interval marks one of the cooling steps that led to the development of the modern world. The new data confirms the expectations of climate models, that atmospheric cooling is coupled to less atmospheric moisture. The reconstructed changes in atmospheric moisture also align with results from other independent proxies used to investigate changes in temperature and rainfall in the region.
Dr Eley said, “This gives us the confidence that our proxy works, and we have every reason to believe that it will do so for future exploration into the even deeper past. We hope the results of this exploration will provide direct data to test our understanding of the relationship between global warming, atmospheric moisture content and rainfall systems.”
Reference:
Yvette L. Eley, Michael T. Hren. Reconstructing vapor pressure deficit from leaf wax lipid molecular distributions. Scientific Reports, 2018; 8 (1) DOI: 10.1038/s41598-018-21959-w
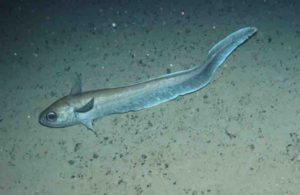
This is a roundnose grenadier at 1,300m off the Hebrides, Scotland. The photo is from a towed camera. Credit: Marine Scotland Science
Scientists have found evidence of natural selection in a deep-sea fish species adapting to the depth of ocean that it inhabits.
The team of researchers, led by Professor Rus Hoelzel in Durham University’s (UK) Department of Biosciences (together with collaborators from the Department of Earth Sciences in Durham, the University of Liverpool and Marine Scotland), studied a species of fish called the roundnose grenadier.
They say this is the first evidence of natural selection maintaining separate specialised types of the same species of fish, each adapting to different habitat depths within a single population spanning two kilometres of depth in the deep sea.
Their study is published in the journal Nature Ecology & Evolution.
The researchers said that an important transition in the deep sea is where the penetration of light ends dividing the relatively vibrant mesopelagic from the dark bathypelagic part of the ocean below approximately 1,000m.
The roundnose grenadier has a remarkably broad habitat range in the deep sea, from 180-2,600m in depth.
The research looked at a section of ocean inhabited by this species running from 750m to 1,800m at a single location, crossing the boundary between the “light” and “dark” parts of the ocean.
They sequenced the entire nuclear genome of this species, and identified all of the genes within that genome that code for biological functions. They then sequenced 60 more genomes, 15 from each of four depths (750m, 1,000m, 1,500m and 1,800m). This revealed adaptation to depth at functional genes, with all of the 1,800m fish different from the others that lived at shallower depths.
Those adapted genes were associated with the building of different body forms and functions as the individual matures. Furthermore, they found strong evidence for ongoing natural selection such that either extreme form was favoured at the expense of the intermediate type.
This “disruptive” selection can lead to the evolution of new species when the different types also mate preferentially with their own type.
However, in this case, there was no clear evidence for mating with one’s own type. Instead, the young (‘fry’) fish stay at approximately1,000m until they mature, and then segregate to different depths according to their genetic makeup.
This provides a uniquely clear example of how different specialists within the same species, in this case adaption to life at different habitat depths, can be maintained even within the same geographic population. This might help prepare a species for a rapid response to a changing environment, such as rapid climate change.
Differentiation among ecotypes may be driven by the distinction between a resource rich environment in shallower water, and a relatively resource poor environment deeper down the slope.
Lead author, Professor Rus Hoelzel, in Durham University’s, Department of Biosciences, said: “The oceans represent vast expanses across which there are few obvious barriers to movement.
“As in the environment above the sea, we tend to think about movement in a horizontal dimension, across the breadth of the oceans, but at sea there are perhaps even greater habitat boundaries and gradients as species move vertically with depth.
“Our research shows that these fish have adapted to life at different depths, and that they segregate by depth as they mature, based on their genetic makeup.”
The research was funded by the Natural Environment Research Council (NERC)
Reference:
Michelle R. Gaither, Georgios A. Gkafas, Menno de Jong, Fatih Sarigol, Francis Neat, Thomas Regnier, Daniel Moore, Darren R. Grӧcke, Neil Hall, Xuan Liu, John Kenny, Anita Lucaci, Margaret Hughes, Sam Haldenby, A. Rus Hoelzel. Genomics of habitat choice and adaptive evolution in a deep-sea fish. Nature Ecology & Evolution, 2018; DOI: 10.1038/s41559-018-0482-x
Note: The above post is reprinted from materials provided by Durham University.
Representative Image The world’s largest uncut diamond Credit: AFP: Don Emmert
What’s in a Mineral Name?
Before 1960 mineralogists would introduce new mineral names in In 1960, to reduce this chaos the International Mineralogical Society established
In 1960, to reduce this chaos the International Mineralogical Society established the Commission on New Minerals and Mineral Names. Now when mineralogists believe they have found a new mineral, they send their data and proposed name to the Commission. If the Commission is convinced that the mineral has not been previously described and that the name is suitable, THEN the mineralogists may publish their data. This cuts down on confusion by keeping names out of print until there is enough data to prove conclusively that they refer to a mineral that hasn’t been previously named. The procedures of the Commission are described in detail by Dunn and Mandarino (1988).
The Commission also works on problems with minerals named before 1960. For example, “sphene” and “titanite” refer to the same mineral. When I took mineralogy as a student, “sphene” was the name commonly in use. The commission found that “titanite” had been proposed first, hence “titanite” is now the approved name. Similarly celestine replaces celestite, although you may still see either name on mineral labels.
Since 1960, the Commission has approved over hundreds of new minerals, an average of over 43 per year. Most of these are rare and found only in tiny grains. Is there any chance mineralogists will run out of names? Possibly. For example, some workers wanted to honor a mineralogist Paul Moore by naming a mineral after him. But there was already a mooreite, so the new was named…paulmooreite. We also have minerals named jerrygibbsite, jimthompsonite, jeremejevite and joesmithite. As funny as these names may appear, they refer precisely to unique minerals, are substantiated by the Commission, and are accepted world‐wide.
Origin of Names for Rocks and Minerals
The Rock and Mineral names can be traced quite often to Greek and to Latin. It is common practice to add an “ite” to a mineral name. The suffix “ite” is derived from the Greek word lithos (from its adjectival form -ites), meaning rock or stone. While the vast majority of mineral names end in “ite,” some have the suffixes “ine” or “ide.” Most original names referred to physical characteristics of the rock or mineral, to the location where the rock or mineral was first found, or sometimes to the magical powers attributed to that rock or mineral. In fact this way of naming stones is still common today, with the addition of naming the rock and mineral for a person.
Physical characteristics is actually the most consistent way to name a rock or mineral, as those characteristics rarely change. Malachite‘s name is from the Greek, malache, – “mallow” in reference to its green leaf color. Azurite came from azure which is derived from the Arabic word for blue. And Kyanite’s name is derived from the Greek word kyanos, also meaning blue. I can only think of one example of how this isn’t accurate-Carnelian’s name is derived from the Latin word meaning flesh, in reference to the flesh color sometimes exhibited. But Carnelian’s color can actually range from peach or flesh colored to light brownish red to deep transparent red.
Naming a rock or mineral after the location it is found is much more complicated. Along with physical characteristics, this is a common way to name agate stones and jasper stones and is a great way to individualize the agate or jasper. Such as Willow Creek Jasper, Biggs Jasper, and Brazilian Agate. But when the rock or mineral is not a member of the agate or jasper family it gets more difficult. For instance Labradorite is named for where it was first found near Labrador, Canada. But now most Labradorite on the market is coming from Madagascar. Shattuckite is named from where it was first found, i.e. the Shattuck mine, in Bisbee, Arizona. Until around 2003/2004, the Shattuckite Mine was the ONLY mine in the world producing this mineral. Now most of this material is coming from the Congo in Africa. And of course Agate was named from where it was first found – by the River Achates (now called the river Drillo) in Sicily, but agate is found on every continent!
Even more questionable is the practice of naming a rock or mineral after a person. Prehnite, named for Colonel Hendrik Von Prehn (1733-1785), has the distinction of being the first mineral named after a person. Covellite was named after the Italian mineralogist Niccolo Covelli (1790-1829) who first discovered this mineral on the slopes of Mount Vesuvius. Sometimes not only the discoverer is honored in such a way, but even princes, politicians, and others can be honored, who may actually have had nothing to do with the rock or mineral. Dumortierite was first discovered in 1881 and named for the French paleontologist Eugene Dumortier (1803-1873).
Though less common, sometimes rock names are from their magical powers. Amethyst’s name comes from Greek and means “not drunken.” This was due to a belief that it would ward off the effects of alcohol. Travertine from Arizona is called Spirit Stone by the Navajos, who believe history is told in its layers. And Magnetite and Pyrite is refered to as Healers Gold in the metaphysical world.
Also more recently it has become common to give rocks and minerals “trade names”. This is often done to make the name more romantic or more marketable (Royal Lavulite in place of Sugilite), to separate the high grade version of the material from the more common and less expensive variety (Imperial Jade is just high grade jade and Tsavorite is a green Garnet), to identify a specific variety of a mineral (Rubelite is actually a pink Tourmaline, Emerald is actually a green Beryl), or even to hide the actual rock or mineral name to avoid giving away the source to competitors. Sometimes a rock is composed of several minerals as in the recent find of Chrysocolla, Cuprite, Chalcotricite and other copper ores from Mexico. Since one mineral name would not be accurate and using them all would be cumbersome, it was named “Sonora Sunset”. Unfortunately it also is referred to as Sonora Sunrise, Crimson Cuprite, and even Sangria de Toro! This can get very confusing!
New minerals are discovered even now. According to the International Mineralogical Association, the organization founded in 1958 who is responsible for tracking and naming new minerals, there are currently more than 4,000 known minerals. In order to name a new mineral, a proposal must be submitted to the International Mineralogical Association’s Commission on New Minerals, Nomenclature, and Crystallography. This is a complicated process in which you must provide specific information on the chemistry and crystallography of the substance, as well as information on the geologic setting in which it was found, and the proposed name for the substance. Of course this is for a new, peviously undiscovered mineral. If what you found is a variety of a established mineral, or a rock-described as a combination of one of more minerals-there really isn’t an official naming process. There are so many varieties of agates and jaspers-the same material but extremely different in color, pattern, and even value! They really need individual names to identify the material. Naming these materials is usually up to the miner or the person promoting it for sale. Once named the name usually does stick, as the more “known” the material the higher the value.
Reference:
Dunn, P.J., and J. Mandarino, 1988, “The Commission on New Minerals and Mineral Names: Its History, Purpose and General Practice”, Mineralogical Record, vol. 19 #5, p. 319‐323.
Mandarino, J and M. Back, 2004, Fleischer,’s Glossary of Mineral Species ‐2004, Mineralogical Record Pub. Co., P.O. Box 355565, Tucson, Arizona, 85740, 309 p.
Dr. Bill Cordua University of Wisconsin‐River Falls
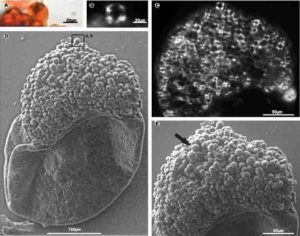
Fossilized bubbles and cyanobacterial fabric from 1.6 billion-year-old phosphatized microbial mats from Vindhyan Supergroup, central India. Credit: Stefan Bengtson. Credit: Stefan Bengtson
Take a good look at this photo: It shows you 1.6 billion years old fossilized oxygen bubbles, created by tiny microbes in what was once a shallow sea somewhere on young Earth.
The bubbles were photographed and analyzed by researchers studying early life on Earth.
Microbes are of special interest: They were not only the first life forms on Earth. They also turned our planet into a tolerable environment for plants and animals and thus their activity paved the way for life as we know it today.
Some of these early microbes were cyanobacteria that thrived in early shallow waters. They produced oxygen by photosynthesis, and sometimes the oxygen got trapped as bubbles within sticky microbial mats.
Fossilized bubbles and cyanobacterial fabric from 1.6 billion-year-old phosphatized microbial mats from Vindhyan Supergroup, central India. Credit Stefan Bengtson.
The bubbles in the photo were preserved, and today they can be seen as a signature for life.
Ph.D. Therese Sallstedt and colleagues from University of Southern Denmark, Swedish Museum of Natural History and Stockholm University studied fossilized sediments from India, and they found round spheres in the microbial mats.
We interpret them as oxygen bubbles created in cyanobacterial biomats in shallow waters 1,6 billion years ago, said Therese Sallstedt.
Cyanobacteria changed the face of the Earth irreversibly since they were responsible for oxygenating the atmosphere. Simultaneously they constructed sedimentary structures called stromatolites, which still exist on Earth today.
The researchers now think that cyanobacteria played a larger role than previously believed in creating phosphorites in shallow waters, thereby allowing today’s scientists a unique window into ancient ecosystems. They published their findings in the journal Geobiology.
Reference:
T. Sallstedt, S. Bengtson, C. Broman, P. M. Crill, D. E. Canfield. Evidence of oxygenic phototrophy in ancient phosphatic stromatolites from the Paleoproterozoic Vindhyan and Aravalli Supergroups, India. Geobiology, 2018; 16 (2): 139 DOI: 10.1111/gbi.12274
UConn researchers analyzed leaf wax compounds in soils and sediment to reconstruct ancient climates, with a view to better understanding the impact of future climate change. Credit: Getty Images
In Scientific Reports today, UConn researchers report a novel approach to reconstructing ancient climates using analyses of organic compounds in sediments and soils.
This method was developed by former UConn postdoctoral scientist Yvette Eley (now in the Department of Geography, Earth and Environmental Sciences at the University of Birmingham, U.K.) and assistant professor Michael Hren in the UConn Center for Integrative Geosciences. Their new approach makes use of organic compounds found in the waxy, lipid-rich cuticle of plants. These waxy surfaces are critical to plant survival, as they minimize water loss and provide protection from factors such as UV radiation.
The distribution of organic compounds in leaf waxes records information about their growing environment. For instance, when confronted with stressful conditions such as shortage of water, plants can respond by changing the distribution of organic compounds in their leaf wax to combat water loss and improve their chances of survival. Various environmental parameters can therefore result in plants with different distributions of lipids, and these profiles can reveal a lot about the climate those plants were growing in.
Once incorporated into the soil, these organic compounds can be preserved over tens to hundreds of millions of years, offering the potential to quantify changes to regional and global moisture budgets on geologic timescales. The leaf wax lipids are extracted from soils and sediments, which are complex mixtures containing, among many other components, weathered rock, minerals, and decayed plant materials that have accumulated over time.
“Looking at soil today, you’re observing the integrated history of all the plant matter that went into forming that soil over the course of hundreds to thousands of years,” says Hren.
In the past, various methods have been used to give a snapshot of environmental conditions at a point in time, such as analyzing stable isotopes in mammal bones and teeth, or looking at the chemistry of ice cores. However, all methods have limits to the information they can provide.
Eley and Hren investigated the relationship between leaf wax biomarker profiles and modern climate in a series of soils from North and Central America. A clear relationship began to emerge regarding leaf wax lipid distribution profiles and atmospheric moisture, suggesting that it is possible to use the distribution of leaf wax lipids to identify changes in moisture availability in the past.
This new approach represents a significant addition to the paleoclimate scientist’s toolkit, as atmospheric moisture is a parameter that has been challenging to estimate over long periods of Earth history, until now.
With today’s increasing CO2 levels, scientists know there is going to be climate change in the future, but it has not been clear how that may affect regional moisture patterns.
“One of the huge gaps in the past is we didn’t have great quantitative records of moisture,” says Hren. “We’re now managing to get a really nice glimpse of the whole ecosystem and how it’s responding.”
As the researchers focus on the biomarker profiles of soils, they are capturing an integrated chemical signature of a whole ecosystem preserved in ancient soils and sediments.
Hren says they found that the distribution of organic compounds preserved in soils of these ecosystems seems to be strongly related not just to relative humidity, but also to the difference between how much water is in an air mass and how much the air mass can hold, or what is known as the vapor pressure deficit.
Once the researchers established this relationship using modern data, they applied the method to sediments dating back to between 16.5 and 12.4 million years from a well studied area in Spain. They were able to reconcile their lipid-based reconstruction of vapor pressure deficit with existing stable isotope and fossil data for the area, highlighting the utility of this new tool.
Says Eley, “The hope is that we’ll be able to use this approach to tackle key questions about changing moisture availability over time.”
Past, present, and future
Hren and Eley are now applying this method to a range of other ancient terrestrial sediments, to investigate the relationship between changes in past climate and atmospheric moisture. They hope to use insights from these studies, which reconstruct temperature and moisture availability over many millions of years of Earth’s history, to advance understanding of the global changes in environmental conditions anticipated in the coming decades.
“By looking into the past, we’re trying to understand the potential for future change,” says Hren. “This is a powerful tool as we move forward.”
The ultimate hope is that data generated by this new leaf wax biomarker proxy will improve knowledge of past climate responses to CO2, and fill in the gaps – like missing pieces of a puzzle – in spatial reconstructions of paleoclimate during past warm periods of earth history. This in turn will feed into climate predictions of the long-term future of our planet.
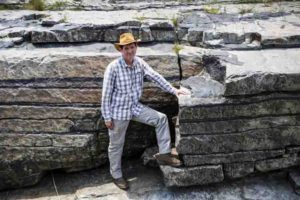
This is professor Rais Latypov in front of an example of the stratified chromite layers. Credit: Wits University
South Africa’s history and economy has been built on its rich natural treasures of a number of precious metals, stones and minerals.
The country’s mineral deposits have been created over hundreds of millions of years through processes that are still not completely understood.
One of these processes, that has troubled scientists and geologists for years, is the origin of chromitite layers hosted by layered intrusions — a major source of chromium on our planet. This process has been a mystery for decades, as scientists tried to work out how layers of pure chromite form from magmas that are coming from Earth’s mantle. These are supposed to be rich in a mineral called olivine — not chromite.
“It has been widely believed that magmas sourced from the mantle cannot directly crystallise chromite, as the mantle rocks that are being melted are rich in olivine, and therefore these melts should crystallise olivine, not chromite,” says Professor Rais Latypov from the School of Geosciences of the University of the Witwatersrand in South Africa, whose research team published a paper in Nature Communications in 2018.
“Together with a large group of my colleagues, I have been trying hard for several decades to find a mechanism that can explain the formation of these large chromite deposits in shallow crustal chambers but it turned out that we have been looking in the wrong place.”
To find the answer to these questions, Latypov and his team have been studying layers of chromite in South Africa’s Bushveld Complex, where over 80% of the global resources of platinum-bearing chromite deposits can be found.
They discovered that some basaltic magmas will form chromite after decompression as they rise up from the mantle through the crust towards the Earth’s surface. The reduction in pressure, as the magma rises up from the mantle to the crust, is key to the crystallisation process of the chromite.
“When these magmas arrive into a shallow magma chamber, sitting only a few kilometres below the surface of the Earth, they are already saturated in pure chromite, and, on cooling, can crystallise layers of platinum-bearing massive chromitite.
Chromium is an important industrial element that substantially improves the physical and chemical properties of steels, increasing their strength and making them corrosion-resistant. The platinum that is associated with these rocks is used in catalytic converters within cars to break down toxic exhaust gases into relatively benign species.
These zebra-striped coloured layers of platinum-bearing chromite that are formed through this process can be seen clearly in the ridges at the top of the Bushveld Complex, near Steelpoort in Mpumalanga, which became exposed through erosion over the many millions of years since they formed. Some of these layers can be several meters thick and extend for hundreds of kilometres.
“The Bushveld Complex covers an area of 100s of square kilometres. It stretches from Steelpoort in Mpumalanga in the East, past Pretoria to the Pilanesberg in the West; and from Bethal, Mpumalanga in the South to north of Polokwane in Limpopo. We believe that the Bushveld chamber must have been operating as a flow-through system into which magmas were entering and depositing their chromite, before flowing out of the chamber and erupting as basalts via volcanoes, which have now been eroded away,” says Latypov.
“It seems that the reduction of lithostatic pressure during the transfer of mantle-derived melts towards the surface plays a vital role in the formation of magmas that produce planetary resources, without which modern human society cannot develop in a sustainable manner.”
Further research is being conducted on whether other magmatic deposits around the world, such as vanadium-bearing magnetite in layered intrusions, can also be related to lithostatic pressure reduction.
Reference:
Rais Latypov, Gelu Costin, Sofya Chistyakova, Emma J. Hunt, Ria Mukherjee, Tony Naldrett. Platinum-bearing chromite layers are caused by pressure reduction during magma ascent. Nature Communications, 2018; 9 (1) DOI: 10.1038/s41467-017-02773-w
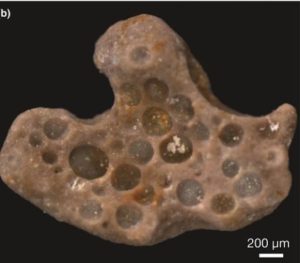
Figure 2. Transmitted-light, cross-polarized-light, and scanning electron microscopy (SEM) image of starch-bearing Lagenicula-type megaspore from the Baode section, north China. AL Details of the starch grain in D (rectangle) in transmitted light. Note the hilum (small depression) in center, and Y-shaped fissures. B: Another detail of the same grain under cross-polarized light. Note the Maltese-cross extinction in the center. C: Detail of compound starch grains under cross-polarized light. D: SEM image showing a complete starch-bearing Lagenicula-type megaspore. E: Detail of D, showing starch grains on the gula surface. Black arrow indicates the hilum appearing as a small depression. Credit: Liu et al. and Geology
Everyone loves a nice plate of pasta. After all, starch is the ultimate energy food. Now, we have proof that carbo-loading has been a thing for at least 280 million years.
A team of Chinese and German scientists has discovered the oldest unequivocal fossilized starch ever found, in the form of granular caps on the megaspores of a Permian-age plant called a lycopsid. They also found evidence that these high energy treats may have been the power bars of early spore spreading.
“We suggest that these starch caps were used to attract and reward animals for megaspore dispersal,” explains lead author Feng Liu, of the Nanjing Institute of Geology and Palaeontology, in Nanjing, China. The study, published online ahead of print for the journal Geology, also provides early evidence for mutualism between plants and animals.
Lycopsids were vascular plants, ancestors of modern club mosses. They thrived in the teeming swamp forests of the Permian, about 280 million years ago. The fossil megaspores of lycopsids, with remarkably well-preserved starch granule toppings, were found in Permian-age coal in northern China.
Plant seeds store starch internally to nourish seedlings. But after analyzing the starch masses in the fossil megaspores using scanning electron microscopy and transmission electron microscopy, and comparing them to modern seeds, the scientists concluded that the starch caps were only outside, not inside, the megaspore. That means the starch wasn’t part of the lycopsids’ embryo nutrient system. Instead, the granules likely existed specifically as a spore-spreading device.
Ants, birds, and mammals weren’t around 280 million years ago, so the authors speculate that snails, along with arthropods like millipedes and cockroaches, may have been the main consumers of the scrumptious starch snacks. In turn, they dispersed the lycopsid megaspores. While starch certainly existed long before the Permian, this discovery dishes up new insights into its ecological role, says Feng Liu. “It can help us better understand the terrestrial animal food habit and the complexity of biotic interactions in deep geological time.” Plus, it shows that starchy food was a creature comfort long before the days of fettucine.
Reference:
Feng Liu, Benjamin Bomfleur, Huiping Peng, Quan Li, Hans Kerp, Huaicheng Zhu. 280-m.y.-old fossil starch reveals early plant–animal mutualism. Geology, 2018; DOI: 10.1130/G39929.1
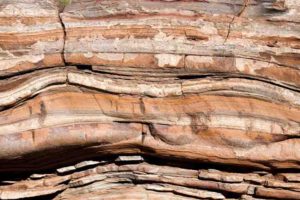
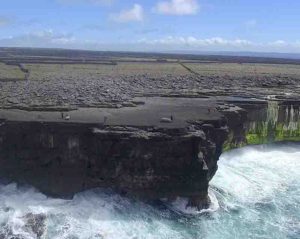
An example of coastal boulder deposits on Inishmaan, Aran Islands. The cliffs are about 20 m high, and the boulders are piled 32-42 m inland from the cliff edge. Note the people near the cliff edge, showing the scale. Some of the boulders in this ridge, weighing many tonnes, were moved by storm waves in the winter of 2013-2014. Credit: Peter Cox
It’s not just tsunamis that can change the landscape: storms shifted giant boulders four times the size of a house on the coast of Ireland in the winter of 2013-14, leading researchers to rethink the maximum energy storm waves can have — and the damage they can do.
In a new paper in Earth Science Reviews, researchers from Williams College in the US show that four years ago, storms moved huge boulders along the west coast of Ireland. The same storms shifted smaller ones as high as 26 meters above high water and 222 meters inland. Many of the boulders moved were heavier than 100 tons, and the largest moved was 620 tons — the equivalent of six blue whales or four single-storey houses.
It was previously assumed that only tsunamis could move boulders of the size seen displaced in Ireland, but the new paper provides direct evidence that storm waves can do this kind of work. According to the UN, about 40 percent of the world’s population live in coastal areas (within 100 meters of the sea), so millions of people are at risk from storms. Understanding how those waves behave, and how powerful they can be, is key for preparation. It is therefore important to know the upper limits of storm wave energy, even in areas where these kinds of extreme wave energies are not expected.
“The effect of the storms of winter 2013-14 was dramatic,” said Dr. Rónadh Cox, Professor and Chair of Geosciences at Williams College and lead author of the study. “We had been studying these sites for a number of years, and realised that this was an opportunity to measure the coastal response to very large storm events.”
In the summer after the storms, Prof. Cox and a team of seven undergraduate students from Williams College surveyed 100 sites in western Ireland, documenting with photos the displacement of 1,153 boulders. They measured the dimensions and calculated the mass of each boulder. They knew where 374 of the boulders had come from, so for those they also documented the distance travelled. The largest boulder, at 237-239 m3 was an estimated 620 tons; the second biggest, at 180-185 m3, was about 475 tons. These giant rocks were close to sea level (although above the high tide mark). At higher elevations, and at greater distances inland, smaller boulders moved upwards and inland.
Analysis of this information showed that the waves had most power at lower elevations and closer to the shore. While this may not be surprising, the sheer energy of the waves and their ability to move such large boulders was — and this evidence proves that not only tsunami but also storm waves can move such large objects.
“These data will be useful to engineers and coastal scientists working in other locations,” said Prof. Cox. “Now that we know what storm waves are capable of, we have much more information for policy makers who are responsible for preparing coastal communities for the impact of high-energy storms.”
Reference:
Rónadh Cox, Kalle L. Jahn, Oona G. Watkins, Peter Cox. Extraordinary boulder transport by storm waves (west of Ireland, winter 2013–2014), and criteria for analysing coastal boulder deposits. Earth-Science Reviews, 2018; 177: 623 DOI: 10.1016/j.earscirev.2017.12.014
Note: The above post is reprinted from materials provided by Elsevier.
The application of extreme pressure dramatically affects the chemical properties of xenon, so that it stops acting aloof and interacts with iron and nickel. This illustration shows how the changes in the electromagnetic properties of xenon, iron, and nickel under these intense pressures allow for the formation of XeFe3 and XeNi3. Credit: Image is courtesy of the research team: Alexander Goncharov, Hanyu Liu, Elissaios Stavrou, Sergey Lobanov, Yansun Yao, Joseph Zaug, Eran Greenberg, and Vitali Prakapenka
The paradox of the missing xenon might sound like the title of the latest airport thriller, but it’s actually a problem that’s stumped geophysicists for decades. New work from an international team including Carnegie’s Alexander Goncharov and Hanyu Liu, and Carnegie alumni Elissaios Stavrou and Sergey Lobanov, is chasing down the solution to this longstanding puzzle.
The mystery stems from meteorites, which retain a record of our Solar System’s earliest days. One type, called carbonaceous chondrites, contain some of the most-primitive known samples of Solar System material, including a lot more xenon than is found in our own planet’s atmosphere.
“Xenon is one of a family of seven elements called the noble gases, some of which, such as helium and neon, are household names,” said lead author Stavrou, now at Lawrence Livermore National Laboratory, about the team’s paper in Physical Review Letters. “Their name comes from a kind of chemical aloofness; they normally do not combine, or react, with other elements.”
Because xenon doesn’t play well with others, it’s deficiency in Earth’s atmosphere — even in comparison to other, lighter noble gases, like krypton and argon, which theoretical predictions tell us should be even more depleted than xenon — is difficult to explain.
That doesn’t mean many haven’t tried.
This research team — which also included Yansun Yao of the University of Saskatchewan, Joseph Zaug also of LLNL, and Eran Greenberg, and Vitali Prakapenka of the University of Chicago — focused their attention on the idea that the missing xenon might be found deep inside the Earth, specifically hidden in compounds with nickel and, especially, iron, which forms most of the planet’s core.
It’s been known for a while that although xenon doesn’t form compounds under ambient conditions, under the extreme temperatures and pressures of planetary interiors it isn’t quite so aloof.
“When xenon is squashed by extreme pressures, its chemical properties are altered, allowing it to form compounds with other elements,” Lobanov explained.
Using a laser-heated diamond anvil cell, the researchers mimicked the conditions found in the Earth’s core and employed advanced spectroscopic tools to observe how xenon interacted with both nickel and iron.
They found that xenon and nickel formed XeNi3 under nearly 1.5 million times normal atmospheric pressure (150 gigapascals) and at temperatures of above about 1,200 degrees Celsius (1,500 kelvin). Furthermore, at nearly 2 million times normal atmospheric pressure (200 gigapascals) and at temperatures above about degrees 1,700 degrees Celsius (2000 kelvin), they synthesized complex XeFe3 compounds.
“Our study provides the first experimental evidence of previously theorized compounds of iron and xenon existing under the conditions found in the Earth’s core,” Goncharov said. “However, it is unlikely that such compounds could have been made early in Earth’s history, while the core was still forming, and the pressures of the planet’s interior were not as great as they are now.”
The researchers are investigating whether a two-stage formation process could have trapped xenon in Earth’s early mantle and then later incorporated it into XeFe3 when the core separated and the pressure increased. But more work remains to be done.
Reference:
Elissaios Stavrou, Yansun Yao, Alexander F. Goncharov, Sergey S. Lobanov, Joseph M. Zaug, Hanyu Liu, Eran Greenberg, Vitali B. Prakapenka. Synthesis of Xenon and Iron-Nickel Intermetallic Compounds at Earth’s Core Thermodynamic Conditions. Physical Review Letters, 2018; 120 (9) DOI: 10.1103/PhysRevLett.120.096001
Illustration of Euoplocephalus, an ankylosaur. Ankylosaurids are sometimes called the ‘tanks of the Cretaceous’ given their squat bodies and armored hides. Credit: Brett Booth Brett Booth
A scientist with the Canadian Museum of Nature has answered a long-standing mystery about why fossils of ankylosaurs—the “armoured tanks” of the dinosaur world—are mainly found belly-side up. In doing so, he has ruled out three other competing theories involving clumsiness, predation, and the effects of bloating as seen in armadillo roadkills.
Palaeontologist Dr. Jordan Mallon says the evidence points to a phenomenon called “bloat-and-float”, whereby the bloating carcasses of ankylosaurs would end up in a river, flip belly-side up due to the weight of their heavy armour, and then float downstream. The remains would wash ashore, where decomposition and then fossilization would seal the dinosaur remains in their upside-down death pose.
“Textbooks have touted that ankylosaur fossils are usually found upside down, but no one has gone back and checked the records to make sure that’s the case,” explains Mallon. The observations date from the 1930s. Indeed, the fossils of two star ankylosaurs described in 2017, Borealopelta from Alberta and Zuul from Montana, were found upside down.
Mallon examined 32 ankylosaur fossils from Alberta (of which 26 were found belly up), photos of specimens, field notes, and other signs such as erosion of the exposed surface, sun bleaching, and the presence of lichens.
The results are published in the online journal Palaeogeography, Palaeoclimatology, Palaeoecology. Collaborators included armadillo experts Drs. Colleen McDonough and Jim Loughry of Valdosta State University in Georgia, and Dr. Don Henderson, with Drumheller Alberta’s Royal Tyrrell Museum of Palaeontology.
Mallon ruled out three other theories before settling on “bloat-and-float” to explain the preponderance of the belly-up remains.
“One idea was that ankylosaurs were simply clumsy, tripping over themselves or rolling down hills and ending up dying that way,” he says. But since ankylosaurs existed for about 100 million years, clumsy habits would not fit with their apparent evolutionary success.
Another theory was that ankylosaurs were prey for carnivores, such as hungry tyrannosaurids, which would flip the armoured dinosaurs onto their backs to get at the soft underbelly. “If this was true, we would expect to see signs of bite marks, especially on upside-down ones, but we saw marks on only one specimen,” explains Mallon. “Since they were armoured, it makes sense that ankylosaurs were not regularly preyed upon, and the fossil evidence in museum collections supports this.”
The third idea, proposed in the 1980s, is an analogy to what happens with some armadillo roadkills—as the carcass rots and bloats, gas accumulates, and the limbs would splay out, eventually rolling the animal onto its back.
The challenge was to test this hypothesis. Enter McDonough and Loughry who are experts on modern armadillos, which also have an armoured shell. Over the summer of 2016, they studied 174 examples of dead armadillo. “Sure enough, the data show that they do not occur more often on their backs,” says Mallon. The pair even examined dead armadillos placed in plexiglass cases in their backyard to keep away scavengers. Regardless of the positioning of the carcasses, bloating did not cause them to roll over onto their backs.
That left the “bloat-and-float” hypothesis as the most likely explanation for the presence of upside-down fossils. To study this, Mallon turned to computer simulations developed by Dr. Don Henderson, who specializes in the floating behaviour of animals in water.
Ankylosaur fossils in North America are found in river channel deposits, and in the Late Cretaceous Period these animals would have been living along a coastline of what is known as the Western Interior Seaway.
“We designed these models of ankylosaurs, both clubless and clubbed, and looked at their floating behavior,” explains Mallon. The computer modelling showed that the animals would tend to flip upside down quite easily in water. Nodosaurids, which are ankylosaurs with no tail clubs, would flip most easily at the slightest tilt; the ankyosaurids (with clubbed tails), were more stable but could still be flipped.
“So ‘bloat-and-float'” fits with their known environment, and this research helps inform about the transport behavior of dead dinosaurs, which is important to know when studying fossil ecosystems. Ultimately, this is a classic case study of the scientific method: examining alternative hypotheses, finding ways to test them, and ruling them out one-by-one. What you are left with at the end is the most likely explanation.”
Reference:
Jordan C. Mallon et al, A “bloat-and-float” taphonomic model best explains the upside-down preservation of ankylosaurs, Palaeogeography, Palaeoclimatology, Palaeoecology (2018). DOI: 10.1016/j.palaeo.2018.02.010
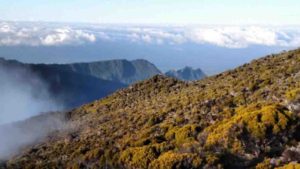
A fieldwork photo from Réunion Island shows the flank of the Cirque de Cilaos, looking out towards the Indian Ocean. Credit: Courtesy of Bradley Peters
Plumes of hot magma from the volcanic hotspot that formed Réunion Island in the Indian Ocean rise from an unusually primitive source deep beneath Earth’s surface, according to new work in Nature from Carnegie’s Bradley Peters, Richard Carlson, and Mary Horan along with James Day of the Scripps Institution of Oceanography.
Réunion marks the present-day location of the hotspot that 66 million years ago erupted the Deccan Traps flood basalts, which cover most of India and may have contributed to the extinction of the dinosaurs. Flood basalts and other hotspot lavas are thought to originate from different portions of Earth’s deep interior than most volcanoes at Earth’s surface and studying this material may help scientists understand our home planet’s evolution.
The heat from Earth’s formation process caused extensive melting of the planet, leading Earth to separate into two layers when the denser iron metal sank inward toward the center, creating the core and leaving the silicate-rich mantle floating above.
Over the subsequent 4.5 billion years of Earth’s evolution, deep portions of the mantle would rise upwards, melt, and then separate once again by density, creating Earth’s crust and changing the chemical composition of Earth’s interior in the process. As crust sinks back into Earth’s interior — a phenomenon that’s occurring today along the boundary of the Pacific Ocean — the slow motion of Earth’s mantle works to stir these materials, along with their distinct chemistry, back into the deep Earth.
But not all of the mantle is as well-blended as this process would indicate. Some older patches still exist — like powdery pockets in a poorly mixed bowl of cake batter. Analysis of the chemical compositions of Réunion Island volcanic rocks indicate that their source material is different from other, better-mixed parts of the modern mantle.
Using new isotope data, the research team revealed that Réunion lavas originate from regions of the mantle that were isolated from the broader, well-blended mantle. These isolated pockets were formed within the first ten percent of Earth’s history.
Isotopes are elements that have the same number of protons, but a different number of neutrons. Sometimes, the number of neutrons present in the nucleus make an isotope unstable; to gain stability, the isotope will release energetic particles in the process of radioactive decay. This process alters its number of protons and neutrons and transforms it into a different element. This new study harnesses this process to provide a fingerprint for the age and history of distinct mantle pockets.
Samarium-146 is one such unstable, or radioactive, isotope with a half-life of only 103 million years. It decays to the isotope neodymium-142. Although samarium-146 was present when Earth formed, it became extinct very early in Earth’s infancy, meaning neodymium-142 provides a good record of Earth’s earliest history, but no record of Earth from the period after all the samarium-146 transformed into neodymium-142. Differences in the abundances of neodymium-142 in comparison to other isotopes of neodymium could only have been generated by changes in the chemical composition of the mantle that occurred in the first 500 million years of Earth’s 4.5 billion-year history.
The ratio of neodymium-142 to neodymium-144 in Réunion volcanic rocks, together with the results of lab-based mimicry and modeling studies, indicate that despite billions of years of mantle mixing, Réunion plume magma likely originates from a preserved pocket of the mantle that experienced a compositional change caused by large-scale melting of Earth’s earliest mantle.
The team’s findings could also help explain the origin of dense regions right at the boundary of the core and mantle called large low shear velocity provinces (LLSVPs) and ultralow velocity zones (ULVZs), reflecting the unusually slow speed of seismic waves as they travel through these regions of the deep mantle. Such regions may be relics of early melting events.
“The mantle differentiation event preserved in these hotspot plumes can both teach us about early Earth geochemical processes and explain the mysterious seismic signatures created by these dense deep-mantle zones,” said lead author Peters.
Funding for fieldwork for this study was provided by the National Geographic Society (NGS 8330-07), the Geological Society of America (GSA 10539-14), and by a generous personal donation from Dr. R. Rex. Support for laboratory work was provided by Carnegie Institution for Science.
Reference:
Bradley J. Peters, Richard W. Carlson, James M. D. Day, Mary F. Horan. Hadean silicate differentiation preserved by anomalous 142Nd/144Nd ratios in the Réunion hotspot source. Nature, 2018; 555 (7694): 89 DOI: 10.1038/nature25754
Earth’s geomagnetic field surrounds and protects our planet from harmful space radiation. Credit: CC BY-SA 2.0 photo / Flickr user NASA Goddard Space Flight Center
Using new data gathered from sites in southern Africa, University of Rochester researchers have extended their record of Earth’s magnetic field back thousands of years to the first millennium.
The record provides historical context to help explain recent, ongoing changes in the magnetic field, most prominently in an area in the Southern Hemisphere known as the South Atlantic Anomaly.
“We’ve known for quite some time that the magnetic field has been changing, but we didn’t really know if this was unusual for this region on a longer timescale, or whether it was normal,” says Vincent Hare, who recently completed a postdoctoral associate appointment in the Department of Earth and Environmental Sciences (EES) at the University of Rochester, and is lead author of a paper published in Geophysical Research Letters.
The new data also provides more evidence that a region in southern Africa may play a unique role in magnetic pole reversals.
“We’re getting stronger evidence that there’s something unusual about the core-mantel boundary under Africa that could be having an important impact on the global magnetic field.”
The magnetic field that surrounds Earth not only dictates whether a compass needle points north or south, but also protects the planet from harmful radiation from space. Nearly 800,000 years ago, the poles were switched: north pointed south and vice versa. The poles have never completely reversed since, but for the past 160 years, the strength of the magnetic field has been decreasing at an alarming rate. The region where it is weakest, and continuing to weaken, is a large area stretching from Chile to Zimbabwe called the South Atlantic Anomaly.
In order to put these relatively recent changes into historical perspective, Rochester researchers — led by John Tarduno, a professor and chair of EES — gathered data from sites in southern Africa, which is within the South Atlantic Anomaly, to compile a record of Earth’s magnetic field strength over many centuries. Data previously collected by Tarduno and Rory Cottrell, an EES research scientist, together with theoretical models developed by Eric Blackman, a professor of physics and astronomy at Rochester, suggest the core region beneath southern Africa may be the birthplace of recent and future pole reversals.
“We were looking for recurrent behavior of anomalies because we think that’s what is happening today and causing the South Atlantic Anomaly,” Tarduno says. “We found evidence that these anomalies have happened in the past, and this helps us contextualize the current changes in the magnetic field.”
The researchers discovered that the magnetic field in the region fluctuated from 400-450 AD, from 700-750 AD, and again from 1225-1550 AD. This South Atlantic Anomaly, therefore, is the most recent display of a recurring phenomenon in Earth’s core beneath Africa that then affects the entire globe.
“We’re getting stronger evidence that there’s something unusual about the core-mantel boundary under Africa that could be having an important impact on the global magnetic field,” Tarduno says.
The researchers gathered data for this project from an unlikely source: ancient clay remnants from southern Africa dating back to the early and late Iron Ages. As part of a field called “archaeomagnetism,” geophysicists team up with archaeologists to study the past magnetic field.
The Rochester team, which included several undergraduate students, collaborated with archaeologist Thomas Huffman of the University of Witwatersrand in South Africa, a leading expert on Iron Age southern Africa. The group excavated clay samples from a site in the Limpopo River Valley, which borders Zimbabwe, South Africa, and Botswana.
During the Iron Age in southern Africa, around the time of the first millennium, there was a group of Bantu-speaking people who cultivated grain and lived in villages composed of grain bins, huts, and cattle enclosures. Draughts were devastating to their agriculturally based culture. During periods of draught, they would perform elaborate ritual cleansings of the villages by burning down the huts and grain bins.
“When you burn clay at very high temperatures, you actually stabilize the magnetic minerals, and when they cool from these very high temperatures, they lock in a record of the Earth’s magnetic field,” Tarduno says.
Researchers excavate the samples, orient them in the field, and bring them back to the lab to conduct measurements using magnetometers. In this way, they are able to use the samples to compile a record of Earth’s magnetic field in the past.
The magnetic field is generated by swirling, liquid iron in Earth’s outer core. It is here, roughly 1800 miles beneath the African continent, that a special feature exists. Seismological data has revealed a denser region deep beneath southern Africa called the African Large Low Shear Velocity Province. The region is located right above the boundary between the hot liquid outer core and the stiffer, cooler mantle. Sitting on top of the liquid outer core, it may sink slightly, disturbing the flow of iron and ultimately affecting Earth’s magnetic field.
A major change in the magnetic field would have wide-reaching ramifications; the magnetic field stimulates currents in anything with long wires, including the electrical grid. Changes in the magnetic field could therefore cause electrical grid failures, navigation system malfunctions, and satellite breakdowns. A weakening of the magnetic field might also mean more harmful radiation reaches Earth — and trigger an increase in the incidence of skin cancer.
Hare and Tarduno warn, however, that their data does not necessarily portend a complete pole reversal.
“We now know this unusual behavior has occurred at least a couple of times before the past 160 years, and is part of a bigger long-term pattern,” Hare says. “However, it’s simply too early to say for certain whether this behavior will lead to a full pole reversal.”
Even if a complete pole reversal is not in the near future, however, the weakening of the magnetic field strength is intriguing to scientists, Tarduno says. “The possibility of a continued decay in the strength of the magnetic field is a societal concern that merits continued study and monitoring.”
This study was funded by the US National Science Foundation.
Reference:
Vincent J. Hare, John A. Tarduno, Thomas Huffman, Michael Watkeys, Phenyo C. Thebe, Munyaradzi Manyanga, Richard K. Bono, Rory D. Cottrell. New Archeomagnetic Directional Records From Iron Age Southern Africa (ca. 425-1550 CE) and Implications for the South Atlantic Anomaly. Geophysical Research Letters, 2018; 45 (3): 1361 DOI: 10.1002/2017GL076007
A tiny extinct rail (30-40g) is overshadowed by a regular duck. Credit: Gavin Mouldey
Fossilized bones of two new species of tiny, flightless extinct birds have been discovered by Australasian scientists in 19 to 16-million-year-old sediments of an ancient lake on the South Island of New Zealand.
The two miniscule species—one barely larger than a sparrow—were members of the rail family, a group of birds common today in wetlands that includes swamphens, moorhens, coots and crakes. Their remains were unearthed near the town of St Bathans in Central Otago.
Many rail species can fly well and have dispersed to far-flung oceanic islands. However, flightlessness has evolved more times in this group of birds that in any other, especially on predator-free islands. The world’s largest rails evolved in New Zealand, notably the flightless takahe and weka.
The study, led by scientists from Flinders University with colleagues from UNSW, Canterbury Museum and the Museum of New Zealand, is published in the Journal of Systematic Palaeontology.
Team member UNSW Professor Mike Archer, says: “This new discovery emphasizes the fact that New Zealand has long been one of the world’s most extraordinary engines driving bird evolution.
“Charting how lineages like these rails have changed through time on an island that has been geographically isolated for more than 80 million years will test basic presumptions made about bird evolution in general,” says Professor Archer of the of the PANGEA Research Centre in the School of Biological, Earth and Environmental Sciences.
Nineteen to 16 million years ago, a 5600 square kilometre megalake dominated the landscape of New Zealand’s South Island. It was surrounded by a subtropical rainforest and plants typical of Australia and long lost from New Zealand, such as eucalypts, casuarinas, palms and cycads, were common there.
“Flightlessness in birds is often associated with an increase in size,” says Ellen Mather, study lead author and Ph.D. student at Flinders University. “The weka, which is in the same family as our fossil birds and lives in New Zealand today, is about the size of a chicken. The Banded Rail, their closest flying relative, is about half that size.”
The most common of the new fossil rails has been named Priscaweka parvales, meaning ancient weka with small wings. It was a mere one twentieth of the weight of a weka and was similar in size to the recently extinct Chatham rail Cabalus modestus.
Small flightless birds only exist in the absence of terrestrial mammalian predators, and New Zealand has long been recognised as the iconic example of a country with an avifauna which evolved in the absence of such predators.
When humans discovered New Zealand, the main islands had many flightless birds including giants within the nine species of moa, several kiwi, two huge geese, two adzebills, even some tiny wrens, and at least five flightless rails.
Team member, Dr. Paul Scofield, a Senior Curator at the Natural History at Canterbury Museum, says: “The new St Bathans’ rails join a host of other fossil birds recovered from these deposits that show New Zealand has long been a land of birds. The discovery of these two miniscule flightless rails raises the question of ‘Where did they come from?'”
The researchers suggest they had ancestors in Australia which flew across the 1500 km ocean to New Zealand in previous millennia. However, the new species are unlike any rail known elsewhere, so their exact origin or closest relatives remain a mystery.
Other than hints of large flightless moa ancestors, these rails are the first flightless birds to be described from this fauna. This is unexpected as the St Bathans Fauna contains small terrestrial mammals, which normally preclude evolution of small flightless species. The tiny flightless rails therefore strongly suggest that the mysterious mammals were not predators of small birds. Flightless birds have been a feature of the New Zealand avifauna for millions of years, much longer than previously thought. They are probably the oldest flightless rails known globally.
“The ongoing research into the fossil birds of New Zealand builds on that begun over 150 years ago. It continues to throw up revelations into the timing and origins of major groups of birds that characterize modern avifaunas” says Associate Professor Trevor Worthy of Flinders University.
Mount Etna. Credit: Angelo T. La Spina, Lizenz: CC BY-SA 4.0
Mount Etna in southern Italy is one of the most active volcanoes on Earth, while the Hyblean Volcanoes, located further south, are extinct today. An international team of scientists with the participation of the GFZ searched for the source of magmas of Etna and examined why the ground south of Etna does not emit lava anymore. The results have now been published in the scientific journal Earth & Planetary Science Letters.
Volcanic eruptions and earthquakes most frequently occur alongside of tectonic plate margins. Some volcanoes, however, also arise within a plate; researchers refer to this as “intraplate volcanism”. Well known examples are the chain of islands of Hawaii or the Canary Islands. The volcanoes in Eastern Sicily are of the same type. For about five hundred thousand years now, Etna, a mountain of 3300 meters height, is an active volcano. The Hyblean Volcanoes, however, that were active until about one million years ago, form a mountain range on the southernmost edge of Sicily.
Movements in the deep migrate volcanoes
The scientists modelled the pathways of magma below the Hyblean Volcanoes and Etna, down to the Earth’s crust-mantle boundary in about 30 kilometers depth. The model shows: Magma pathways, also referred to as dikes, both for Etna and the Hyblean Volcanoes all bend to the East and meet with the crust-mantle boundary below the Malta Escarpment. The Malta Escarpment is a system tectonically active now for hundreds of millions of years. It stretches alongside the eastern Sicilian coastline for more than three hundred kilometres, far into the Mediterranean Sea. Often, earthquakes originate in this region. Over the past ten million years, the Earth’s crust in this region was compressed and expanded in different directions again and again.
These movements together with a deepening of the fault scarp led to bent, not vertical, magmatic dikes. Over time, this also resulted in a northwestward migration of active volcanism. Eleonora Rivalta, GFZ section Physics of Earthquakes and Volcanoes, co-author of the study: „Our findings show that Etna and the Hyblean Volcanoes represent eruptions of different ages of the same volcanic system.“ In the future, similar models may be applied to other regions to show where origins of magmas are and how dikes develop over time. (ak)
Reference:
Neri, M., Rivalta, E., Maccaferri, F., Acocella, V., Cirrincione, R., 2018. Etnean and Hyblean volcanism shifted away from the Malta Escarpment by crustal stresses. Earth and Planetary Science Letters, Volume 486, 15-22 pp. DOI: 10.1016/j.epsl.2018.01.006