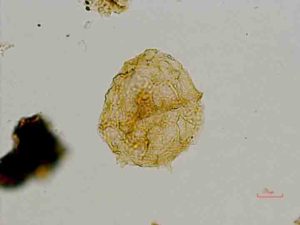
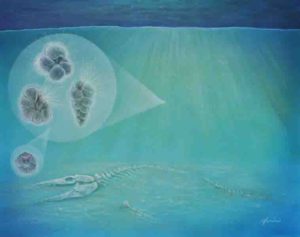
One of the dinoflagellate cysts, normally the cause of red tides in the sea, has been found in arid Australia. Credit: Carmine Wainman, University of Adelaide
Dinosaur-age fossilised remains of tiny organisms normally found in the sea have been discovered in inland, arid Australia — suggesting the area was, for a short time at least, inundated by sea water 40 million years before Australia’s large inland sea existed.
The fossils are the egg-like cysts of microorganisms known as dinoflagellates, best known for producing red tides or algal blooms that can turn the sea water blood red. The cysts rest on the sea floor before hatching new dinoflagellates.
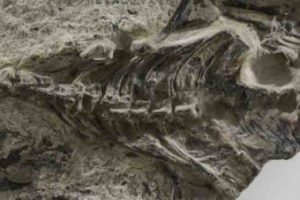
Researchers at the University of Adelaide, in collaboration with geological consultancy MGPalaeo, discovered these microfossils in Jurassic rocks of south-western Queensland, near the town of Roma.
Described in the journal Palynology, the fossils have been dated to the late Jurassic period, 148 million years ago. This is a time when Australia was joined to Antarctica, and where dinosaurs roamed across ancient rivers, floodplains and swamps.
“We have plenty of evidence from the 110 million-year-old vast inland Eromanga Sea, which covered a large swathe of central, eastern Australia during the Cretaceous period (following on from the Jurassic),” says Dr Carmine Wainman, Postdoctoral Fellow in the University of Adelaide’s Australian School of Petroleum.
“We’ve seen the opalised fossils sold in Adelaide’s Rundle Mall, and the spectacular ancient marine reptiles on display in the South Australian Museum — all from the later Cretaceous period.
“However, this new microfossil evidence from the same region suggests there was a short-lived precursor to this sea 40 million years earlier.”
Dr Wainman believes these microfossils must have been brought inland by an incursion of sea water and then evolved quickly to adapt to the freshwater or brackish conditions as the sea waters slowly receded.
“There is no other feasible explanation for how they managed to reach the interior of the Australian continent when the ancient coastline was thousands of kilometres away,” Dr Wainman says.
“It was probably a result of rising sea levels during a time of greenhouse conditions before the establishment of the Eromanga Sea. With further investigations, we may find more of these microorganisms or even fossilised marine reptiles that uncover untold secrets about how this part of the world looked in the Jurassic.”
Reference:
Carmine C. Wainman, Daniel J. Mantle, Carey Hannaford, Peter J. McCabe. Possible freshwater dinoflagellate cysts and colonial algae from the Upper Jurassic strata of the Surat Basin, Australia. Palynology, 2018; 1 DOI: 10.1080/01916122.2018.1451785
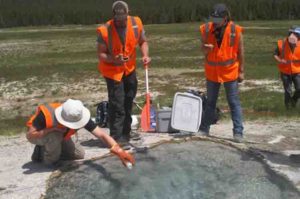
Washington State University researchers ‘spike’ a Yellowstone hot spring with deuterium, a stable isotope, to calculate water and heat flowing out of the springs and estimate how fast magma is recharging beneath the Yellowstone supervolcano. The material had no environmental impact and was done with a permit from the National Park Service. Credit: Washington State University
Researchers at Washington State University and the University of Idaho have found a new way to estimate how fast magma is recharging beneath the Yellowstone supervolcano. While their findings offer no help in predicting if the volcano will erupt, they can now get a better understanding of a key factor — a pool of basalt magma recharging the system — in how it works.
“It is the coal in the furnace that’s heating things up,” said Peter Larson, a professor in the Washington State University School of the Environment. “It’s heating up the boiler. The boiler is what explodes. This tells us what is heating the boiler.”
Some 640,000 years have passed since the volcano’s last major eruption. But it can be “super,” having produced one of the largest known blasts on Earth and spewing more than 2,000 times as much ash as Mount St. Helens did in 1980.
A major element in the volcano’s power is the explosive, silica-rich rhyolite that break’s through the Earth’s crust during an eruption. Larson and his colleagues focused on the plume of basalt magma heating the rhyolite from below.
“This gives us an idea of how much magma is recharging the volcano every year,” said Larson, whose findings appear in the latest issue of the journal Geosphere.
With funding from the National Science Foundation, the researchers “spiked” several hot springs in Yellowstone National Park with deuterium, a stable hydrogen isotope. The researchers used the length of time needed for deuterium concentrations to return to background levels and the temperature of the hot springs to calculate the amount of water and heat flowing out of the springs. Using deuterium for estimating heat flow is safe for the environment and has no visual impact to distract from the park visitors’ experience.
The team found that previous studies underestimated the amount of water coursing through the springs and the amount of heat leaving the springs. The data also allowed the team to estimate the amount of magma entering the supervolcano from the mantle.
The study also has implications for geothermal energy, helping inform how heat is transported to the earth’s surface from molten rock.
Reference:
Nicholas McMillan, Peter Larson, Jerry Fairley, Joseph Mulvaney-Norris, Cary Lindsey. Direct measurement of advective heat flux from several Yellowstone hot springs, Wyoming, USA. Geosphere, 2018; DOI: 10.1130/GES01598.1
Image of Earth taken by the Apollo 8 astronauts on Dec. 22, 1968 as they became the first humans to circumnavigate the moon. Credit: Courtesy of NASA
For anyone who has ever wished there were more hours in the day, geoscientists have some good news: Days on Earth are getting longer.
A new study that reconstructs the deep history of our planet’s relationship to the moon shows that 1.4 billion years ago, a day on Earth lasted just over 18 hours. This is at least in part because the moon was closer and changed the way Earth spun around its axis.
“As the moon moves away, the Earth is like a spinning figure skater who slows down as they stretch their arms out,” explains Stephen Meyers, professor of geoscience at the University of Wisconsin-Madison and co-author of the study published this week [June 4, 2018] in the Proceedings of the National Academy of Sciences.
It describes a tool, a statistical method, that links astronomical theory with geological observation (called astrochronology) to look back on Earth’s geologic past, reconstruct the history of the solar system and understand ancient climate change as captured in the rock record.
“One of our ambitions was to use astrochronology to tell time in the most distant past, to develop very ancient geological time scales,” Meyers says. “We want to be able to study rocks that are billions of years old in a way that is comparable to how we study modern geologic processes.”
Earth’s movement in space is influenced by the other astronomical bodies that exert force on it, like other planets and the moon. This helps determine variations in Earth’s rotation around and wobble on its axis, and in the orbit Earth traces around the sun.
These variations are collectively known as Milankovitch cycles and they determine where sunlight is distributed on Earth, which also means they determine Earth’s climate rhythms. Scientists like Meyers have observed this climate rhythm in the rock record, spanning hundreds of millions of years.
But going back further, on the scale of billions of years, has proved challenging because typical geologic means, like radioisotope dating, do not provide the precision needed to identify the cycles. It’s also complicated by lack of knowledge of the history of the moon, and by what is known as solar system chaos, a theory posed by Parisian astronomer Jacques Laskar in 1989.
The solar system has many moving parts, including the other planets orbiting the sun. Small, initial variations in these moving parts can propagate into big changes millions of years later; this is solar system chaos, and trying to account for it can be like trying to trace the butterfly effect in reverse.
Last year, Meyers and colleagues cracked the code on the chaotic solar system in a study of sediments from a 90 million-year-old rock formation that captured Earth’s climate cycles. Still, the further back in the rock record he and others have tried to go, the less reliable their conclusions.
For instance, the moon is currently moving away from Earth at a rate of 3.82 centimeters per year. Using this present day rate, scientists extrapolating back through time calculated that “beyond about 1.5 billion years ago, the moon would have been close enough that its gravitational interactions with the Earth would have ripped the moon apart,” Meyers explains. Yet, we know the moon is 4.5 billion years old.
So, Meyers sought a way to better account for just what our planetary neighbors were doing billions of years ago in order to understand the effect they had on Earth and its Milankovitch cycles. This was the problem he brought with him to a talk he gave at Columbia University’s Lamont-Doherty Earth Observatory while on sabbatical in 2016.
In the audience that day was Alberto Malinverno, Lamont Research Professor at Columbia. “I was sitting there when I said to myself, ‘I think I know how to do it! Let’s get together!'” says Malinverno, the other study co-author. “It was exciting because, in a way, you dream of this all the time; I was a solution looking for a problem.”
The two teamed up to combine a statistical method that Meyers developed in 2015 to deal with uncertainty across time — called TimeOpt — with astronomical theory, geologic data and a sophisticated statistical approach called Bayesian inversion that allows the researchers to get a better handle on the uncertainty of a study system.
They then tested the approach, which they call TimeOptMCMC, on two stratigraphic rock layers: the 1.4 billion-year-old Xiamaling Formation from Northern China and a 55 million-year-old record from Walvis Ridge, in the southern Atlantic Ocean.
With the approach, they could reliably assess from layers of rock in the geologic record variations in the direction of the axis of rotation of Earth and the shape of its orbit both in more recent time and in deep time, while also addressing uncertainty. They were also able to determine the length of day and the distance between Earth and the moon.
“In the future, we want to expand the work into different intervals of geologic time,” says Malinverno.
The study complements two other recent studies that rely on the rock record and Milankovitch cycles to better understand Earth’s history and behavior.
A research team at Lamont-Doherty used a rock formation in Arizona to confirm the remarkable regularity of Earth’s orbital fluctuations from nearly circular to more elliptical on a 405,000 year cycle. And another team in New Zealand, in collaboration with Meyers, looked at how changes in Earth’s orbit and rotation on its axis have affected cycles of evolution and extinction of marine organisms called graptoloids, going back 450 million years.
“The geologic record is an astronomical observatory for the early solar system,” says Meyers. “We are looking at its pulsing rhythm, preserved in the rock and the history of life.”
The study was funded by the National Science Foundation (EAR-1151438).
Reference:
Stephen R. Meyers, Alberto Malinverno. Proterozoic Milankovitch cycles and the history of the solar system. Proceedings of the National Academy of Sciences, 2018; 201717689 DOI: 10.1073/pnas.1717689115
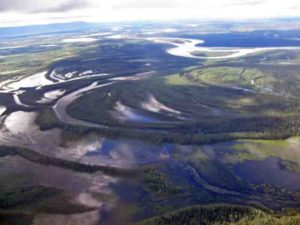
Lakes in the roadless Minto Flats surround the Tanana River in this photo from July 2014. The ridge on the horizon leads down to the town of Nenana, Alaska. Seismic stations placed in this unique region detected some intriguing pre-earthquake activity. Credit: UAF Photo by Carl Tape
Earth scientists consistently look for a reliable way to forecast earthquakes. New research from University of Alaska Fairbanks Geophysical Institute professor Carl Tape may help in that endeavor, due to a unique set of circumstances.
“Our observations have recorded an unequivocally interesting sequence of events,” Tape said.
Tape and his colleagues found evidence for accelerating activity before a 2016 earthquake in a laterally moving fault zone in central Alaska. The activity included a phenomenon known as very low-frequency earthquakes, referring to the type of energy waves associated with it.
Typical earthquakes have two associated energy waves, called the P and S waves. Very low-frequency earthquakes do not have such signals. Instead, their waves occur on much lower frequencies.
“Most earthquakes start abruptly, but not always,” said Luciana Astiz, a program director in the National Science Foundation’s Division of Earth Sciences, which supported the research. “A fault zone in central Alaska monitored by new scientific instruments offers a look at a more complex process. This study reports the first observations of a slow process that transitions into an earthquake — something previously observed only in laboratory experiments. These new observations contribute toward understanding the physics of earthquakes.”
In 2015, Tape installed 13 seismic stations in the Minto Flats of central Alaska to capture the area’s fault activity. Nine days later, the instruments recorded a long-duration, very low-frequency process, normally only seen in deep subduction zones. This event showed a small amount of activity gathering, or nucleating, in a central area below the surface. It did not lead to an earthquake.
A second, similar event in 2016 led to a key observation. At Minto Flats, a magnitude 3.7 quake occurred at a depth of about 10.5 miles, not an unusual event in itself. However, the event was preceded by a 12-hour accelerating sequence of earthquakes and 22 seconds of distinct high- and low-frequency waves in a concentrated area.
Tape said that this kind of slow event transitioning into a rupture had previously only been seen in laboratory experiments.
“The rupture process started, then it found a patch of the fault that was ready to go, and that’s what people have not seen. It’s really exciting,” Tape said.
“The leap we make, and maybe the more controversial thing, is that this emergent long-period signal only seen on top of the fault is a low-frequency signal that can sometimes turn into an earthquake and sometimes not,” Tape said.
Tape and his colleagues may have seen this kind of activity before. In 2012, there was a similar small event recorded in central Alaska. At that time, a magnitude 8.6 earthquake took place under the Indian Ocean and its energy was felt around the world. Because of the magnitude of this event, the smaller activity from central Alaska was overshadowed. Whatever signal the Minto Flats site gave off could not be confirmed. However, it was intriguing enough to help justify putting sensors in the area.
“Never in my wildest dreams did I expect we’d see something like that again,” Tape said. “I assumed that the conditions that happened in 2012 were somehow unique and that huge surface waves led to this nucleation. Even though I proposed putting instruments on the area in a proposal, it was the last item I put on. I thought, “Maybe we’ll see something crazy out there.'”
By 2016, Tape had high-quality stations on top of the Minto Flat faults, around 18 miles from the main events, and no triggering earthquake to complicate the data.
“We are staring right at this process, and what it showed was that exactly during the tremor-like signal there is this emergent long-duration signal that hints at what’s driving this nucleation phase,” he said.
Geologists have been looking for something like this for a long time. So why hasn’t anyone seen it?
“I’m left saying ‘I don’t know,'” Tape said. “I’m going to assume everyone has been looking for something before the P wave forever. It leads me to believe there is something special about this fault zone.”
Minto Flats has a deep sedimentary basin, strike-slip faulting, active tectonics and deep earthquakes; it is an unusual site.
“In some ways, I wish there wasn’t anything special. I wish it was a global phenomenon that we discovered, but it’s not,” Tape said. “It appears there is something special about the conditions in Minto Flats.”
The results of the research will appear in the latest issue of the journal Nature Geoscience. The paper is titled “Earthquake Nucleation and Fault Slip Complexity in the Lower Crust of Central Alaska.”
The project was primarily funded by a National Science Foundation CAREER project that supported Tape and his student co-authors, Vipul Silwal and Kyle Smith.
Reference:
Carl Tape, Stephen Holtkamp, Vipul Silwal, Jessica Hawthorne, Yoshihiro Kaneko, Jean Paul Ampuero, Chen Ji, Natalia Ruppert, Kyle Smith, Michael E. West. Earthquake nucleation and fault slip complexity in the lower crust of central Alaska. Nature Geoscience, 2018; DOI: 10.1038/s41561-018-0144-2
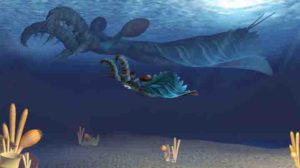
This is an artistic representation of juvenile (foreground) and adult (background) Lyrarapax unguispinus hunting in the water column. Relative sizes are based on the smallest (length: 1.8 cm) and largest (length: 8 cm) known specimens of L. unguispinus. Credit: Science China Press
Some of the earliest predators that patrolled the oceans over 500 million years ago are also some of the largest animals to have lived at the time. However, a new fossil study led by Jianni Liu from the Northwest University of Xi’an in China, has shown that their tiny babies were also proficient killers.
The “creepy crawly” animal group known as the Arthropoda, which includes spiders, insects and crustaceans, has often been the inspiration behind many science fiction monsters, largely due to their scary-looking appendages. Some of the oldest and most primitive arthropod species belong to a group called the Radiodonta (“radiating teeth”), which were armed with large, spiny raptorial (or grasping) appendages at the front of the head and a circular mouth adorned with tooth-like serrations. These animals, including the famous Anomalocaris, are considered the giant apex predators of their time, reaching lengths of over one metre.
Until now, virtually nothing was known about the juveniles of radiodontans and their feeding habits. The discovery of an exceptionally-preserved juvenile of a species called Lyrarapax unguispinus from the early Cambrian (518 million-year-old) Chengjiang biota of China has shed new light on this iconic group of fossil arthropods.
At only 18mm in total body length, this almost complete specimen represents the smallest radiodontan ever found. To the surprise of the research team, its anatomy is extraordinarily well developed–especially the spiny grasping appendages–giving it the appearance of a miniaturised adult. This indicates that Lyrarapax unguispinus was a well-equipped predator at an early developmental stage, similar to modern arthropods such as praying mantises, mantis shrimps, and arachnids. This discovery confirms that raptorial feeding habits in juveniles appeared early on in the evolutionary history of arthropods.
This fossil find also has important implications for the rapid evolution of the first animals over half-a-billion years ago – an event referred to colloquially as the Cambrian ‘Explosion’. It is hypothesised that predation was a major driver of this evolutionary event, with predators placing selective pressures on animal communities, forcing prey species to adapt and evolve or face extinction.The predatory lifestyles of juvenile radiodontans adds further complexity to Cambrian marine food webs by placing additional pressures on small prey during this evolutionary ‘arms race’.
Reference:
Liu, J. N., Lerosey-Aubril, R., Steiner, M., Dunlop, J. A., Shu, D. G. & Paterson, J. R. 2018.Origin of raptorial feeding in juvenile euarthropods revealed by a Cambrian radiodontan. National Science Review. DOI: 10.1093/nsr/nwy057
Note: The above post is reprinted from materials provided by Science China Press.
The restudy of Megachirella wachtleri fossil allowed the authors to re-write the history of all fossil and living lizards and snakes. Credit: MUSE – Science Museum, Trento, Italy
An international team of paleontologists, which includes the University of Bristol, have identified the world’s oldest lizard, providing key insight into the evolution of modern lizards and snakes.
The 240-million-year-old fossil, Megachirella wachtleri, is the most ancient ancestor of all modern lizards and snakes, known as squamates, the new study, published today in the journal Nature, shows.
The fossil, along with data from both living and extinct reptiles — which involved anatomical data drawn from CT scans and DNA — suggests the origin of squamates is even older, taking place in the late Permian period, more than 250 million years ago.
Tiago Simões, lead author and PhD student from the University of Alberta in Canada, said: “The specimen is 75 million years older than what we thought were the oldest fossil lizards in the entire world and provides valuable information for understanding the evolution of both living and extinct squamates.”
Currently, there are 10,000 species of lizards and snakes around the world — twice as many different species as mammals. Despite this modern diversity, scientists did not know much about the early stages of their evolution.
Tiago Simões added: “It is extraordinary when you realize you are answering long-standing questions about the origin of one of the largest groups of vertebrates on Earth.”
Co-author, Dr Michael Caldwell, also from the University of Alberta, added: “Fossils are our only accurate window into the ancient past. Our new understanding of Megachirella is but a point in ancient time, but it tells us things about the evolution of lizards that we simply cannot learn from any of the 9000 or so species of lizards and snakes alive today.”
Originally found in the early 2000s in the Dolomites Mountains of Northern Italy, researchers considered it an enigmatic lizard-like reptile but could not reach conclusive placement, and it ramained nearly unnoticed by the international community.
In order to better understand both the anatomy of Megachirella and the earliest evolution of lizards and snakes the authors assembled the largest reptile dataset ever created.
The authors combined it with several new anatomical information from Megachirella obtained from high-resolution CT scans.
All this new information was analysed using state of the art methods to assess relationships across species, revealing that the once enigmatic reptile was actually the oldest known squamate.
Co-author Dr Randall Nydam of the Midwestern University in Arizona, said: “At first I did not think Megachirella was a true lizard, but the empirical evidence uncovered in this study is substantial and can lead to no other conclusion.”
Co-author Dr Massimo Bernardi from MUSE — Science Museum, Italy and University of Bristol’s School of Earth Sciences, added: “This is the story of the re-discovery of a specimen and highlights the importance of preserving naturalistic specimens in well maintained, publicly accessible collections.
“New observations, that could arise from the use of new techniques — as for the mCT data we have obtained here, could provide a completely new understanding even of long-known specimens.”
Reference:
Tiago R. Simões, Michael W. Caldwell, Mateusz Tałanda, Massimo Bernardi, Alessandro Palci, Oksana Vernygora, Federico Bernardini, Lucia Mancini, Randall L. Nydam. The origin of squamates revealed by a Middle Triassic lizard from the Italian Alps. Nature, 2018; 557 (7707): 706 DOI: 10.1038/s41586-018-0093-3
An asteroid impact 66 million years ago wiped out life across the planet, but microorganisms quickly rebounded. New research has found evidence for a diverse array of plankton and other organisms inhabiting the crater only a few years after the extinction-causing impact. The three hair-covered forms (left) represent species of plankton found inside the crater. The geometric form (bottom left) is a species of algae. Small organisms like these moved into the crater so quickly that bones from animals that were killed by the impact, such as the mosasaur pictured here, may have still been visible. Credit: Original art by John Maisano, University of Texas Jackson School of Geosciences.
About 66 million years ago, an asteroid smashed into Earth, triggering a mass extinction that ended the reign of the dinosaurs and snuffed out 75 percent of life.
Although the asteroid killed off species, new research led by The University of Texas at Austin has found that the crater it left behind was home to sea life less than a decade after impact, and it contained a thriving ecosystem within 30,000 years — a much quicker recovery than other sites around the globe.
Scientists were surprised by the findings, which undermine a theory that recovery at sites closest to the crater is the slowest due to environmental contaminants — such as toxic metals — released by the impact. Instead, the evidence suggests that recovery around the world was influenced primarily by local factors, a finding that could have implications for environments rocked by climate change today.
“We found life in the crater within a few years of impact, which is really fast, surprisingly fast,” said Chris Lowery, a postdoctoral researcher at the University of Texas Institute for Geophysics (UTIG) who led the research. “It shows that there’s not a lot of predictability of recovery in general.”
The research was published May 30 in the journal Nature. UTIG research scientists Gail Christeson and Sean Gulick and postdoctoral researcher Cornelia Rasmussen are co-authors on the paper, along with a team of international scientists. UTIG is a research unit of the Jackson School of Geosciences.
The evidence for life comes primarily in the form of microfossils — the remains of unicellular organisms such as algae and plankton — as well as the burrows of larger organisms discovered in a rock extracted from the crater during recent scientific drilling conducted jointly by the International Ocean Discovery Program and International Continental Drilling Program.
The tiny fossils are hard evidence that organisms inhabited the crater, but also a general indicator about habitability in the environment years after impact. The swift recovery suggests that other life forms aside from the microscopic were living in the crater shortly after impact.
“Microfossils let you get at this complete community picture of what’s going on,” Lowery said. “You get a chunk of rock and there’s thousands of microfossils there, so we can look at changes in the population with a really high degree of confidence … and we can use that as kind of a proxy for the larger scale organisms.”
The scientists found the first evidence for the appearance of life two to three years after impact. The evidence included burrows made by small shrimp or worms. By 30,000 years after impact, a thriving ecosystem was present in the crater, with blooming phytoplankton (microscopic plants) supporting a diverse community of organisms in the surface waters and on the seafloor. In contrast, other areas around the world, including the North Atlantic and other areas of the Gulf of Mexico, took up to 300,000 years to recover in a similar manner.
The core containing the fossil evidence was extracted from the crater during a 2016 expedition co-led by the Jackson School. In this study, scientists zeroed in on a unique core section that captures the post-impact seafloor in unprecedented detail. Whereas core samples from other parts of the ocean hold only millimeters of material deposited in the moments after impact, the section from the crater used in this study contains more than 130 meters of such material, the upper 30 inches of which settled out slowly from the turbid water. This material provides a record that captures the seafloor environment days to years after the impact.
“You can see layering in this core, while in others, they’re generally mixed, meaning that the record of fossils and materials is all churned up, and you can’t resolve tiny time intervals,” said co-author Timothy Bralower, a micropaleontology professor at Pennsylvania State University. “We have a fossil record here where we’re able to resolve daily, weekly, monthly, yearly changes.”
Ellen Thomas, a senior research scientist in geology and geophysics at Yale University who was not part of the study, said that although she thinks the paper makes a strong case for a speedy recovery, she expects that the larger scientific community will be interested in digging into the data for themselves.
“In my opinion, we will see considerable debate on the character, age, sedimentation rate and microfossil content … especially of the speculation that burrowing animals may have returned within years of the impact,” Thomas said.
The relatively rapid rebound of life in the crater suggests that although the asteroid caused the extinction, it didn’t hamper recovery. The scientists point to local factors, from water circulation to interactions between organisms and the availability of ecological niches, as having the most influence on a particular ecosystem’s recovery rate.
The findings indicate that recovery after a global catastrophe could be a local affair.
The International Ocean Discovery Program, the International Continental Drilling Program, the National Science Foundation and NASA funded the research.
Reference:
Christopher M. Lowery, Timothy J. Bralower, Jeremy D. Owens, Francisco J. Rodríguez-Tovar, Heather Jones, Jan Smit, Michael T. Whalen, Phillipe Claeys, Kenneth Farley, Sean P. S. Gulick, Joanna V. Morgan, Sophie Green, Elise Chenot, Gail L. Christeson, Charles S. Cockell, Marco J. L. Coolen, Ludovic Ferrière, Catalina Gebhardt, Kazuhisa Goto, David A. Kring, Johanna Lofi, Rubén Ocampo-Torres, Ligia Perez-Cruz, Annemarie E. Pickersgill, Michael H. Poelchau, Auriol S. P. Rae, Cornelia Rasmussen, Mario Rebolledo-Vieyra, Ulrich Riller, Honami Sato, Sonia M. Tikoo, Naotaka Tomioka, Jaime Urrutia-Fucugauchi, Johan Vellekoop, Axel Wittmann, Long Xiao, Kosei E. Yamaguchi, William Zylberman. Rapid recovery of life at ground zero of the end-Cretaceous mass extinction. Nature, 2018; DOI: 10.1038/s41586-018-0163-6
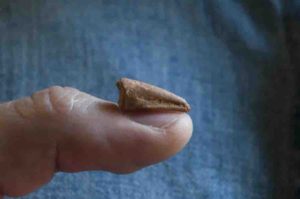
Comfortably leaning on a thumb’s nail, the new Spinosaurus fossil is only 21 mm long. The flat palmar side and the feebly curved profile of this ungual bone are highly diagnostic and show the same adaptation seen in the foot of adult specimens. Credit: G. Bindellini CC BY 4.0
Spinosaurus is the longest, and among the largest predatory dinosaurs, and possesses many adaptations for a semiaquatic lifestyle. A tiny claw phalanx of the foot, discovered in Cretaceous-aged sandstones of the Sahara, shows a peculiar shape compatible with an early juvenile Spinosaurus. As reported in PeerJ — the Journal of Life & Environmental Sciences, the fossil is from the smallest known individual of this giant, sail-backed theropod. The findings suggest the small specimen retains the same locomotor adaptations as the large version — such as traversing soft substrates or paddling — during the entire lifespan.
Collected in Morocco in 1999, a 21 mm-long pedal ungual phalanx (a phalanx supporting a claw of the foot) remained unnoticed in the Paleontological Collection of the Natural History Museum of Milan, until the recent discovery (2014) of a new partial skeleton of Spinosaurus aegyptiacus, that preserves an almost complete right foot with peculiar morphology in the phalanges.
The striking similarities with the claw phalanges of the foot of Spinosaurus allowed palaeontologists Simone Maganuco and Cristiano Dal Sasso to identify the tiny bone to a very small and young specimen of the sail-backed Spinosaurus, the smallest individual reported up to today. “Besides the rarity of the fossils belonging to juvenile theropod dinosaurs, and the rarity of Spinosaurus bones, this finding is even more remarkable if we consider the dramatic size attained by some large specimens of Spinosaurus, which are possibly the longest, and among the largest predatory dinosaurs ever found”- says Maganuco.
Assuming the juveniles looked like smaller versions of the adults, the 21 mm-long claw phalanx from this small specimen would pertain to an early juvenile individual, 1.78 m-long, only just a little bit longer than the estimated length of the sole head of the largest adult Spinosaurus known to date, which is also housed at the Natural History Museum of Milan.
According to recent studies, the broader than deep unguals in Spinosaurus with their flat plantar surface are reminiscent of the flattened pedal shape of shorebirds that do not perch, and the whole foot may have been adapted to traversing soft substrates or webbed for paddling. “This find indicates that in Spinosaurus the foot of early juveniles had the same locomotor adaptations observed in large individuals, that were probably achieved early in ontogeny and retained for the entire lifespan,” remarks co-author Cristiano Dal Sasso.
Reference:
Simone Maganuco, Cristiano Dal Sasso. The smallest biggest theropod dinosaur: a tiny pedal ungual of a juvenile Spinosaurus from the Cretaceous of Morocco. PeerJ, 2018; 6: e4785 DOI: 10.7717/peerj.4785
Note: The above post is reprinted from materials provided by PeerJ.
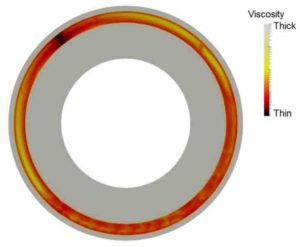
A 3D computer model of the asthenosphere by Rice University geophysicists finds that the convective cycling and pressure-driven flow can sometimes cause the asthenosphere to move even faster than the tectonic plates riding atop it. This 2D slice of data from the model shows stronger, faster moving sections of the asthenosphere (yellow) bracketed above and below by slower, more fluid regions (orange). Credit: A. Semple/Rice University
New simulations of Earth’s asthenosphere find that convective cycling and pressure-driven flow can sometimes cause the planet’s most fluid layer of mantle to move even faster than the tectonic plates that ride atop it.
That’s one conclusion from a new study by Rice University geophysicists who modeled flow in the 100-mile-thick layer of mantle that begins at the base of Earth’s tectonic plates, or lithosphere.
The study, which is available online in the journal Earth and Planetary Science Letters, takes aim at a much-debated question in geophysics: What drives the movement of Earth’s tectonic plates, the 57 interlocking slabs of the lithosphere that slip, grind and bump against one another in a seismic dance that causes earthquakes, builds continents and gradually reshapes the planet’s surface every few million years?
“Tectonic plates float on top of the asthenosphere, and the leading theory for the past 40 years is that the lithosphere moves independently of the asthenosphere, and the asthenosphere only moves because the plates are dragging it along,” said graduate student Alana Semple, lead co-author of the new study. “Detailed observations of the asthenosphere from a Lamont research group returned a more nuanced picture and suggested, among other things, that the asthenosphere has a constant speed at its center but is changing speeds at its top and base, and that it sometimes appears to flow in a different direction than the lithosphere.”
Computational modeling carried out at Rice offers a theoretical framework that can explain these puzzling observations, said Adrian Lenardic, a study co-author and professor of Earth, environmental and planetary sciences at Rice.
“We’ve shown how these situations can occur through a combination of plate- and pressure-driven flow in the asthenosphere,” he said. “The key was realizing that a theory developed by former Rice postdoc Tobias Höink had the potential to explain the Lamont observations if a more accurate representation of the asthenosphere’s viscosity was allowed for. Alana’s numerical simulations incorporated that type of viscosity and showed that the modified model could explain the new observations. In the process, this offered a new way of thinking about the relationship between the lithosphere and asthenosphere.”
Though the asthenosphere is made of rock, it is under intense pressure that can cause its contents to flow.
“Thermal convection in Earth’s mantle generates dynamic pressure variations,” Semple said. “The weakness of the asthenosphere, relative to tectonic plates above, allows it to respond differently to the pressure variations. Our models show how this can lead to asthenosphere velocities that exceed those of plates above. The models also show how flow in the asthenosphere can be offset from that of plates, in line with the observations from the Lamont group”
The oceanic lithosphere is formed at mid-ocean ridges and flows toward subduction zones where one tectonic plate slides beneath another. In the process, the lithosphere cools and heat from Earth’s interior is transferred to its surface. Subduction recycles cooler lithospheric material into the mantle, and the cooling currents flow back into the deep interior.
Semple’s 3D model simulates both this convective cycle and the asthenosphere. She credited Rice’s Center for Research Computing (CRC) for its help running simulations — some of which took as long as six weeks — on Rice’s DAVinCI supercomputer.
Semple said the simulations show how convective cycling and pressure-driven flow can drive tectonic movement.
“Our paper suggests that pressure-driven flow in the asthenosphere can contribute to the motion of tectonic plates by dragging plates along with it,” she said. “A notable contribution does come from ‘slab-pull,’ a gravity-driven process that pulls plates toward subduction zones. Slab-pull can still be the dominant process that moves plates, but our models show that asthenosphere flow provides a more significant contribution to plate movement than previously thought.”
The research was supported by the National Science Foundation. DAVinCI is administered by CRC and was procured in partnership with Rice’s Ken Kennedy Institute for Information Technology.
Reference:
Alana G. Semple, Adrian Lenardic. Plug flow in the Earth’s asthenosphere. Earth and Planetary Science Letters, 2018; 496: 29 DOI: 10.1016/j.epsl.2018.05.030
Note: The above post is reprinted from materials provided by Rice University. Original written by Jade Boyd.
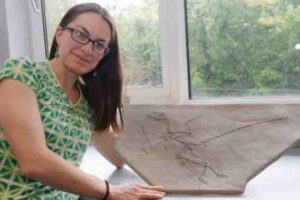
Dr Maria McNamara, UCC: “What’s remarkable is that the fossil dandruff is almost identical to that in modern birds.” Credit: John Sheehan
Palaeontologists from University College Cork (UCC) in Ireland have discovered 125 million-year-old dandruff preserved amongst the plumage of feathered dinosaurs and early birds, revealing the first evidence of how dinosaurs shed their skin.
UCC’s Dr Maria McNamara and her team studied the fossil cells, and dandruff from modern birds, with powerful electron microscopes for the study, published today in the journal Nature Communications.
“The fossil cells are preserved with incredible detail — right down to the level of nanoscale keratin fibrils. What’s remarkable is that the fossil dandruff is almost identical to that in modern birds — even the spiral twisting of individual fibres is still visible,” said Dr Maria McNamara.
Just like human dandruff, the fossil dandruff is made of tough cells called corneocytes, which in life are dry and full of the protein keratin.
The study suggests that this modern skin feature evolved sometime in the late Middle Jurassic, around the same time as a host of other skin features evolved. “There was a burst of evolution of feathered dinosaurs and birds at this time, and it’s exciting to see evidence that the skin of early birds and dinosaurs was evolving rapidly in response to bearing feathers,” Dr McNamara added.
Dr McNamara led the study, in collaboration with her postdoctoral researcher Dr Chris Rogers; Dr Andre Toulouse and Tara Foley, also from UCC; Dr Paddy Orr from UCD, Ireland; and an international team of palaeontologists from the UK and China.
The dandruff is the first evidence of how dinosaurs shed their skin. The feathered dinosaurs studied — Microraptor, Beipiaosaurus and Sinornithosaurus — clearly shed their skin in flakes, like the early bird Confuciusornis studied by the team and also modern birds and mammals, and not as a single piece or several large pieces, as in many modern reptiles.
Co-author Professor Mike Benton, from the University of Bristol’s School of Earth Sciences, said: “It’s unusual to be able to study the skin of a dinosaur, and the fact this is dandruff proves the dinosaur was not shedding its whole skin like a modern lizard or snake but losing skin fragments from between its feathers.”
Modern birds have very fatty corneocytes with loosely packed keratin, which allows them to cool down quickly when they are flying for extended periods. The corneocytes in the fossil dinosaurs and birds, however, were packed with keratin, suggesting that the fossils didn’t get as warm as modern birds, presumably because they couldn’t fly at all or for as long periods.
Reference:
Maria E. McNamara, Fucheng Zhang, Stuart L. Kearns, Patrick J. Orr, André Toulouse, Tara Foley, David W. E. Hone, Chris S. Rogers, Michael J. Benton, Diane Johnson, Xing Xu, Zhonghe Zhou. Fossilized skin reveals coevolution with feathers and metabolism in feathered dinosaurs and early birds. Nature Communications, 2018; 9 (1) DOI: 10.1038/s41467-018-04443-x
The asteroid impact that eliminated non-avian dinosaurs destroyed global forests. Here, a hyopothetical surviving bird lineage — small-bodied and specialized for a ground-dwelling lifestyle–flees a burning forest in the aftermath of the asteroid strike. Credit: Phillip M. Krzeminski
Sixty-six million years ago, the world burned. An asteroid crashed to Earth with a force one million times larger than the largest atomic bomb, causing the extinction of the dinosaurs. But dinosaurs weren’t the only ones that got hit hard — in a new study, scientists learned that the planet’s forests were decimated, leading to the extinction of tree-dwelling birds.
“Looking at the fossil record, at plants and birds, there are multiple lines of evidence suggesting that the forest canopies collapsed,” says Regan Dunn, a paleontologist at the Field Museum in Chicago and a co-author on the study in Current Biology. “Perching birds went extinct because there were no more perches.”
“We drew on a variety of approaches to stitch this story together,” said Daniel Field, the paper’s lead author, of the Milner Centre for Evolution at the University of Bath. “We concluded that the temporary elimination of forests in the aftermath of the asteroid impact explains why arboreal birds failed to survive across this extinction event. The ancestors of modern arboreal birds did not move into the trees until forests had recovered from the extinction-causing asteroid.”
The project’s pollen expert, Antoine Bercovici of the Smithsonian Institution and the Denver Museum of Nature and Science, helped determine that the world’s forests were destroyed by looking at microscopic fossils of pollen and spores. Dunn explains, “After a disaster like a forest fire or a volcanic eruption, the first plants to come back are the fastest colonizers — especially ferns.” That’s because ferns don’t sprout from seeds, but from spores, which are much smaller — just a single cell. “Spores are minuscule, the size of a grain of pollen, so they’re easily dispersed. They get picked up by the wind and go further than seeds can, and all they need to grow is a wet spot.”
“The spores are tiny — you could fit four across a single strand of your hair,” says Dunn. “To see them, we take a sample of rock from the time frame just after the collision and dissolve it in acid. Then we purify it so that all that remains is the organic debris, like pollen, spores and little leaf bits, then we look at them under a microscope.”
Immediately after the asteroid hit, the fossil record shows the charcoal remains of burnt trees, and then, tons of fern spores. An abundance of fern spores in the fossil record often comes on the heels of a natural disaster that destroyed larger plants like trees.
“Our study examined the fossil record from New Zealand, Japan, Europe and North America, which showed there was a mass deforestation across the globe at the end of the Cretaceous period,” says co-author Bercovici.
And with no more trees, the scientists found, tree-dwelling birds went extinct. The birds that did survive were ground-dwellers — birds whose fossilized remains show longer, sturdier legs like we see in modern ground birds like kiwis and emus. The Cretaceous equivalent of robins and sparrows, with delicate little legs made for perching on tree branches, had no place to live.
“Today, birds are the most diverse and globally widespread group of terrestrial vertebrate animals — there are nearly 11,000 living species,” says Field. “Only a handful of ancestral bird lineages succeeded in surviving the mass extinction event 66 million years ago, and all of today’s amazing living bird diversity can be traced to these ancient survivors.”
And while fossil animals like dinosaurs and birds often get more love than fossil plants, Dunn says that plants are critical to understanding life on earth. “Plants are everything, plants are the context in which all terrestrial life evolves and survives. They’re primary producers, they make energy available to all life forms by capturing it from the sun — we can’t do that.”
She also notes that while the dinosaurs and their perching bird neighbors died 66 million years ago, their plight is relevant today. “The end-Cretaceous event is the fifth mass extinction — we’re in the sixth,” says Dunn. “It’s important for us to understand what happens when you destroy an ecosystem, like with deforestation and climate change — so we can know how our actions will affect what comes after us.”
Reference:
Daniel J. Field, Antoine Bercovici, Jacob S. Berv, Regan Dunn, David E. Fastovsky, Tyler R. Lyson, Vivi Vajda, Jacques A. Gauthier. Early Evolution of Modern Birds Structured by Global Forest Collapse at the End-Cretaceous Mass Extinction. Current Biology, 2018; DOI: 10.1016/j.cub.2018.04.062
Note: The above post is reprinted from materials provided by Field Museum.
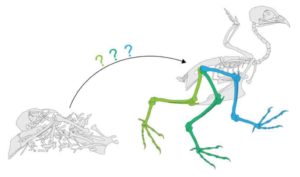
This is an image of a reliable reconstruction. Soft tissues like ligaments play a big role in determining a joint’s range of motion. But soft tissues rarely fossilize, causing problems for paleontologists trying to reconstruct who extinct creatures may have lived. Now researchers have shown a new method for inferring the extent to which ligaments inhibit joint movement, which could be helpful in reconstructing ancient species. Credit: Armita Manafzadeh
Most renderings and reconstructions of pterodactyls and other extinct flying reptiles show a flight pose much like that of bats, which fly with their hind limbs splayed wide apart. But a new method for inferring how ancient animals might have moved their joints suggests that pterosaurs probably couldn’t strike that pose.
“Most of the work that’s being done right now to understand pterosaur flight relies on the assumption that their hips could get into a bat-like pose,” said Armita Manafzadeh, a Ph.D. student at Brown University who led the research with Kevin Padian of the University of California, Berkeley. “We think future studies should take into account that this pose was likely impossible, which might change our perspective when we consider the evolution of flight in pterosaurs and dinosaurs.”
The research, published in Proceedings of the Royal Society B, is an effort to help paleontologists infer the range of motion of joints in a way that takes into account the soft tissues — particularly ligaments — that play key roles in how joints work. Generally, soft tissues don’t fossilize, leaving paleontologists to infer joint motion from bones alone. And there aren’t many constraints on how that’s done, Manafzadeh says. So she wanted to find a way to use present-day animals to test the extent to which ligaments limit joint motion.
It’s an idea that started with grocery store chickens, Manafzadeh says.
“If you pick up a raw chicken at the grocery store and move its joints, you’ll reach a point where you’ll hear a pop,” she said. “That’s the ligaments snapping. But if I handed you a chicken skeleton without the ligaments, you might think that its joints could do all kinds of crazy things. So the question is, if you were to dig up a fossil chicken, how would you think its joints could move, and how wrong would you be?”
For this latest study, she used not a grocery store chicken, but dead quail. Birds are the closest living relative of extinct pterosaurs and four-winged dinosaurs. After carefully cutting away the muscles surrounding the birds’ hip joints, she manipulated the joints while taking x-ray videos. That way, she could determine the exact 3-D positions of the bones in poses where the ligaments prevented further movement.
This technique enabled Manafzadeh to map out the range of motion of the quail hip with ligaments attached, which she could then compare to the range of motion that might have been inferred from bones alone. For the bones-only poses, Manafzadeh used traditional criteria that paleontologists often use — stopping where the two bones hit each other and when the movement pulled the thigh bone out of its socket.
She found that over 95 percent of the joint positions that seemed plausible with bones alone were actually impossible when ligaments were attached.
The next step was to work out how the range of motion of present-day quail hips might compare to the range of motion for extinct pterosaurs and four-winged dinosaurs.
The assumption has long been that these creatures flew a lot like bats do. That’s partly because the wings of pterosaurs were made of skin and supported by an elongated fourth finger, which is somewhat similar to the wings of bats. Bat wings are also connected to their hind limbs, which they splay out widely during flight. Many paleontologists, Manafzadeh says, assume pterosaurs and four-winged dinosaurs did the same. But her study suggests that wasn’t possible.
In quail, a bat-like hip pose seemed possible based on bones alone, but outward motion of the thigh bone was inhibited by one particular ligament — a ligament that’s present in a wide variety of birds and other reptiles related to pterosaurs. No evidence, Manafzadeh says, suggests that extinct dinosaurs and pterosaurs wouldn’t have had this ligament, too.
And with that ligament attached, this new study suggests that the bat-like pose would be impossible. According to Manafzadeh’s work, this pose would require the ligament to stretch 63 percent more than the quail ligament can. That’s quite a stretch, she says.
“That’s a huge difference that would need to be accounted for before it can be argued that a pterosaur or ‘four-winged’ dinosaur’s hip would be able to get into this bat-like pose,” Manafzadeh said. And that, she says, may require a rethinking of the evolution of flight in these animals.
In addition to calling into question traditional ideas about flight in pterosaurs and early birds, the research also provides new ways of assessing joint mobility for any joint of any extinct species by looking at its living relatives.
“What we’ve done is to provide a reliable way to quantify in 3-D everything a joint can do,” Manafzadeh said.
She hopes other researchers will use the method to study other joint systems and to better understand how other species may have moved their joints, walked and flown.
Reference:
Armita R. Manafzadeh, Kevin Padian. ROM mapping of ligamentous constraints on avian hip mobility: implications for extinct ornithodirans. Proceedings of the Royal Society B: Biological Sciences, 2018; 285 (1879): 20180727 DOI: 10.1098/rspb.2018.0727
Note: The above post is reprinted from materials provided by Brown University.
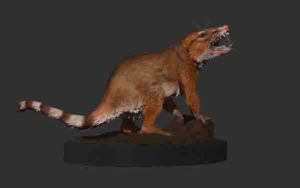
The new species Cifelliodon wahkarmoosuch is estimated to have weighed 2.5 pounds and probably grew to be about the size of a small hare. Credit: Keck School of Medicine of USC/Jorge A. Gonzalez
A nearly 130-million-year-old fossilized skull found in Utah is an Earth-shattering discovery in one respect.
The small fossil is evidence that the super-continental split likely occurred more recently than scientists previously thought and that a group of reptile-like mammals that bridge the reptile and mammal transition experienced an unsuspected burst of evolution across several continents.
“Based on the unlikely discovery of this near-complete fossil cranium, we now recognize a new, cosmopolitan group of early mammal relatives,” said Adam Huttenlocker, lead author of the study and assistant professor of clinical integrative anatomical sciences at the Keck School of Medicine of USC.
The study, published in the journal Nature on May 16, updates the understanding of how mammals evolved and dispersed across major continents during the age of dinosaurs. It suggests that the divide of the ancient landmass Pangea continued for about 15 million years later than previously thought and that mammal migration and that of their close relatives continued during the Early Cretaceous (145 to 101 million years ago).
“For a long time, we thought early mammals from the Cretaceous (145 to 66 million years ago) were anatomically similar and not ecologically diverse,” Huttenlocker said. “This finding by our team and others reinforce that, even before the rise of modern mammals, ancient relatives of mammals were exploring specialty niches: insectivores, herbivores, carnivores, swimmers, gliders. Basically, they were occupying a variety of niches that we see them occupy today.”
The study reveals that the early mammal precursors migrated from Asia to Europe, into North America and further onto major Southern continents, said Zhe-Xi Luo, senior author of the study and a paleontologist at the University of Chicago.
Fossil find: a new species
Huttenlocker and his collaborators at the Utah Geological Survey and The University of Chicago named the new species Cifelliodon wahkarmoosuch.
Found in the Cretaceous beds in eastern Utah, the fossil is named in honor of famed paleontologist Richard Cifelli. The species name, “wahkarmoosuch” means “yellow cat” in the Ute tribe’s language in respect of the area where it was found.
Scientists used high-resolution computed tomography (CT) scanners to analyze the skull.
“The skull of Cifelliodon is an extremely rare find in a vast fossil-bearing region of the Western Interior, where the more than 150 species of mammals and reptile-like mammal precursors are represented mostly by isolated teeth and jaws,” said James Kirkland, study co-author in charge of the excavation and a Utah State paleontologist.
With an estimated body weight of up to 2.5 pounds, Cifelliodon would seem small compared to many living mammals, but it was a giant among its Cretaceous contemporaries. A full-grown Cifelliodon was probably about the size of a small hare or pika (small mammal with rounded ears, short limbs and a very small tail).
It had teeth similar to fruit-eating bats and could nip, shear and crush. It might have incorporated plants into its diet.
The newly named species had a relatively small brain and giant “olfactory bulbs” to process sense of smell. The skull had tiny eye sockets, so the animal probably did not have good eyesight or color vision. It possibly was nocturnal and depended on sense of smell to root out food, Huttenlocker said.
Supercontinent existed longer than previously thought
Huttenlocker and his colleagues placed Cifelliodon within a group called Haramiyida, an extinct branch of mammal ancestors related to true mammals. The fossil was the first of its particular subgroup — Hahnodontidae — found in North America.
The fossil discovery emphasizes that haramiyidans and some other vertebrate groups existed globally during the Jurassic-Cretaceous transition, meaning the corridors for migration via Pangean landmasses remained intact into the Early Cretaceous.
Most of the Jurassic and Cretaceous fossils of haramiyidans are from the Triassic and Jurassic of Europe, Greenland and Asia. Hahnodontidae was previously known only from the Cretaceous of Northern Africa. It is to this group that Huttenlocker argues Cifelliodon belongs, providing evidence of migration routes between the continents that are now separated in northern and southern hemispheres.
“But it’s not just this group of haramiyidans,” Huttenlocker said. “The connection we discovered mirrors others recognized as recently as this year based on similar Cretaceous dinosaur fossils found in Africa and Europe.”
Reference:
Adam K. Huttenlocker, David M. Grossnickle, James I. Kirkland, Julia A. Schultz, Zhe-Xi Luo. Late-surviving stem mammal links the lowermost Cretaceous of North America and Gondwana. Nature, 2018; DOI: 10.1038/s41586-018-0126-y
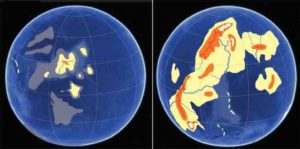
A conceptual rendering suggests how Earth’s land elevations and oceans may have appeared during the assembly of Kenorland, left, and later, right, after the Great Oxygenation Event. A University of Oregon-led study has potentially narrowed the window on when significant amounts of land emerged from under the ocean’s surface. Credit: Graphic by Ilya Bindeman
Chemical signatures in shale, the Earth’s most common sedimentary rock, point to a rapid rise of land above the ocean 2.4 billion years ago that possibly triggered dramatic changes in climate and life.
In a study published in the May 24 issue of the journal Nature, researchers report that shale sampled from around the world contains archival quality evidence of almost imperceptible traces of rainwater that caused weathering of land from as old as 3.5 billion years ago.
Notable changes in the ratios of oxygen 17 and 18 with more common oxygen 16, said lead author Ilya Bindeman, a geologist at the University of Oregon, allowed researchers to read the chemical history in the rocks.
In doing so, they established when newly surfaced crust was exposed to weathering by chemical and physical processes, and, more broadly, when the modern hydrologic process of moisture distillation during transport over large continents started.
The evidence is from analyses of three oxygen isotopes, particularly the rare but stable oxygen 17, in 278 shale samples drawn from outcrops and drill holes from every continent and spanning 3.7 billion years of Earth’s history. The analyses were done in Bindeman’s Stable Isotope Laboratory.
Based on his own previous modeling and other studies, Bindeman said, total landmass on the planet 2.4 billion years ago may have reached about two-thirds of what is observed today. However, the emergence of the new land happened abruptly, in parallel with large-scale changes in mantle dynamics.
Isotopic changes recorded in the shale samples at that time also coincides with the hypothesized timing of land collisions that formed Earth’s first supercontinent, Kenorland, and high-mountain ranges and plateaus.
“Crust needs to be thick to stick out of water,” Bindeman said. “The thickness depends on its amount and also on thermal regulation and the viscosity of the mantle. When the Earth was hot and the mantle was soft, large, tall mountains could not be supported. Our data indicate that this changed exponentially 2.4 billion years ago. The cooler mantle was able to support large swaths of land above sea level.”
Temperatures on the surface when the new land emerged from the sea would have likely been hotter than today by several tens of degrees, he said.
The study found a stepwise change in triple-isotopes of oxygen around that time frame. That, the scientists said, resolves previous arguments for a gradual or stepwise emergence of land between 1.1 and 3.5 billion years ago. At 2.4 billion years ago, Bindeman said, the newly emerged land began to consume carbon dioxide from the atmosphere amid chemical weathering.
The timing also coincides with the transition from the Archean Eon, when simple prokaryotic life forms, archaea and bacteria, thrived in water, to the Proterozoic Eon, when eukaryotes, such as algae, plants and fungi, emerged.
“In this study, we looked at how weathering proceeded over 3.5 billion years,” Bindeman said. “Land rising from water changes the albedo of the planet. Initially, Earth would have been dark blue with some white clouds when viewed from space. Early continents added to reflection. Today we have dark continents because of lots of vegetation.”
Exposure of the new land to weathering, he said, may have set off a sink of greenhouse gases such carbon dioxide, disrupting the radiative balance of the Earth that generated a series of glacial episodes between 2.4 billion and 2.2 billion years ago. That, he said, may have spawned the Great Oxygenation Event in which atmospheric changes brought significant amounts of free oxygen into the air. Rocks were oxidized and became red. Archean rocks are gray.
In the absence of much land, he said, photons from the sun interacted with water and heated it. A bright surface, provided by emerging land, would reflect sunlight back into space, creating additional torque on radiative-greenhouse balance and a change in climate.
“What we speculate is that once large continents emerged, light would be reflected back into space and initiate runaway glaciation,” Bindeman said. “Earth would have seen its first snowfall.”
Shales are formed by the weathering of crust.
“They tell you a lot about the exposure to air and light and precipitation,” Bindeman said. “The process of forming shale captures organic products and eventually helps to generate oil. Shales provide us with a continuous record of weathering.”
Reference:
I. N. Bindeman, D. O. Zakharov, J. Palandri, N. D. Greber, N. Dauphas, G. J. Retallack, A. Hofmann, J. S. Lackey, A. Bekker. Rapid emergence of subaerial landmasses and onset of a modern hydrologic cycle 2.5 billion years ago. Nature, 2018; 557 (7706): 545 DOI: 10.1038/s41586-018-0131-1
Note: The above post is reprinted from materials provided by University of Oregon.
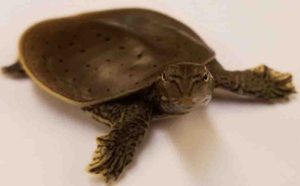
This is an Apalone spinifera spiny softshell turtle hatchling. Credit: Nicole Valenzuela
A discovery by scientists at the University of Kent has provided significant insight into the overall genome structure of dinosaurs.
By comparing the genomes of different species, chiefly birds and turtles, the Kent team were able to determine how the overall genome structure (i.e. the chromosomes) of many people’s favourite dinosaur species — like Velociraptor or Tyrannosaurus — might have looked through a microscope.
The research was carried out in the laboratory of Professor Darren Griffin, of the University’s School of Biosciences, and is now published in the journal Nature Communications. It involved extrapolating the likely genome structure of a shared common ancestor of birds and turtles that lived around 260 million years ago — 20 million years before the dinosaurs first emerged.
Dr Becky O’Connor, senior postdoctoral researcher and co-author of the Nature Communications paper, then traced how chromosomes changed over evolutionary time from a reptile ancestor to the present day.
The team found that, although the individual chromosomes rearranged their genes internally, this did not occur much at all between the chromosomes — what the scientists describe as ‘a significant discovery’.
Birds (which are themselves living dinosaurs) have a lot of chromosomes compared to most other species and that is possibly one of the reasons why they are so diverse. This research suggests that the pattern of chromosomes (karyotype) seen in early emerging dinosaurs and later theropods is similar to that of most birds and, again, may help explain their great diversity.
The new discovery suggests that, had scientists had the opportunity to make a chromosome preparation from a theropod dinosaur, it might have looked very similar to that of a modern-day ostrich, duck or chicken.
One of the key pieces of biotechnology that made it possible was the development of a set of fluorescent probes derived from birds that worked well on the chromosomes of turtles.
The genetics laboratory run by Professor Darren Griffin in Kent’s School of Biosciences carries out research into how genes organise into chromosomes and how that is different between species. The work is a collaboration with Dr Denis Larkin at the Royal Veterinary College in London, Iowa State University, the University of Cambridge, Oxford Genome Technologies and the Natural History Museum, London. The work is a collaboration with Dr Denis Larkin at the Royal Veterinary College in London, Iowa State University, the University of Cambridge, the Cambridge company Cytocell and the Natural History Museum, London.
Reference:
Rebecca E. O’Connor, Michael N. Romanov, Lucas G. Kiazim, Paul M. Barrett, Marta Farré, Joana Damas, Malcolm Ferguson-Smith, Nicole Valenzuela, Denis M. Larkin, Darren K. Griffin. Reconstruction of the diapsid ancestral genome permits chromosome evolution tracing in avian and non-avian dinosaurs. Nature Communications, 2018; 9 (1) DOI: 10.1038/s41467-018-04267-9
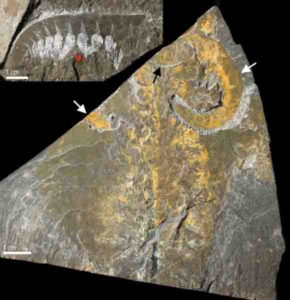
These are exceptionally preserved soft-bodied fossils of the Cambrian predator and stem-lineage euarthropod Anomalocaris canadensis from the Burgess Shale, Canada. Top left: Frontal appendage showing segmentation similar to modern-day euarthropods. Bottom right: Full body specimen showing one pair of frontal appendages (white arrows) and mouthparts consisting of plates with teeth (black arrow) on the head. Credit: A. Daley
All the major groups of animals appear in the fossil record for the first time around 540-500 million years ago — an event known as the Cambrian Explosion — but new research from the University of Oxford in collaboration with the University of Lausanne suggests that for most animals this ‘explosion’ was in fact a more gradual process.
The Cambrian Explosion produced the largest and most diverse grouping of animals the Earth has ever seen: the euarthropods. Euarthropoda contains the insects, crustaceans, spiders, trilobites, and a huge diversity of other animal forms alive and extinct. They comprise over 80 percent of all animal species on the planet and are key components of all of Earth’s ecosystems, making them the most important group since the dawn of animals over 500 million years ago.
A team based at Oxford University Museum of Natural History and the University of Lausanne carried out the most comprehensive analysis ever made of early fossil euarthropods from every different possible type of fossil preservation. In an article published today in the Proceedings of the National Academy of Sciences they show that, taken together, the total fossil record shows a gradual radiation of euarthropods during the early Cambrian, 540-500 million years ago.
The new analysis presents a challenge to the two major competing hypotheses about early animal evolution. The first of these suggests a slow, gradual evolution of euarthropods starting 650-600 million years ago, which had been consistent with earlier molecular dating estimates of their origin. The other hypothesis claims the nearly instantaneous appearance of euarthropods 540 million years ago because of highly elevated rates of evolution.
The new research suggests a middle-ground between these two hypotheses, with the origin of euarthropods no earlier than 550 million years ago, corresponding with more recent molecular dating estimates, and with the subsequent diversification taking place over the next 40 million years.
“Each of the major types of fossil evidence has its limitation and they are incomplete in different ways, but when taken together they are mutually illuminating and allow a coherent picture to emerge of the origin and radiation of the euarthropods during the lower to middle Cambrian,” explains Professor Allison Daley, who carried out the work at Oxford University Museum of Natural History and at the University of Lausanne. “This indicates that the Cambrian Explosion, rather than being a sudden event, unfolded gradually over the ~40 million years of the lower to middle Cambrian.”
The timing of the origin of Euarthropoda is very important as it affects how we view and interpret the evolution of the group. By working out which groups developed first we can trace the evolution of physical characteristics, such as limbs.
It has been argued that the absence of euarthropods from the Precambrian Period, earlier than around 540 million years ago, is the result of a lack of fossil preservation. But the new comprehensive fossil study suggests that this isn’t the case.
“The idea that arthropods are missing from the Precambrian fossil record because of biases in how fossils are preserved can now be rejected,” says Dr Greg Edgecombe FRS from the Natural History Museum, London, who was not involved in the study. “The authors make a very compelling case that the late Precambrian and Cambrian are in fact very similar in terms of how fossils preserve. There is really just one plausible explanation — arthropods hadn’t yet evolved.”
Harriet Drage, a PhD student at Oxford University Department of Zoology and one of the paper’s co-authors, says: “When it comes to understanding the early history of life the best source of evidence that we have is the fossil record, which is compelling and very complete around the early to middle Cambrian. It speaks volumes about the origin of euarthropods during an interval of time when fossil preservation was the best it has ever been.”
Reference:
Allison C. Daley, Jonathan B. Antcliffe, Harriet B. Drage, Stephen Pates. Early fossil record of Euarthropoda and the Cambrian Explosion. Proceedings of the National Academy of Sciences, 2018; 201719962 DOI: 10.1073/pnas.1719962115
Note: The above post is reprinted from materials provided by University of Oxford.
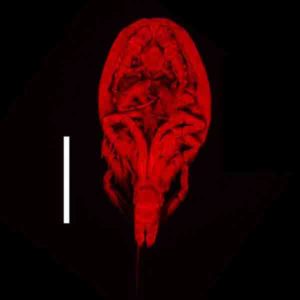
Image of a male Stygiopontius senokuchiae taken with a confocal laser microscope. This new species of copepod was discovered by Kumamoto University student, Reina Senokuchi. The white scale bar is 0.2 mm long. Credit: Photograph by Kumamoto University Associate Professor Takeshi Kitano
A new species of microcrustacean (Stygiopontius ) was collected from a submarine hot spring (hydrothermal vent) of a volcanic seamount (Myojin-sho caldera) in the Pacific Ocean off the coast of Japan. This crustacean group lives only around deep-sea hydrothermal vents in the central Atlantic or eastern Pacific Oceans. The new species is the first of its kind discovered in Japanese waters. Reina Senokuchi, a Kumamoto University student, was the first to make the discovery saying, “When I realized that it might be a new species, I was both delighted and very surprised. I couldn’t believe it was true.”
Portals to New Worlds
There are many hydrothermal vents in the deep waters east of Japan. The water in these vents is heated by volcanic activity under the ocean floor blown into the sea. In the vicinity of these openings, bacteria function as the primary producer of organic matter and convert mineral resources contained in the hot water into energy, a process called chemosynthesis. The organisms here are not found in any other type of environment on the planet. Some can be found in vents throughout the world’s oceans, yet others appear to live only in specific areas.
A research group headed by Associate Professor Motohiro Shimanaga of Kumamoto University studies the ecosystems of deep sea hydrothermal vents. Between 2012 and 2014, Dr. Shimanaga’s group surveyed hydrothermal vents in the calderas of three submarine volcanos in the Izu Islands (in the Izu-Bonin Arc) and collected samples of organisms to learn more about these mysterious life forms.
Research on the Pacific Rim
The area surveyed included hydrothermal vents at depths between 800 and 1400 meters in the Myojin-sho caldera, the Myojin abyssal hill, and the Bayonnaise abyssal hill, which are about 420 km south of Tokyo. Researchers mapped the areas and retrieved samples using an unmanned deep-sea sub. One of the samples included the new species of Stygiopontius, a type of copepod.
Copepods can be found all over the earth. They are ecologically important because they feed on phytoplankton and are a food source for many other creatures. Until this discovery, copepods of the genus Stygiopontius had only been found in deep sea hydrothermal vents in the center of the Atlantic and East Pacific Oceans, but not in the deep waters east of Japan.
When Ms. Reina Senokuchi, a student of Kumamoto University at that time of the study, examined the copepod from the Japan coast sample, she discovered that it had several morphological differences compared to other species of the genus Stygiopontius. Both male and female specimens of the new Stygiopontius species were found at all three investigation sites, with body lengths of 685 to 786 micrometers for females and 446 to 483 micrometers for males. Assistant Professor Daisuke Uyeno of Kagoshima University, an expert in morphological analysis of microorganisms, conducted an analysis of this tiny copepod and published a paper on the group’s findings.
The new species was named Stygiopontius senokuchiae after its discoverer Ms. R. Senokuchi. “I was very happy because I did not think it would be named before I graduated. It was definitely worth the effort to sketch out the microscopic observations,” she said upon hearing the news.
“Our next challenge is to figure out how this species adapted to the deep sea hydrothermal vent environment,” said Ms. Senokuchi’s mentor, Dr. Shimanaga. “We are also very interested in clarifying just how this species has spread from one hydrothermal zone to another, since the distances between the vents are relatively large.”
Reference:
DAISUKE UYENO, HIROMI K WATANABE, MOTOHIRO SHIMANAGA. A new dirivultid copepod (Siphonostomatoida) from hydrothermal vent fields of the Izu-Bonin Arc in the North Pacific Ocean. Zootaxa, 2018; 4415 (2): 381 DOI: 10.11646/zootaxa.4415.2.8
Note: The above post is reprinted from materials provided by Kumamoto University.
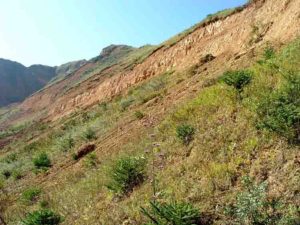
The exposure of the Neogene strata in the Linxia Basin of Gansu Province. Credit: Science China Press
The timescale is the basis to reconstruct the history of the Earth and biological evolution. A research on a chronostratigraphic sequence of the Chinese Neogene with accurate geological datings was published online in Science China: Earth Sciences.
The Chinese Neogene terrestrial deposits are widely exposed. In the Linxia Basin of Gansu Province, for example, there are continuous deposits from the Oligocene to Pleistocene, covering the complete Neogene period and bearing rich mammalian fossils (Fig. 1). The rapidly evolved mammalian fossils contribute efficiently to the division and correlation of Neogene strata. A uniform Neogene biostratigraphic framework for China has already been established, with seven mammalian ages named. With a developed stratigraphic basis for the geochronologic ages, seven chronostratigraphic stages have been established for the Chinese Neogene terrestrial strata, namely the Miocene Xiejian (Fig. 2), Shanwangian, Tunggurian, Bahean, and Baodean stages, and the Pliocene Gaozhuangian and Mazegouan stages.
Based on a series of research achievements, refined biostratigraphic, paleomagnetic and isotopic methods were combined and applied to continuous sections, and a Chinese Neogene chronostratigraphic sequence with accurate geological ages was established and improved by the research team of Prof. Deng Tao at the Institute of Vertebrate Paleontology and Paleoanthropology, Chinese Academy of Sciences in recent years. The researchers published their study, titled “Neogene integrative stratigraphy and timescale of China,” in Science China: Earth Sciences.
In Eurasia, Chinese Neogene deposits are more suitable for the establishment of an accurate Neogene biostratigraphic sequence than those of Europe, since the terrestrial deposits in Europe often limited, and many important faunas are unearthed from fissure-fillings. Chinese Neogene deposits are widespread and well suited for magnetostratigraphic analysis, despite the few radiometric dates available. The lower boundaries of most of the stages could be correlated with those of the marine stages in the International Chronostratigraphic Chart, except the Tunggurian Stage, which is correlated with the European land mammal age.
The biostratigraphic markers of the Chinese Neogene stages are usually first appearance of a single taxon, some representing regional species replacement, others indicating intercontinental migration of certain taxa. For instance, the lower boundaries of the two Upper Miocene stages, Bahean and Baodean have the first appearances of Hipparion dongxiangense and H. forstenae (Fig. 3) as biostratigraphic markers, respectively, and the geological ages of their lower boundaries are corresponding to those of the marine Tortonian (11.63 Ma) and Messinian (7.25 Ma).
The Chinese Neogene mammalian biostratigraphic divisions have become the core to establish the Asian framework. Candidate stratotype sections have been proposed for all the Chinese Neogene stages according to the principle and rule of modern stratigraphy, and other Chinese Neogene strata in different regions are comprehensively correlated.
Reference:
Tao Deng et al, Neogene integrative stratigraphy and timescale of China, Science China Earth Sciences (2018). DOI: 10.1007/s11430-017-9155-4
Note: The above post is reprinted from materials provided by Science China Press.
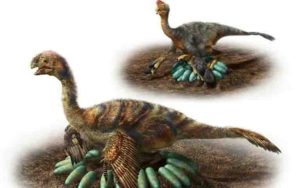
Feathered carnivores called oviraptorosaurs did not sit directly on their eggs, so as not to crush them, a new study found
Most dinosaurs buried their eggs and hoped for the best, but some species—including a few hefty ones—built nests and pampered unhatched offspring much as birds do today, researchers reported Wednesday.
Which raises an intriguing question: How did creatures nearly as heavy as a hippo brood eggs without squashing them?
“Large species may have not sat directly on their eggs,” explained Kohei Tanaka, a researcher at Nagoya University Museum and lead author of a study in Biology Letters that details the incubation strategy of feathered carnivores called oviraptorosaurs.
“Eggs are arranged in a circular pattern with a large central opening,” he told AFP, describing clutches of potato-shaped eggs found in China up to half-a-metre (20 inches) long and weighing up to seven kilos (15 pounds) each.
“The dinosaurs likely sat in the middle of the nest so that they didn’t crush the eggs.”
That didn’t keep the unborn dinos warm, but it may have protected them from predators and the elements, Tanaka speculated.
Modern birds descend from a large group of mostly carnivorous dinosaurs called theropods, all of which—including the fearsome T-rex—are thought to have laid eggs.
But very few theropods built nests, which is why the brooding displayed by oviraptorosaurs—a clade of several dozen species ranging from the turkey-sized Caudipteryx to the 1.4-tonne Gigantoraptor—is so important.
Sitting on eggshells
“The incubation behaviour of birds—such as adults sitting in the nest and possibly brooding—likely evolved from theropod dinosaurs,” said Tanaka. “Our research provides additional evidence.”
Oviraptorosaurs lived during the Cretaceous period, the 80 million years leading up to the asteroid or comet strike blamed for wiping out non-avian, terrestrial dinosaurs.
They had short snouts and beak-like jaws with few or no teeth, and some sported bony crests on their heads. Evidence of generous plumage—especially on the tail—has been found on several species.
Besides the spoke-like arrangement of the fossilised eggs, the eggshell itself provided further evidence that large oviraptorosaurs sat near their unborn progeny, not on top of them.
The eggs of big dinos, the researchers discovered, were more fragile than the eggs of smaller ones, which were clearly designed to carry more weight.
How big is too big to park a dino butt on top of unhatched eggs?
“That’s hard to say,” said Tanaka. “There is a gap in the data, but the threshold should be between 200 and 500 kilos (440 and 1,110 pounds).”
Oviraptorosaurs were falsely accused by early paleontologists of stealing the eggs so often found along side their fossil remains, giving rise to their name: “egg-thief lizards.”
Reference:
Incubation behaviours of oviraptorosaur dinosaurs in relation to body size, Biology Letters, DOI: 10.1098/rsbl.2018.0135
Note: The above post is reprinted from materials provided by AFP.
A news study shows how sea-lilies were in the Southern Hemisphere until much more recently than previously thought. Credit: Pete Bucktrout @ BAS
A new study of marine fossils from Antarctica, Australia, New Zealand and South America reveals that one of the greatest changes to the evolution of life in our oceans occurred more recently in the Southern Hemisphere than previously thought. The results are published today (17 May 2018) in the journal Communications Biology.
The Marine Mesozoic Revolution (MMR) is a key theory in evolutionary history. While dinosaurs ruled the land, profound changes occurred in the shallow seas that covered the Earth.
During the Mesozoic, around 200 million years ago, marine predators evolved that could drill holes and crush the shells of their prey. And although small in comparison to dinosaurs, these new predators, including crustacea and some types of modern fish, had a dramatic impact on marine life.
Among the species most heavily affected were sea lilies or isocrinids — invertebrates tethered to the seafloor by graceful stalks. Side on, these stalks resemble a vertebral column; in cross section, they are shaped like a five-pointed star — because sea lilies are related to starfish, sea urchins, and sand dollars. At their height during the Paleozoic, forests of sea lilies carpeted seafloors the world over.
Their restricted ability to move made sea lilies vulnerable to the new predators, so during the MMR they were forced into deeper waters in order to survive. Because it marked such a radical change in marine communities, scientists have long sought to understand this shift. They believed it occurred around 66 million years ago, but this new study shows that in the Southern Hemisphere, sea lilies remained in shallow waters until much more recently — around 33 million years ago.
A team from British Antarctic Survey, the University of Cambridge, the University of Western Australia, and the Royal Botanic Gardens, Victoria, made the discovery when they brought together field samples from Antarctica and Australia, with fossils from museum collections for the first time. The study provides conclusive evidence that this change happened at different times in different parts of the globe, and in the Antarctic and Australia, sea lilies hung on in shallow waters until the end of the Eocene, around 33 million years ago and it is unknown exactly why.
The study shows that knowing more about the Antarctic can reshape — or overturn — existing scientific theories.
According to lead author Dr Rowan Whittle from British Antarctic Survey: “It is surprising to see such a difference in what was happening at either end of the world. In the Northern Hemisphere these changes happened whilst the dinosaurs ruled the land, but by the time these sea lilies moved into the deep ocean in the Southern Hemisphere the dinosaurs had been extinct for over 30 million years.
“Given how the ocean is changing and projected to change in the future it is vital that we understand how different parts of the world could be affected in different ways and at a range of timescales.”
To get this richer picture of how sea lilies responded to the changing oceans of the Southern Hemisphere over millions of years, the team travelled to some of the remotest regions of Western Australia and Antarctica. Their hunt for fossil sea lilies was rewarded by the discovery of nine new species.
Co-author Dr Aaron Hunter from the University of Cambridge says: “We have documented how these sea lilies evolved as Australia split away from Antarctica moving north and becoming the arid outback we know today, while ice formed over the South Polar Region.
“The sea lilies survived in the shallow waters for millions of years longer than their Northern Hemisphere cousins, but as the continents moved further apart, they eventually had nowhere to go but the deep ocean depths where they have clung on to existence to this day.”
Reference:
Rowan J. Whittle, Aaron W. Hunter, David J. Cantrill, Kenneth J. McNamara. Globally discordant Isocrinida (Crinoidea) migration confirms asynchronous Marine Mesozoic Revolution. Communications Biology, 2018; 1 (1) DOI: 10.1038/s42003-018-0048-0