There is an old trick for remembering the difference between stalactites and stalagmites in a cave: Stalactites hold tight to the ceiling while stalagmites might one day grow to reach the ceiling. Now, it seems, stalagmites might also fill a hole in our understanding of Earth’s climate system and how that system is likely to respond to the rapid increase in atmospheric carbon dioxide since preindustrial times.
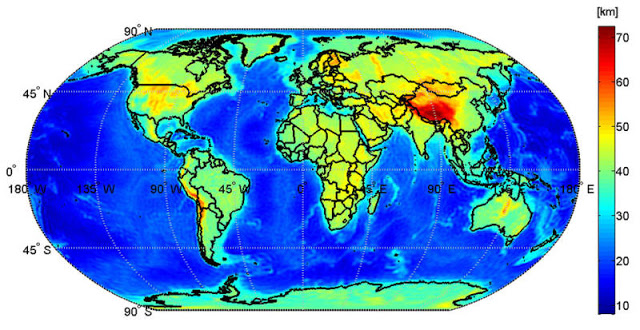
Many existing historical climate records are biased to the high latitudes — coming from polar ice cores and North Atlantic deep ocean sediments. Yet a main driver of climate variability today is El Niño, which is a completely tropical phenomenon. All of this begs the question: How do we study such tropical climate influences? The answer: stalagmites.
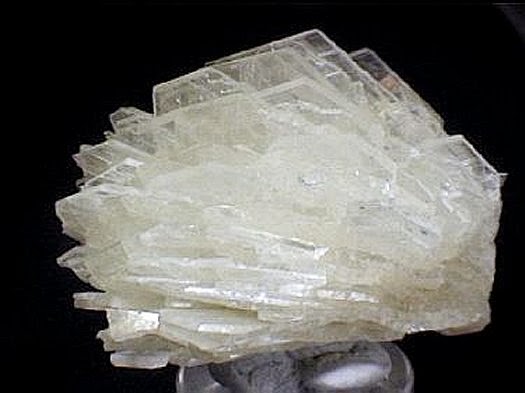
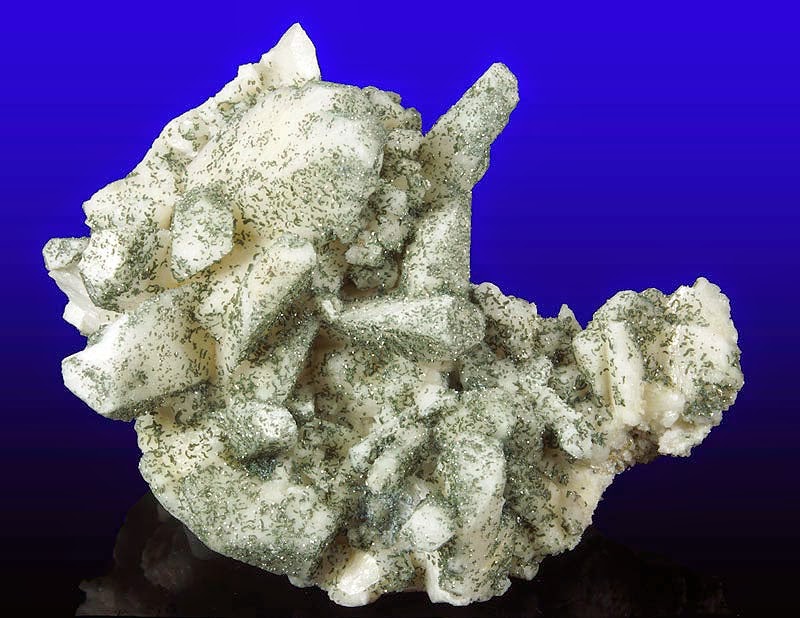
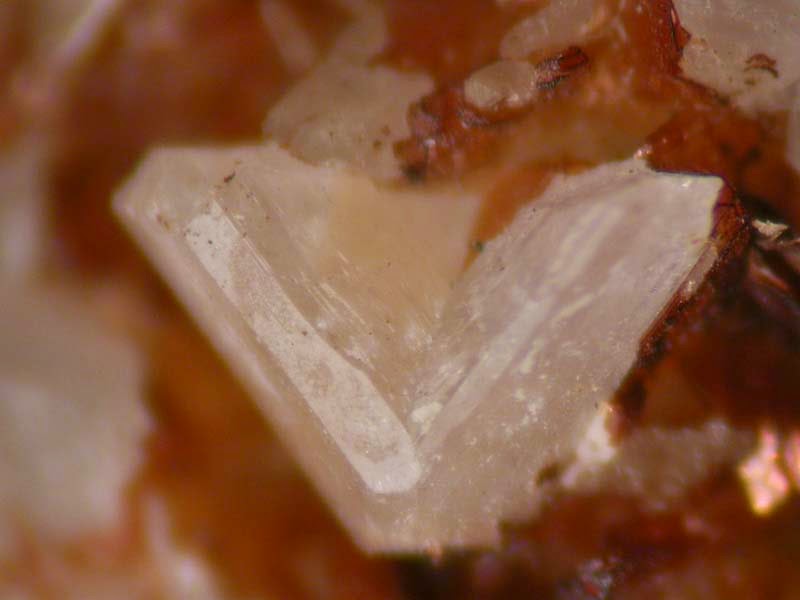
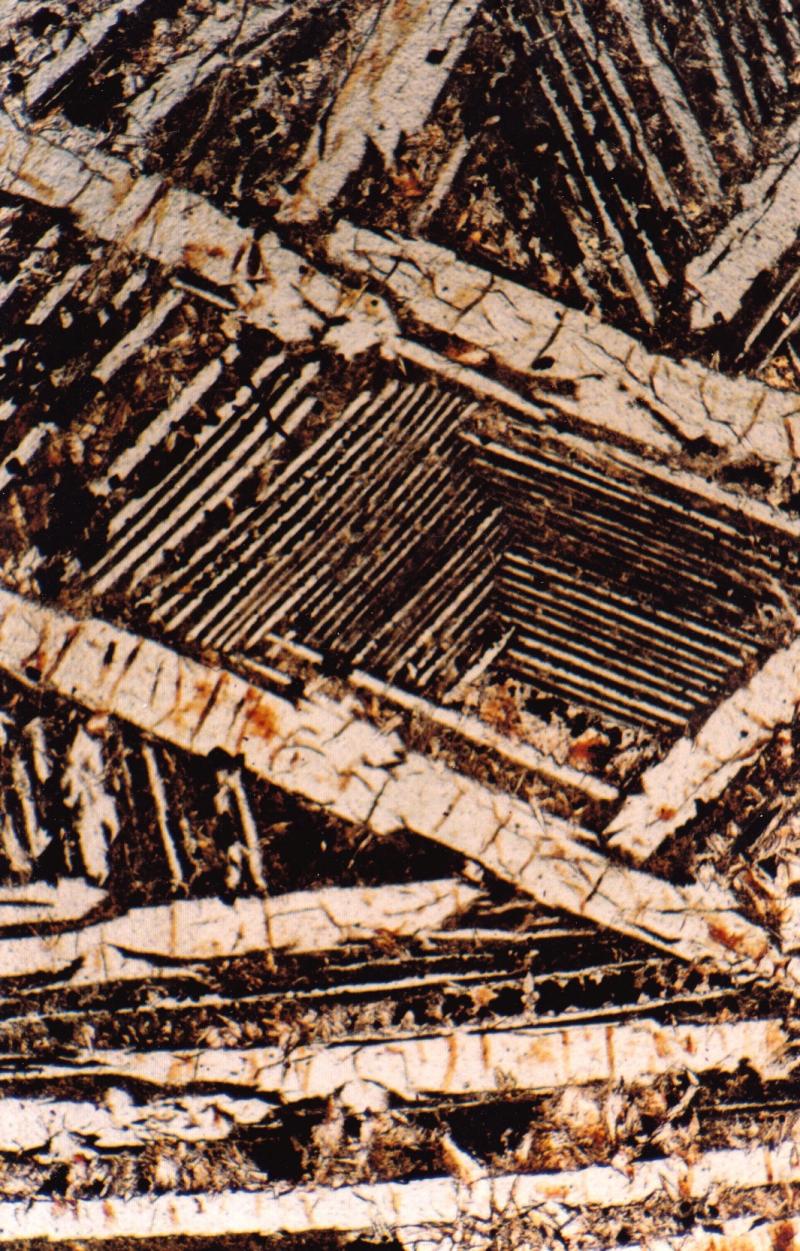
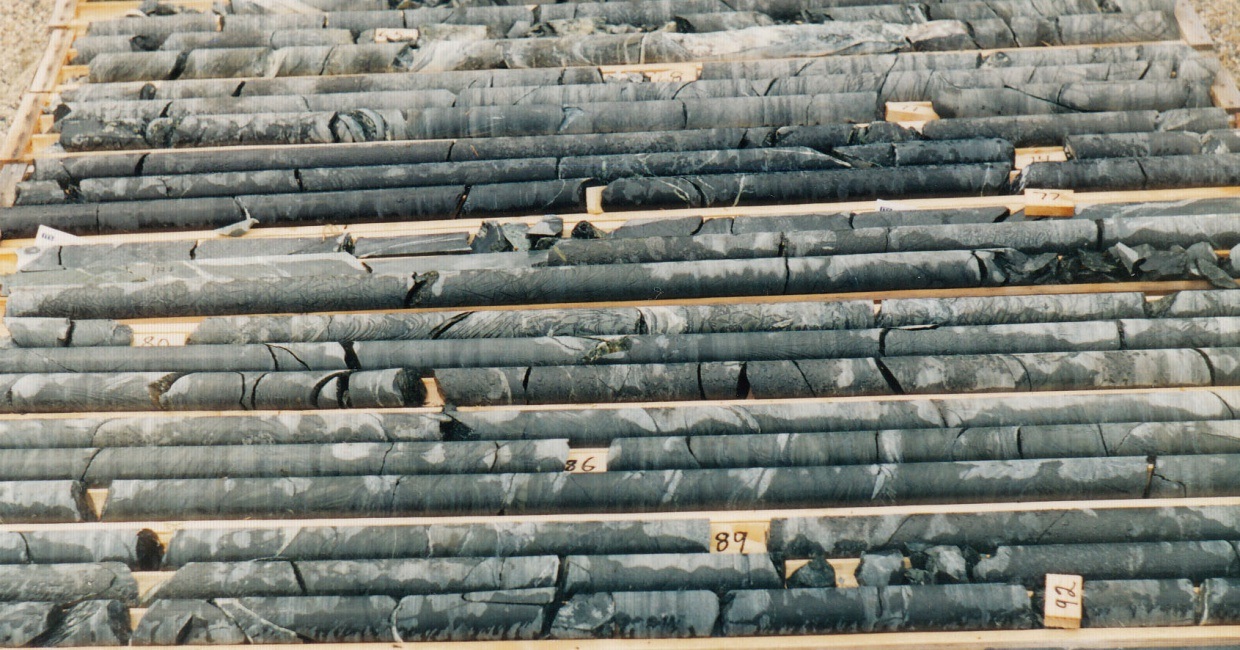
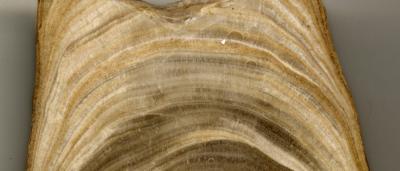
“Stalagmites are the ice cores of the tropics,” says Jess Adkins, professor of geochemistry and global environmental science at the California Institute of Technology (Caltech). He and geochemist Kim Cobb of the Georgia Institute of Technology led a team that collected samples from stalagmites in caves in northern Borneo and measured their levels of oxygen isotopes to reconstruct a history of the tropical West Pacific’s climate over four glacial cycles during the late Pleistocene era (from 570,000 to 210,000 years ago).
The results appear in the May 3 issue of Science Express. The lead author of the paper, Nele Meckler, completed most of the work as a postdoctoral scholar at Caltech and is now at the Geological Institute of ETH Zürich.
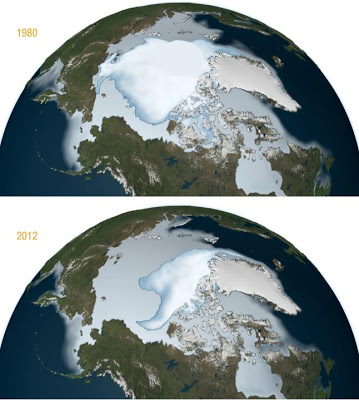
Throughout Earth’s history, global climate has shifted between periods of glacial cooling that led to ice ages, and interglacial periods of relative warmth, such as the present. Past studies from high latitudes have indicated that about 430,000 years ago — at a point known as the Mid-Brunhes Event (MBE) — peak temperatures and levels of atmospheric carbon dioxide in interglacial cycles were suddenly bumped up by about a third. But no one has known whether this was also the case closer to the equator.
By studying the records from tropical stalagmites, Adkins and his team found no evidence of such a bump. Instead, precipitation levels remained the same across the glacial cycles, indicating that the tropics did not experience a major shift in peak interglacial conditions following the MBE. “The stalagmite records have glacial cycles in them, but the warm times — the interglacials — don’t change in the same way as they do at high latitudes,” Adkins says. “We don’t know what that tells us yet, but this is the first time the difference has been recorded.”
At the same time, some changes did appear in the climate records from both the high latitudes and the tropics. The researchers found that extreme drying in the tropics coincided with abrupt climate changes in the North Atlantic, at the tail end of glacial periods. It is thought that these rapid climate changes, known as Heinrich events, are triggered by large ice sheets suddenly plunging into the ocean.
“In the tropics, we see these events as very sharp periods of drying in the stalagmite record,” Adkins says. “We think that these droughts indicate that the tropics experienced a more El Niño-like climate at those times, causing them to dry out.” During El Niño events, warm waters from the tropics, near Borneo, shift toward the center of the Pacific Ocean, often delivering heavier rainfall than usual to the western United States while leaving Indonesia and its neighbors extremely dry and prone to forest fires.
The fact that the tropics responded to Heinrich events, but not to the shift that affected the high latitudes following the MBE, suggests that the climate system has two modes of responding to significant changes. “It makes you wonder if maybe the climate system cares about what sort of hammer you hit it with,” Adkins says. “If you nudge the system consistently over long timescales, the tropics seem to be able to continue independently of the high latitudes. But if you suddenly whack the climate system with a big hammer, the impact spreads out and shows up in the tropics.”
This work raises questions about the future in light of recent increases in atmospheric carbon dioxide: Is this increase more like a constant push? Or is it a whack with a big hammer? A case could be made for either one of these scenarios, says Adkins, but he adds that it would be easiest to argue that the forcing is more like a sudden whack, since the amount of carbon dioxide in the atmosphere has increased at such an unprecedented rate.
In addition to Adkins, Cobb, and Meckler, other coauthors on the paper, “Interglacial hydroclimate in the tropical West Pacific through the late Pleistocene,” are Matthew Clarkson of the University of Edinburgh and Harald Sodemann of ETH Zürich. Cobb is also a former postdoctoral scholar in Adkins’s group and has been collaborating on this project since her time at Caltech. The work was supported by the National Science Foundation, the Swiss National Science Foundation, the German Research Foundation, and by an Edinburgh University Principal’s Career Development PhD Scholarship.
Note : The above story is reprinted from materials provided by California Institute of Technology. The original article was written by Kimm Fesenmaier.