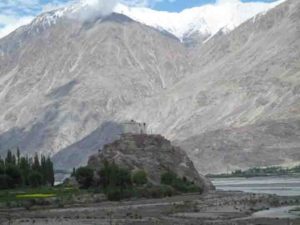
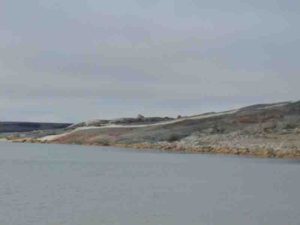
This is a temple in the Nubra Valley of Ladakh, India, which is in the study area. The picture illustrates the enormous size and scale of the mountains in this part of the Himalayas. Credit: Wendy Bohon
The Himalayan Range includes some of the youngest and most spectacular mountains on Earth, but the rugged landscape that lends it the striking beauty for which it is known can also keep scientists from fully understanding how these mountains formed. “We know more about the rocks on parts of Mars than we do about some of the areas in the Himalaya,” said Dr. Alka Tripathy-Lang.
“Many researchers have done extraordinary geologic mapping in this rugged region, but the fact is that some places are just completely inaccessible because of topography, elevation, or geopolitical issues. The rocks in those areas are an important piece of the tectonic puzzle and are important for understanding the way the region evolved,” said Dr. Wendy Bohon. “The tools we used, originally developed for mapping rocks on Mars, were a way to safely access information about the rocks in the Himalayas.”
Bohon and colleagues worked with researchers at the Mars Space Flight Facility at Arizona State University to use data from the Earth orbiting satellite Terra in the same way planetary geologists have been using data from the Mars orbiting satellite Odyssey.
The researchers relied on the fact that every mineral has a unique spectral “signature,” where some parts of the thermal infrared spectrum are absorbed and some parts are reflected. Rocks are made of different combinations of minerals, so when all of these mineral signatures are combined, they reveal the rock type. To easily distinguish between different kinds of rocks the researchers translated these signals into red/green/blue imagery, which results in a distinguishable color for each rock type that can be used to map the distribution of rocks throughout the region.
To double-check that the colors they’re mapping are truly the rock type predicted by the imagery, the researchers took hand samples from accessible locations in the study area to the laboratory and measured the spectral signatures of each rock using a thermal emission spectrometer. Then they compared these laboratory signatures to those collected from the ASTER (Advanced Spaceborne Thermal Emission and Reflection Radiometer) instrument on the Terra satellite. They matched. “There is some variation between the lab and ASTER spectral signatures due to different factors like weathering and the averaging area, but overall the match between them was surprisingly consistent,” said Tripathy-Lang.
The map they created revealed some interesting geology. They were able to clearly see “suture zones” — ancient seafloor pushed up and exposed during the collision between India and Eurasia — as well as subtle differences in the granitic mountains that indicates different phases of formation. They were also able the see the intersection of two massive fault systems, the Karakoram and Longmu Co Faults. “These fault systems are hugely important to the story of the Himalayan-Tibetan collision, and determining the way that these systems have evolved and how they interact is critical for understanding this part of the Himalayan Mountains,” said Bohon.
Reference:
Wendy Bohon, Kip V. Hodges, Alka Tripathy-Lang, J Ramón Arrowsmith, Christopher Edwards. Structural relationship between the Karakoram and Longmu Co fault systems, southwestern Tibetan Plateau, revealed by ASTER remote sensing. Geosphere, 2018; DOI: 10.1130/GES01515.1
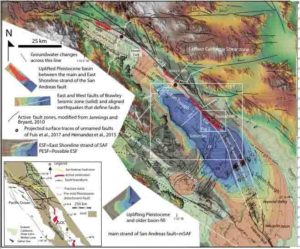
Map showing the faults and uplifting late Cenozoic basin fill (gray) of southeastern California. A larger version is available. Credit: Jänecke et al. and Lithosphere
Many researchers hypothesize that the southern tip of the 1300-km-long San Andreas fault zone (SAFZ) could be the nucleation site of the next major earthquake on the fault, yet geoscientists cannot evaluate this hazard until the location and geometry of the fault zone is documented.
In their new paper for Lithosphere, Susanne Jänecke and colleagues use detailed geologic and structural mapping of the southern 30 km of the San Andreas fault zone in southern California to show that it is a highly faulted volume of rock that is 1-4 km wide and organized as a sheared ladder-like structure in the upper 3-5 kilometers of the earth.
This newly identified Durmid ladder structure is at least 25 km long, has tens of master right-lateral and right-reverse faults along its edges and hundreds of left- and right-lateral cross faults in between. The Durmid ladder structure trends northwest, extends from the well-known main trace of the San Andreas fault (mSAF) on the northeast side to a newly identified East Shoreline fault zone (ESF) on the opposite edge.
Many years of detailed field study validated the team’s 2011 hypothesis about the existence of the East Shoreline strand of the SAFZ northeast of the margin of the Salton Sea, and this paper documents this previously unknown active fault using geophysical and geologic datasets along the entire northeast margin of Coachella Valley, California. The East Shoreline fault, say the authors, probably becomes the Garnet Hills fault, north of Palm Springs, and together they parallel the mSAF for >100 km.
Uplifted, highly folded and faulted Pliocene to Holocene sedimentary rocks, evidence for pervasive shortening, map-scale damage zones, and extremely rapid block rotation indicate that convergence across the Durmid ladder structure of the SAFZ is the smaller, secondary component that accompanies more rapid right-lateral motions. Small amounts of shallow creep and triggered slip regularly produce hairline fractures along the mSAF and Jänecke and colleagues recognize identical features within the ESF and along some cross faults of the Durmid ladder structure.
It is not clear how past earthquakes interacted with this well-organized multi-fault structure, and, notes Jänecke, this makes future behavior difficult to predict. The mSAF was the only active fault considered by the geoscience community in this crucial area prior to our detailed study.
New and published geophysical data sets and drill hole data in Coachella Valley show that the East Shoreline fault is a voluminous fault zone that extends in all three dimensions. It is well-imaged southwest of the mSAF and appears to persist into the subsurface at the southwest edge of a flower structure that may converge and simplify at depth.
In such an interpretation, the ESF is steep, dips northeast, and is a key structure at the basinward edge of an asymmetric flower-like structure identified by Fuis et al. (2017) directly northwest of this study area. Southward, the Durmid ladder structure widens gradually as it bends and interacts with the even wider Brawley Seismic zone. The component of shortening across the southernmost San Andreas fault zone gives way along strike to components of extension in the Brawley Seismic Zone within a defined transition zone. This geometry makes it likely that both fault zones could fail during a single earthquake, as suggested by prior research.
Several-kilometer-wide strike-slip fault zones, like the southern 30 km of the SAFZ, occur along many active faults and underlie metropolitan areas. The 2016 Mw 7.8 Kaikoura earthquake in New Zealand revealed that ladder-like fault zones can be enormous (at least 25 km wide and 150 km long) and fail in a piecemeal fashion. The surface-faulting hazards, ground shaking, and cascading ruptures that might arise from interactions among faults in active, voluminous fault zones are not well understood or quantified and much research is needed to mitigate the risk posed by this important type of structure.
Reference:
Susanne U. Jänecke, Daniel K. Markowski, James P. Evans, Patricia Persaud, Miles Kenney. Durmid ladder structure and its implications for the nucleation sites of the next M >7.5 earthquake on the San Andreas fault or Brawley seismic zone in southern California. Lithosphere, 2018; DOI: 10.1130/L629.1
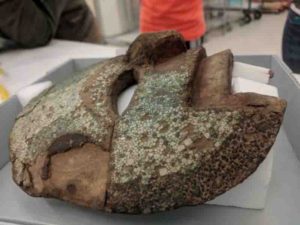
This is a close up view of Mixteca-style mask decorated with turquoise mosaic from the collections of the Smithsonian Institution-National Museum of the American Indian. NMAI Catalog #10/8712. Credit: Alyson M. Thibodeau
New research published today in the journal Science Advances overturns more than a century of thought about the source of turquoise used by ancient civilizations in Mesoamerica, the vast region that extends from Central Mexico to Central America. For more than 150 years, scholars have argued that the Aztec and Mixtec civilizations, which revered the precious, blue-green mineral, acquired it through import from the American Southwest. However, extensive geochemical analyses reveal that the true geologic source of Aztec and Mixtec turquoise lies within Mesoamerica.
Geochemist Alyson Thibodeau, assistant professor of earth sciences at Dickinson College, and a team of researchers from the University of Arizona, California State University at San Bernardino, and the Museo del Templo Mayor in Mexico City, measured the isotopic signatures of Mesoamerican turquoise artifacts associated with both the Aztecs and Mixtecs. These isotopic signatures function like fingerprints that can be used to determine the geologic origins of the turquoise.
Specifically, Thibodeau and her research team carried out analyses of lead and strontium isotopes on fragments of turquoise-encrusted mosaics, which are one of the most iconic forms of ancient Mesoamerican art. Their samples include dozens of turquoise mosaic tiles excavated from offerings within the Templo Mayor, the ceremonial and ritual center of the Aztec empire, and which is located in present-day Mexico City. They also analyzed five tiles associated with Mixteca-style objects held by the Smithsonian’s National Museum of the American Indian. The analyses revealed that turquoise artifacts had isotopic signatures consistent with geology of Mesoamerica, not the Southwestern United States.
“This work revises our understanding of these relatively rare objects and provides a new perspective on the availability of turquoise, which was a highly valued luxury resource in ancient Mesoamerica,” said Thibodeau. The work is the result of a decade-long collaboration between archaeologists and isotope geochemists to understand the nature of turquoise circulation and trade across southwestern North America. In earlier published research, Thibodeau showed that isotopic signatures could distinguish among turquoise deposits across the southwestern U.S. and identified the geologic sources of turquoise artifacts from archaeological sites in Arizona and New Mexico.
Thibodeau said that long-standing assumption that Mesoamerican civilizations imported turquoise from the Southwest had not been fully substantiated with evidence and that the new geochemical measurements unveil a different story. “These findings potentially re-shape our understanding of both the nature and extent of long-distance contacts between Mesoamerican and Southwestern societies, said Thibodeau. “I hope this inspires people to be skeptical of claims.”
Reference:
Alyson M. Thibodeau, Leonardo López Luján, David J. Killick, Frances F. Berdan, Joaquin Ruiz. Was Aztec and Mixtec turquoise mined in the American Southwest? Science Advances, 2018; 4 (6): eaas9370 DOI: 10.1126/sciadv.aas9370
Note: The above post is reprinted from materials provided by Dickinson College. Original written by Christine Baksi.
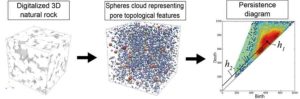
Figure: Left: This is a digitalized 3D natural rock, Center: Spheres cloud representing pore topological features, Right: Persistence diagram. Credit: International Institute for Carbon-Neutral Energy Research (I2CNER) / Institute of Mathematics for Industry (IMI), Kyushu University
Whether or not we realize it, mathematics permeates our lives in countless ways. Sometimes, the role of mathematics is difficult to grasp, but other times it’s rock solid.
Although the mineral grains that form a rock are important, it is the pores — the empty spaces between those grains — that often carry vital resources such as oil, gas, and drinking water. The geometry of pores can strongly affect the storage, flow, and extraction of those resources. Thus, improving understanding of pore geometry is of great interest to many researchers and industry professionals.
In a fusion of mathematics and earth science, researchers from the International Institute for Carbon-Neutral Energy Research (I2CNER) and the Institute of Mathematics for Industry (IMI) of Kyushu University have now developed an innovative method to characterize pore geometry, based on a concept called persistent homology theory, as reported in a study published in Water Resources Research.
An important difference between natural rocks and artificial media is that the physical characteristics of rock tend to be relatively heterogeneous. This state-of-the-art method is particularly useful for characterizing that heterogeneity in pores.
As study first author Fei Jiang explains, “In the proposed method, complex pore geometry is first transformed into sphere cloud data. Then, a persistence diagram is calculated from the point cloud. A new parameter, the distance index H as a metric, is derived from the persistence diagram, and is proposed to characterize the degree of rock heterogeneity.”
A strong relationship was confirmed between heterogeneity and the distance index H. In addition, a new empirical equation using this metric H is proposed to predict the effective elastic modulus of rocks.
“To test the newly proposed method based on the geometry of real rocks, four types of rock with different pore structures, including two carbonates and two sandstones, were investigated,” co-author Takeshi Tsuji explains. “Persistence diagram analysis was more effective for quantitatively estimating the heterogeneity of relatively homogeneous sandstone compared with the conventional method. This new method was also superior in terms of distinguishing the different rock types.”
Additional advantages of this method of analysis are that the persistence diagram is relatively stable with small changes in pore space, and the distance index H can be calculated very efficiently. Information extracted from persistence diagram analysis can be used to directly predict physical properties (such as permeability and elasticity) based on the microstructures of rocks. Thus, persistence diagram analysis may prove to be an important new tool for understanding the heterogeneity of pores in different rock types.
Reference:
Fei Jiang, Takeshi Tsuji, Tomoyuki Shirai. Pore Geometry Characterization by Persistent Homology Theory. Water Resources Research, 2018; DOI: 10.1029/2017WR021864
A wet-dry scenario in a prebiotic hot spring or tidal pool. A) shows the pool with the five kinds of alpha hydroxy acids used in this study. B) shows the drying pool where a “library” of polyesters, depicted as the inset high-resolution mass spectra) forms at the drying edges. This simple formation of polyesters could have played a role in scaffolding the origins of life. Credit: Kuhan Chandru
Research led by Kuhan Chandru and Jim Cleaves from the Earth-Life Science Institute at Tokyo Institute of Technology, Japan, has shown that reactions of alpha-hydroxy acids, similar to the alpha-amino acids that make up modern proteins, form large polymers easily under conditions presumed prevalent on early Earth. These alpha-hydroxy acid polymers may have aided in the formation of living systems on early Earth.
There are different theories for how life first formed on early Earth. One popular one suggests that life may have arisen in specialized environments, such as tidal pools or shallow water hot springs, where simple chemical reactions would have helped generate life’s precursors. All life is made up of polymers, large molecules made up of a sequence of molecules called monomers. A key question is how biological polymers could have formed without enzymes on early Earth.
While environments of early Earth might have had monomers that could give rise to life, it would have been difficult for polymers to arise from these without the help of enzymes. In this case, the team showed these polymers could have formed with alpha-hydroxy acids before the existence of enzymes on early Earth.
This multi-national team showed that hydroxy acids polymerize more easily than amino acids, and that they could have provided the necessary toolkit to kick-start the formation of more complex molecules for the origin of life on Earth.
To simulate various primitive environments, the team reacted alpha hydroxy acids under varied conditions of pH and temperature, from room temperature to boiling hot. Using sophisticated high-resolution mass spectrometry and data analysis software, they showed that these polymers can form over a range of conditions.
The team showed further, that using a mixture of different types of alpha-hydroxy acid that they could form huge numbers of types of polymers, in effect creating vast ‘libraries’ of different chemical structures, which can remain stable over a range of environmental conditions. The work culminated with the creation of a polyester library made up of five kinds of alpha hydroxy acids. They showed that this simple-to-create library could contain hundreds of trillions of distinct polymer sequences.
This research opens new areas of exploration of the chemistry that may have led to the formation of life. The authors are keen to extend this work by investigating the types of functions of alpha-hydroxy acid polymers might be able to carry out, and other types of simple chemicals that could interact with these, possibly leading to self-replicating chemical systems.
Reference:
Kuhan Chandru, Nicholas Guttenberg, Chaitanya Giri, Yayoi Hongo, Christopher Butch, Irena Mamajanov, H. James Cleaves. Simple prebiotic synthesis of high diversity dynamic combinatorial polyester libraries. Communications Chemistry, 2018; 1 (1) DOI: 10.1038/s42004-018-0031-1
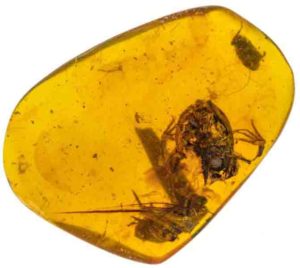
The best-preserved fossil of the group includes the skull, forelimbs, part of a backbone and a partial hind limb of a small, juvenile frog now known as Electrorana limoae. Next to its hindlimb is an unidentified beetle. Credit: Lida Xing/China University of Geosciences
About 99 million years ago, a tiny juvenile frog in present-day Myanmar was suddenly trapped in sap with a beetle, perhaps its intended next meal.
Unlucky for the frog, but lucky for science.
An extinct species now named Electrorana limoae, it’s one of four fossils that provide the earliest direct evidence of frogs living in wet, tropical forests and are the oldest-known examples of frogs preserved in amber.
“It’s almost unheard of to get a fossil frog from this time period that is small, has preservation of small bones and is mostly three-dimensional. This is pretty special,” said David Blackburn, study co-author and the associate curator of herpetology at the Florida Museum of Natural History. “But what’s most exciting about this animal is its context. These frogs were part of a tropical ecosystem that, in some ways, might not have been that different to what we find today — minus the dinosaurs.”
The findings and species description were published today in Nature’s Scientific Reports.
Frogs have been around for at least 200 million years, but glimpsing their early heyday is tough. Often small and lightly built, frogs don’t tend to preserve well. The frog fossil record skews toward more robust species from arid, seasonal environments, although the bulk of frog diversity today lives in tropical forests.
“Ask any kid what lives in a rainforest, and frogs are on the list,” Blackburn said. “But surprisingly, we have almost nothing from the fossil record to say that’s a longstanding association.”
The amber deposits of northern Myanmar in Southeast Asia provide a unique record of ancient forest ecosystems, with fossil evidence of mosses, bamboo-like plants, aquatic spiders and velvet worms. The discovery of Electrorana and the other fossils, the first frogs to be recovered from these deposits, help add to our understanding of frogs in the Cretaceous period, showing they have inhabited wet, tropical forests for at least 99 million years.
Frogs in amber are quite rare, with previous examples found in the Dominican Republic and Mexico and dating back only about 40 million and 25 million years, respectively.
Less than an inch long, Electrorana is the most well-preserved of the group. Clearly visible in the amber are the frog’s skull, its forelimbs, part of its backbone, a partial hind limb and the unidentified beetle. The other amber fossils contain two hands and an imprint of a frog that likely decayed inside the resin.
But Electrorana raises more questions than it answers, Blackburn said.
Many characteristics herpetologists use to discern details of a frog’s life history and determine how it’s related to other frogs — wrist bones, the pelvis, hip bones, the inner ear, the top of the backbone — are either missing or were not yet fully developed in the juvenile frog.
The existing bones provide clues about Electrorana’s possible living relatives, Blackburn said, but the results are puzzling: Species that have similar features include fire-bellied toads and midwife toads — Eurasian species that live in temperate, not tropical, ecosystems.
Gathering CT skeletal data for both living and extinct frogs, one of Blackburn’s long-term projects, could help illuminate ancient evolutionary relationships, possibly clarifying how Electrorana fits into the frog tree of life.
In the meantime, Blackburn nurtures the hope that other frogs in amber will be discovered, making Electrorana more than a one-hit wonder.
“We don’t have a lot of single-species frog communities in forests. It seems extremely unlikely that there’s only one. There could be a lot more fossils coming.”
Reference:
Lida Xing, Edward L. Stanley, Ming Bai, David C. Blackburn. The earliest direct evidence of frogs in wet tropical forests from Cretaceous Burmese amber. Scientific Reports, 2018; 8 (1) DOI: 10.1038/s41598-018-26848-w
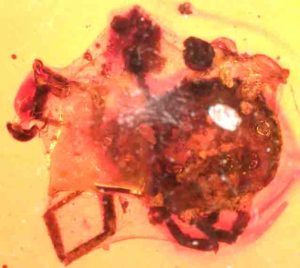
This silk-wrapped tick subsequently was entombed in amber that may have dripped from a nearby tree. Its fate, literally, was sealed. Credit: University of Kansas
One day in Myanmar during the Cretaceous period, a tick managed to ensnare itself in a spider web. Realizing its predicament, the tick struggled to get free. But the spider that built the web was having none of it. The spider popped over to the doomed tick and quickly wrapped it up in silk, immobilizing it for eternity.
We know the outline of this primordial worst-day-ever because the silk-wrapped tick subsequently was entombed in amber that may have dripped from a nearby tree. Its fate, literally, was sealed.
Fast-forward 100 million years or so, and that same tick was discovered by a German collector named Patrick Müller who was searching in Myanmar for Burmese amber pieces of scientific value. He passed the discovery on to scientist Jason Dunlop in at the Museum für Naturkunde in Berlin, who realized it was an important specimen.
“Dunlop brought in Lidia Chitimia-Dobler, who is a tick expert at the Bundeswehr Institute of Microbiology, and myself because we’ve worked together on Burmese amber things,” said Paul Selden, distinguished professor of geology at the University of Kansas and director of the Paleontological Institute at the KU Biodiversity Institute and Natural History Museum.
Together with microscopy expert Timo Pfeffer, the team has just published a description of the tick in the journal Cretaceous Research.
“It’s a show of behavior, really,” said Selden. “Ticks already are known from the Burmese amber — but it’s unusual to find one wrapped in spider silk. We’re not sure if the spider wrapped it in order to eat it later or if it was to get it out of the way and stop it from wriggling and destroying its web. That’s something spiders do.”
Selden said ticks are seldom found in Burmese amber, though the few that have been discovered were proved to be among the oldest tick specimens known to science.
“They’re rare because ticks don’t crawl around on tree trunks,” he said. “Amber is tree resin, so it tends to capture things that crawl around on bark or the base of the tree. But ticks tend to be on long grass or bushes, waiting for passing animals to brush up against them, though some of them can be on birds or squirrels, or maybe a little crawling dinosaur.”
The researchers took pains to ensure the ancient tick was indeed bound in spider silk, rather than fungal filaments that sometimes can grow around a dead tick.
“We think this was spider silk because of the angles that the threads make,” Selden said. “Also, in the paper, we show a picture of a tick that started to decay — and the fungus on that tick grows from its orifices — from the inside to the outside. Whereas these threads are wrapped around externally and not concentrated at the orifices.”
According to the research team, this is the first time this kind of interaction between ticks and spiders has been documented in the fossil record. Even though ticks aren’t a typical staple of spider diets, spiders can occasionally prey on ticks in modern ecosystems.
“Just last year, I was on a field trip in Estonia and took a photo of a Steatoda spider wrapping up a red spider mite,” said Selden. “That was serendipitous.”
The KU researcher and his colleagues are unable to determine the species of spider that wrapped the tick because families of spiders known to catch ticks today lack a convincing Mesozoic fossil record. While it’s difficult to identify the producer of the fossil silk with any certainty, it’s safe to assume the spider’s behavior was characteristic of most known spiders in the forest today.
“We don’t know what kind of spider this was,” Selden said. “A spider’s web is stretched between twigs to catch prey that flies or bumps or crawls into it. As prey gets stuck, it adheres to the web and starts to struggle. Maybe some things can escape after some struggle, so the spider rushes to it out from hiding and wraps it in swaths of silk to immobilize it, to stop it escaping or destroying the web. This prevents prey from hitting back — stinging or biting — once it’s wrapped in silk it can’t move, and then the spider can bite it and inject gastric fluid to eat it or venom to subdue it as well.”
The amber that preserved the small drama occurring between the spider and tick from 100 million years ago offers a thought-provoking peek into the natural past, according to Selden.
“It’s really just an interesting little story — a piece of frozen behavior and an interaction between two organisms,” he said. “Rather than being the oldest thing or the biggest thing, it’s nice to be able to preserve some animal interaction and show it was a living ecosystem.”
Reference:
Jason A. Dunlop, Paul A. Selden, Timo Pfeffer, Lidia Chitimia-Dobler. A Burmese amber tick wrapped in spider silk. Cretaceous Research, 2018; 90: 136 DOI: 10.1016/j.cretres.2018.04.013
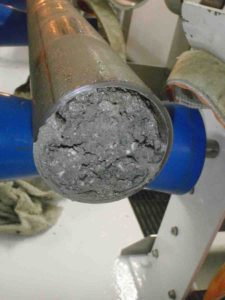
Sediment core with gas hydrate, drilled by the research vessel ‘Chikyu’. Credit: JAMSTEC
In the seabed, there are numerous microorganisms that play an important role in the global carbon cycle. Up to now, however, it has not been understood to what extent geodynamic processes such as the subduction of oceanic plates influence this microbial activity and, in turn, impact the carbon balance. A study, carried out by an international team of researchers including scientists from the GFZ German Research Centre for Geosciences, now provides new evidence. They drilled down to a depth of 200 meters into an underwater mud volcano. Based on the recovered samples they found that the microorganisms in the sediment are extremely active and form about 90 percent of the methane released from that depth. Apparently, the role of mud volcanoes in the global methane cycle has been significantly underestimated, the authors now conclude.
Underwater mud volcanoes are located at active plate margins, where oceanic crust is moving under the continental crust – a process called subduction. Where the seafloor is pushed under the continent, the upper sediment layer gets shaved off at the foot of the continent and is then compressed by trailing sediment. In this sediment package, the so-called accretionary wedge, liquids as well as materials with a lower density are forced upwards from deeper layers. Thus, mud volcanoes form on the surface of the seabed comprising thin sediment as well as water and gases instead of lava.
The researchers examined such a volcano, located in the Nankai trough beside Japan, with the help of the Japanese drilling ship “Chikyu”. As the team of researchers led by Akira Ijiri from the Research Center JAMSTEC writes, the “mountain” KMV # 5 rises to between 112 and 160 meters above the surrounding ocean floor; in this region alone there are a further 13 mud volcanoes at the bottom of the Pacific. In the samples, recovered from the sediment down to a depth of 200 meters deep, the researchers discovered, among other things, bright fragments of gas hydrate, i.e. a methane-water compound which under certain temperature-pressure conditions is neither liquid nor gaseous, but solid. Extensive analysis of the chemical composition, the isotope ratio as well as of the biomarkers was carried out. GFZ researcher Jens Kallmeyer and his former doctoral student Rishi Ram Adhikari measured the enzyme activity of hydrogenase. The application of this method allows for the direct demonstration that hydrogen was used for metabolic reactions which eventually yield methane.
The results show that 90 percent of the methane was produced by microorganisms, only a small part was formed at great depth through chemical processes alone. Obviously, the microbes are fed by fluids pressed through the powerful sediments after subduction. “If these mud volcanoes are not completely unique in the world, and there’s no indication at all for this, then the role of mud volcanoes in the global methane cycle has been massively underestimated,” says Kallmeyer. “Furthermore, the study shows that indicators for the formation processes of methane – biological or chemical to date – do not work in the investigated mud volcano. If this applies to others, then the global models on the origin of atmospheric methane need to be rethought.”
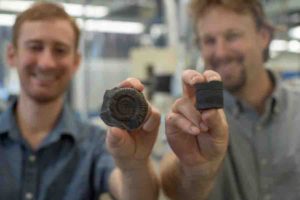
Postdoctoral Fellow Theodore Them (left, holding an extinct fossil sample) and Assistant Professor Jeremy Owens (right, holding a rock core sample). The researchers used the samples to study the global record of oxygenation. Credit: Stephen Bilenky
Global climate change, fueled by skyrocketing levels of atmospheric carbon dioxide, is siphoning oxygen from today’s oceans at an alarming pace — so fast that scientists aren’t entirely sure how the planet will respond.
Their only hint? Look to the past.
In a study to be published this week in the journal Proceedings of the National Academy of Sciences, researchers from Florida State University did just that — and what they found brings into stark relief the disastrous effects a deoxygenated ocean could have on marine life.
Millions of years ago, scientists discovered, powerful volcanoes pumped Earth’s atmosphere full of carbon dioxide, draining the oceans of oxygen and driving a mass extinction of marine organisms.
“We want to understand how volcanism, which can be related to modern anthropogenic carbon dioxide release, manifests itself in ocean chemistry and extinction events,” said study co-author Jeremy Owens, an assistant professor in FSU’s Department of Earth, Ocean and Atmospheric Science. “Could this be a precursor to what we’re seeing today with oxygen loss in our oceans? Will we experience something as catastrophic as this mass extinction event?”
For this study, an international team of scientists set out to better understand today’s oxygen-deprived oceans by investigating the Toarcian Oceanic Anoxic Event (T-OAE), an interval of global oceanic deoxygenation characterized by a mass extinction of marine organisms that occurred in the Early Jurassic Period.
“We wanted to reconstruct Early Jurassic ocean oxygen levels to better understand the mass extinction and the T-OAE,” said Theodore Them, a postdoctoral researcher at FSU who led the study. “We used to think of ocean temperature and acidification as a one-two punch, but more recently we’ve learned this third variable, oxygen change, is equally important.”
By analyzing the thallium isotope composition of ancient rocks from North America and Europe, the team found that ocean oxygen began to deplete well before the defined time interval traditionally ascribed to the T-OAE.
That initial deoxygenation, researchers say, was precipitated by massive episodes of volcanic activity — a process not altogether unlike the industrial emission of carbon dioxide we’re familiar with today.
“Over the past 50 years, we’ve seen that a significant amount of oxygen has been lost from our modern oceans,” Them said. “While the timescales are different, past volcanism and carbon dioxide increases could very well be an analog for present events.”
When the atmosphere is suffused with carbon dioxide, global temperatures climb, triggering a cascade of hydrological, biological and chemical events that conspire to sap the oceans of oxygen.
Scientists have found evidence that several hundred thousand years before the T-OAE, volcanoes flooded Earth’s atmosphere with carbon dioxide, helping to set in motion the sequence of events that would ultimately result in oceanic deoxygenation and widespread marine life extinction.
While researchers have long surmised a link between volcanism, loss of oxygen and mass extinction, this study provides the first conclusive data.
“As a community, we’ve suggested that sediments deposited during the T-OAE were indicative of widespread oxygen loss in the oceans, but we’ve never had the data until now,” Them said.
Prehistorical examples of carbon dioxide deluges and suffocating oceanic deoxygenation provide a lesson in how Earth systems respond to a variable climate.
This analysis of the T-OAE, and the onset of deoxygenation that preceded it, is another in a lineage of reports that presage a bleak future for oceans with diminishing levels of oxygen.
“It’s extremely important to study these past events,” Them said. “It seems that no matter what event we observe in Earth’s history, when we see carbon dioxide concentrations increasing rapidly, the result tends to be very similar: a major or mass extinction event. This is another situation where we can unequivocally link widespread oceanic deoxygenation to a mass extinction.”
Steps can still be taken to curb oxygen loss in the modern oceans. For example, conserving important wetlands and estuaries — along with other environments that absorb and store large amounts of carbon dioxide — could help to blunt the effects of harmful industrial emissions.
But should our oceans’ oxygen contents continue to decline at their current rates, future marine organisms could be doomed to the same fate that befell their Jurassic ancestors.
“If you’re an oxygen-consuming organism, you don’t want to see major changes in marine oxygen levels,” Them said. “You either adapt or go extinct.”
Measurements for this study were conducted at the FSU-based National High Magnetic Field Laboratory. The research was funded by the National Science Foundation and the National Aeronautic and Space Administration.
Reference:
Theodore R. Them, Benjamin C. Gill, Andrew H. Caruthers, Angela M. Gerhardt, Darren R. Gröcke, Timothy W. Lyons, Selva M. Marroquín, Sune G. Nielsen, João P. Trabucho Alexandre, Jeremy D. Owens. Thallium isotopes reveal protracted anoxia during the Toarcian (Early Jurassic) associated with volcanism, carbon burial, and mass extinction. Proceedings of the National Academy of Sciences, 2018; 201803478 DOI: 10.1073/pnas.1803478115
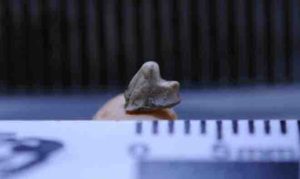
Brasilestes stardusti existed more than 70 million years ago in what is now São Paulo State. Its description, based on a fossilized tooth, has been published in Royal Society Open Science Credit: Mariela Castro
Brasilestes stardusti is the name given to the oldest known mammal found in Brazil. It lived in what is now the northwest of São Paulo State at the end of the Mesozoic Era between 87 million and 70 million years ago. It is the only Brazilian mammal known to have coexisted with the dinosaurs.
The discovery of Brasilestes was announced on May 30, 2018, by a team led by Max Langer, a professor at the University of São Paulo’s Ribeirão Preto School of Philosophy, Science & Letters (FFCLRP-USP). Langer’s team included colleagues at the Federal University of Goiás and the University of Campinas in Brazil, La Plata Museum in Argentina, and the Massachusetts Institute of Technology (MIT) in the US.
Physically speaking, Brasilestes consists of a fossilized premolar tooth with a maximum crown length of 3.5 mm. “The tooth is small and incomplete: the roots are missing,” said paleontologist Mariela Cordeiro de Castro, first author of the paper recently published in Royal Society Open Science.
“Small but not tiny,” Castro continued. “Although it’s only 3.5 mm, the Brasilestes tooth is three times bigger than all known Mesozoic mammal teeth. In the age of the dinosaurs, most mammals were the size of mice. Brasilestes was far larger, about the size of an opossum.”
The name of the new species pays tribute to British rock star David Bowie, who died in January 2016, a month after the fossil was found. Brasilestes stardusti alludes to Ziggy Stardust, an extraterrestrial character created by Bowie for a 1972 album.
The research was supported by the São Paulo Research Foundation—FAPESP as part of the thematic project “The origin and rise of dinosaurs in Gondwana (late Triassic-early Jurassic),” for which Langer is principal investigator.
The fossilized tooth was found in a rocky outcrop of the Adamantina Formation in General Salgado, São Paulo State. The rocks are in a field on a ranch called Fazenda Buriti.
“We were visiting Mesozoic outcrops when Júlio Marsola [another member of the team], keen-sighted as a lynx, spotted a small tooth sticking up out of a rock,” said Castro, a professor at the Federal University of Goiás (UFG).
“The General Salgado deposits are well-known. Several Mesozoic crocodiles have come from them. The particular outcrop where I found Brasilestes is interesting, with dozens of fragments of Mesozoic crocodile eggshells. I bent down to look more closely at a small part of the outcrop to see if there were any eggshells and spotted the tooth. If it had stayed out in the open like that for a few more days, the rain would have swept it away.
“When I noticed what appeared to resemble the base of the tooth’s two roots [the roots themselves have broken off], I thought it must be a mammal. Laboratory analysis gave us the certainty that it is indeed from a mammal.”
A placental mammal in the Botucatu Desert
While a mere 3.5 mm tooth, especially an incomplete one, may seem insufficient to describe a new species of mammal, in actual, fact extinct mammals are frequently described on the basis of a single fossilized tooth.
This is because teeth are the most durable part of the mammalian skeleton. After all, they have to withstand the wear and tear of chewing for an entire lifetime. In contrast, many fish species and reptiles, for example, grow new teeth continually throughout their lives. Indeed, mammalian teeth are often the only skeletal remains that stay intact long enough to become fossilized.
The fact that a single premolar is all that is left of Brasilestes and that it is incomplete prevented the researchers from distinguishing with absolute confidence the group of mammals to which the species belonged. They know the tooth belonged to a therian, a member of a large subclass of Mammalia that includes marsupials and placentals.
Although there is not enough evidence to support the inclusion of Brasilestes in either infraclass, the researchers believe (but cannot categorically conclude) it was a placental mammal. If so, the fossil is unique.
Today, there are three major groups of mammals, namely, placentals, marsupials and monotremes. All three evolved during the Mesozoic Era. At that time, however, they were by no means the only groups of mammals. There were also multituberculates, which were common in the northern hemisphere, as well as groups typical of the southern hemisphere such as meridiolestids and gondwanatherians—named for Gondwana, the ancient southern supercontinent that gave rise to Africa, South America, Australia, Antarctica, and India.
The first Mesozoic mammal fossils were found in Argentinian Patagonia in the early 1980s, and some 30 species are now known. Until the Brasilestes announcement, these were the only ones found in South America. None remotely resembles the little tooth found in Brazil.
“When I showed the Brasilestes fossil to Edgardo Ortiz-Jaureguizar, a paleontologist at La Plata Museum, he was very surprised. He said he’d never seen anything like it, and at once showed it to another specialist at the same institution, Francisco Goin, who had the same reaction. Goin said Brasilestes resembled no other Mesozoic mammal found in Argentina, hence in South America,” Castro recalled.
Among the 30-odd Argentinian species of Mesozoic mammals, there are meridiolestids, gondwanatherians, and even a few suspected multituberculates. There are no marsupials or placentals. The only fossils in these two groups found in South America date from after the mass extinction that wiped out the dinosaurs 66 million years ago in an event that marks the end of the Mesozoic and the onset of the current geological era, the Cenozoic.
Until the discovery of Brasilestes, the only traces of Mesozoic mammals in Brazil were hundreds of tracks and footprints left by unknown creatures 130 million years ago as they traversed the dunes of the Botucatu Desert in what is now São Paulo State. The solidified surface of those dunes has been preserved as sandstone slabs on which the footprints can be seen.
In 1993, Reinaldo José Bertini , a professor at São Paulo State University (UNESP) in Rio Claro, announced the discovery of a mammalian jawbone fragment with a single tooth far smaller than the Brasilestes premolar. However, Bertini did not publish a detailed study of the fossil and therefore could not name a new species.
“Brasilestes is not just the first Brazilian Mesozoic mammal to be described but also one of the few Mesozoic mammals found in more central regions of South America. The Argentinian fossils were found in geological formations in Patagonia, the southern tip of the continent,” Langer said.
“Furthermore, Brasilestes is different from everything found before, suggesting that possibly placental mammals inhabited South America between 87.8 million and 70 million years ago,” said the FAPESP thematic project coordinator.
New species possibly related to a mammal from India
Even more surprisingly, the Mesozoic mammal with premolars that most resemble the Brasilestes tooth lived on the other side of the world, in India, between 70 million and 66 million years ago. Its name is Deccanolestes. No other creature in the global fossil record is so similar to Brasilestes.
How could two members of the same lineage have lived so far apart in unconnected regions? Approximately 100 million years ago, when South America and Africa had only just been separated by the opening of the South Atlantic, India was breaking away from Gondwana and starting to wander through the Indian Ocean.
This implies that at least 100 million years ago, the ancestors of Brasilestes and Deccanolestes populated the Gondwana supercontinent. In other words, the lineage to which Brasilestes and Deccanolestes belong is far older than the ages of their fossils—between 87 million and 70 million years ago for Brasilestes, and between 70 million and 66 million for Deccanolestes.
“The discovery of Brasilestes raises many more questions than answers about the biogeography of South American Mesozoic mammals,” Langer said. “Thanks to Brasilestes, we’ve realized that the history of Gondwana’s mammals is more complex than we thought.”
Finding triggers speculation on xenarthrans’ origins
This could give rise to new hypotheses and new lines of investigation. Who knows, for example, whether future research inspired by the discovery of Brasilestes will reveal the origin of a typical South American group, the xenarthrans, the order of armadillos, anteaters and sloths? Castro’s main research interest, in fact, is the evolutionary history of the xenarthrans.
“An interesting feature of the Brasilestes premolar is its superthin enamel, which is only 20 micrometers thick. The Brasilestes enamel is the thinnest of any Cretaceous mammal in the fossil record. Most Mesozoic mammals have enamel in the range of 100 to 300 micrometers,” Castro said.
“Tens of known species of xenarthrans are alive now. Hundreds are extinct. Only three have enamel. The microstructure of Brasilestes’ premolar enamel is very similar to that of the nine-banded armadillo,” said the FAPESP-supported researcher.
According to Castro, “molecular clock evidence suggests the xenarthran lineage started at least 85 million years ago. However, the oldest armadillo fossils, found in Rio de Janeiro, are about 50 million years old”.
While it is intriguing to imagine Brasilestes as an ancient xenarthran, it is far too soon for any such affirmation.
“The age and provenance of Brasilestes do match molecular hypotheses for the origin of the xenarthrans, but it would be premature to infer taxonomic affinity in light of the morphological differences between the Brasilestes tooth and armadillo teeth,” Castro said.
Langer agreed. “We have only one Brasilestes fossil. That’s nowhere near enough to extract conclusions from the fossil record,” he said.
The fact that no Mesozoic mammal fossils were found in Brazil before Brasilestes could mean such fossils are rare or too fragile to be preserved. “Who knows, one day we may find new Brasilestes fossils that help us understand its history better. It could take decades,” Langer said.
Reference:
Mariela C. Castro et al, A Late Cretaceous mammal from Brazil and the first radioisotopic age for the Bauru Group, Royal Society Open Science (2018). DOI: 10.1098/rsos.180482
Note: The above post is reprinted from materials provided by FAPESP.
Since 2007, the Collaboratory for the Study of Earthquake Predictability or CSEP has been studying earthquake forecast models to find out how well each model stacks up against its competitors, and how well each forecast predicts later seismic activity.
At four centers in California, New Zealand, Europe and Japan—and in countless labs across the globe—CSEP’s experiments and its rigorous testing procedures have shed light on the predictability of earthquakes, according to a special focus section published June 13 in Seismological Research Letters.
“The fundamental idea of CSEP is simple in principle but complex in practice: forecasting models should be tested against future observations to assess their performance, thereby ensuring an unbiased test of the forecasting power of a model,” said Danijel Schorlemmer of GFZ Potsdam in Germany, who wrote about CSEP’s achievements for the journal.
At each of its four testing centers (development of a fifth center in China is underway), earthquake forecasts generated automatically from a set of models are compared with the region’s observed seismicity. The CSEP experiments are governed by strict rules that include a precise description of the region under study and the high quality of the seismic recordings, among other criteria. The experiments test how well the number, the distribution and the magnitudes of observed earthquakes in a region match up with a forecast’s predictions.
In Italy, for example, there are three CSEP experiments underway to evaluate one-day, three-month and five year earthquake forecasts for the country. As Matteo Taroni and colleagues write in the focus section, the one-day forecasts have proved useful enough for the models to be incorporated into Italy’s Department of Civil Protection’s seismic forecasts.
CSEP center experiments conducted from 2008 to 2017, a time period that included major earthquakes such as the 2011 magnitude 6.2 Christchurch quake and the 2016 magnitude 7.8 Kaikoura earthquake, provided data used to refine real-time community warnings during these major earthquakes, according to David Rhoades of GNS Science and colleagues.
With some caveats, the lessons learned from CSEP experiments can be used to evaluate “classic” forecasts with an eye to making future forecasts more testable. In his focus paper, UCLA emeritus David D. Jackson applied CSEP tests to the 1988 30-year forecast developed by the Working Group on California Earthquake Probabilities for 16 areas of the San Andreas, Hayward, San Jacinto and Imperial faults. He concluded that only one quake, the magnitude 6 Parkfield earthquake in 2004, is associated with the 1988 forecast.
Researchers have also used CSEP to test candidate seismicity models to use in forecasting. One example comes from a focus paper by Camilla Cattania of Stanford University and colleagues, who looked at how the widely-known earthquake triggering mechanism called the static Coulomb stress hypothesis, which suggests stress changes in deformed geological material can move through faults to promote new tremors, can be used in forecasting. Their analysis, applied to the 2010-2012 Canterbury earthquake sequence in New Zealand, suggests physics-based models such as the Coulomb model are more promising for forecasting than previously thought, especially in combination with other statistical models.
The future of CSEP will include more types of earthquake modeling, including combination models, 3-D models and more physics-based modeling, along with expanded use of seismic datasets from Asia and South America, said Schorlemmer.
More information: “Preface to the Focus Section on the Collaboratory for the Study of Earthquake Predictability (CSEP): New Results and Future Directions,” Seismological Research Letters (2018).
“The Collaboratory for the Study of Earthquake Predictability: Achievements and Priorities,” Seismological Research Letters (2018).
“Prospective CSEP evaluation of 1-day, 3-month, and 5-year earthquake forecasts for Italy,” Seismological Research Letters (2018).
“Highlights from the first ten years of the New Zealand Earthquake Forecast Testing Center,” Seismological Research Letters (2018).
“The forecasting skill of physics-based seismicity models during the 2010-2012 Canterbury, New Zealand, earthquake sequence,” Seismological Research Letters (2018).
“Ranking some global forecasts with the Kagan information score,” Seismological Research Letters (2018).
“Exploring magnitude forecasting of the next earthquake,” Seismological Research Letters (2018).
“Ensemble smoothed seismicity models for the new Italian probabilistic seismic hazard map,” Seismological Research Letters (2018).
“Prospective evaluation of global earthquake forecast models: Two years of observations support merging smoothed seismicity with geodetic strain rates,” Seismological Research Letters (2018).
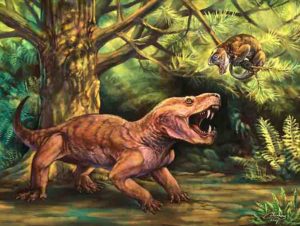
The therocephalian Gorynychus masyutinae, top predator of the Kotelnich fossil assemblage, hunting a tree-dwelling herbivore (Suminia getmanovi). Art by Matt Celeskey.
Fossils representing two new species of saber-toothed prehistoric predators have been described by researchers from the North Carolina Museum of Natural Sciences (Raleigh, USA) and the Vyatka Paleontological Museum (Kirov, Russia). These new species improve the scientists’ understanding of an important interval in the early evolution of mammals — a time, between mass extinctions, when the roles of certain carnivores changed drastically.
Living mammals are descended from a group of animals called therapsids, a diverse assemblage of “protomammals” that dominated terrestrial ecosystems in the Permian Period (~299-252 million years ago), millions of years before the earliest dinosaurs. These protomammals included tusked herbivores, burrowing insectivores, and saber-toothed predators. The vast majority of Permian therapsids have been found in the Karoo Basin of South Africa, and as a result, the South African record has played an outsized role influencing scientists’ understanding of protomammal evolution. Because of this, therapsid fossils from outside of South Africa are extremely important, allowing scientists to discern whether observed events in the protomammal fossil record represent global or merely regional patterns.
Recent expeditions by the Vyatka Paleontological Museum have collected a wealth of spectacularly-preserved Permian fossils near the town of Kotelnich along the Vyatka River in European Russia. These fossil discoveries include the remains of two previously unknown species of predatory protomammals, newly described in the journal PeerJ by Christian Kammerer of the North Carolina Museum of Natural Sciences and Vladimir Masyutin of the Vyatka Paleontological Museum. The first of the two new species, Gorynychus masyutinae, was a wolf-sized carnivore representing the largest predator in the Kotelnich fauna. The second new species, Nochnitsa geminidens, was a smaller, long-snouted carnivore with needle-like teeth. Gorynychus belongs to a subgroup of protomammals called therocephalians (“beast heads”), whereas Nochnitsa belongs to a different subgroup called gorgonopsians (“gorgon faces”).
Both new species are named after legendary monsters from Russian folklore, befitting their menacing appearances. Gorynychus is named after Zmey Gorynych, a three-headed dragon, and Nochnitsa is named after a malevolent nocturnal spirit. (Based on their relatively large eye sockets, it is likely that Nochnitsa and its relatives were nocturnal.)
Gorynychus and Nochnitsa improve scientists’ understanding of ecosystem reorganization after the mid-Permian extinction (260 mya). Although not as well-known as the more devastating end-Permian mass extinction (252 mya, which nearly wiped out protomammals), the mid-Permian mass extinction also played a major role in shaping the course of protomammal evolution. In typical late Permian ecosystems, the top predators were giant (tiger-sized), saber-toothed gorgonopsians and therocephalians were generally small insectivores. In mid-Permian ecosystems, by contrast, these roles are reversed. At Kotelnich, the saber-toothed top predator Gorynychus is a therocephalian and the only gorgonopsians are much smaller animals.
“In between these extinctions, there was a complete flip-flop in what roles these carnivores were playing in their ecosystems — as if bears suddenly became weasel-sized and weasels became bear-sized in their place,” says Kammerer. The new species from Russia provide the first evidence that there was a worldwide turnover in predators after the mid-Permian extinction, and not just a localized turnover in South Africa.
Kammerer adds, “Kotelnich is one of the most important localities worldwide for finding therapsid fossils — not only because they are amazingly complete and well-preserved there, but also because they provide an all-too-rare window into mammal ancestry in the Northern Hemisphere during the Permian.”
Reference:
Christian F. Kammerer, Vladimir Masyutin. A new therocephalian (Gorynychus masyutinae gen. et sp. nov.) from the Permian Kotelnich locality, Kirov Region, Russia. PeerJ, 2018; 6: e4933 DOI: 10.7717/peerj.4933
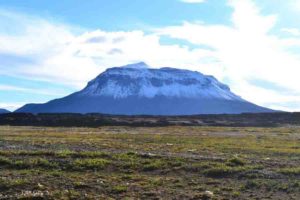
Researchers expect the volcanoes in Mars’ Sisyphi Planum region to look similar to subglacial volcanoes on earth, such as Herðubreið in Iceland. Credit: Purdue University photo/Sheridan Ackiss
The climate throughout Mars’ early history has long been debated — was the Red Planet warm and wet, or cold and icy? New research published in Icarus provides evidence for the latter.
Mars is littered with valley networks, deltas and lake deposits, meaning it must have had freely flowing water at some point, probably around 4 billion years ago. But climate models of the planet’s deep past haven’t been able to produce warm enough conditions to allow liquid water on the surface.
“There are people trying to model Mars’ ancient climate using the same kind of models we use here on Earth, and they’re having a really hard time doing it. It’s difficult to create a warm ancient Mars because the sun was a lot fainter then. The whole solar system was cooler,” said Briony Horgan, an assistant professor of earth, atmospheric and planetary sciences at Purdue University. “While a lot of people are using climate models, we’re coming at this from a unique perspective — what does the volcanic record of Mars tell us?”
Volcanism was abundant throughout Mars’ early history. There are large, broad volcanoes on some of the planet’s widely studied regions, but less is known about a region of low and smooth topography in the southern highlands known as Sisyphi Planum. Here, there are more than 100 flat-topped mounds known as the Sisyphi Montes, which could be volcanic in origin.
When volcanoes erupt beneath ice sheets and glaciers on Earth, the combination of heat and melt water create flat-topped, steep-sided mountains called “tuyas,” or table mountains. When subglacial eruptions don’t breach the surface of the ice, the tops of the volcanoes remain cone-shaped instead of becoming flat. The minerology produced during these events is unique due to the interaction between hot lava and cold glacial meltwater.
Sheridan Ackiss, a Ph.D. candidate at Purdue and lead author of the paper, used images from NASA’s Compact Reconnaissance Imaging Spectrometers for Mars (CRISM) to find out if the mineral makeup of the region was consistent with subglacial volcanism.
CRISM detects both the visible range and shorter wavelengths of light, which helps the instrument’s operators identify a broad range of minerals on the Martian surface. At visible wavelengths, the way light is reflected is strongly influenced by iron, whereas at infrared wavelengths, CRISM can pick up features from carbonate, sulfate, hydroxyl and water incorporated in mineral crystals.
“Each rock has a specific fingerprint, and you can identify that with reflections of light,” Ackiss said.
The findings identify three distinct mineral combinations in the region, dominated by gypsum, polyhydrated sulfates and a smectite-zeolite-iron oxide mixture — all of which have been associated with volcanoes in glacial environments.
“We now have two sets of data, minerals and morphology, that say there had to have been ice on Mars at some point in time,” said Ackiss. “And it was probably relatively late in Mars’ history.”
Ackiss’ team hopes their findings can be used as a reference point for other regions on Mars with a volcanic history. If researchers could find evidence for volcanic activity under ice sheets elsewhere, it would solidify the case for a very cold ancient Mars. But fear not, space enthusiasts, this doesn’t eliminate the possibility of past life on Mars.
“Even if Mars was a cold and icy wasteland, these volcanic eruptions interacting with ice sheets could have created a little happy place for microbes to exist,” Horgan said. “This is the kind of place you’d want to go to understand how life would’ve survived on Mars during that time.”
Reference:
S. Ackiss, B. Horgan, F. Seelos, W. Farrand, J. Wray. Mineralogic evidence for subglacial volcanism in the Sisyphi Montes region of Mars. Icarus, 2018; 311: 357 DOI: 10.1016/j.icarus.2018.03.026
Note: The above post is reprinted from materials provided by Purdue University. Original written by Kayla Zacharias.
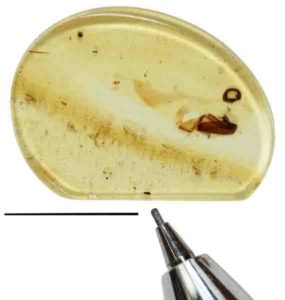
This is the amber sample with the new beetle trapped inside — the beetle is the tiny speck indicated by the tip of a mechanical pencil for scale. Credit: Shuhei Yamamoto, Field Museum
Featherwing beetles are smaller than the period at the end of this sentence. They get their name from the feathery fringe on their wings that enables them to catch the air and float like dandelion seeds. And, it turns out, they go way back — scientists discovered a 99-million-year-old featherwing beetle preserved in amber, and they named it “Jason.”
“This tiny beetle lived during the Cretaceous Period, it saw actual dinosaurs,” says Shuhei Yamamoto, a researcher at the Field Museum in Chicago and co-lead author of a paper describing the beetle in Cretaceous Research. “The amber the beetle was found in is like a time capsule.”
The new beetle, the earliest member of its family to get a scientific name, is called Kekveus jason. “Jason” is a reference to the Greek hero who sailed the world in search of the Golden Fleece; “Kekveus,” meanwhile, doesn’t mean anything — co-lead author Vasily Grebennikov of the Canadian Food Inspection Agency, picked it because new genus names for little-known fossils often wind up changing when the species is later reclassified as scientists learn more about it. “From my perspective I always believe that an animal name should not have any meaning (except when named after a person), since if the authors are wrong, it might be odd to have later species ‘chinensis’ endemic to Europe, or something similarly absurd,” says Grebennikov.
Yamamoto discovered the tiny sailing insect by poring over pieces of amber. Amber is made from fossilized resin, a sap-like substance produced by plants. When prehistoric insects got trapped in resin, their bodies would get incorporated into the amber that formed — think the mosquitos from Jurassic Park, minus the “resurrecting dinosaurs” part.
When Yamamoto spotted a tiny black speck in the amber, he was cautiously optimistic that he’d found a prehistoric insect. “I didn’t have much confidence at first, but after cutting and polishing the amber so I could get a better look, I realized, oh, this is truly an amazing fossil,” he says.
The beetle is only 0.536 millimeters long — it’s dwarfed by the tip of a mechanical pencil. But under a microscope, Yamamoto was able to glean details of its anatomy that revealed it as a different species and genus from living featherwing beetles. For instance, it has three grooves running like pinstripes up its body, a feature not found on its modern cousins. Overall, though, the researchers found that K. jason has a lot in common with featherwings alive today, meaning that the family of beetles evolved features like a tiny body size and fringed wings millions of years ago. According to Yamamoto, amber fossils yield a level of preservation rarely found in regular rock, especially for insects. “There are many rock fossils from the Jurassic and Cretaceous periods, but they’re limited to big animals like larger insects, mammals, dinosaurs, and birds, because small insects cannot be preserved in rock fossil very clearly. Only fossil insects in amber are preserved in fine detail, in three dimensions,” says Yamamoto. Yamamoto looks forward to further discoveries of prehistoric animals preserved in amber. “It’s likely that we’ll find more in the future — Burmese amber is one of the hottest fossils in the world,” he says. “There are so many great findings happening, literally day by day. Many important discoveries of insects will be made.”
Reference:
Shûhei Yamamoto, Vasily V. Grebennikov, Yui Takahashi. Kekveus jason gen. et sp. nov. from Cretaceous Burmese amber, the first extinct genus and the oldest named featherwing beetle (Coleoptera: Ptiliidae: Discheramocephalini). Cretaceous Research, 2018; DOI: 10.1016/j.cretres.2018.05.016
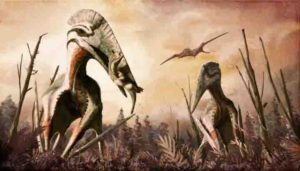
Restoration of the giant azhdarchid pterosaur Hatzegopteryx catching an unsuspecting dinosaur for supper. In addition to carnivory, azhdarchids have been hypothesized to have eaten fish, insects, fruits, hard-shelled organisms or a combination of them all. Credit: Mark P. Witton/CC BY 4.0
Whenever we think about extinct animals we often imagine them eating their favourite meals, whether it be plants, other animals or a combination of both.
But are our ideas about extinct diets grounded within scientific reasoning, or are they actually little more than conjecture and speculation?
New research, published in Biological Reviews and led by a team of palaeobiologists from the University of Leicester, has revealed that the diets of pterosaurs are largely based on ideas that have been uncritically accepted for decades, or even centuries — and may often be wrong.
The study shows that one group of extinct animals where our dietary knowledge is lacking are the pterosaurs; extinct flying reptiles who lived in the Mesozoic Period 215-66 million years ago.
The research involved a comprehensive analysis of the scientific literature, summarising over 300 statements from 126 studies about the diets of pterosaurs, and the types of evidence used to support ideas of what they ate.
The research shows the vast majority of ideas about pterosaur diet are based on inferences drawn from modern organisms and/or the environments in which pterosaur fossils are preserved. These are not always reliable.
Jordan Bestwick, a PhD student from the School of Geography, Geology and the Environment, and lead author of the study, said: “Working out the diets of extinct animals is vitally important for understanding how they fitted within their respective ecosystems, which can tell us about how present ecosystems function and may change in the future.
“Being able to robustly test ideas is a key attribute of the scientific process, and helps us fully understand what we can know about the lifestyles of extinct animals, and what we can never know.”
Analysis reveals that over sixty percent of all hypotheses of pterosaur diet are based on simplistic anatomical comparisons between pterosaurs and modern organisms, particularly of the skulls and teeth. A key problem with this is that many of these interpretations are difficult, if not impossible, to test.
Jordan explained: “The potential range of pterosaur diets has been reviewed in the past but little attention has been paid to the evidence, if any, that support dietary interpretations. We realised that not only was it important to discover what we know about pterosaur diets, but to also find out how we know what we know about pterosaur diets.
“We find for some pterosaurs there is strong agreement among researchers as to their likely diet. Pteranodontids for example, which include one of the best known pterosaurs, Pteranodon, are almost unanimously agreed to have been fish feeders, an idea that is independently supported by multiple lines of evidence.
“In contrast, there is far less agreement as to what the giant azhdarchid pterosaurs ate. Azhdarchids can reach sizes of up to 10 metres or more in wingspan, like Hatzegopteryx, and there have been at least six different diets argued for these pterosaurs.”
This is not to say there are no methods or techniques that yield reliable evidence for understanding diets in these extinct animals. Biomechanical analysis of how hard pterosaurs could bite, and flight modelling that predicts how pterosaurs may have foraged for food have proven useful for understanding what some pterosaurs may or may not have eaten.
However techniques like these are employed in a small minority of studies and as such, it is currently not possible to identify the biological reasons that might explain the range and diversity of pterosaurs diets.
Dr David Hone from the Queen Mary University of London, who was not involved in the study, commented: “This is an important summary of what we know (and what we don’t) about what these animals fed on. This gives pterosaur researchers an excellent and critical starting point and a roadmap for future research on the diets of pterosaurs, and more broadly for all extinct animals.”
Reference:
Jordan Bestwick, David M. Unwin, Richard J. Butler, Donald M. Henderson, Mark A. Purnell. Pterosaur dietary hypotheses: a review of ideas and approaches. Biological Reviews, 2018; DOI: 10.1111/brv.12431
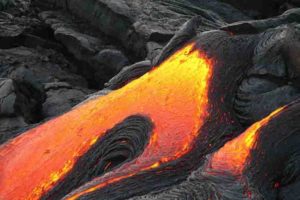
Scientists are using the latest in 4D technology to predict the behaviour of lava flows and its implications for volcanic eruptions.
The results explain why some lava flows can cover kilometres in just a few hours, whilst others travel more slowly during an eruption, highlighting the hazard posed by fast-moving flows which often pose the most danger to civilian populations close to volcanoes.
The research, which is being led by The University of Manchester, is studying the processes which happen during crystallisation in basaltic magmas using 4D synchrotron X-ray microtomography. It is the first time this kind of 4D scanning technology has been used for investigating crystallisation during volcanic eruptions and for simulating the behaviour of a natural lava flow. The study was recently published in Nature Scientific Reports.
The team, led by Prof Mike Burton, Chair of Volcanology at the University, monitored crystallisation in magmas, a fundamental process that drives eruptions and controls different kinds of volcanic activity. Using this new and novel approach and technology they can, for the first time, watch the crystals grow in 3D in real-time, simulating the behaviour of lava flows once a volcano has erupted. The process is similar to scenes recently witnessed at Kilauea in Hawaii.
Prof Burton explains: “During volcanic eruptions small crystals grow within magma. These crystals can greatly change the way magma flows. Simply put, the more crystals there are the slower the eruption will be which also reduces the speed and distance travelled by lava flows.”
“The fewer crystals present in the lava means the eruption will speed up, potentially becoming more powerful and devastating. Our research and this new approach open an entirely new frontier in the study of volcanic processes.” To study the rate of crystal growth the team set up a sample from a real eruption in a high temperature cell, before performing X-ray CAT scans whilst controlling the temperature of the magma. This allowed the team to visualise the formation and growth of crystals, and measure how quickly they grew.
Using this method and technology the researchers can collect hundreds of 3D images during a single experiment. This data is then used in complex, numerical models to fully characterise the behaviour of volcanic eruptions more accurately.
Dr Margherita Polacci, from Manchester’s School of Earth and Environmental Sciences, and study’s lead author, said: “Being able to more accurately predict the behaviour of lava flows could also allow us to help relevant safety agencies devise and develop new safety strategies and actions when dealing with eruptions in populated areas.”
This isn’t the only use for such technology in Geosciences. Prof Burton added: “There are many more applications of this approach in materials science, mineral extraction and other geological processes. We are very excited about the prospect of extending our studies to high pressures, which we will be doing in further experiments in 2018.”
Reference:
M. Polacci, F. Arzilli, G. La Spina, N. Le Gall, B. Cai, M. E. Hartley, D. Di Genova, N. T. Vo, S. Nonni, R. C. Atwood, E. W. Llewellin, P. D. Lee, M. R. Burton. Crystallisation in basaltic magmas revealed via in situ 4D synchrotron X-ray microtomography. Scientific Reports, 2018; 8 (1) DOI: 10.1038/s41598-018-26644-6
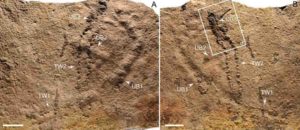
Trackways and burrows excavated in situ from the Ediacaran Dengying Formation. Credit: NIGP
On July 20, 1969, Neil Armstrong put the first human footprint on the moon. But when did animals leave the first footprint on Earth?
Recently, an international research team reported discovering fossil footprints for animal appendages in the Ediacaran Period (about 635-541 million years ago) in China. This is considered the earliest animal fossil footprint record. The research was published in Science Advances on June 6, 2018.
Bilaterian animals such as arthropods and annelids have paired appendages and are among the most diverse animals today and in the geological past. They are often assumed to have appeared and radiated suddenly during the Cambrian Explosion about 541 to 510 million years ago, although it has long been suspected that their evolutionary ancestry was rooted in the Ediacaran Period. Until the current discovery, however, no fossil record of animal appendages had been found from the Ediacaran Period.
Researchers from the Nanjing Institute of Geology and Palaeontology of the Chinese Academy of Sciences and Virginia Tech in the United States studied trackways and burrows discovered in the Ediacaran Shibantan Member of the Dengying Formation (551-541 million years ago) in the Yangtze Gorges area of South China. The trackways are somewhat irregular, consisting of two rows of imprints that are arranged in series or repeated groups.
The characteristics of the trackways indicate that they were produced by bilaterian animals with paired appendages that raised the animal body above the water-sediment interface. The trackways appear to be connected to burrows, suggesting that the animals may have periodically dug into sediments and microbial mats, perhaps to mine oxygen and food.
These trace fossils represent some of the earliest known evidence for animal appendages and extend the earliest trace fossil record of animals with appendages from the early Cambrian to the late Ediacaran Period. The body fossils of the animals that made these traces, however, have not yet been found. It is possible that such remains were never preserved.
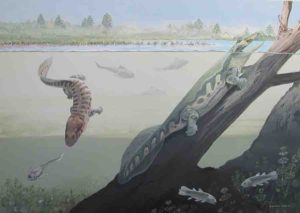
Full reconstruction of Waterloo Farm by Maggie Newman including Tutusius and Umzantsia. Credit: Maggie Newman
The first African fossils of Devonian tetrapods (four-legged vertebrates) show these pioneers of land living within the Antarctic circle, 360 million years ago.
The evolution of tetrapods from fishes during the Devonian period was a key event in our distant ancestry. Newly found fossils from the latest Devonian Waterloo Farm locality near Grahamstown in the Eastern Cape, South Africa, published today in Science, force a major reassessment of this event. “Whereas all previously found Devonian tetrapods came from localities which were in tropical regions during the Devonian, these specimens lived within the Antarctic circle,” explains lead author, Dr. Robert Gess of the Albany Museum in Grahamstown, and co-author Professor Per Ahlberg of Uppsala University in Sweden. The research was supported by the South African DST-NRF Centre of Excellence in Palaeosciences, based at the University of the Witwatersrand and the Millennium Trust.
The first African Devonian tetrapods
Two new species, named Tutusius and Umzantsia, are Africa’s earliest known four-legged vertebrates by a remarkable 70 million years. The approximately metre-long Tutusius umlambo (named in honour of Archbishop Emeritus Desmond Tutu) and the somewhat smaller Umzantsia amazana are both incomplete. Tutusius is represented by a single bone from the shoulder girdle, whereas Umzantsia is known from a greater number of bones, but they both appear similar to previously known Devonian tetrapods. Alive, they would have resembled a cross between a crocodile and a fish, with a crocodile-like head, stubby legs, and a tail with a fish-like fin.
The Waterloo Farm locality (where the tetrapods were discovered) is a roadcut first revealed in 2016 after controlled rock-cutting explosions by the South African National Roads Agency (SANRAL) along the N2 highway between Grahamstown and the Fish River. This cutting exposed dark grey mudstones of the Witpoort Formation that represent an ancient environment of a brackish, tidal river estuary that contain abundant fossils of animals and plants.
The first tetrapod found outside of tropical regions
The real importance of Tutusius and Umzantsia lies in where they were found.
Devonian tetrapod fossils are found in widely scattered localities. However, if the continents are mapped back to their Devonian positions, it emerges that all previous finds are from rocks deposited in the palaeotropics—between 30 degrees north and south of the equator. Almost all come from Laurussia, a supercontinent that later fragmented into North America, Greenland and Europe.
The much larger southern supercontinent, Gondwana, which incorporated present-day Africa, South America, Australia, Antarctica, and India, has hitherto yielded almost no Devonian tetrapods, with only an isolated jaw (named Metaxygnathus) and footprints, being found in eastern Australia. Because Australia was the northernmost part of Gondwana, extending into the tropics, an assumption developed that tetrapods evolved in the tropics, most likely in Laurussia. By extension it was assumed that movement of vertebrates from water onto land (terrestrialisation) also occurred in the tropics. Attempts to understand the causes of these major macroevolutionary steps therefore focussed on conditions prevalent in tropical water bodies.
The Waterloo Farm tetrapods not only come from Gondwana, but from its southernmost part: reconstructed to have been more than 70 degrees south, within the Antarctic circle. Abundant plant fossils show that forests grew nearby, so it wasn’t frozen, but it was definitely not tropical and during winter it will have experienced months of complete darkness. This finding changes our understanding of the distribution of Devonian tetrapods. We now know that tetrapods occurred throughout the world by the Late Devonian and that their evolution and terrestrialisation could realistically have occurred anywhere.
South Africa now adds insights into the emergence of land animals to its incredible fossil record, which also includes transition to mammals from reptile-like ancestors and the evolution of humans. There is probably not another country on the planet that so fully documents the long and dramatic evolutionary history of our own lineage.
Reference:
R. Gess at Albany Museum in Grahamstown, South Africa el al., “A tetrapod fauna from within the Devonian Antarctic Circle,” Science (2018). DOI: 1126/science.aaq1645
Note: The above post is reprinted from materials provided by Wits University.
Scientists studied 3.9-billion-year-old rocks from Nuvvuagittuq, Canada, and found evidence for an earlier formation of the crust. Credit: Elizabeth Bell
The early Earth might have been habitable much earlier than thought, according to new research from a group led by University of Chicago scientists.
Counting strontium atoms in rocks from northern Canada, they found evidence that the Earth’s continental crust could have formed hundreds of millions of years earlier than previously thought. Continental crust is richer in essential minerals than younger volcanic rock, which would have made it significantly friendlier to supporting life.
“Our evidence, which squares with emerging evidence including rocks in western Australia, suggests that the early Earth was capable of forming continental crust within 350 million years of the formation of the solar system,” said Patrick Boehnke, the T.C. Chamberlin Postdoctoral Fellow in the Department of Geophysical Sciences and the first author on the paper. “This alters the classic view, that the crust was hot, dry and hellish for more than half a billion years after it formed.”
One of the open questions in geology is how and when some of the crust — originally all younger volcanic rock — changed into the continental crust we know and love, which is lighter and richer in silica. This task is made harder because the evidence keeps getting melted and reformed over millions of years. One of the few places on Earth where you can find bits of crust from the very earliest epochs of Earth is in tiny flecks of apatite imbedded in younger rocks.
Luckily for scientists, some of these “younger” minerals (still about 3.9 billion years old) are zircons — very hard, weather-resistant minerals somewhat similar to diamonds. “Zircons are a geologist’s favorite because these are the only record of the first three to four hundred million years of Earth. Diamonds aren’t forever — zircons are,” Boehnke said.
Plus, the zircons themselves can be dated. “They’re like labeled time capsules,” said Prof. Andrew Davis, chair of the Department of Geophysical Sciences and a coauthor on the study.
Scientists usually look at the different variants of elements, called isotopes, to tell a story about these rocks. They wanted to use strontium, which offers clues to how much silica was around at the time it formed. The only problem is that these flecks are absolutely tiny — about five microns across, the diameter of a strand of spider silk — and you have to count the strontium atoms one by one.
This was a task for a unique instrument that came online last year: the CHicago Instrument for Laser Ionization, or CHILI. This detector uses lasers that can be tuned to selectively pick out and ionize strontium. When they used CHILI to count strontium isotopes in rocks from Nuvvuagittuq, Canada, they found the isotope ratio suggested plenty of silica was present when it formed.
This is important because the makeup of the crust directly affects the atmosphere, the composition of seawater, and nutrients available to any budding life hoping to thrive on planet Earth. It also may imply there were fewer meteorites than thought pummeling the Earth at this time, which would have made it hard for continental crust to form.
“Having continental crust that early changes the picture of early Earth in a number of ways,” said Davis, who is also a professor with the Enrico Fermi Institute. “Now we need a way for the geologic processes that make the continents to happen much faster; you probably need water and magma that’s about 600 degrees Fahrenheit less hot.”
The study is also confluent with a recent paper by Davis and Boehnke’s colleague Nicolas Dauphas, which found evidence for rain falling on continents 2.5 billion years ago, earlier than previously thought.
Reference:
Patrick Boehnke, Elizabeth A. Bell, Thomas Stephan, Reto Trappitsch, C. Brenhin Keller, Olivia S. Pardo, Andrew M. Davis, T. Mark Harrison, Michael J. Pellin. Potassic, high-silica Hadean crust. Proceedings of the National Academy of Sciences, 2018; 201720880 DOI: 10.1073/pnas.1720880115
Earth’s crust, mantle and outer core interactions. Credit: Kay Lancaster, University of Liverpool
A new study by the University of Liverpool, in collaboration with the Universities of Lancaster and Oslo, sheds light on a longstanding question that has puzzled earth scientists.
Using previously unavailable data, researchers confirm a correlation between the movement of plate tectonics on the Earth’s surface, the flow of mantle above the Earth’s core and the rate of reversal of the Earth’s magnetic field which has long been hypothesised.
In a paper published in the journal Tectonophysics, they suggest that it takes around 120-130 million years for slabs of ancient ocean floor to sink (subduct) from the Earth’s surface to a sufficient depth in the mantle where they can cool the core, which in turn causes the liquid iron in the Earth’s outer core to flow more vigorously and produce more reversals of the Earth’s magnetic field.
This study is the first to demonstrate this correlation using records and proxies of global rates of subduction from various sources including a continuous global plate reconstruction model developed at the University of Sydney. These records were compared with a new compilation of magnetic field reversals whose occurrence is locked into volcanic and sedimentary rocks.
Liverpool palaeomagnetist, Professor Andy Biggin, said: “Until recently we did not have good enough records of how much global rates of subduction had changed over the last few hundreds of millions of years and so we had nothing to compare with the magnetic records.
“When we were able to compare them, we found that the two records of subduction and magnetic reversal rate do appear to be correlated after allowing for a time delay of 120-130 million years for the slabs of ocean floor to go from the surface to a sufficient depth in the mantle where they can cool the core.
“We do not know for sure that the correlation is causal but it does seem to fit with our understanding of how the crust, mantle and core should all be interacting and this value of 120-130 million could provide a really useful observational constraint on how quickly slabs of ancient sea floor can fall through the mantle and affect flow currents within it and in the underlying core.”
The magnetic field is generated deep within the Earth in a fluid outer core of iron and other elements that creates electric currents, which in turn produces magnetic fields.
The core is surrounded by a nearly 3,000 km thick mantle which although made of solid rock, flows very slowly (mm per year). The mantle produces convection currents which are strongly linked to movement of the tectonic plates but also affect the core by varying the amount of heat that is transferred across the core-mantle boundary.
The Earth’s magnetic field occasionally flips its polarity and the average length of time between such flips has changed dramatically through Earth’s history. For example, today such magnetic reversals occur on average four times per million years but one hundred million years ago, the field essentially stayed in the same polarity for nearly 40 million years.
Professor Biggin heads up the University’s Determining Earth Evolution from Palaeomagnetism (DEEP) research group which brings together research expertise across geophysics and geology to develop palaeomagnetism as a tool for understanding deep Earth processes occurring across timescales of millions to billions of years.
Reference:
Mark W. Hounslow, Mathew Domeier, Andrew J. Biggin. Subduction flux modulates the geomagnetic polarity reversal rate. Tectonophysics, 2018; 742-743: 34 DOI: 10.1016/j.tecto.2018.05.018