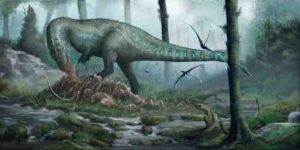
First dinosaur ever found, the predatory Megalosaurus came from same location, in Oxfordshire Credit: MARK WITTON
Spectacular flying reptiles armed with long teeth and claws which once dominated the skies have been rediscovered, thanks to a palaeontology student’s PhD research.
Dr Michael O’Sullivan, at the University of Portsmouth, has uncovered evidence of well armed and substantial flying reptiles from historically important, but overlooked, British Jurassic fossils.
He’s also found a new species of pterosaur with a wingspan of two metres — as large as a modern mute swan, and a giant in its time.
Some 200 fossils of flying reptiles — pterosaurs — have been collected over the last two centuries from the Stonesfield Slate, but their significance has been long neglected by palaeontologists, probably because they are mere fragments.
Closer inspection has revealed evidence of multiple pterosaur lineages in the UK’s Jurassic past, including some unexpectedly large and formidably armed species.
The research is Published in Acta Palaeontologica Polonica where it is highlighted as ‘editor’s choice’.
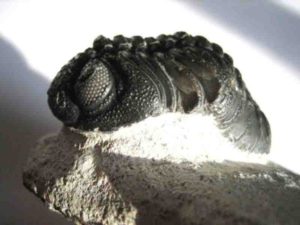
Dr O’Sullivan, in the University’s School of Earth and Environmental Sciences, said: “It’s large fangs would have meshed together to form a toothy cage, from which little could escape once Klobiodon had gotten a hold of it.
“The excellent marine reptiles and ammonites of the UK’s Jurassic heritage are widely known, but we celebrate our Jurassic flying reptiles far less.
“The Stonesfield pterosaurs are rarely pretty or spectacular, but they capture a time in flying reptile evolution which is poorly represented globally. They have an important role to play in not only understanding the UK’s natural history, but help us understand the bigger global picture as well.”
He has named the new species Klobiodon rochei.
The generic name means ‘cage tooth’, in reference to its huge, fang-like teeth — up to 26mm long at a time when few pterosaurs had any teeth — and the species name honours comic book artist Nick Roche in recognition of the role popular media has in how extinct animals are portrayed.
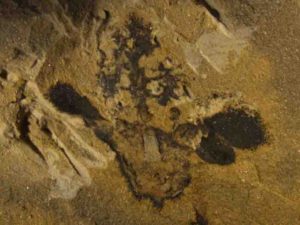
Only the lower jaw of Klobiodon is known, but it has a unique dental configuration that allows it to be distinguished from other pterosaurs. It was likely a gull or tern-like creature — a coastal flier that caught fish and squid using its enormous teeth, swallowing them whole.
Much of Dr O’Sullivan’s research has involved untangling the messy science associated with these neglected specimens.
He said: “Klobiodon has been known to us for centuries, archived in a museum drawer and seen by dozens or hundreds of scientists, but it’s significance has been overlooked because it’s been confused with another species since the 1800s.”
Klobiodon and the other Stonesfield pterosaurs lived alongside one of the most famous and important dinosaurs in the world, the predatory Megalosaurus, the first dinosaur ever named. But as global sea levels were higher, and the world was much warmer, their Jurassic Britain was a series of large tropical islands.
Dr O’Sullivan was examining the Stonesfield pterosaur collections held in museums across the UK for his PhD studies when he found evidence of three distinct types of pterosaur, some of which are the oldest of their kind, as well as evidence of a new pterosaur species.
Stonesfield Slate, where the new pterosaur fossils were found, is a rich source of Jurassic fossils about 10 miles northwest of Oxford. It is where, in 1824, Britain’s first discovered dinosaur, the Megalosaurus, was found.
The quantity and quality of such fossils from the area might be why these fragments have until now been overlooked.
Reference:
Michael O’Sullivan, David Martill. Pterosauria of the Great Oolite Group (Middle Jurassic, Bathonian) of Oxfordshire and Gloucestershire, England.. Acta Palaeontologica Polonica, 2018; 63 DOI: 10.4202/app.00490.2018
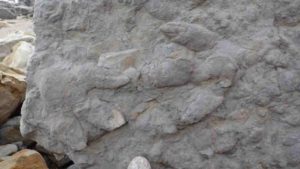
Two large iguanodontian footprints with skin and claw impressions. Credit: Neil Davies
More than 85 well-preserved dinosaur footprints — made by at least seven different species — have been uncovered in East Sussex, representing the most diverse and detailed collection of these trace fossils from the Cretaceous Period found in the UK to date.
The footprints were identified by University of Cambridge researchers between 2014 and 2018, following periods of coastal erosion along the cliffs near Hastings. Many of the footprints — which range in size from less than 2 cm to over 60 cm across — are so well-preserved that fine detail of skin, scales and claws is easily visible.
The footprints date from the Lower Cretaceous epoch, between 145 and 100 million years ago, with prints from herbivores including Iguanodon, Ankylosaurus, a species of stegosaur, and possible examples from the sauropod group (which included Diplodocus and Brontosaurus); as well as meat-eating theropods. The results are reported in the journal Palaeogeography, Palaeoclimatology, Palaeoecology.
Over the past 160 years, there have been sporadic reports of fossilised dinosaur footprints along the Sussex coast, but no new major discoveries have been described for the past quarter century and the earlier findings were far less varied and detailed than those described in the current research.
The area around Hastings is one of the richest in the UK for dinosaur fossils, including the first known Iguanodon in 1825, and the first confirmed example of fossilised dinosaur brain tissue in 2016. However, trace fossils such as footprints, which can help scientists learn more about the composition of dinosaur communities, are less common in the area.
“Whole body fossils of dinosaurs are incredibly rare,” said Anthony Shillito, a PhD student in Cambridge’s Department of Earth Sciences and the paper’s first author. “Usually you only get small pieces, which don’t tell you a lot about how that dinosaur may have lived. A collection of footprints like this helps you fill in some of the gaps and infer things about which dinosaurs were living in the same place at the same time.”
The footprints described in the current study, which Shillito co-authored with Dr Neil Davies, were uncovered during the past four winters, when strong storms and storm surges led to periods of collapse of the sandstone and mudstone cliffs.
In the Cretaceous Period, the area where the footprints were found was likely near a water source, and in addition to the footprints, a number of fossilised plants and invertebrates were also found.
“To preserve footprints, you need the right type of environment,” said Davies. “The ground needs to be ‘sticky’ enough so that the footprint leaves a mark, but not so wet that it gets washed away. You need that balance in order to capture and preserve them.”
“As well as the large abundance and diversity of these prints, we also see absolutely incredible detail,” said Shillito. “You can clearly see the texture of the skin and scales, as well as four-toed claw marks, which are extremely rare.
“You can get some idea about which dinosaurs made them from the shape of the footprints — comparing them with what we know about dinosaur feet from other fossils lets you identify the important similarities. When you also look at footprints from other locations you can start to piece together which species were the key players.”
As part of his research, Shillito is studying how dinosaurs may have affected the flows of rivers. In modern times, large animals such as hippopotamuses or cows can create small channels, diverting some of the river’s flow.
“Given the sheer size of many dinosaurs, it’s highly likely that they affected rivers in a similar way, but it’s difficult to find a ‘smoking gun’, since most footprints would have just washed away,” said Shillito. “However, we do see some smaller-scale evidence of their impact; in some of the deeper footprints you can see thickets of plants that were growing. We also found evidence of footprints along the banks of river channels, so it’s possible that dinosaurs played a role in creating those channels.”
It’s likely that there are many more dinosaur footprints hidden within the eroding sandstone cliffs of East Sussex, but the construction of sea defences in the area to slow or prevent the process of coastal erosion may mean that they remained locked within the rock.
The research was funded by the Natural Environment Research Council (NERC).
Reference:
Anthony P. Shillito, Neil S. Davies. Dinosaur-landscape interactions at a diverse Early Cretaceous tracksite (Lee Ness Sandstone, Ashdown Formation, southern England). Palaeogeography, Palaeoclimatology, Palaeoecology, 2019; 514: 593 DOI: 10.1016/j.palaeo.2018.11.018
Note: The above post is reprinted from materials provided by University of Cambridge. The original story is licensed under a Creative Commons License.
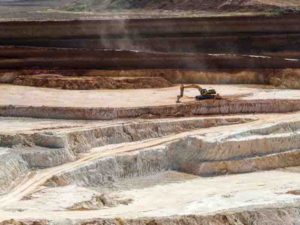
The high-density minerals in the Georgia kaolin mines are potential sources of rare-earth elements, including the heavy rare-earth elements that are in high demand for many important uses and are mostly imported to the United States from China, according to a study led by Georgia State University and Thiele Kaolin Co.
Rare-earth elements are used to make critical products, including magnetic resonance imaging (MRI) contrast agents, X-ray intensifying screens, portable X-ray machines, medical lasers, fiber optics, optical lenses, pressure sensors, monitors and television screens, fluorescent lamps, rechargeable battery electrodes and permanent magnets.
There are 17 rare-earth elements, which include the 15 elements of the lanthanide series (atomic numbers 57 to 71 on the periodic table), plus scandium (Sc) and yttrium (Y). The heavy rare-earth elements are from gadolinium (Gd) to lutetium (Lu), atomic numbers 64 to 71 on the periodic table.
Thiele Kaolin Co. mined for kaolin in two quarries near Sandersville, Ga., and provided Georgia State researchers with the leftover mineral samples, or grit, for analysis. The minerals present were identified using X-ray diffraction, scanning electron microscopy and chemical analysis. The findings, published in the journal Clays and Clay Minerals, suggest a new, potential source of rare-earth elements, including the less common heavy rare-earth elements.
“We were interested in looking at the very course, sand-sized material from the kaolin ore that they call grit. It accounts for about 10 percent of the mined material and is removed before they make finished kaolin products for a variety of applications, such as paper, paints, adhesives, plastics, ceramics, etc.,” said Dr. W. Crawford Elliott, senior author of the study and associate professor in the Department of Geosciences at Georgia State. “They gave us samples of the grit. When we processed these samples, we found a particular enrichment in the heavy rare-earth elements, gadolinium through lutetium. An enrichment in the heavy rare-earth elements is interesting and useful because in most cases, the Earth’s crust is enriched in the lighter rare-earth elements. The heavy rare-earth elements tend to be more technologically important.
“After we did a heavy liquid separation on that material, we found the Buffalo Creek Kaolin Member is about 100 times more enriched in the heavy rare-earth elements relative to concentrations in upper continental crust. Our work suggests a way to obtain heavy rare-earth elements from kaolin ore, which hasn’t been done before. This constitutes a new resource for the rare-earth elements, which we are getting all from China.”
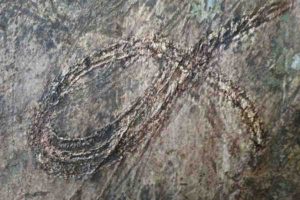
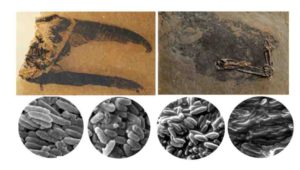
Close-up of a looping millipede death-trail. Credit: Photo by Anthony Shillito
Our understanding of when the very first animals started living on land is helped by identifying trace fossils — the tracks and trails left by ancient animals — in sedimentary rocks that were deposited on the continents.
Geoscientists Anthony P. Shillito and Neil S. Davies of the University of Cambridge studied the site of what has widely been accepted as the earliest set of non-marine trackways, in Ordovician (ca. 455 million-year-old) strata from the Lake District, England.
What they discovered is that the trackways occur within volcanic ash that settled under water, and not within freshwater lake and sub-aerial sands (as previously thought). This means that the site is not the oldest evidence for animal communities on land, but instead “is actually a remarkable example of a ‘prehistoric Pompeii’,” says Shillito — a suite of rocks that preserve trails made by distressed and dying millipede-like arthropods as they were overcome by ash from volcanic events.
Shillito and Davies directed their research at this site in particular because it seemed unusual — at every other known trackway site in the world the evidence for when animals came onto land dates to the latest Silurian (ca. 420 million years ago), so something about the Borrowdale site didn’t seem right. Further investigation proved that this was the case. In the course of their study, they found 121 new millipede trackways, all within volcanic ash with evidence for underwater or shoreline deposition.
Volcanic ash is known to cause mass death in some modern arthropod communities, particularly in water, because ash is so tiny it can get inside arthropod exoskeletons and stick to their breathing and digestive apparatus. Shilllito and Davies noticed that most of the trails were extremely tightly looping — a feature which is commonly associated with “death dances” in modern and ancient arthropods.
This study, published in Geology, overturns what is known about the earliest life on land and casts new light onto one of the key evolutionary events in the history of life on Earth. Shillito notes, “It reveals how even surprising events can be preserved in the ancient rock record, but — by removing the ‘earliest’ outlier of evidence — suggests that the invasion of the continents happened globally at the same time.”
Understanding how life engineered major evolutionary advances within environments, and the rate and impact of these advances on the functioning of the Earth system, provides vital context for understanding global change at the present day, and underlines the inseparable relationship between life and the planet.
Reference:
Anthony P. Shillito, Neil S. Davies. Death near the shoreline, not life on land: Ordovician arthropod trackways in the Borrowdale Volcanic Group, UK. Geology, 2018; DOI: 10.1130/G45663.1
This is a Nanjinganthus fossil, showing its ovary (bottom centre), sepals and petals (on the sides) and a tree-shaped top. Credit: Fu et al., 2018
Scientists have described a fossil plant species that suggests flowers bloomed in the Early Jurassic, more than 174 million years ago, according to new research in the open-access journal eLife.
Before now, angiosperms (flowering plants) were thought to have a history of no more than 130 million years. The discovery of the novel flower species, which the study authors named Nanjinganthus dendrostyla, throws widely accepted theories of plant evolution into question, by suggesting that they existed around 50 million years earlier. Nanjinganthus also has a variety of ‘unexpected’ characteristics according to almost all of these theories.
Angiosperms are an important member of the plant kingdom, and their origin has been the topic of long-standing debate among evolutionary biologists. Many previously thought angiosperms could be no more than 130 million years old. However, molecular clocks have indicated that they must be older than this. Until now, there has been no convincing fossil-based evidence to prove that they existed further back in time.
“Researchers were not certain where and how flowers came into existence because it seems that many flowers just popped up in the Cretaceous from nowhere,” explains lead author Qiang Fu, Associate Research Professor at the Nanjing Institute of Geology and Paleontology, China. “Studying fossil flowers, especially those from earlier geologic periods, is the only reliable way to get an answer to these questions.”
The team studied 264 specimens of 198 individual flowers preserved on 34 rock slabs from the South Xiangshan Formation — an outcrop of rocks in the Nanjing region of China renowned for bearing fossils from the Early Jurassic epoch. The abundance of fossil samples used in the study allowed the researchers to dissect some of them and study them with sophisticated microscopy, providing high-resolution pictures of the flowers from different angles and magnifications. They then used this detailed information about the shape and structure of the different fossil flowers to reconstruct the features of Nanjinganthus dendrostyla.
The key feature of an angiosperm is ‘angio-ovuly’ — the presence of fully enclosed ovules, which are precursors of seeds before pollination. In the current study, the reconstructed flower was found to have a cup-form receptacle and ovarian roof that together enclose the ovules/seeds. This was a crucial discovery, because the presence of this feature confirmed the flower’s status as an angiosperm. Although there have been reports of angiosperms from the Middle-Late Jurassic epochs in northeastern China, there are structural features of Nanjinganthus that distinguish it from these other specimens and suggest that it is a new genus of angiosperms.
Having made this discovery, the team now wants to understand whether angiosperms are either monophyletic — which would mean Nanjinganthus represents a stem group giving rise to all later species — or polyphyletic, whereby Nanjinganthus represents an evolutionary dead end and has little to do with many later species.
“The origin of angiosperms has long been an academic ‘headache’ for many botanists,” concludes senior author Xin Wang, Research Professor at the Nanjing Institute of Geology and Paleontology. “Our discovery has moved the botany field forward and will allow a better understanding of angiosperms, which in turn will enhance our ability to efficiently use and look after our planet’s plant-based resources.”
Reference:
Qiang Fu, Jose Bienvenido Diez, Mike Pole, Manuel García Ávila, Zhong-Jian Liu, Hang Chu, Yemao Hou, Pengfei Yin, Guo-Qiang Zhang, Kaihe Du, Xin Wang. An unexpected noncarpellate epigynous flower from the Jurassic of China. eLife, 2018; 7 DOI: 10.7554/eLife.38827
Note: The above post is reprinted from materials provided by eLife.
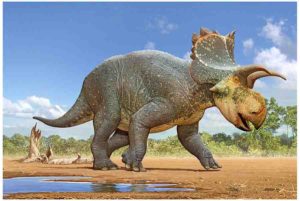
Palentologists are announcing a new dinosaur discovery in the southwest United States. Crittendenceratops krzyzanowskii is a new ceratopsid (horned) dinosaur from 73-million-year-old (Late Cretaceous) rocks in southern Arizona. It is one of the few dinosaurs named from Arizona.
Crittendenceratops krzyzanowskii was named by Sebastian Dalman, John-Paul Hodnett, Asher Lichtig and Spencer Lucas, Ph.D, in an article recently published in the New Mexico Museum of Natural History & Science Bulletin.
Dalman and Lichtig are Research Associates of the New Mexico Museum of Natural History & Science (NMMNHS), Lucas is a curator at NMMNHS, and Hodnett is a paleontologist employed by the Maryland-National Capital Parks Commission.
The name Crittendenceratops is for the Fort Crittenden Formation (the rock formation that yielded the dinosaur fossils) and Greek ceratops, which means horned face. The species name krzyzanowskii is for the late Stan Krzyzanowski, a NMMNHS Research Associate who discovered the bones of the new dinosaur.
Crittendenceratops belongs to a group of horned dinosaurs called the centrosaurs, and can be distinguished from other centrosaurs by the unique shape of the bones in its frill (head shield). Crittendenceratrops was about 11 feet long and weighed an estimated three-quarters of a ton. Like other ceratopsids, Crittendenceratops was a plant eater.
The rocks that yielded the bones were deposited along the margins of a large lake that was present in an area southeast of Tucson, Arizona during the Late Cretaceous.
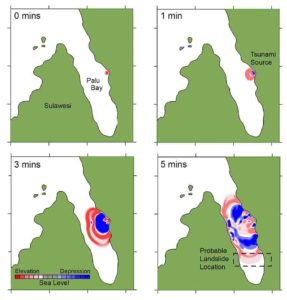
Map of landslide. Credit: Brunel University London
September’s deadly Indonesian tsunami, which killed almost 2000 people, was probably caused by a huge submarine landslide off Sulawesi Island’s west coast, a new study shows.
Until now, scientists have been left puzzled by how an earthquake of just 7.5 magnitude – not significant enough to trigger Indonesia’s tsunami early-warning system – was able to wreck such devastation.
But a new analysis of wave data by researchers at Brunel University London has pinpointed an area in Palu Bay, on Sulawesi Island’s west coast, as the probable location of a massive under water landslide caused by the earthquake.
“This event is puzzling for two reasons,” said Dr. Mohammad Heidarzadeh, Assistant Professor of Civil Engineering at Brunel, who led the study.
“Firstly, the earthquake’s magnitude was moderate. Usually an earthquake would require a magnitude of at least 8.4 or 8.5 to trigger such a large tsunami – at peak the wave reached 11 metres. Secondly, the mechanism of the earthquake’s rupture was a strike-slip – the ground ruptured horizontally, rather than vertically.
“This is confusing as we’d have therefore expected a wave of only 1 or 2 metres from a Sulawesi-style earthquake.”
However, the new study – published in the journal of Pure and Applied Geophysics – now shows the earthquake likely did trigger a landslide large enough to unleash the devasting tsunami.
New sea-level analysis shows that the Sulawesi tsunami had very short-period waves, in-line with those caused by a landslide. Where tsunamis caused by landslides typically have a wave period of 3 to 4 minutes, tsunamis unleashed by an earthquake will have a wave period of 15 to 60 minutes.
Field studies also revealed that the largest waves were concentrated on just a small segment of coast, which is consistent with the tsunami being caused by a landslide.
“Our analyses are based on sea-level data of real waves generated by the Sulawesi tsunami, analysis of the seafloor rupture and deformation generated by the earthquake, and computer simulations of the real tsunami propagation,” said Dr. Heidarzadeh.
The study also ruled out another proposed theory for the cause of the tsunami – the funnelling of water up the bay, or bay oscillations.
“Our analysis completely ruled out those speculations,” said Dr. Heidarzadeh. “We proved that bay oscillations cannot make 11 metre high waves.”
null
Reference:
Mohammad Heidarzadeh et al. Insights on the Source of the 28 September 2018 Sulawesi Tsunami, Indonesia Based on Spectral Analyses and Numerical Simulations, Pure and Applied Geophysics (2018). DOI: 10.1007/s00024-018-2065-9
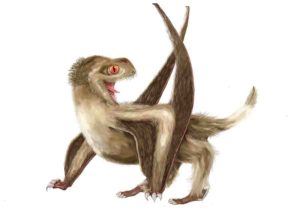
A reconstruction of the studied Daohugou pterosaur, with four different feather types over its head, neck, body, and wings, and a generally ginger-brown color. Credit: Reconstruction by Yuan Zhang.
An international team of palaeontologists, which includes the University of Bristol, has discovered that the flying reptiles, pterosaurs, actually had four kinds of feathers, and these are shared with dinosaurs — pushing back the origin of feathers by some 70 million years.
Pterosaurs are the flying reptiles that lived side by side with dinosaurs, 230 to 66 million years ago. It has long been known that pterosaurs had some sort of furry covering often called ‘pycnofibres’, and it was presumed that it was fundamentally different to feathers of dinosaurs and birds.
In a new work published today in the journal Nature Ecology & Evolution, a team from Nanjing, Bristol, Cork, Beijing, Dublin, and Hong Kong show that pterosaurs had at least four types of feathers:
simple filaments (‘hairs’)
bundles of filaments,
filaments with a tuft halfway down
down feathers.
These four types are now also known from two major groups of dinosaurs — the ornithischians, which were plant-eaters, and the theropods, which include the ancestors of birds.
Baoyu Jiang of Nanjing University, who led the research, said: “We went to Inner Mongolia to do fieldwork in the Daohugou Formation.
“We already knew that the sites had produced excellent specimens of pterosaurs with their pycnofibres preserved and I was sure we could learn more by careful study.”
Zixiao Yang, also of Nanjing University, has studied the Daohugou localities and the pterosaurs as part of his PhD work. He said: “This was a fantastic opportunity to work on some amazing fossils.
“I was able to explore every corner of the specimens using high-powered microscopes, and we found many examples of all four feathers.”
Maria McNamara of University College Cork, added: “Some critics have suggested that actually there is only one simple type of pycnofibre, but our studies show the different feather types are real.
“We focused on clear areas where the feathers did not overlap and where we could see their structure clearly. They even show fine details of melanosomes, which may have given the fluffy feathers a ginger colour.”
Professor Mike Benton from the University of Bristol’s School of Earth Sciences, said: “We ran some evolutionary analyses and they showed clearly that the pterosaur pycnofibres are feathers, just like those seen in modern birds and across various dinosaur groups.
“Despite careful searching, we couldn’t find any anatomical evidence that the four pycnofibre types are in any way different from the feathers of birds and dinosaurs. Therefore, because they are the same, they must share an evolutionary origin, and that was about 250 million years ago, long before the origin of birds.”
Birds have two types of advanced feathers used in flight and for body smoothing, the contour feathers with a hollow quill and barbs down both sides.
These are found only in birds and the theropod dinosaurs close to bird origins. But the other feather types of modern birds include monofilaments and down feathers, and these are seen much more widely across dinosaurs and pterosaurs.
The armoured dinosaurs and the giant sauropods probably did not have feathers, but they were likely suppressed, meaning they were prevented from growing, at least in the adults, just as hair is suppressed in whales, elephants, and hippos. Pigs are a classic example, where the piglets are covered with hair like little puppies, and then, as they grow, the hair growth is suppressed.
Professor Benton added: “This discovery has amazing implications for our understanding of the origin of feathers, but also for a major time of revolution of life on land.
“When feathers arose, about 250 million years ago, life was recovering from the devasting end-Permian mass extinction.
“Independent evidence shows that land vertebrates, including the ancestors of mammals and dinosaurs, had switched gait from sprawling to upright, had acquired different degrees of warm-bloodedness, and were generally living life at a faster pace.
“The mammal ancestors by then had hair, so likely the pterosaurs, dinosaurs and relatives had also acquired feathers to help insulate them.
“The hunt for feathers in fossils is heating up and finding their functions in such early forms is imperative. It can rewrite our understanding of a major revolution in life on Earth during the Triassic, and also our understanding of the genomic regulation of feathers, scales, and hairs in the skin.”
Reference:
Zixiao Yang, Baoyu Jiang, Maria E. McNamara, Stuart L. Kearns, Michael Pittman, Thomas G. Kaye, Patrick J. Orr, Xing Xu, Michael J. Benton. Pterosaur integumentary structures with complex feather-like branching. Nature Ecology & Evolution, 2018; 3 (1): 24 DOI: 10.1038/s41559-018-0728-7
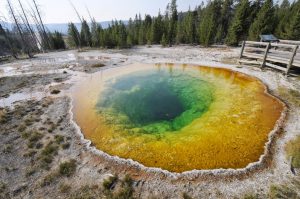
Even in Earth’s most inhospitable environments, life has taken hold.
Extremophiles are the organisms most well-known for withstanding extreme temperatures, pHs, salinity, and even nutrient-starvation. They have evolved special mechanisms that enable them to survive in their environments, but getting to the bottom of that resilience requires targeted and methodical interrogation.
At Yellowstone National Park and similar sites, extremophiles reside in environments such as acid hot springs or thermal acid soils. Here they are exposed, often intermittently, to some of the lowest naturally-occurring pHs on Earth, and temperatures nearing the boiling point of water. To survive in these rapidly fluctuating conditions, organisms protect themselves with complex membranes, composed of interlocked lipids linked to their backbones with strong ether bonds, rather than the ester bonds most commonly found in eukaryotes and bacteria.
In Sulfolobus acidocaldarius, an archaeon that lives in high-acid, high-temperature environments that are common in Yellowstone, cellular membrane lipids called glycerol dialkyl glycerol tetraether (GDGTs) are linked to an uncommon sugar-like molecule called calditol. A group of scientists recently published findings in the Proceedings of the National Academy of Sciences (PNAS), identifying how calditol is made in the cell and how, specifically, it is responsible for acid-tolerance in these organisms. The work is helping scientists get closer to understanding how life evolved to survive in extreme environments.
Roger Summons, the Schlumberger Professor of Geobiology in MIT’s Department of Earth, Atmospheric and Planetary Sciences (EAPS) and one of the authors of the study, credits advances in molecular biology, bioinformatics, and targeted gene deletion strategies for enabling this discovery.
“The era of genomics has brought a range of new tools to advance lipid biomarker research,” Summons says. Paula Welander, a former EAPS postdoc in the Summons Lab and now assistant professor in the Department of Earth System Science at Stanford University, directed the study that was also conducted by Zhirui Zeng and Jeremy H. Wei at Stanford, and Xiao-lei Liu, an assistant professor of organic geochemistry at the University of Oklahoma.
“This study is an excellent example of how an interdisciplinary approach, including microbial physiologists and organic geochemists, can address outstanding questions regarding lipid biomarkers,” Welander says.
To identify calditol’s role in the Sulfolobus acidocaldarius membranes, the researchers used tools in comparative genomics, gene deletion, and lipid analysis to zero in on a particular protein within the class of radical S-andenosylmethionine (SAM) enzymes that is required to synthesize calditol. When they searched for what coded that protein in calditol-producing archaeal genomes, they found just a few candidate genes.
To test the protein’s importance for acid tolerance, the researchers created mutants—with the membrane-related genes deleted—and analyzed their lipids. By subjecting the calditol-free mutant to highly acidic conditions, the researchers were able to confirm the true function of the calditol component of the membrane. Only the naturally-occurring, calditol-producing Sulfolobus and the mutant strain with the radical-SAM gene restored, were able to grow after a significant drop in pH.
“While Welander and colleagues have demonstrated the presence of radical-SAM lipid biosynthesis genes in bacteria, this is the first time one has been unambiguously identified in archaea,” Summons says. “Calditol-linked to membrane lipids in these organisms confer significant protective effects.”
Adds Welander: “Researchers have hypothesized for many years that producing calditol would provide this type of protective effect, but this has not been demonstrated directly. Here we finally show this link directly.”
Even further, the fact that a radical SAM protein is involved in linking calditol to the membranes might help scientists better understand the chemistry and evolution of membrane lipids from a wide variety of environments across the planet.
Summons says the result speaks to “the possible presence of a variety of other radical chemistries to modify membrane lipids once they’ve been synthesized.”
“In turn, this could help us better understand the biosynthesis of other archaea-specific lipids and help us write the evolutionary history of these strikingly distinctive membranes,” he says.
Reference:
Zhirui Zeng et al. Calditol-linked membrane lipids are required for acid tolerance in Sulfolobus acidocaldarius, Proceedings of the National Academy of Sciences (2018). DOI: 10.1073/pnas.1814048115
Two of the fossils sampled for the study with the fossil melanosomes found in each fossil (scanning electron microscope images). Scaniacypselus to the left and Primotrogon to the right. Melanosome shape varies in the different samples, and is indicative of color. The sample furthest to the left was predicted to be iridescent. Credit: Photographs of Scaniacypselus and Primotrogon by Jakob Vinther and Fiann Smithwick.
Iridescence is responsible for some of the most striking visual displays in the animal kingdom. Now, thanks to a new study of feathers from almost 100 modern bird species, scientists have gained new insights into how this colour diversity evolved.
Iridescence refers to the phenomena where colour changes when an object is viewed from different angles. Birds produce this varying coloration in their feathers by using nanoscale arrays of melanin-filled organelles (melanosomes) layered with keratin. In this form of structural colouration, the shapes of melanosomes together with the thickness of keratin layers determine what colour is produced.
While melanosome morphology has previously been used to predict colour in fossil animals, melanosome variation in iridescent feathers has not been analysed on as large a scale until this study.
As reported in the journal Evolution, a team of University of Bristol researchers used scanning electron microscopy to quantify melanosome extracts from the feathers of 97 species of modern birds with iridescent plumage, taken from the collections of the Zoological Museum of Copenhagen.
The study showed that iridescent feathers contain the most varied melanosome morphologies of all types of bird coloration sampled to date. Unlike black, grey and brown feathers that always contain solid melanosomes, iridescent feathers can contain melanosomes that are hollow and/or flattened.
“We found that melanosomes in modern iridescent feathers are more diverse in shape than those found in grey, black or brown feathers combined (that also contain melanosomes),” said lead author Klara Nordén, who conducted the study during her undergraduate years at Bristol’s School of Earth Sciences. “It is already known that structural coloration is responsible for 70 per cent of the colour variability in birds. These two facts might be coupled — birds evolved varied forms of melanosomes to achieve ever greater diversity in colour.
“I wanted to find out if we could improve current predictive models for fossil colour based on melanosome morphology by including all types of melanosomes found in iridescent feathers.”
Dr Jakob Vinther, co-author of the study and a leading researcher in the field of paleocolour at Bristol’s School of Biological Sciences, had already collected the perfect fossil samples to test the new model on.
“We had sampled Scaniacypselus, related to modern tree swifts, and Primotrogon, ancestor to modern trogons. These groups are iridescent today and have flat and hollow melanosomes. Did their 48-million-year-old ancestors from Germany also have iridescent plumage?”
Interestingly, the model predicted that Primotrogon probably was iridescent, but it used solid rather than hollow melanosomes, unlike its modern descendants.
“This demonstrates how we now have the tools to map out the evolution of iridescence in fossil lineages,” said Klara, who is now a PhD student at Princeton University. “It opens the door to many new discoveries of dazzling displays in fossil birds and other dinosaurs.”
The current study focused on mapping out how melanosomes vary in iridescent feathers. Further avenues of research might examine why birds utilise such diversity of melanosome types in iridescent feathers. These insights could ultimately enhance our understanding of why fossil birds or dinosaurs might have used such morphologies, revealing something about their behaviour.
Reference:
Klara K. Nordén, Jaeike Faber, Frane Babarović, Thomas L. Stubbs, Tara Selly, James D. Schiffbauer, Petra Peharec Štefanić, Gerald Mayr, Fiann M. Smithwick, Jakob Vinther. Melanosome diversity and convergence in the evolution of iridescent avian feathers-Implications for paleocolor reconstruction. Evolution, 2018; DOI: 10.1111/evo.13641
This is a drawing of the extinct Australian giant short-faced kangaroo Simosthenurus occidentalis, part of the Sthenurinae sub-family. mtDNA from the petrous bones of Simosthenurus occidentalis has linked extinct Sthenurinae with Australia’s living banded hare-wallaby. Credit: Joseph Burgess
A Queensland University of Technology (QUT) led collaboration with University of Adelaide reveals that Australia’s pint-sized banded hare-wallaby is the closest living relative of the giant short-faced kangaroos which roamed the continent for millions of years, but died out about 40,000 years ago.
Published in Systematic Biology, the research involved the first near-complete mitochondrial (mt) genome sequencing from extinct Australian megafauna.
DNA was sequenced from inner ear bones (petrous bones) of a 45,000-year-old giant short-faced kangaroo, Simosthenurus occidentalis, part of the Sthenurinae sub-family, found at Mt Cripps in Tasmania
These are the longest DNA sequences ever recovered from Australia’s extinct megafauna, with more than 16,000 base pairs of mtDNA, which is used to help understand evolutionary relationships
The results support an evolutionary link between giant short-faced kangaroos (Sthenurinae) and the threatened banded hare-wallaby, Lagostrophus fasciatus
The study also combined the DNA evidence with fossil and anatomical data to trace body size change over the evolutionary history of kangaroos and wallabies
The analysis was conducted by QUT evolutionary biologists PhD researcher Manuela Cascini and Associate Professor Matthew Phillips, from the Science and Engineering Faculty, in collaboration with University of Adelaide’s Professor Alan Cooper and Dr Kieren Mitchell, who undertook the DNA sequencing at the Australian Centre for Ancient DNA.
Lead author Ms Cascini, a molecular biologist who moved from Italy to undertake her PhD research with Associate Professor Phillips, said her project also involved analysis of mtDNA sequenced from the inner ear bones of another ancient extinct macropod that was found in Tasmania — the giant wallaby, Protemnodon anak, which weighed up to 150 kilograms.
Small fragments of ancient DNA sequenced from this giant wallaby species and from the giant short-faced kangaroo were first reported on by University of Adelaide scientists in 2015.
“Our analysis confirmed their conclusion that the giant wallabies are close relatives of the iconic living ‘Macropus’ genus of kangaroos and wallabies,” Ms Cascini said.
“However that earlier study provided insufficient DNA to confidently place the giant short-faced kangaroos on the evolutionary tree.
“We’ve now been able to show the strongest evidence yet that the closest living relative of these massive Sthenurinae kangaroos, which weighed up to about 240 kilograms, is the tiny, 2-kilogram banded hare-wallaby. These wallabies live in the wild only on islands off Western Australia and are classified as vulnerable.”
Associate Professor Phillips said the larger amount of mtDNA sequenced in this study by the University of Adelaide collaborators helped enable the strong finding on the banded hare-wallaby link.
“This is by far the most genetic data that anyone has extracted out of Australian megafauna, and it was taken from the petrous bones which are denser and often seem to hold DNA better,” he said.
“You find a lot of ancient DNA studies of megafauna from permafrost in northern Europe and northern America because the cold helps preserve the DNA. But in Australia the hotter climate and older age of the megafauna is far less favourable for DNA preservation.”
Dr Mitchell said Tasmania’s cooler climate and higher-altitude caves “make for much better DNA preservation than we find elsewhere in Australia, so we focused our hunt for high-quality megafaunal DNA there.”
Associate Professor Phillips said other findings of the study on the evolution of kangaroos and wallabies (macropods) included:
The macropod ancestors diverged from tree-living possums around 41 to 46 million years ago
They remained small, in the 2-15 kg range, while Australia was more dominated by rainforest
As the climate cooled and dried, and as the forests opened up over the past 10 million years, at least four different kangaroo lineages independently evolved to megafaunal size (more than 44 kg)
This includes the short-faced kangaroos, the giant Protemnodon wallabies, and the living red and grey kangaroos.
Reference:
Manuela Cascini, Kieren J Mitchell, Alan Cooper, Matthew J Phillips. Reconstructing the Evolution of Giant Extinct Kangaroos: Comparing the Utility of DNA, Morphology, and Total Evidence. Systematic Biology, 2018; DOI: 10.1093/sysbio/syy080
A nematode (eukaryote) in a biofilm of microorganisms. This unidentified nematode (Poikilolaimus sp.) from Kopanang gold mine in South Africa, lives 1.4 km below the surface. Credit: Gaetan Borgonie, Extreme Life Isyensya, Belgium
Barely living “zombie” bacteria and other forms of life constitute an immense amount of carbon deep within Earth’s subsurface — 245 to 385 times greater than the carbon mass of all humans on the surface, according to scientists nearing the end of a 10-year international collaboration to reveal Earth’s innermost secrets.
On the eve of the American Geophysical Union’s annual meeting, scientists with the Deep Carbon Observatory today reported several transformational discoveries, including how much and what kinds of life exist in the deep subsurface under the greatest extremes of pressure, temperature, and low nutrient availability.
Drilling 2.5 kilometers into the seafloor, and sampling microbes from continental mines and boreholes more than 5 km deep, scientists have used the results to construct models of the ecosystem deep within the planet.
With insights from now hundreds of sites under the continents and seas, they have approximated the size of the deep biosphere — 2 to 2.3 billion cubic km (almost twice the volume of all oceans) — as well as the carbon mass of deep life: 15 to 23 billion tonnes (an average of at least 7.5 tonnes of carbon per cu km subsurface).
The work also helps determine types of extraterrestrial environments that could support life.
Among many key discoveries and insights:
The deep biosphere constitutes a world that can be viewed as a sort of “subterranean Galapagos” and includes members of all three domains of life: bacteria and archaea (microbes with no membrane-bound nucleus), and eukarya (microbes or multicellular organisms with cells that contain a nucleus as well as membrane-bound organelles)
Two types of microbes — bacteria and archaea — dominate Deep Earth. Among them are millions of distinct types, most yet to be discovered or characterized. This so-called microbial “dark matter” dramatically expands our perspective on the tree of life. Deep Life scientists say about 70% of Earth’s bacteria and archaea live in the subsurface
Deep microbes are often very different from their surface cousins, with life cycles on near-geologic timescales, dining in some cases on nothing more than energy from rocks
The genetic diversity of life below the surface is comparable to or exceeds that above the surface
While subsurface microbial communities differ greatly between environments, certain genera and higher taxonomic groups are ubiquitous — they appear planet-wide
Microbial community richness relates to the age of marine sediments where cells are found — suggesting that in older sediments, food energy has declined over time, reducing the microbial community
The absolute limits of life on Earth in terms of temperature, pressure, and energy availability have yet to be found. The records continually get broken. A frontrunner for Earth’s hottest organism in the natural world is Geogemma barossii, a single-celled organism thriving in hydrothermal vents on the seafloor. Its cells, tiny microscopic spheres, grow and replicate at 121 degrees Celsius (21 degrees hotter than the boiling point of water). Microbial life can survive up to 122°C, the record achieved in a lab culture (by comparison, the record-holding hottest place on Earth’s surface, in an uninhabited Iranian desert, is about 71°C — the temperature of well-done steak)
The record depth at which life has been found in the continental subsurface is approximately 5 km; the record in marine waters is 10.5 km from the ocean surface, a depth of extreme pressure; at 4000 meters depth, for example, the pressure is approximately 400 times greater than at sea level
Scientists have a better understanding of the impact on life in subsurface locations manipulated by humans (e.g., fracked shales, carbon capture and storage)
Ever-increasing accuracy and the declining cost of DNA sequencing, coupled with breakthroughs in deep ocean drilling technologies (pioneered on the Japanese scientific vessel Chikyu, designed to ultimately drill far beneath the seabed in some of the planet’s most seismically-active regions) made it possible for researchers to take their first detailed look at the composition of the deep biosphere.
There are comparable efforts to drill ever deeper beneath continental environments, using sampling devices that maintain pressure to preserve microbial life (none thought to pose any threat or benefit to human health).
To estimate the total mass of Earth’s subcontinental deep life, for example, scientists compiled data on cell concentration and microbial diversity from locations around the globe.
Led by Cara Magnabosco of the Flatiron Institute Center for Computational Biology, New York, and an international team of researchers, subsurface scientists factored in a suite of considerations, including global heat flow, surface temperature, depth and lithology — the physical characteristics of rocks in each location — to estimate that the continental subsurface hosts 2 to 6 × 10^29 cells.
Combined with estimates of subsurface life under the oceans, total global Deep Earth biomass is approximately 15 to 23 petagrams (15 to 23 billion tonnes) of carbon.
Says Mitch Sogin of the Marine Biological Laboratory Woods Hole, USA, co-chair of DCO’s Deep Life community of more than 300 researchers in 34 countries: “Exploring the deep subsurface is akin to exploring the Amazon rainforest. There is life everywhere, and everywhere there’s an awe-inspiring abundance of unexpected and unusual organisms.
“Molecular studies raise the likelihood that microbial dark matter is much more diverse than what we currently know it to be, and the deepest branching lineages challenge the three-domain concept introduced by Carl Woese in 1977. Perhaps we are approaching a nexus where the earliest possible branching patterns might be accessible through deep life investigation.
“Ten years ago, we knew far less about the physiologies of the bacteria and microbes that dominate the subsurface biosphere,” says Karen Lloyd, University of Tennessee at Knoxville, USA. “Today, we know that, in many places, they invest most of their energy to simply maintaining their existence and little into growth, which is a fascinating way to live.
“Today too, we know that subsurface life is common. Ten years ago, we had sampled only a few sites — the kinds of places we’d expect to find life. Now, thanks to ultra-deep sampling, we know we can find them pretty much everywhere, albeit the sampling has obviously reached only an infinitesimally tiny part of the deep biosphere.”
“Our studies of deep biosphere microbes have produced much new knowledge, but also a realization and far greater appreciation of how much we have yet to learn about subsurface life,” says Rick Colwell, Oregon State University, USA. “For example, scientists do not yet know all the ways in which deep subsurface life affects surface life and vice versa. And, for now, we can only marvel at the nature of the metabolisms that allow life to survive under the extremely impoverished and forbidding conditions for life in deep Earth.”
“A decade ago, we had no idea that the rocks beneath our feet could be so vastly inhabited. Experimental investigations told us that microbes could potentially survive to great depth; at that time, we had no evidence, and this has become real ten years later. This is simply fascinating and will surely foster enthusiasm to look for the biotic-abiotic fringe on Earth and elsewhere,” said Isabelle Daniel, University of Lyon 1, France.
Among the many remaining enigmas of deep life on Earth:
Movement: How does deep life spread — laterally through cracks in rocks? Up, down? How can deep life be so similar in South Africa and Seattle, Washington? Did they have similar origins and were separated by plate tectonics, for example? Or do the communities themselves move? What roles do big geological events (such as plate tectonics, earthquakes; creation of large igneous provinces; meteoritic bombardments) play in deep life movements?
Origins: Did life start deep in Earth (either within the crust, near hydrothermal vents, or in subduction zones) then migrate up, toward the sun? Or did life start in a warm little surface pond and migrate down? How do subsurface microbial zombies reproduce, or live without dividing for millions to tens of millions of years?
Energy: Is methane, hydrogen, or natural radiation (from uranium and other elements) the most important energy source for deep life? Which sources of deep energy are most important in different settings? How do the absence of nutrients, and extreme temperatures and pressure, impact microbial distribution and diversity in the subsurface?
“Even in dark and energetically challenging conditions, intraterrestrial ecosystems have uniquely evolved and persisted over millions of years. Expanding our knowledge of deep life will inspire new insights into planetary habitability, leading us to understand why life emerged on our planet and whether life persists in the Martian subsurface and other celestial bodies,” according toFumio Inagaki, Japan Agency for Marine-Earth Science and Technology.
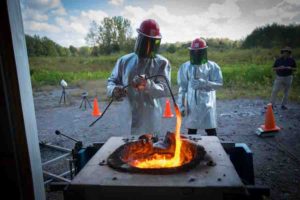
Ingo Sonder, a research scientist at UB’s Center for Geohazards Studies, stirs the molten rock as it melts inside the furnace. Credit: Douglas Levere / University at Buffalo
What happens when lava and water meet? Explosive experiments with humanmade lava are helping to answer this important question.
By cooking up 10-gallon batches of molten rock and injecting them with water, scientists are shedding light on the basic physics of lava-water interactions, which are common in nature but poorly understood.
The project — a long-term, ongoing study led by the University at Buffalo — published its first results on Dec. 10 in the Journal of Geophysical Research (JGR): Solid Earth.
The scientists caution that the number of tests so far is small, so the team will need to conduct more experiments to draw firm conclusions.
The research shows that lava-water encounters can sometimes generate spontaneous explosions when there is at least about a foot of molten rock above the mixing point. In prior, smaller-scale studies that used about a coffee cup’s worth of lava, scientists in Germany found that they needed to apply an independent stimulus — in essence pricking the water within the lava — to trigger a blast.
The results reported in JGR: Solid Earth also point to some preliminary trends, showing that in a series of tests, larger, more brilliant reactions tended to occur when water rushed in more quickly and when lava was held in taller containers. (The team ran a total of 12 experiments in which water injection speeds ranged from about 6 to 30 feet per second, and in which lava was held in insulated steel boxes that ranged in height from about 8 to 18 inches.)
“If you think about a volcanic eruption, there are powerful forces at work, and it’s not a gentle thing,” says lead investigator Ingo Sonder, PhD, research scientist in the Center for Geohazards Studies at UB. “Our experiments are looking at the basic physics of what happens when water gets trapped inside molten rock.”
Sonder will discuss the findings at the 2018 AGU Fall Meeting today.
The study was funded by the National Science Foundation.
Understanding lava-water encounters at real volcanoes
In nature, the presence of water can make volcanic activity more dangerous, such as during past eruptions of Hawaii’s Kilauea and Iceland’s Eyjafjallajökull. But in other cases, the reaction between the two materials is subdued.
Sonder wants to understand why: “Sometimes, when lava encounters water, you see huge, explosive activity. Other times, there is no explosion, and the lava may just cool down and form some interesting shapes. What we are doing is trying to learn about the conditions that cause the most violent reactions.”
Eventually, findings from the long-term project could improve scientists’ ability to assess the risk that volcanoes near ice, lakes, oceans and underground water sources pose to people who live in surrounding communities.
“The research is still in the very early stages, so we have several years of work ahead of us before we’ll able to look at the whole range and combination of factors that influence what happens when lava or magma encounters water,” says Valentine, study co-author and director of the Center for Geohazards Studies at UB.
“However, everything we do is with the intention of making a difference in the real world,” he says. “Understanding basic processes having to do with volcanoes will ultimately help us make better forecasting calls when it comes to eruptions.”
Large-scale volcanic experiments
Lava-water interactions are associated with a phenomenon known as a molten fuel coolant interaction, in which a liquid fuel (a heat source) reacts violently with a liquid coolant. Much of the experimental work in this field has been done in the context of industrial safety, with a focus on understanding potential dangers in nuclear power plants and metal production sites.
The lava-water experiments build on previous research in this area, while focusing on molten rock.
The work takes place at UB’s Geohazards Field Station in Ashford, New York, some 40 miles south of Buffalo. Run by the UB Center for Geohazards Studies, the facility gives scientists a place to conduct large-scale experiments simulating volcanic processes and other hazards. In these tests, researchers can control conditions in a way that isn’t possible at a real volcano, dictating, for example, the shape of the lava column and the speed at which water shoots into it.
To make lava, scientists dump basaltic rock into a high-powered induction furnace. They heat it up for about 4 hours. When the mixture reaches a red-hot 2,400 degrees Fahrenheit, it’s poured into an insulated steel box and injected with two or three jets of water.
Then, a hammer drives a plunger into the mix to help stimulate an explosion. (In some cases, if enough molten rock was present above the injection point, an intense reaction began before the hammer fell).
In addition to identifying some preliminary trends, the published study attests to the wide variety of physical processes that can occur when lava and water meet.
“The system response to water injection varied from mild, evaporation-dominated processes, in which only a little melt was ejected from the container alongside some steam, to stronger reactions with visible steam jets, and with melt domains ejected to several meters height,” the scientists wrote in JGR: Solid Earth.
Breaking the vapor film?
The study did not examine why box height and water injection speed corresponded with the biggest explosions. But Sonder, whose has a background in geosciences and physics, offers some thoughts.
He explains that when a blob of water is trapped by a much hotter substance, the outer edges of the water vaporize, forming a protective film that envelops the rest of the water like a bubble, limiting heat transfer into the water and preventing it from boiling. This is called the Leidenfrost effect.
But when water is injected rapidly into a tall column of lava, the water — which is about three times lighter than the lava — will speed upward and mix with the molten rock more quickly. This may cause the vapor film to destabilize, Sonder says. In this situation, the unprotected water would expand rapidly in volume as it heated up, imposing high stresses on the lava, he says. The result? A violent explosion.
In contrast, when water is injected slowly into shallower pools of lava, the protective vapor film may hold, or the water may reach the lava’s surface or escape as steam before an explosion occurs, Sonder says.
He hopes to explore these theories through future experiments: “Not a lot of work has been done in this field,” he says, “so even some of these basic processes are really not well understood.”
Reference:
Ingo Sonder, Andrew G. Harp, Alison H. Graettinger, Pranabendu Moitra, Greg A. Valentine, Ralf Büttner, Bernd Zimanowski. Meter‐Scale Experiments on Magma‐Water Interaction. Journal of Geophysical Research: Solid Earth, 2018; DOI: 10.1029/2018JB015682
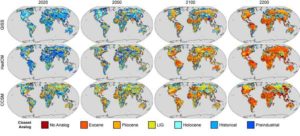
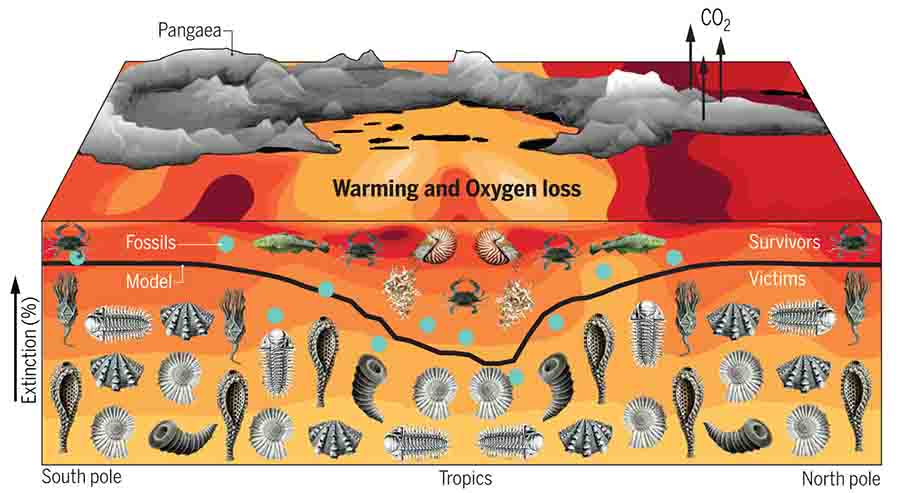
Future climate analogs for the years 2020, 2050, 2100 and 2200 according to three well-established models. If greenhouse gas emissions are not curbed, the study says, the climate will continue to warm until it begins to resemble the Eocene in 2100. Credit: Courtesy of the authors
Our future on Earth may also be our past.
In a study published Monday (Dec. 10, 2018) in the Proceedings of the National Academy of Sciences, researchers show that humans are reversing a long-term cooling trend tracing back at least 50 million years. And it’s taken just two centuries.
By 2030, Earth’s climate is expected to resemble that of the mid-Pliocene, going back more than 3 million years in geologic time. Without reductions in our greenhouse gas emissions, our climates by 2150 could compare to the warm and mostly ice-free Eocene, an epoch that characterized the globe 50 million years ago.
“If we think about the future in terms of the past, where we are going is uncharted territory for human society,” says the study’s lead author, Kevin Burke, who conducted the work while a graduate student in the lab of paleoecologist John “Jack” Williams, professor of geography at the University of Wisconsin-Madison. “We are moving toward very dramatic changes over an extremely rapid time frame, reversing a planetary cooling trend in a matter of centuries.”
All of the species on Earth today had an ancestor that survived the Eocene and the Pliocene, but whether humans and the flora and fauna we are familiar with can adapt to these rapid changes remains to be seen. The accelerated rate of change appears to be faster than anything life on the planet has experienced before.
The new study builds upon work Williams and colleagues first published in 2007, which compared future climate projections to historical climate data from the early 20th century. The new study relies on extensive data about climate conditions to probe much deeper in Earth’s geologic past and expand those comparisons.
“We can use the past as a yardstick to understand the future, which is so different from anything we have experienced in our lifetimes,” says Williams. “People have a hard time projecting what the world will be like five or 10 years from now. This is a tool for predicting that — how we head down those paths, and using deep geologic analogs from Earth’s history to think about changes in time.”
During the Eocene, Earth’s continents were packed more closely together and global temperatures averaged 23.4 degrees Fahrenheit (13 degrees Celsius) warmer than they are today. Dinosaurs had recently gone extinct and the first mammals, like ancestral whales and horses, were spreading across the globe. The Arctic was occupied by swampy forests like those found today in the southern U.S.
In the Pliocene, North and South America joined tectonically, the climate was arid, land bridges allowed animals to spread across continents and the Himalayas formed. Temperatures were between 3.2 and 6.5 degrees Fahrenheit (1.8 to 3.6 degrees Celsius) warmer than they are today.
For the study, Burke and Williams — along with colleagues at the University of Bristol, Columbia University, University of Leeds, NASA Goddard Institute for Space Studies and the National Center for Atmospheric Research — examined the similarities between future climate projections as set forth by the Intergovernmental Panel on Climate Change Fifth Assessment Report and several periods of geologic history.
These included the Early Eocene, the mid-Pliocene, the Last Interglacial (129 to 116 thousand years ago), the mid-Holocene (6,000 years ago), the pre-industrial era (before A.D. 1850) and the early 20th century.
They used Representative Concentration Pathway 8.5 (RCP8.5), which represents a future climate scenario in which we do not mitigate greenhouse gas emissions, and RCP4.5, a scenario in which we moderately reduce greenhouse gas emissions, and climate simulations using three different but well-established models: the Hadley Centre Coupled Model version 3, the Goddard Institute for Space Studies ModelE2-R and the Community Climate System Model.
While not without their flaws, each of these models represents the best available data and state-of-the-art techniques.
Under both scenarios and across each model, compared to previous eras, the Earth’s climate most closely resembled the mid-Pliocene by 2030 (under RCP8.5) or 2040 (under RCP4.5). Under the greenhouse gas stabilization scenario of RCP4.5, the climate then stabilizes at mid-Pliocene-like conditions, but under the higher greenhouse gas emissions of RCP8.5, the climate continues to warm until it begins to resemble the Eocene in 2100, achieving Eocene-like conditions more broadly by 2150.
The models showed these deep-geological climates emerging first from the center of continents and then expanding outward over time. Temperatures rise, precipitation increases, ice caps melt and climates become temperate near the Earth’s poles.
“Madison (Wisconsin) warms up more than Seattle (Washington) does, even though they’re at the same latitude,” Williams explains. “When you read that the world is expected to warm by 3 degrees Celsius this century, in Madison we should expect to roughly double the global average.”
The study also showed that under RCP8.5, “novel” climates emerge across nearly 9 percent of the planet. These are conditions that do not have known geologic or historical precedent and they concentrate in eastern and southeastern Asia, northern Australia and the coastal Americas.
“Based on observational data, we are tracking on the high end of the emissions scenarios, but it’s too soon to tell,” says Burke. “We may be somewhere between RCP4.5 and RCP8.5, though if we increase our climate mitigation efforts — like switching to renewable energy — we could find ourselves closer to the low end.”
About a decade ago, Swedish scientist Johan Rockström and colleagues introduced the idea of “safe operating space,” referring to the climate conditions under which modern agricultural societies developed. By comparing to the deep past, Williams and Burke say, we are able to better understand the planetary boundaries and thresholds that delineate this space.
“The further we move from the Holocene, the greater the potential that we move out of safe operating space,” says Williams, a faculty affiliate with the UW-Madison Nelson Institute Center for Climatic Research. “In the roughly 20 to 25 years I have been working in the field, we have gone from expecting climate change to happen, to detecting the effects, and now, we are seeing that it’s causing harm. People are dying, property is being damaged, we’re seeing intensified fires and intensified storms that can be attributed to climate change. There is more energy in the climate system, leading to more intense events.”
In their paper, the researchers try to strike a balance between alarm and optimism. On the one hand, Earth is headed into the unknown in our children’s and grandchildren’s lifetimes. On the other, life has long proven to be resilient. And, Williams says, in many places we are moving away from fossil fuels toward more sustainable and carbon-free energy sources. But more needs to be done.
“We’ve seen big things happen in Earth’s history — new species evolved, life persists and species survive. But many species will be lost, and we live on this planet,” says Williams. “These are things to be concerned about, so this work points us to how we can use our history and Earth’s history to understand changes today and how we can best adapt.”
Reference:
K. D. Burke, J. W. Williams, M. A. Chandler, A. M. Haywood, D. J. Lunt, B. L. Otto-Bliesner. Pliocene and Eocene provide best analogs for near-future climates. Proceedings of the National Academy of Sciences, 2018; 201809600 DOI: 10.1073/pnas.1809600115
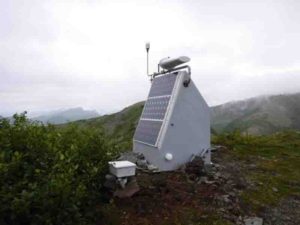
Transportable Array station P19K is one of the closest stations to the Iniskin earthquake origin. Solar panels power the station, and the seismometer is buried in a specially drilled borehole to insulate it from surface noise. Photo taken in 2017 during a service site visit by Incorporated Research Institutions for Seismology (IRIS). IRIS manages the Transportable Array station installation and maintenance. Credit: Doug Bloomquist, IRIS
The 2016 Iniskin earthquake (magnitude 7.1) that shook Anchorage, Alaska, was captured by the seismometers of the EarthScope Transportable Array. This data is helping Geoff Abers, a professor at Cornell University’s Department of Earth and Atmospheric Sciences, and Michael Mann, a graduate student in his group, explore answers to fill crucial gaps in understanding intra-slab earthquakes. Their work may provide insight into the November 30, 2018 magnitude 7.0 earthquake near Anchorage. It could also help improve earthquake hazard assessments in the future.
Intra-slab earthquakes usually occur deep in the earth, within tectonic plates descending into the mantle at subduction zones. Because they are so deep, intra-slab earthquakes can be large magnitude and felt over a broad area; however, they usually don’t exhibit strong seismic wave acceleration or ground motion since the fault causing the earthquake is deep. Iniskin was different.
The Iniskin earthquake originated within the Pacific Plate, which is slowly being forced under the North American Plate. “The Iniskin earthquake was 125 km deep, but caused some very high ground motion that was felt and recorded in Anchorage, and in particular where there’s a dense network of accelerometers. When it occurred in 2016 it was actually the strongest ground shaking in Anchorage since the great 1964 earthquake that destroyed half the town,” said Abers in early November, before the damaging earthquake of November 30. The Iniskin earthquake was more than 270 km from Anchorage.
The magnitude 7.0 earthquake that occurred on November 30 was also an intra-slab earthquake within the subducting Pacific Plate, but it was only 44 km deep and only a few miles from Anchorage. It produced extensive damage, and while initial data are still being processed, it serves as a reminder of the hazard posed by this kind of earthquake.
The Iniskin earthquake provided a prime opportunity to study the mechanics of an intra-slab earthquake, and how local geology can dramatically change the earthquake’s effects. The Iniskin earthquake rattled Anchorage shortly after seismometers from EarthScope’s Transportable Array were installed in southcentral Alaska. The Transportable Array consists of hundreds of seismic stations deployed in a grid; it has leapfrogged its way every two years across swaths of the continent for more than a decade and is currently in Alaska. The grid, with a spacing of about 85 km, covers Alaska from the southeast panhandle to the North Slope.
“We are only able to do this study because the Transportable Array installed high-quality, state-of-the-art instruments in many otherwise inaccessible places,” Mann said.
“We’ve known for some time that you occasionally do get big intra-slab earthquakes and there’s been some concern they are underrepresented globally in hazard estimates in the places in the world where they occur. So this is an opportunity to delve a little bit deeper to try to understand what was going on here,” Abers said.
What caused such unexpected movement from the Iniskin earthquake? Abers and Mann think there are two possible factors based on local geology: one is the temperature of the mantle the seismic waves travel through to reach the surface, and another is that the seismic waves can sometimes ricochet between the layers of a subducting tectonic plate.
Anchorage sits near the edge of the North American Plate, where the continental plate pushes the Pacific Plate down into the mantle. The plate from the surface is cooler, and therefore more solid, than the surrounding mantle, so seismic waves travel faster.
“At very low temperatures the earth is like a bell, it just rings and waves can propagate,” Abers said. “We could only see that for the Iniskin earthquake because the Transportable Array actually deployed stations for the first time west of Anchorage and north of the Alaska Range.”
The Transportable Array allowed a comparison of seismic waves the same distance from the source of the earthquake, but in different directions. North of the Alaska Range, where the distance from the subduction zone means the crust lies above the mantle, the seismic waves have to travel through hot mantle to get to Anchorage. The heated rock is softer and “mushier,” so seismic waves don’t travel as quickly as through cooler crust.
“Those signals are really small compared to the very large signals you’ll see in Anchorage at comparable distances, by a factor of 20 to 50 at the frequencies we care about,” said Abers. “These aren’t subtle effects.”
The other possible reason why the Iniskin earthquake shook the ground so much has to do with the local structure of the crust. Abers and Mann found that at some frequencies, seismic waves seemed to be amplified. The crust is made up of multiple layers of different kinds of rock. If a weaker layer is sandwiched between stronger layers in the sinking crust of the subduction zone, seismic waves may travel up the subducting plate and be caught in the sandwiched layer, bouncing back and forth and amplifying the wave’s energy.
“We’ve known about this problem for a while, but it hasn’t really made it into how hazards are assessed from these earthquakes very clearly, because we haven’t worked out how to determine the parameters,” said Abers. In places such as Anchorage, earthquake hazard assessment may need to include information about the deep earth, tens of miles down, and not just the near-surface geology. Puzzling out what happened during the Iniskin earthquake and possibly the November 30 one, and having good data coverage to compare the earthquakes from different locations, is a step forward for improving hazard assessment for intra-slab earthquakes in the future.
Earth creates its own magnetic field, suggests new research. Credit: TU Wien
Throughout Earth’s long geologic history, the magnetic pole has not remained stable.
For reasons that are still little understood, the Earth’s magnetic field can suddenly – and without warning – weaken, start to shift around, and even completely reverse direction.
Records indicate that over the last 160 million years, the magnetic pole has reversed its polarity at least several hundred times. Called a “geomagnetic field reversal,” this has resulted in the poles swapping positions, with magnetic north becoming magnetic south, and vice versa. The magnetic pole has also undergone what are called “excursions.” During an excursion event, the earth’s magnetic field weakens and begins to drift but does not reverse itself. The field re-strengthens and the poles finally return to their initial position.
UC Santa Cruz geology professor Robert Coe will be presenting his paper, “What We Know and Don’t Know about Reversals” during the upcoming American Geophysical Union (AGU) meeting in Washington, D.C. this December.
Coe is an emeritus professor of geophysics, and has had a long and distinguished career. He has received numerous awards and recognition for his many research accomplishments. He received his Ph.D. at the University of California, Berkeley, and did postgraduate work in Australia before returning to the States where he joined the UC Santa Cruz faculty in 1968. He has made significant contributions in a number of areas, including volcanology, geochemistry, and tectonics. In the 1970s, he developed a method of more accurately measuring the intensity of the magnetic field in rocks – a method that bears his name. Perhaps his most significant contribution, however, has been in paleomagnetism, where he has been a pioneer in the study of magnetic field reversals.
“The Earth’s magnetic field is restless,” said Coe in a recent interview.
Evidence for this restlessness first came to light in the early twentieth century when geologists recognized that certain rocks exhibited magnetism that was different in orientation from the Earth’s then current magnetic field. While given little consideration at the time, geologists eventually acknowledged the significance of this observation and became interested in investigating the phenomenon. A number of influential papers published in the 1960s – including a number of papers authored by Coe – shed considerable light on the process by identifying polarity transitions in both lava flows and sediments.
The process by which rocks get magnetized occurs when they are formed, Coe explained. Scientists know much more about how volcanic rocks become magnetized than they do about sedimentary rocks. As igneous rocks cool, for example, they become magnetized in the direction of the field prevailing at the moment. This process may take a few days or a few years and provides a “snapshot” of the Earth’s magnetic field, he added. Consequently, by studying many different rocks formed during different geologic periods, researchers can create a record of the Earth’s history of magnetic wanderings.
One of the best records of the earth’s magnetic reversals comes from Steens Mountain in southeastern Oregon. Here, a series of overlapping Miocene-age basaltic lava flows record a complex history of several thousand years of Earth’s geomagnetic history. Significantly, the Steens Mountain record bears evidence of a complete magnetic reversal that occurred at an extraordinarily rapid pace (between 3 and 8 degrees per day) some15.5 million years ago.
Unfortunately, magnetic reversals can be far more complex than even the best, most detailed paleomagnetic record on hand. Volcanic records are limited by the “discontinuous and episodic nature of volcanic eruptions,” Coe said. To better understand Earth’s geomagnetic history, Coe emphasized, we need to have excellent records not only from volcanic contexts but also from sedimentary data.
Highly detailed deep-sea cores recently obtained during drilling operations in the North Atlantic might provide the lynchpin. These were obtained from a vertical section of the ocean floor and provide a continuous sequence of magnetized strata.
“The North Atlantic records give one hope,” Coe said.
Today, much has been learned about reversals in the Earth’s magnetic field.
It is now known, for example, that magnetic reversals happen much more frequently than previously surmised, and that they can often occur at incredibly rapid clips. It is also known that the last complete reversal, which occurred 770,000 years ago, occurred over a span of less than 100 years.
Much more, however, is still to be learned.
Most importantly, geologists continue to debate the cause of these reversals.
“A magnetic reversal certainly has a large random or chaotic aspect,” Coe said. “And it’s active over many time scales.”
Although a number of theories have been posited, the prevailing explanation suggests that reversals are ultimately tied to the Earth’s convective motion.
“The Earth’s magnetic field comes from a dynamo-like action arising from the motion of the metallic fluids in the outer core,” he said.
Scientists have also debated whether a reversal can cause major hazards, especially to technology. Some have argued that a reversal would cause the failure of the worldwide electronic and communication systems. The question, however, is controversial and remains unanswered.
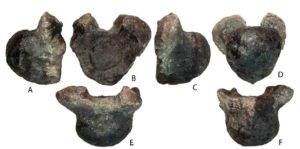
Volgatitan simbirskiensis anterior caudal vertebra (holotype), in right lateral (A), anterior (B), left lateral (C), posterior (D), dorsal (E), and ventral (F) views; photographs. Credit: Alexander Averianov and Vladimir Efimov
Paleontologists from Russia have described a new dinosaur, the Volgatitan. Seven of its fossilized vertebrae, buried in the ground for about 130 million years, were found on the banks of the Volga, not far from the village of Slantsevy Rudnik, five kilometers from Ulyanovsk. The study has been published in the latest issue of Biological Communications.
The Volgatitan belongs to the group of sauropods—giant herbivorous dinosaurs with a long necks and tails, which lived about 200 to 65 million years ago. Weighing around 17 tons, the ancient reptile from the banks of the Volga was not the largest among its relatives. The scientists described it from seven caudal vertebrae. The bones belonged to an adult dinosaur characterized by neural arches (parts of the vertebrae protecting the nerves and blood vessels), which completely merged with the bodies of the vertebrae.
The remains of the dinosaur were discovered near the village of Slantsevy Rudnik. This is where, in 1982, Vladimir Efimov discovered three large vertebrae that had fallen out of a high cliff. Later, in 1984-1987, three nodules of limestone fell off, which contained the remaining vertebrae. In his works, the head of the Undorovsky Paleontology Museum called the unusual finds “giant vertebrae of unknown taxonomic affiliation.”
Alexander Averianov said, “In the early 1990s, Vladimir Efimov showed photographs of the bones to Lev Nesov, a well-known Leningrad paleontologist. Lev Nesov thought that the vertebrae belonged to sauropods, giant herbivorous dinosaurs. In 1997, Vladimir Efimov published a preliminary note about this find in the Paleontological Journal. He referred to the vertebrae as a sauropod of the Brachiosauridae family. Last July, I finally managed to visit him in Undory and study the bones, and also managed to determine that they belonged to the new taxon of titanosaurs.”
The dinosaur received a scientific name—Volgatitan simbirskiensis. It comes from the Volga River and the city of Simbirsk (currently, Ulyanovsk). Titans are ancient Greek gods known for their large size. Therefore, according to a paleontological tradition, this word is used in many scientific names of sauropods from the group of titanosaurs. It is also part of the name of the group.
Today, along with the Volgatitan from Russia, 12 valid dinosaur taxa have been described. There are only three sauropods among them: Tengrisaurus starkovi, Sibirotitan astrosacralis and Volgatitan simbirskiensis. The first two are the first sauropods in Russia, which were also studied by St. Petersburg University scientists in 2017. According to Aleksandr Averianov, the description of dinosaur taxa in recent years has become possible due to progress in understanding the anatomy and phylogeny of dinosaurs. In addition, the Russian sauropod allowed scientists to learn more about how these species of ancient reptiles had lived and developed.
“Previously, it was believed that the evolution of titanosaurs took place mainly in South America, with some taxa moving into North America, Europe and Asia only in the Late Cretaceous,” explained the St. Petersburg University professor. In Asia, representatives of a broader group of titanosauriform, such as the recently described Siberian titanium, dominated in the early Cretaceous. However, the recent description of the Tengrisaurus from the Early Cretaceous of Transbaikal Region and the finding of the Volgatitan indicate that titanosaurs in the Early Cretaceous were distributed much more widely; and, perhaps, important stages of their evolution took place in Eastern Europe and Asia.”
Reference:
et al, The oldest titanosaurian sauropod of the Northern Hemisphere, Biological Communications (2018). DOI: 10.21638/spbu03.2018.301
Scientists long believed that Earth’s lower mantle was composed of Bridgmanite (Mg,Fe)SiO3 and magnesiowüstite (Mg,Fe)O, in which Fe2+ dwells. This view changed when experiments showed that Fe2+ simply can’t exist at the pressure and temperature of the lower mantle. What is present is Fe3+. The two phases (Mg,Fe)SiO3 and (Mg,Fe)O both shed Fe2+ and, in turn, MgSiO3 and MgO remain. However, what mineral hosts Fe3+ had remained unknown.
Now, scientists have a possible answer: Maohokite, a newly discovered high-pressure mineral. It may be what composes the Earth’s lower mantle along with Bridgmanite MgSiO3 and magnesiowüstite MgO. The study reporting this new mineral was published in Meteoritics & Planetary Science.
Maohokite was discovered by Chen Ming’s team from the Guangzhou Institute of Geochemistry of the Chinese Academy of Sciences and SHU Jinfu from the Center for High Pressure Science and Technology Advanced Research. The mineral was named after Hokwang Mao, in honor of his great contribution to high-pressure research.
The mineral and its name have been approved by the Commission on New Minerals, Nomenclature and Classification of the International Mineralogical Association under the designator IMA 2017-047.
Natural minerals can be divided into two types: low-pressure minerals and high-pressure minerals, depending on their formation pressures. The pressure and temperature required for the formation of high-pressure minerals can only be provided by the environment of the mantle or the hypervelocity collision between celestial bodies.
Maohokite is the second case. It was found in shock-metamorphosed rocks from the Xiuyan impact crater in China.
This high-pressure mineral was formed from the decomposition of ferromagnesian carbonate via a self-oxidation-reduction reaction at a temperature >900 degrees C and impact pressure >25 GPa (a pressure range found at depths more than 670km below Earth’s surface). In this reaction, Fe2+ oxidizes into Fe3+ and then later combines with Mg2+ to form maohokite, thus making it a possible important constituent of the lower mantle.
Maohokite, with a composition of MgFe2O4, has an orthorhombic CaFe2O4-type structure. The existing mineralogical model of the Earth’s mantle shows that the ferromagnesian lower mantle is mainly composed of Bridgmanite (Mg,Fe)SiO3 and magnesiowüstite (Mg,Fe)O. Therefore, the fact that Maohokite contains Mg and Fe, two major components of the lower mantle, only makes the case stronger that Maokohite is a key mineral in the lower mantle.
Reference:
Ming Chen et al. Maohokite, a post-spinel polymorph of MgFe2 O4 in shocked gneiss from the Xiuyan crater in China, Meteoritics & Planetary Science (2018). DOI: 10.1111/maps.13222
The largest extinction in Earth’s history marked the end of the Permian period, some 252 million years ago. Long before dinosaurs, our planet was populated with plants and animals that were mostly obliterated after a series of massive volcanic eruptions in Siberia.
Fossils in ancient seafloor rocks display a thriving and diverse marine ecosystem, then a swath of corpses. Some 96 percent of marine species were wiped out during the “Great Dying,” followed by millions of years when life had to multiply and diversify once more.
What has been debated until now is exactly what made the oceans inhospitable to life—the high acidity of the water, metal and sulfide poisoning, a complete lack of oxygen, or simply higher temperatures.
New research from the University of Washington and Stanford University combines models of ocean conditions and animal metabolism with published lab data and paleoceanographic records to show that the Permian mass extinction in the oceans was caused by global warming that left animals unable to breathe. As temperatures rose and the metabolism of marine animals sped up, the warmer waters could not hold enough oxygen for them to survive.
The study is published in the Dec. 7 issue of Science.
“This is the first time that we have made a mechanistic prediction about what caused the extinction that can be directly tested with the fossil record, which then allows us to make predictions about the causes of extinction in the future,” said first author Justin Penn, a UW doctoral student in oceanography.
Researchers ran a climate model with Earth’s configuration during the Permian, when the land masses were combined in the supercontinent of Pangaea. Before ongoing volcanic eruptions in Siberia created a greenhouse-gas planet, oceans had temperatures and oxygen levels similar to today’s. The researchers then raised greenhouse gases in the model to the level required to make tropical ocean temperatures at the surface some 10 degrees Celsius (20 degrees Fahrenheit) higher, matching conditions at that time.
The model reproduces the resulting dramatic changes in the oceans. Oceans lost about 80 percent of their oxygen. About half the oceans’ seafloor, mostly at deeper depths, became completely oxygen-free.
To analyze the effects on marine species, the researchers considered the varying oxygen and temperature sensitivities of 61 modern marine species—including crustaceans, fish, shellfish, corals and sharks—using published lab measurements. The tolerance of modern animals to high temperature and low oxygen is expected to be similar to Permian animals because they had evolved under similar environmental conditions. The researchers then combined the species’ traits with the paleoclimate simulations to predict the geography of the extinction.
“Very few marine organisms stayed in the same habitats they were living in—it was either flee or perish,” said second author Curtis Deutsch, a UW associate professor of oceanography.
The model shows the hardest hit were organisms most sensitive to oxygen found far from the tropics. Many species that lived in the tropics also went extinct in the model, but it predicts that high-latitude species, especially those with high oxygen demands, were nearly completely wiped out.
To test this prediction, co-authors Jonathan Payne and Erik Sperling at Stanford analyzed late-Permian fossil distributions from the Paleoceanography Database, a virtual archive of published fossil collections. The fossil record shows where species were before the extinction, and which were wiped out completely or restricted to a fraction of their former habitat.
The fossil record confirms that species far from the equator suffered most during the event.
“The signature of that kill mechanism, climate warming and oxygen loss, is this geographic pattern that’s predicted by the model and then discovered in the fossils,” Penn said. “The agreement between the two indicates this mechanism of climate warming and oxygen loss was a primary cause of the extinction.”
The study builds on previous work led by Deutsch showing that as oceans warm, marine animals’ metabolism speeds up, meaning they require more oxygen, while warmer water holds less. That earlier study shows how warmer oceans push animals away from the tropics.
The new study combines the changing ocean conditions with various animals’ metabolic needs at different temperatures. Results show that the most severe effects of oxygen deprivation are for species living near the poles.
“Since tropical organisms’ metabolisms were already adapted to fairly warm, lower-oxygen conditions, they could move away from the tropics and find the same conditions somewhere else,” Deutsch said. “But if an organism was adapted for a cold, oxygen-rich environment, then those conditions ceased to exist in the shallow oceans.”
The so-called “dead zones” that are completely devoid of oxygen were mostly below depths where species were living, and played a smaller role in the survival rates.”At the end of the day, it turned out that the size of the dead zones really doesn’t seem to be the key thing for the extinction,” Deutsch said. “We often think about anoxia, the complete lack of oxygen, as the condition you need to get widespread uninhabitability. But when you look at the tolerance for low oxygen, most organisms can be excluded from seawater at oxygen levels that aren’t anywhere close to anoxic.”
Warming leading to insufficient oxygen explains more than half of the marine diversity losses. The authors say that other changes, such as acidification or shifts in the productivity of photosynthetic organisms, likely acted as additional causes.
The situation in the late Permian—increasing greenhouse gases in the atmosphere that create warmer temperatures on Earth—is similar to today.
“Under a business-as-usual emissions scenarios, by 2100 warming in the upper ocean will have approached 20 percent of warming in the late Permian, and by the year 2300 it will reach between 35 and 50 percent,” Penn said. “This study highlights the potential for a mass extinction arising from a similar mechanism under anthropogenic climate change.”
Reference: J.L. Penn el al., “Temperature-dependent hypoxia explains biogeography and severity of end-Permian marine mass extinction,” Science (2018). DOI: 10.1126/science.aat1327
A fossil trilobite with its complex eye. These ancient animals were inferred to have minimally possessed four opsins, like many modern arthropods, and should have therefore been able to see colors. Credit: University of Bristol
An international group of scientists led by researchers from the University of Bristol have advanced our understanding of how ancient animals saw the world by combining the study of fossils and genetics.
Ancestors of insects and crustaceans that lived more than 500 million years ago in the Cambrian period were some of the earliest active predators, but not much is known about how their eyes were adapted for hunting.
Work published in the Proceedings of the Royal Society B today suggests that when fossil and genetic data are assessed in tandem, previously inaccessible and exciting conclusions about long dead species can be made.
By examining the morphological characteristics of fossils’ eyes, alongside the genetic visual pigment clues, a cross-disciplinary team led by a collaboration between the University of Bristol’s Davide Pisani, Professor of Phylogenomics in the School of Earth Sciences and Nicholas Roberts, Professor of Sensory Ecology in the School of Biological Sciences, were able to find that ancient predators with more complex eyes are likely to have seen in colour.
Professor Pisani remarked: “Being able to combine fossil and genetic data in this way is a really exciting frontier of modern palaeontological and biological research. Vision is key to many animals’ behaviour and ecology, and understanding how extinct animals perceived their environment will help enormously to clarify how they evolved.”
By calculating the time of emergence of different visual pigments, and then comparing them to the inferred age of origin of key fossil lineages, the researchers were able to work out the number of pigments likely to have been possessed by different fossil species. They found that fossil animals with more complex eyes appeared to have more visual pigments, and that the great predators of the Cambrian period may have been able to see in colour.
Dr James Fleming, Professor Pisani and Roberts’ former PhD student, explained: “Animal genomes and therefore opsin genes (constituting the base of different visual pigments) evolve by processes of gene duplication. The opsin and the pigment that existed before the duplication is like a parent, and the two new opsins (and pigments) that emerge from the duplication process are like children on a family tree.
“We calculated the birth dates of these children and this allowed understanding of what the ancient world must have seemed like to the animals that occupied it. We found that while some of the fossils we considered had only one pigment and were monochromat, i.e. they saw the world as if looking into a black and white TV, forms with more complex eyes, like iconic trilobites, had many pigments and most likely saw their world in colours.”
The combinations of complex eyes and multiple kinds of visual pigments are what allows animals to distinguish between different objects based on colour alone — what we know as colour vision.
Professor Roberts commented: “It is remarkable to see how in only a very few million years the view those animals’ had of their world changed from greys to the colourful world we see today.”
The project involved scientists from all across the world — from the UK as well as Denmark, Italy, Korea and Japan, where Dr Fleming has now moved to work as a postdoctoral researcher. Each of them brought their own specialities to this multidisciplinary work, providing expertise in genetics, vision, taxonomy and palaeontology.
Reference:
James F. Fleming, Reinhardt Møbjerg Kristensen, Martin Vinther Sørensen, Tae-Yoon S. Park, Kazuharu Arakawa, Mark Blaxter, Lorena Rebecchi, Roberto Guidetti, Tom A. Williams, Nicholas W. Roberts, Jakob Vinther, Davide Pisani. Molecular palaeontology illuminates the evolution of ecdysozoan vision. Proceedings of the Royal Society B: Biological Sciences, 2018; 285 (1892): 20182180 DOI: 10.1098/rspb.2018.2180