Pompeii-like, a 300-million-year-old tropical forest was preserved in ash when a volcano erupted in what is today northern China. A new study by University of Pennsylvania paleobotanist Hermann Pfefferkorn and colleagues presents a reconstruction of this fossilized forest, lending insight into the ecology and climate of its time.
Pfefferkorn, a professor in Penn’s Department of Earth and Environmental Science, collaborated on the work with three Chinese colleagues: Jun Wang of the Chinese Academy of Sciences, Yi Zhang of Shenyang Normal University and Zhuo Feng of Yunnan University.
Their paper was published this week in the Early Edition of the Proceedings of the National Academy of Sciences.
The study site, located near Wuda, China, is unique as it gives a snapshot of a moment in time. Because volcanic ash covered a large expanse of forest in the course of only a few days, the plants were preserved as they fell, in many cases in the exact locations where they grew.
“It’s marvelously preserved,” Pfefferkorn said. “We can stand there and find a branch with the leaves attached, and then we find the next branch and the next branch and the next branch. And then we find the stump from the same tree. That’s really exciting.”
The researchers also found some smaller trees with leaves, branches, trunk and cones intact, preserved in their entirety.
Due to nearby coal-mining activities unearthing large tracts of rock, the size of the researchers’ study plots is also unusual. They were able to examine a total of 1,000 m2 of the ash layer in three different sites located near one another, an area considered large enough to meaningfully characterize the local paleoecology.
The fact that the coal beds exist is a legacy of the ancient forests, which were peat-depositing tropical forests. The peat beds, pressurized over time, transformed into the coal deposits.
The scientists were able to date the ash layer to approximately 298 million years ago. That falls at the beginning of a geologic period called the Permian, during which Earth’s continental plates were still moving toward each other to form the supercontinent Pangea. North America and Europe were fused together, and China existed as two smaller continents. All overlapped the equator and thus had tropical climates.
At that time, Earth’s climate was comparable to what it is today, making it of interest to researchers like Pfefferkorn who look at ancient climate patterns to help understand contemporary climate variations.
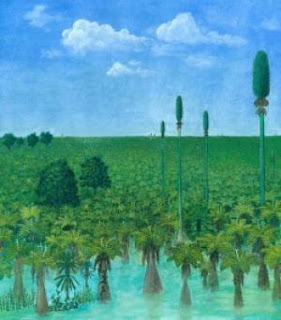
In each of the three study sites, Pfefferkorn and collaborators counted and mapped the fossilized plants they encountered.In all, they identified six groups of trees. Tree ferns formed a lower canopy while much taller trees — Sigillaria and Cordaites — soared to 80 feet above the ground. The researchers also found nearly complete specimens of a group of trees called Noeggerathiales. These extinct spore-bearing trees, relatives of ferns, had been identified from sites in North America and Europe but appeared to be much more common in these Asian sites.
They also observed that the three sites were somewhat different from one another in plant composition. In one site, for example, Noeggerathiales were fairly uncommon, while they made up the dominant plant type in another site. The researchers worked with painter Ren Yugao to depict accurate reconstructions of all three sites.
“This is now the baseline,” Pfefferkorn said. “Any other finds, which are normally much less complete, have to be evaluated based on what we determined here.”
The findings are indeed “firsts” on many counts.
“This is the first such forest reconstruction in Asia for any time interval, it’s the first of a peat forest for this time interval and it’s the first with Noeggerathiales as a dominant group,” Pfefferkorn said.
Because the site captures just one moment in Earth’s history, Pfefferkorn noted that it alone cannot explain how climate changes affected life on Earth. But it helps provide valuable context.
“It’s like Pompeii: Pompeii gives us deep insight into Roman culture, but it doesn’t say anything about Roman history in and of itself,” Pfefferkorn said. “But on the other hand, it elucidates the time before and the time after. This finding is similar. It’s a time capsule and therefore it allows us now to interpret what happened before or after much better.”
The study was supported by the Chinese Academy of Science, the National Basic Research Program of China, the National Natural Science Foundation of China and the University of Pennsylvania.
Note : The above story is reprinted from materials provided by University of Pennsylvania.