Studying Ice Cores from West Antarctica for Clues as to Why the Earth Began to Emerge from the Ice Age
A slice of ice from 17,500 years ago can help scientists figure out how Earth came out of the Ice Age and how climate change can happen in the future, according to South Dakota State University Professor Jihong Cole-Dai of the chemistry and biochemistry department. He and graduate student, Kari Peterson, spent nearly a month in Antarctica during Christmas break as part of the West Antarctica Ice Sheet Divide Ice Core project.
The main goal of the ice core project, Cole-Dai said “was to get an ice core more than two miles deep to give us nearly 70,000 years of history of the Earth’s climate.”
The National Science Foundation-funded project, which began eight years ago, involves more than 20 universities and national laboratories. The SDSU Ice Core and Environment Chemistry Lab, headed by Cole-Dai, has been a part of the project since 2006.
It took eight years to build the field camp and to collect the original ice core, because the harsh Antarctica conditions allow only a 60-day window each year in which to work. That task was completed in January 2012.
“This year was significant because of the completion of additional field work,” Cole-Dai said. Scientists wanted more ice to do further work on specific time periods. To do so, the team retrieved additional ice from five spots along the original ice core hole, while also leaving the lower portion of the hole intact.
“That in itself was quite a challenge and accomplishment,” Cole-Dai said. His former postdoctoral researcher, David Ferris, was part of the drilling team. Ferris became part of the project through the SDSU Ice Core and Environment Chemistry Lab during his doctoral work.
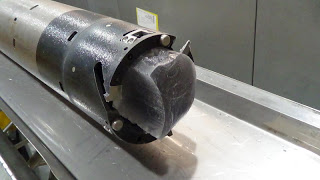
To accomplish this task, engineers had to design a special bit and drilling apparatus that used an actuator to push off to the side of the original borehole, explained Tony Wendricks, project coordinator for the Ice Drilling Design and Operations group at the University of Wisconsin, Madison. Ferris has worked on ice drilling team for three years and on the core handling team for one year.
“It’s a tricky thing — to maintain the parent hole,” Wendricks said.
“It’s never been done anywhere in the world,” Cole-Dai said. “You have a tool hanging at the end of a two-mile-long rope or cable and you want it to do very precise things, to move one degree in the direction you want and to bring the ice out.”
When the drillers brought up cylinders of ice, they handed them over to the core-processing team, Cole-Dai said. He and Peterson were on the team that took measurements and logged the information regarding the cores from the designated time periods. Then they packaged the ice cylinders to transport to the National Ice Core Laboratory in Denver.
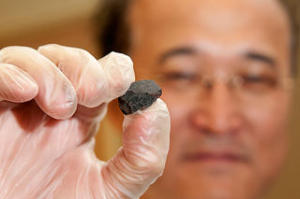
Once the cores have been processed in Denver, each university lab will get its slice of the ice for analysis, which will likely take a year, Cole-Dai said. His SDSU team will work on a section of ice from 17,500 years ago that offers clues as to why Earth began to emerge from the Ice Age.
At that point in history, Cole-Dai said, “something big happened — a large volcanic eruption or a number of them.” Others speculate that it might have been an object from outer space that struck Earth.
“We want to gather more information from the ice and hopefully it will lead to better ideas, or support some of the ideas and disprove some of the others,” Cole-Dai said.
For this research, Cole-Dai’s team collaborates with a lab at the University of California, San Diego. SDSU analyzes the trace chemicals, while the California lab does the isotope measurements. Cole-Dai has three doctoral students working in his lab; two of them have been to Antarctica.
Researchers found fluoride, which is commonly associated with a volcanic eruption, in a previous ice core, explained Peterson. However, the levels were higher than those expected from an eruption. For her dissertation, Peterson will analyze the fluoride levels in the replicate core to confirm the original results.
In addition, Peterson took samples from a snow pit more than eight feet deep to look for signs of two volcanic eruptions a couple of years ago, one in Indonesia and one in Africa. “The eruptions were pretty small but very powerful,” Peterson said, “so the plume may have gotten into the stratosphere.”
When this happens, Cole-Dai explained, the wind patterns can carry the volcanic material to the entire world, including both poles. Because the snow at the Western Antarctica drill site never melts, the ice contains a history of the changing atmospheric environment and of the dynamic climate. As for the location to drill the ice core in the center of West Antarctica, Cole-Dai explained, “It’s like the continental divide. Ice flows away from this point; it doesn’t get ice from other locations.”
By measuring the kinds and quantities of chemicals in the ice cores and determining how those change over time, scientists can study the events that lead to global climate change, Cole-Dai said. This will lead to a better understanding of how human activities can influence climate. By studying Earth’s past, Cole-Dai said, “we can better predict the future.”
Note : The above story is reprinted from materials provided by South Dakota State University.