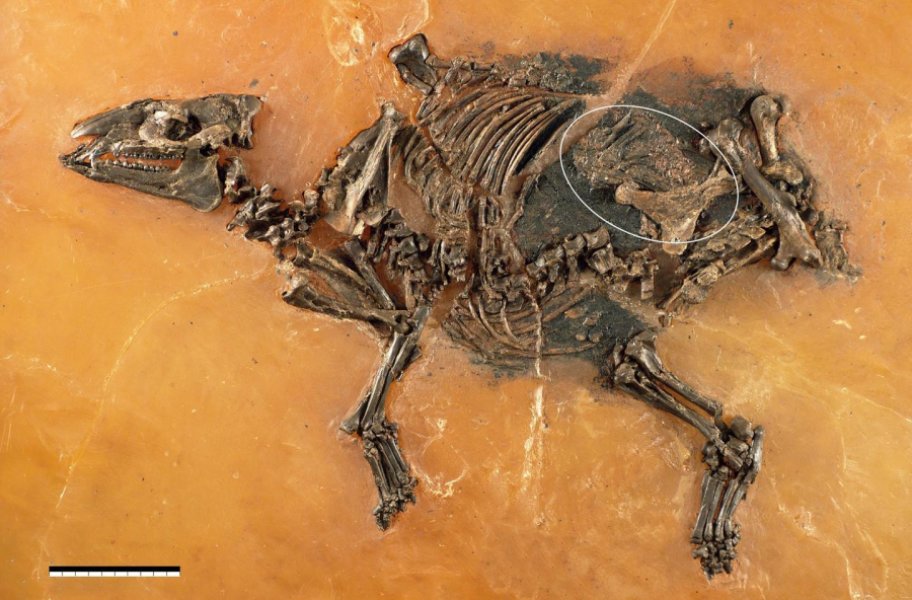
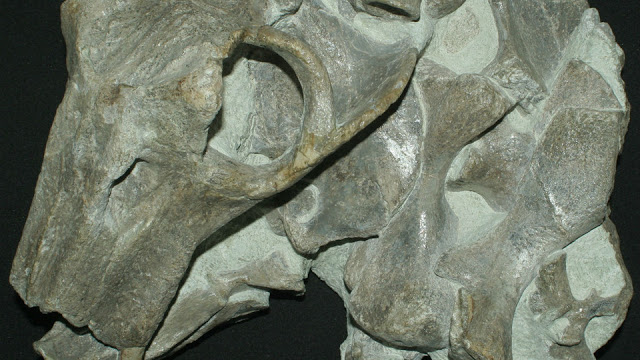
Skeleton of a mare of Eurohippus messelensis is shown with fetus (white ellipse). The specimen was discovered and excavated by a team of the Senckenberg Research Institute Frankfurt at the Grube Messel (Germany; inv. no. SMF-ME-11034), shoulder height ca. 30 cm, scale = 10 cm. Credit: Franzen et al. Photo: Senckenberg Forschungsinstitut Frankfurt, Sven Tränkner; Creative Commons Attribution License
A 48 million year-old horse-like equoid fetus has been discovered at the Messel pit near Frankfurt, Germany according to a study published October 7, 2015 in the open-access journal PLOS ONE by Jens Lorenz Franzen from Senckenberg Research Institute Frankfurt, Germany, and Naturhistorisches Museum Basel, Switzerland, and colleagues.
The authors of this study completed their investigation of the fetus from a 48 million year-old horse-like equoid uncovered near Frankfurt, Germany in 2000. They evaluated the bones and anatomy and used scanning electronic microscopy (SEM) and high-resolution micro-x-ray to describe the ~12.5 cm fetus.
The fetus appears to be well-preserved, with almost all bones present and connected, except for the skull, which appears to have been crushed. The well-preserved condition of the fossil allowed the researchers to reconstruct the original appearance and position of the fetus. They estimate that the mare may have died shortly before birth, but don’t believe the death was related to birth.
The authors also found preserved soft tissue, like the uteroplacenta and one broad uterine ligament, which may represent the earliest fossil record of the uterine system of a placental mammal. Applying SEM, the authors discovered a bacterial lawn replacing the soft tissues, as is common with other specimens found in that area. The observable details correspond largely with living mares, which lead the authors to posit that the reproductive system was already highly developed during the Paleocene, and possibly even earlier.
Reference:
Franzen JL, Aurich C, Habersetzer J. Description of a Well Preserved Fetus of the European Eocene Equoid Eurohippus messelensis. PLoS ONE, 2015 DOI: 10.1371/journal.pone.0137985
Note: The above post is reprinted from materials provided by PLOS.
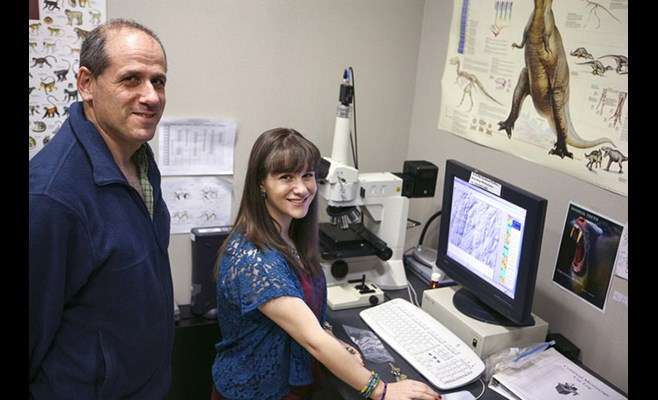
Mariel Williams Young with faculty mentor Peter Ungar.
Researchers at the University of Arkansas have established that pits and scratches on the teeth of mammal fossils give important clues to the diet of creatures that lived millions of years ago. Two new studies, both involving undergraduate Honors College students, analyze the effect of environmental change on the teeth of existing species, and may shed light on the evolutionary fossil record.
Peter Ungar, Distinguished Professor and chair of the anthropology department, mentored the students and is a coauthor on both papers.
Both studies compare dental wear of species in environments that are relatively undisturbed to those in environments that have been disturbed by human development.
“Human disturbance, from an ecological perspective, is not a great thing, but for folks like me, they’re really cool natural experiments,” Peter Ungar said. “If we can understand the reaction of living animals, including primates, to environmental change, then we can apply that to the past, to understand evolution. Conversely, we can use our understanding of how things change on evolutionary time scales to get a better appreciation for our effects on the environment today.”
Tracking lemurs in Madagascar
The paper “Mechanical food properties and dental topography differentiate three populations of Lemur catta in southwest Madagascar” was recently accepted by the Journal of Human Evolution, the premier journal in the field.
Emily Fitzgerald (B.A. in anthropology, magna cum laude, ’12) and Andrea Riemenschneider (B.A. in anthropology, cum laude, ’13), who were undergraduate honors students at the time, used data collected in Madagascar by Frank Cuozzo and Michelle Sauther. Since 2003 Cuozzo and Sauther have caught and made molds of the teeth of ring-tailed lemurs across a variety of habitats.
Building on research by first author Nayuta Yamashita, Fitzgerald and Riemenschneider made high-resolution casts of the molds, then used a laser scanner to make 3-D models of the teeth, which they analyzed using global-information system software. Their findings confirmed different patterns of wear in different settings.
Lemurs in disturbed areas were most heavily impacted, wearing their teeth “down to nubbins – we’re not entirely sure why,” Ungar said. This finding could help scientists interpret wear-related tooth shape changes more generally.
Comparing capuchin and howler monkeys in the Brazilian Amazon
In “Environmental Perturbations Can be Detected Through Microwear Texture Analysis in Two Platyrrhine Species From Brazilian Amazonia,” recently published in the American Journal of Primatology, Almudena Estalrrich, a doctoral exchange student from Spain, and Mariel Williams Young (B.A. in anthropology and Spanish, magna cum laude, with a minor in psychology, ’13), then an undergraduate Honors College student, analyzed the effects of habitat variation on capuchin and howler monkeys.
Each species was sampled from environments ranging from minimally disturbed to an area that had been deforested with the construction of a hydroelectric dam.
Young used a confocal microscope to zoom in on a very small part of the tooth – the wear area where the upper and lower teeth come into contact. The team predicted that capuchins, which eat nuts and berries, would be more impacted by environmental disturbance than howler monkeys, which eat leaves.
Their findings confirmed this prediction, and established that dental microwear texture analysis is an effective tool to detect subtle differences in diets among living primates. Studies like this one, which use well-documented specimens with differences in habitats, suggest that subtle changes in microwear may shed light on habitat-forced diet changes in the fossil record.
Peter Ungar has worked with dozens of Honors College students in the past 20 years, and several have published their undergraduate research in peer-reviewed journals.
“Honors students are bread and butter for me,” Ungar said. “I couldn’t get done what I get done, research-wise, without their help.”
“It feels great to have a publication early in my career,” said Mariel Young, who completed a master’s degree in human evolutionary studies at Cambridge and is now pursuing a doctoral degree in human evolutionary biology at Harvard. Young was awarded the Gates Cambridge Scholarship and NSF Graduate Fellowship, and credits her success to research with Ungar: “These two awards have had a huge impact on my career, and my initial research at U of A in Dr. Ungar’s lab is definitely what set me on the path toward achieving them.”
“We’re very proud of these three alumni, and pleased that, yet again, undergraduate thesis research conducted by our Honors College students has been published in top journals,” said Lynda Coon, dean of the Honors College.
Reference:
“Environmental perturbations can be detected through microwear texture analysis in two platyrrhine species from Brazilian Amazonia.” Am. J. Primatol.. DOI: 10.1002/ajp.22461
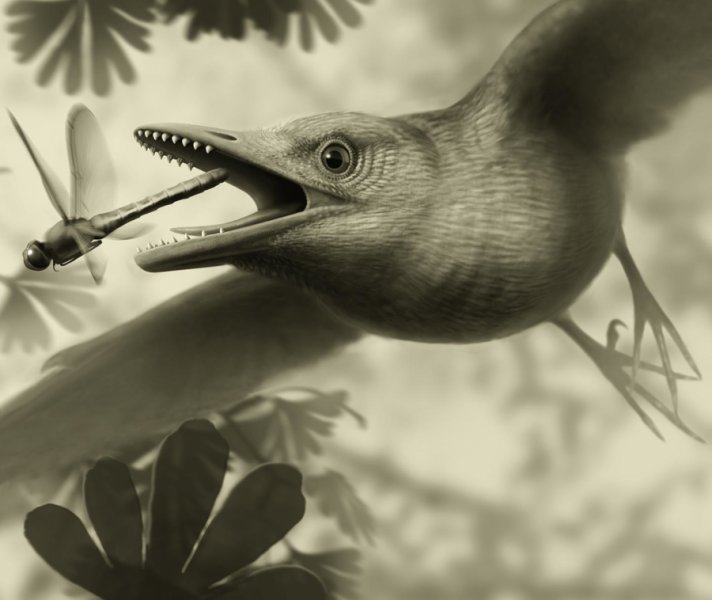
A new paper documents the intricate arrangement of the muscles and ligaments that controlled the main feathers of the wing of an ancient bird, supporting the notion that at least some of the most ancient birds performed aerodynamic feats in a fashion similar to those of many living birds. Credit: Stephanie Abramowicz
Birds have an enormously long evolutionary history: The earliest of them, the famed Archaeopteryx, lived 150 million years ago in what is today southern Germany. However, whether these early birds were capable of flying — and if so, how well — has remained shrouded in scientific controversy. A new discovery published in the journal Scientific Reports documents the intricate arrangement of the muscles and ligaments that controlled the main feathers of the wing of an ancient bird, supporting the notion that at least some of the most ancient birds performed aerodynamic feats in a fashion similar to those of many living birds.
An international team of Spanish paleontologists and NHM’s Director of the Dinosaur Institute, Dr. Luis M. Chiappe, studied the exceptionally preserved wing of a 125-million-year-old bird from central Spain. Beyond the bones preserved in the fossil, the tiny wing of this ancient bird reveals details of a complex network of muscles that in modern birds controls the fine adjustments of the wing’s main feathers, allowing birds to master the sky.
“The anatomical match between the muscle network preserved in the fossil and those that characterize the wings of living birds strongly indicates that some of the earliest birds were capable of aerodynamic prowess like many present-day birds,” said Chiappe, the investigation’s senior scientist.
“It is very surprising that despite being skeletally quite different from their modern counterparts, these primitive birds show striking similarities in their soft anatomy,” said Guillermo Navalón, a doctorate candidate at the University of Bristol in the United Kingdom and lead author of the report.
Ancient birds may have flown over the heads of dinosaurs but some aspects of the precise flight modes of these early fliers still remain unclear. “The new fossil provides us with a unique glimpse into the anatomy of the wing of the birds that lived amongst some of the largest dinosaurs,” said Chiappe. “Fossils such as this are allowing scientists to dissect the most intricate aspects of the early evolution of the flight of birds.” Other members of the research team included Dr. Jesús Marugán-Lobón, Dr. José Luis Sanz, and Dr. Ángela D. Buscalioni from Madrid’s Universidad Autónoma in Spain.
Reference:
Guillermo Navalón, Jesús Marugán-Lobón, Luis M. Chiappe, José Luis Sanz, Ángela D. Buscalioni. Soft-tissue and dermal arrangement in the wing of an Early Cretaceous bird: Implications for the evolution of avian flight. Scientific Reports, 2015; 5: 14864 DOI: 10.1038/srep14864
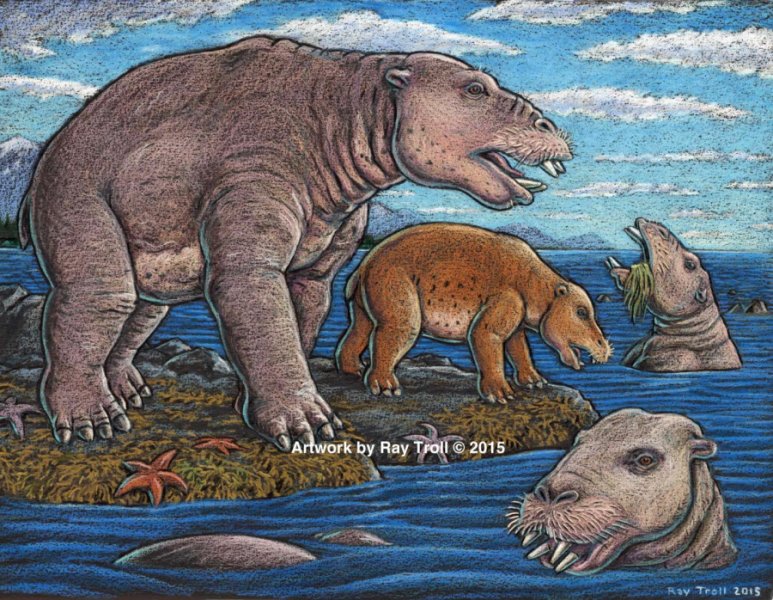
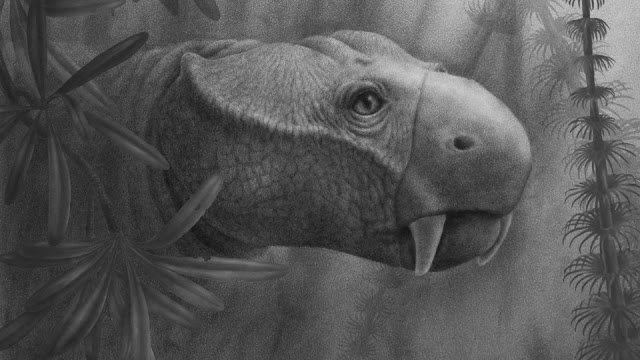
Discovery of the new genus and species from Unalaska indicates the desmostylian group was a successful group that was larger and more diverse than previously known. Credit: Artist: Ray Troll
The identification of a new species belonging to the marine mammal group Desmostylia has intensified the rare animal’s brief mysterious journey through prehistoric time, finds a new study.
A big, hippo-sized animal with a long snout and tusks — the new species, 23 million years old, has a unique tooth and jaw structure that indicates it was not only a vegetarian, but literally sucked vegetation from shorelines like a vacuum cleaner, said vertebrate paleontologist and study co-author Louis L. Jacobs, Southern Methodist University, Dallas.
But unlike other marine mammals alive today — such as whales, seals and sea cows — desmostylians went totally extinct. Desmostylians, every single species combined, lived in an interval between 33 million and 10 million years ago.
Their strange columnar teeth and odd style of eating don’t occur in any other mammal, The new specimens — from at least four individuals — were recovered from Unalaska, an Aleutian island in the North Pacific.
While alive, the creatures lived in what is now Unalaska’s Dutch Harbor, where fishing boats depart on Discovery channel’s “Deadliest Catch” reality TV show.
“The new animal — when compared to one of a different species from Japan — made us realize that desmos do not chew like any other animal,” said Jacobs, a professor of earth sciences. “They clench their teeth, root up plants and suck them in.”
To eat, the animals buttressed their lower jaw with their teeth against the upper jaw, and used the powerful muscles that attached there, along with the shape of the roof of their mouth, to suction-feed vegetation from coastal bottoms. Big muscles in the neck would help to power their tusks, and big muscles in the throat would help with suction.
“No other mammal eats like that,” Jacobs said. “The enamel rings on the teeth show wear and polish, but they don’t reveal consistent patterns related to habitual chewing motions.”
The new specimens also represent a new genus — meaning desmostylians in the same family diverged from one another in key physical characteristics, particularly the tooth and jaw structure, said Jacobs, who is one of 10 scientists collaborating on the research.
Discovery of a new genus and species indicates the desmostylian group was larger and more diverse than previously known, said paleontologist and co-author Anthony Fiorillo, vice president of research and collections and chief curator at the Perot Museum of Nature and Science, Dallas, and an adjunct research professor at SMU.
“Our new study shows that though this group of strange and extinct mammals was short-lived, it was a successful group with greater biodiversity than had been previously realized,” said Fiorillo.
Unique from other marine mammals in their diet, eating, lifespan
A large, stocky-limbed mammal, desmos’ modern relatives remain a mystery. They’ve been linked previously to manatees, horses and elephants.
Compared to other mammals, desmos were latecomers and didn’t appear on earth until fairly recently — 33 million years ago. Also unusual for mammals, they survived a mere 23 million years, dying out 10 million years ago.
Unlike whales and seals, but like manatees, desmos were vegetarians. They rooted around coastlines, ripping up vegetation, such as marine algae, sea grass and other near-shore plants.
They probably swam like polar bears, using their strong front limbs to power along, Jacobs said. They walked on land a bit, lumbering like a sloth.
Adult desmostylians were large enough to be relatively safe from predators.
The authors report their discoveries in a special volume of the international paleobiology journal, Historical Biology.
The research was funded by the Perot Museum of Nature and Science, U.S. National Park Service — Alaska Region Office, and SMU’s Institute for the Study of Earth and Man.
Home was the North Pacific, on wave-battered “Deadliest Catch” island
The newest desmo made its home on Unalaska Island, the farthest north of any occurrence of the group, which only lived along the shores of the North Pacific.
“That’s the only place they’re known in the world — from Baja, California, up along the west coast of North America, around the Alaska Peninsula, the storm-battered Aleutian Islands, to Russia’s Kamchatka Peninsula and Sakhalin Island, to the Japanese islands,” Jacobs said.
The Unalaska fossils represent at least four individuals, and one is a baby.
“The baby tells us they had a breeding population up there,” Jacobs said. “They must have stayed in sheltered areas to protect the young from surf and currents.”
In addition, “the baby also tells us that this area along the Alaska coast was biologically productive enough to make it a good place for raising a family,” said Fiorillo.
Just as cattle assemble in a herd, and a group of fish is a school, multiple desmostylians constitute a “troll” — a designation selected by Jacobs to honor Alaskan Ray Troll, the artist who has depicted desmos most.
To make the Unalaska and Japanese specimens readily available to scientists anywhere in the world, each fossil was modeled as a 3-D image to reconstruct the skull and provide interactive animations of the fossils, said Michael J. Polcyn, research associate and director of SMU’s Digital Earth Sciences Laboratory.
Journey from the land to the ocean to a quarry
The first Unalaska fossils were discovered in the 1950s in a rock quarry during U.S. Geological Survey mapping.
Others found more recently were on display at the Ounalashka Corporation headquarters. Those specimens were offered to Fiorillo and Jacobs for study after Fiorillo gave a public presentation to the community on his work in Alaska.
“The fruits of that lecture were that it started the networking with the community, which in turn led us to a small, but very important collection of fossils that had been unearthed in the town when they built a school a few years earlier,” Fiorillo said. “The fossils were shipped to the Perot Museum of Nature and Science for preparation in our lab and those fossils are the basis for our work now.”
From there, the researchers discovered that the fossils were a new genus and species.
The researchers named the new mammal Ounalashkastylus tomidai. “Ounalashka,” means “near the peninsula” in the Aleut language of the indigenous people of the Aleutian Islands.
“Stylus” is from the Latin for “column” and refers to the shape of cusps in the teeth.
“Tomida” honors distinguished Japanese vertebrate paleontologist Yukimitsu Tomida.
The article appears in a special volume of Historical Biology to honor the career accomplishments of Tomida upon his retirement from the Department of Geology and Paleontology in Tokyo’s National Museum of Nature and Science.
Video
New fossils from the Aleutian Islands intensify the mystery surrounding a toothy, hippopotamus-sized mammal unique to the North Pacific. An oddball creature, it suction-fed shoreline vegetation, say paleontologists from Southern Methodist University and the Perot Museum of Nature and Science, Dallas.
Reference:
Kentaro Chiba, Anthony R. Fiorillo, Louis L. Jacobs, Yuri Kimura, Yoshitsugu Kobayashi, Naoki Kohno, Yosuke Nishida, Michael J. Polcyn, Kohei Tanaka. A new desmostylian mammal from Unalaska (USA) and the robust Sanjussen jaw from Hokkaido (Japan), with comments on feeding in derived desmostylids. Historical Biology, 2015; 28 (1-2): 289 DOI: 10.1080/08912963.2015.1046718
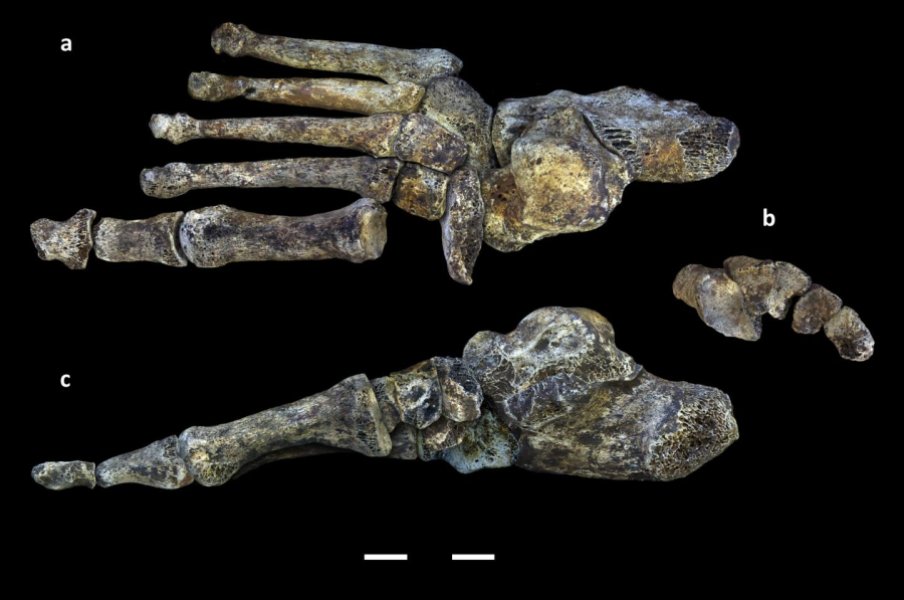
This is a digital reconstruction of the foot of Homo naledi. Credit: Copyright Nature Communications
A new study on Homo naledi, the extinct human relative whose remains were discovered in a South African cave and introduced to the world last month, suggests that although its feet were the most human-like part of its body, H. naledi didn’t use them to walk in the same way we do. Detailed analysis of 107 foot bones indicates that H. naledi was well adapted for standing and walking on two feet, but that it also was likely comfortable climbing trees. The work, published in Nature Communications today with a concurrent study on H. naledi’s hands, provides insight into the skeletal form and function that may have characterized early members of our genus.
“Homo naledi’s foot is far more advanced than other parts of its body, for instance, its shoulders, skull, or pelvis,” said William Harcourt-Smith, lead author of the new paper, resident research associate in the American Museum of Natural History’s Division of Paleontology, and assistant professor at CUNY’s Lehman College. “Quite obviously, having a very human-like foot was advantageous to this creature because it was the foot that lost its primitive, or ape-like, features first. That can tell us a great deal in terms of the selective pressures this species was facing.”
Modern humans (Homo sapiens) and extinct species including Homo neanderthalensis, Homo erectus, Homo habilis, and Homo naledi are part of the Homo genus. The Homo genus and the Australopithecus genus (extinct, close relatives of Homo) are referred to as hominins.
Walking upright is one of the defining features of the human lineage, and as feet are the only structure that make contact with the ground in bipeds, they can tell us a lot about our ancient relatives’ way of moving. In the Dinaledi Chamber of the Rising Star cave system in South Africa, the H. naledi excavation team recovered at least one specimen from almost every single bone in the new species’ foot. These bones represent at least five individuals–two juveniles and three adults–including one nearly complete foot.
Analysis of these bones has shown that the foot bones look much more like human bones than chimpanzee bones, except for two major areas: the toes of H. naledi’s foot were more curved and their feet were generally flatter than seen in the average modern human. Despite the close similarity in the foot structure, H. naledi likely did not walk exactly like us, the researchers say. Clues from other parts of its body–long and curved fingers, and a more ape-like shoulder joint–paint a picture of a creature that was undoubtedly bipedal but also a tree climber.
“This species has a unique combination of traits below the neck, and that adds another type of bipedalism to our record of human evolution,” Harcourt-Smith said. “There were lots of different experiments happening within hominins–it wasn’t just a linear route to how we walk today. We are a messy lineage, and not just in our skulls and our teeth. We’re messy in the way we moved around.”
Because the H. naledi fossils have not yet been dated, researchers don’t know how this form of bipedalism fits into our family tree.
“Regardless of age, this species is going to cause a paradigm shift in the way we think about human evolution, not only in the behavioral implications–which are fascinating–but in morphological and anatomical terms,” Harcourt-Smith said.
Reference:
W. E. H. Harcourt-Smith, Z. Throckmorton, K. A. Congdon, B. Zipfel, A. S. Deane, M. S. M. Drapeau, S. E. Churchill, L. R. Berger, J. M. DeSilva. The foot of Homo naledi. Nature Communications, 2015; 6: 8432 DOI: 10.1038/ncomms9432
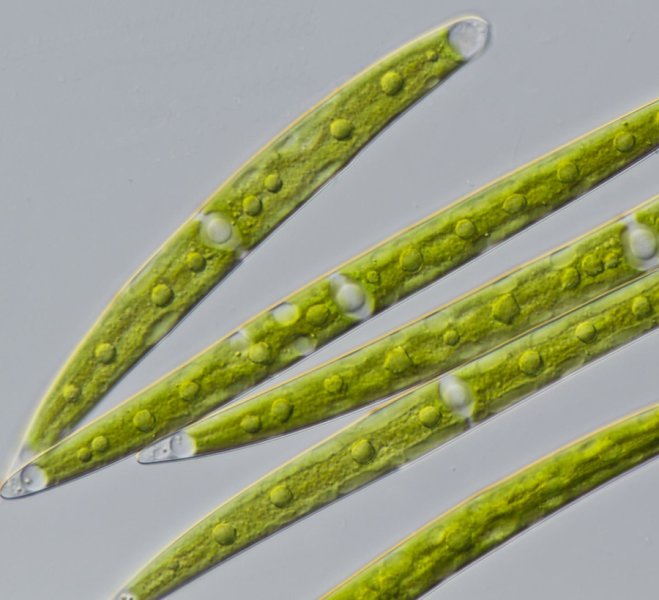
Closterium strigosum is one of the green algae the scientists analyzed. Credit: Michael Melkonian
A team of scientists led by Dr Pierre-Marc Delaux (John Innes Centre / University of Wisconsin, Madison) has solved a long-running mystery about the first stages of plant life on earth.
The team of scientists from the John Innes Centre, the University of Wisconsin — Madison and other international collaborators, has discovered how an ancient alga was able to inhabit land, before it went on to evolve into the world’s first plant and colonise the earth.
Up until now it had been assumed that the alga evolved the capability to source essential nutrients for its survival after it arrived on land by forming a close association with a beneficial fungi called arbuscular mycorrhiza (AM), which still exists today and which helps plant roots obtain nutrients and water from soil in exchange for carbon. The previous discovery of 450 million year old fossilised spores similar to the spores of the AM fungi suggests this fungi would have been present in the environment encountered by the first land plants. Remnants of prehistoric fungi have also been found inside the cells of the oldest plant macro-fossils, reinforcing this idea. However, scientists were not clear how the algal ancestor of land plants could have survived long enough to mediate a quid pro quo arrangement with a fungi. This new finding points to the alga developing this crucial capability while still living in the earth’s oceans!
Dr Delaux and colleagues analysed DNA and RNA of some of the earliest known land plants and green algae and found evidence that their shared algal ancestor living in the Earth’s waters already possessed the set of genes, or symbiotic pathways, it needed to detect and interact with the beneficial AM fungi.
The team of scientists believes this capability was pivotal in enabling the alga to survive out of the water and to colonise the earth. By working with the fungi to find sustenance, the alga was able to buy time to adapt and evolve in a very different and seemingly infertile environment.
Dr Delaux said: “At some point 450 million years ago, alga from the earth’s waters splashed up on to barren land. Somehow it survived and took root, a watershed moment that kick-started the evolution of life on earth. Our discovery shows for the first time that the alga already knew how to survive on land while it was still in the water. Without the development of this pre-adapted capability in alga, the earth could be a very different place today.
“This finding has filled a gap in our collective knowledge about the origins of life on earth. None of this would have been possible without the dedication of a world-wide team of scientists including a tremendous contribution from the 1KP initiative led by Gane KS Wong .”
Professor Jean-Michel Ané, from the University of Wisconsin said: “The surprise was finding the mechanisms in algae which allow plants to interact with symbiotic fungi. Nobody has studied beneficial associations in these algae.”
This research was funded by the Biotechnology and Biological Sciences Research Council (BBSRC) and the US based National Science Federation.
Reference:
Pierre-Marc Delaux, Guru V. Radhakrishnan, Dhileepkumar Jayaraman, Jitender Cheema, Mathilde Malbreil, Jeremy D. Volkening, Hiroyuki Sekimoto, Tomoaki Nishiyama, Michael Melkonian, Lisa Pokorny, Carl J. Rothfels, Heike Winter Sederoff, Dennis W. Stevenson, Barbara Surek, Yong Zhang, Michael R. Sussman, Christophe Dunand, Richard J. Morris, Christophe Roux, Gane Ka-Shu Wong, Giles E. D. Oldroyd, Jean-Michel Ané. Algal ancestor of land plants was preadapted for symbiosis. Proceedings of the National Academy of Sciences, 2015; 201515426 DOI: 10.1073/pnas.1515426112
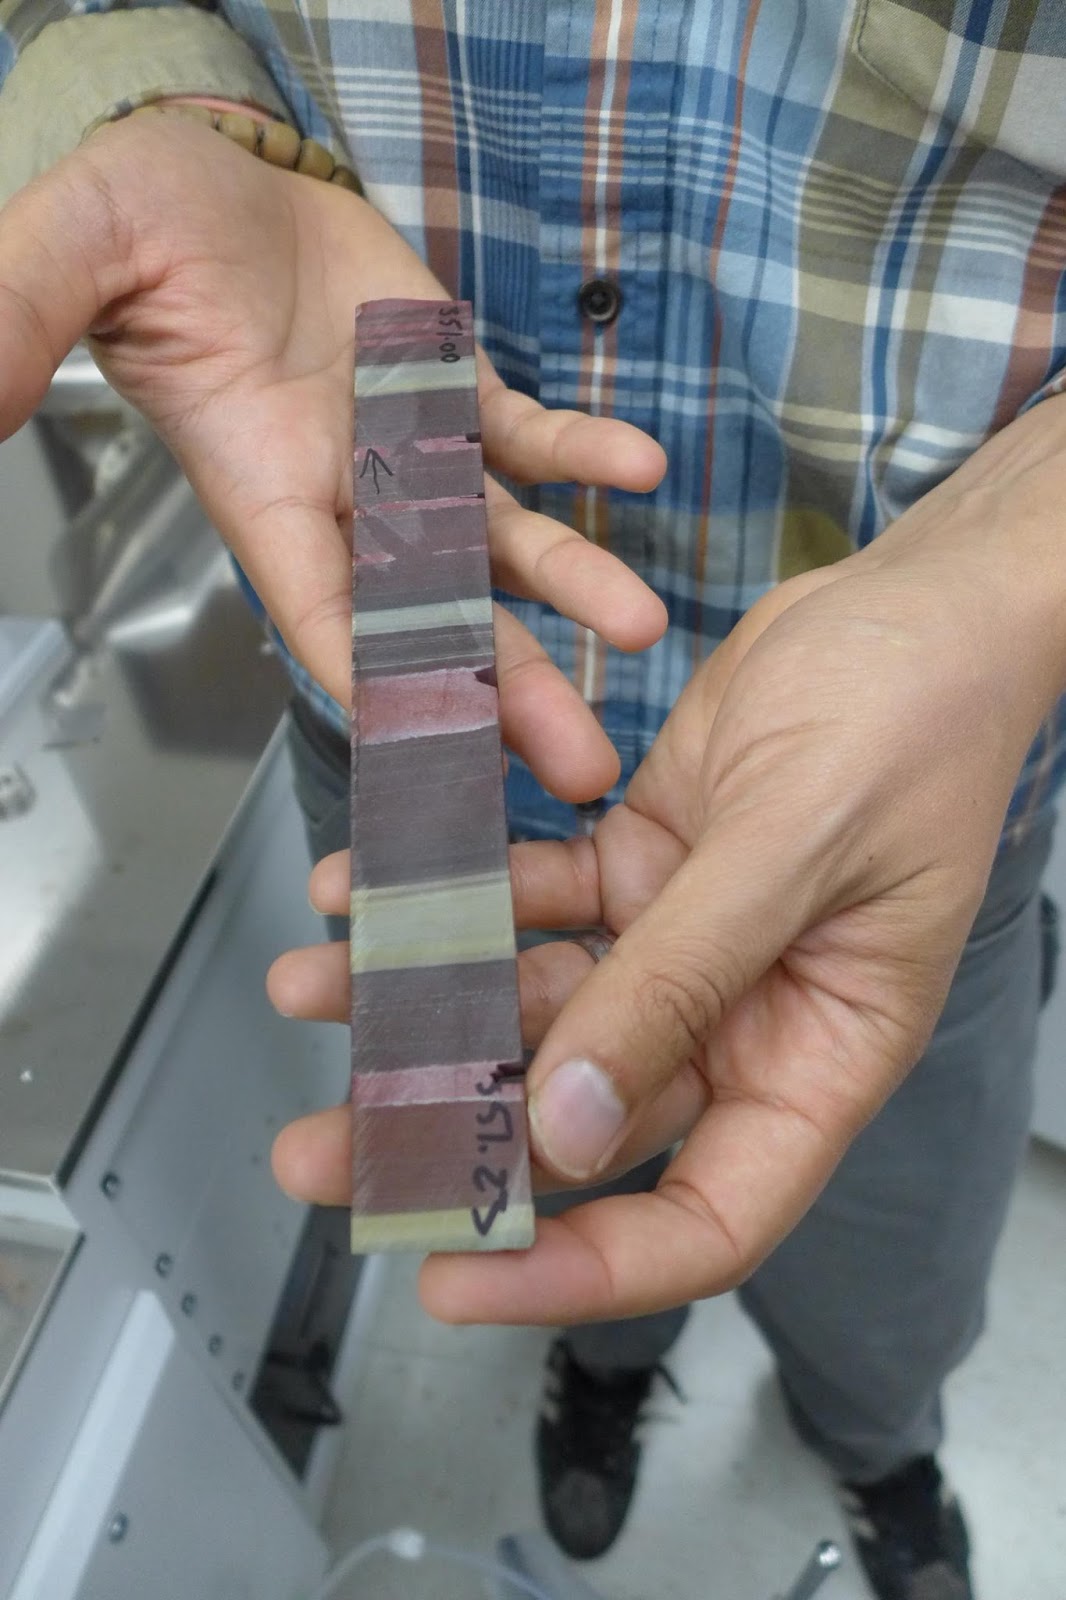
Aaron Satkoski, a scientist in the UW-Madison Geoscience Department, holds a sample sawn from a 3.23-billion-year-old rock core sample found in South Africa. The bands show different types of sediment falling to the ocean floor and solidifying into rock. The sample provides the earliest known evidence for oxygenic photosynthesis. Credit: David Tenenbaum/University of Wisconsin-Madison
A new study shows that iron-bearing rocks that formed at the ocean floor 3.2 billion years ago carry unmistakable evidence of oxygen. The only logical source for that oxygen is the earliest known example of photosynthesis by living organisms, say University of Wisconsin-Madison geoscientists.
“Rock from 3.4 billion years ago showed that the ocean contained basically no free oxygen,” says Clark Johnson, professor of geoscience at UW-Madison and a member of the NASA Astrobiology Institute. “Recent work has shown a small rise in oxygen at 3 billion years. The rocks we studied are 3.23 billion years old, and quite well preserved, and we believe they show definite signs for oxygen in the oceans much earlier than previous discoveries.”
The most reasonable candidate for liberating the oxygen found in the iron oxide is cyanobacteria, primitive photosynthetic organisms that lived in the ancient ocean. The earliest evidence for life now dates back 3.5 billion years, so oxygenic photosynthesis could have evolved relatively soon after life itself.
Until recently, the conventional wisdom in geology held that oxygen was rare until the “great oxygenation event,” 2.4 to 2.2 billion years ago.
The rocks under study, called jasper, made of iron oxide and quartz, show regular striations caused by composition changes in the sediment that formed them. To detect oxygen, the UW-Madison scientists measured iron isotopes with a sophisticated mass spectrometer, hoping to determine how much oxygen was needed to form the iron oxides.
“Iron oxides contained in the fine-grained, deep sediment that formed below the level of wave disturbance formed in the water with very little oxygen,” says first author Aaron Satkoski, an assistant scientist in the Geoscience Department. But the grainier rock that formed from shallow, wave-stirred sediment looks rusty, and contains iron oxide that required much more oxygen to form.
The visual evidence was supported by measurements of iron isotopes, Satkoski said.
The study was funded by NASA and published in Earth and Planetary Science Letters.
The samples, provided by University of Johannesburg collaborator Nicolas Beukes, were native to a geologically stable region in eastern South Africa.
Because the samples came from a single drill core, the scientists cannot prove that photosynthesis was widespread at the time, but once it evolved, it probably spread. “There was evolutionary pressure to develop oxygenic photosynthesis,” says Johnson. “Once you make cellular machinery that is complicated enough to do that, your energy supply is inexhaustible. You only need sun, water and carbon dioxide to live.”
Other organisms developed forms of photosynthesis that did not liberate oxygen, but they relied on minerals dissolved in hot groundwater — a far less abundant source than ocean water, Johnson adds. And although oxygen was definitely present in the shallow ocean 3.2 billion years ago, the concentration was only estimated at about 0.1 percent of that found in today’s oceans.
Confirmation of the iron results came from studies of uranium and its decay products in the samples, says co-author Brian Beard, a senior scientist at UW-Madison. “Uranium is only soluble in the oxidized form, so the uranium in the sediment had to contain oxygen when the rock solidified.”
Measurements of lead formed from the radioactive decay of uranium showed that the uranium entered the rock sample 3.2 billion years ago. “This was an independent check that the uranium wasn’t added recently. It’s as old as the rock; it’s original material,” Beard says.
“We are trying to define the age when oxygenic photosynthesis by bacteria started happening,” he says. “Cyanobacteria could live in shallow water, doing photosynthesis, generating oxygen, but oxygen was not necessarily in the atmosphere or the deep ocean.”
However, photosynthesis was a nifty trick, and sooner or later it started to spread, Johnson says. “Once life gets oxygenic photosynthesis, the sky is the limit. There is no reason to expect that it would not go everywhere.”
Daniel Fisher, director of the U-M Museum of Paleontology and leader of the dig near Chelsea. Fisher is a professor in the Department of Earth and Environmental Sciences and in the Department of Ecology and Evolutionary Biology. Credit: Daryl Marshke, Michigan Photography
An ancient mammoth unearthed in a farmer’s field southwest of Ann Arbor this week may provide clues about the lives of early humans in the region.
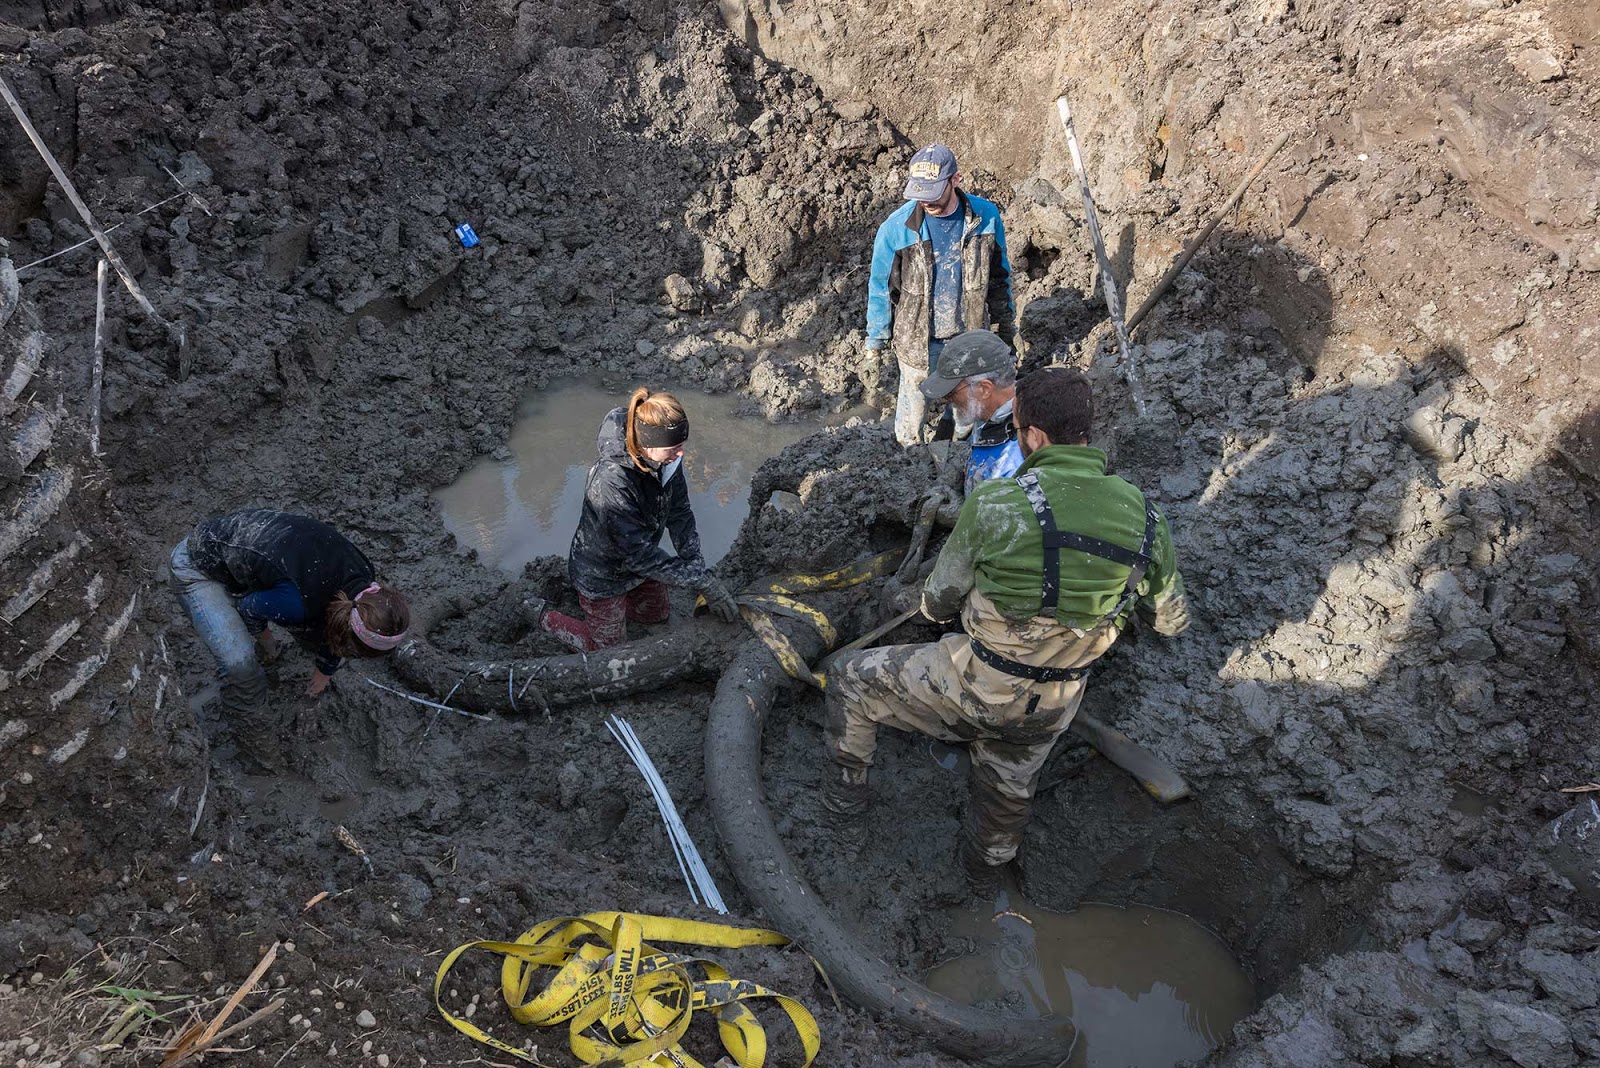
A team of University of Michigan paleontologists and an excavator who donated his time worked all day at the site in Lima Township, roughly 10 miles southwest of Ann Arbor and several miles from the town of Chelsea. They were able to recover about 20 percent of the animal’s bones, including the skull and two tusks, numerous vertebrae and ribs, the pelvis and both shoulder blades.
The bones are from an adult male mammoth that likely lived 11,700 to 15,000 years ago, though the remains have not yet been dated, said U-M paleontologist Daniel Fisher, who led the dig. The site holds “excellent evidence of human activity” associated with the mammoth remains, he said.
“We think that humans were here and may have butchered and stashed the meat so that they could come back later for it,” said Fisher, director of the U-M Museum of Paleontology and a professor in the Department of Earth and Environmental Sciences and the Department of Ecology and Evolutionary Biology.
Mammoths and mastodons—another elephant-like prehistoric creature—once roamed North America before disappearing about 11,700 years ago. Over the years, the remains of about 300 mastodons and 30 mammoths have been recovered in Michigan, Fisher said.
“We get one or two calls like this a year, but most of them are mastodons,” he said.
Most of the mammoth finds in Michigan are not as complete as the remains uncovered by the U-M team, Fisher said.
The team’s working hypothesis is that ancient humans placed the mammoth remains in a pond for storage. Caching mammoth meat in ponds for later use is a strategy that Fisher said he has encountered at other sites in the region.
Evidence supporting that idea includes three basketball-sized boulders recovered next to the mammoth remains. The boulders may have been used to anchor the carcass in a pond.
The researchers also recovered a small stone flake that may have been used as a cutting tool next to one of the tusks. And the neck vertebrae were not scattered randomly, as is normally the case following a natural death, but were arrayed in their correct anatomical sequence, as if someone had “chopped a big chunk out of the body and placed it in the pond for storage,” Fisher said.
The first step toward confirming this hypothesis would be to wash the bones and look for cut marks that indicate butchering.
The date that humans arrived in the Americas is unclear and is the topic of heated debate among archaeologists. Depending on the age of the Lima County mammoth and confirmation of the suspected links to human hunters or scavengers, this week’s find could help push back the date for human habitation in what is now Southeast Michigan.
The first bones were uncovered earlier this week when farmer and property owner James Bristle was installing drainage pipe at a low spot in a wheat field surrounded by soybeans. A backhoe digging a trench uncovered a roughly 3-foot-long bone that was later identified as part of a mammoth pelvis.
“We didn’t know what it was, but we knew it was certainly a lot bigger than a cow bone,” said Bristle, as he watched the mammoth skull and tusks being uncovered in a roughly 10-foot-deep excavation pit carved from gray-brown clay.
Bristle contacted the U-M Museum of Paleontology and Fisher, who has excavated roughly 30 mammoths and mastodons in North America over the past 36 years.
Bristle said the discovery is both exciting and disruptive. But he said he’s confident that he made the right decision.
“When my 5-year-old grandson came over and saw the pelvis, he just stood there with his jaw wide open and stared. He was in awe,” Bristle said. “So I think this was the right thing to do.”
Video
An ancient mammoth unearthed in a farmer’s field southwest of Ann Arbor this week may provide clues about the lives of early humans in the region.
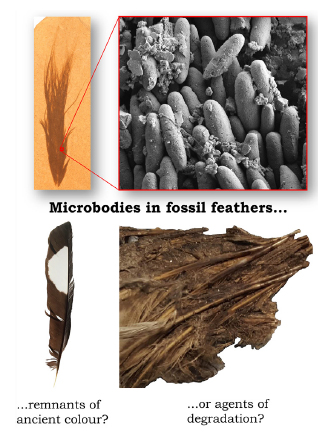
The color of dinosaurs is a fascinating topic, and in recent years the discovery of melanosomes – small, pigment-filled sacs – associated with fossilized dinosaur feathers has given rise to all sorts of speculation about our prehistoric pals, from the hue of their plumage to color’s impact on behavior.
It all sounds wonderful – but how do we know that the melanosomes found in the fossils are actually melanosomes and not something else, like leftover impressions from the microbes (some of which also make melanin) that coated the feather during its decay and preservation? And if they are melanosomes, how can we be sure that the melanin they contained was the only color expression mechanism present?
With current methods, which rely heavily on electron microscopy, it’s hard to be sure. Scientists can identify the shapes and sizes of the melanosomes, and sometimes even the outer texture produced by the grains of pigment within, but images don’t give the full story. Fortunately, advances in molecular analysis are giving paleontologists tools that can help them determine exactly what those shapes mean.
NC State paleontologist Mary Schweitzer became an expert on molecular paleontology when she found soft tissue preserved in a fossilized T. rex femur. Since then, she’s explored ways to use molecular analytical techniques in order to discover whether tissues, cells and proteins can persist through the fossilization process. Now, in a paper published in BioEssays, Schweitzer, doctoral candidate Alison Moyer and co-author Johan Lindgren from Lund University in Sweden outline the challenges that face researchers who want to determine dinosaur color. They suggest ways that molecular analysis can be brought to bear on color preservation in dinosaur feathers and urge other researchers to go the extra mile before claiming color.
“The primary evidence for melanosomes has been shape – elongate or round,” Schweitzer says. “But microbes can also be elongate or round. And the majority of ‘colored dinosaur’ papers aren’t looking at the microbodies themselves. Instead, they measure round or elongate impressions, or voids, left by the bodies in some unidentified, amorphous material. Other researchers claim these bodies must be the color-imparting melanosomes, because melanin is such a tough, resistant molecule. But what they show is that voids remain when the melanosomes decay. So doesn’t that mean the material holding the ‘voids’ is more resistant than melanin? I’m interested in how we can test that theory.
“One way is by looking for keratin. Feathers contain keratin. Melanosomes are buried deep within the feather tissue, not on the surface, and they are covered with keratin, which is a very tough protein that has been shown to persist through time. If they are melanosomes, then that amorphous material should be keratin. Why not use molecular analysis to confirm the presence of keratin as well as melanin?”
Moyer’s earlier experiments show that microbes grow on top of feathers as they decay, and they are distributed in the same pattern as published “melanosome” images. Schweitzer and Moyer argue that the same types of analysis could be used to show that the melanosomes belonged to the original animal, not to the microbes that colonized it after death. Time-of-flight secondary ion mass spectrometry (ToF-SIMS) was pioneered by co-author Lindgren to not only identify melanin but also map it to particular areas on a fossil. When ToF-SIMS is used in concert with other technologies, it could cement the argument for either melanosomes or microbes.
But even if all of these technologies show definitively that the structures are melanosomes, it is still questionable how much light they shed on the color of the whole organism. What we can’t tell from these studies is whether dinosaurs, like modern birds, used other pigments besides melanins. In birds these other pigments make feathers green and blue and yellow, but they are not as tough as melanin, and so may not survive.
“We have all these new technologies available to us, and paleontologists are in a unique position now to get answers to questions that were previously out of reach,” Schweitzer says. “It’s a brave new world, which is why we need to be careful and diligent as we lay the groundwork by classifying, measuring and identifying what can and cannot preserve. No one is saying that melanosomes can’t survive in the fossil record, just that we need to use the tools we have to make sure that we’re truly looking at melanosomes, not microbes.”
Reference:
Mary H. Schweitzer, Johan Lindgren and Alison E. Moyer. Melanosomes and ancient coloration re-examined: A response to Vinther 2015. DOI: 10.1002/bies.201500061
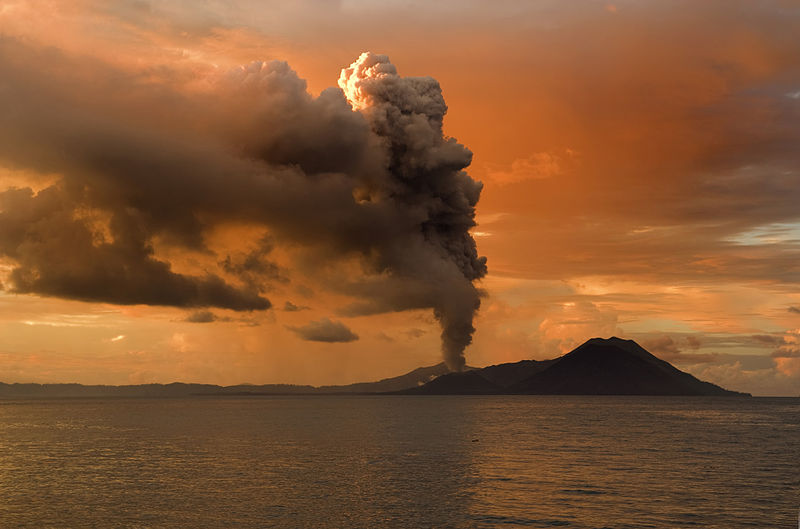
Tuvurvur volcano – part of Rabaul Caldera –– Papua New Guinea Credit: Taro Taylor
Major volcanic eruptions can have a significant effect on the flow of the world’s biggest rivers, research shows.
In the first study of its kind, scientists sought to better understand how big volcanic eruptions, which can trigger a shortage of rainfall in many regions of the world, can impact on rivers.
Their findings could help scientists predict how water availability in regions throughout the world might be affected by future eruptions.
Rainfall changes
Researchers sought to learn more about the impact of a process in which volcanoes give off aerosol particles that reflect sunlight, cooling the atmosphere and leading to reduced rainfall.
A team from the University of Edinburgh analysed records of flow in 50 major rivers.
Their study spanned the dates of major eruptions, from Krakatoa in 1883 to Pinatubo in 1991.
The team grouped rivers by region to help identify the influence of volcanoes, and used computer models linking rainfall with eruptions to predict where rivers were likely to be affected.
Regional patterns
They found that eruptions were followed a year or two later by reduced flow in some rivers.
In general, this was found in tropical regions and northern Asia, and included the Amazon, Congo and Nile.
However, flow increased in some sub-tropical regions, owing to disruption to atmospheric circulation patterns.
Areas affected included the south-west US and parts of South America.
Human impact
Predicting how changes to river flow might impact on people is not straightforward, researchers say.
The Amazon is in a sparsely populated area, so reduction in its flow may have little impact.
However, for rivers with high levels of human dependence, such as the Nile, loss of flow could have more impact.
Their study, published in Nature Geoscience, was supported by the Natural Environment Research Council and the European Research Council.
Reference:
Carley E. Iles, Gabriele C. Hegerl. Systematic change in global patterns of streamflow following volcanic eruptions. DOI: 10.1038/ngeo2545
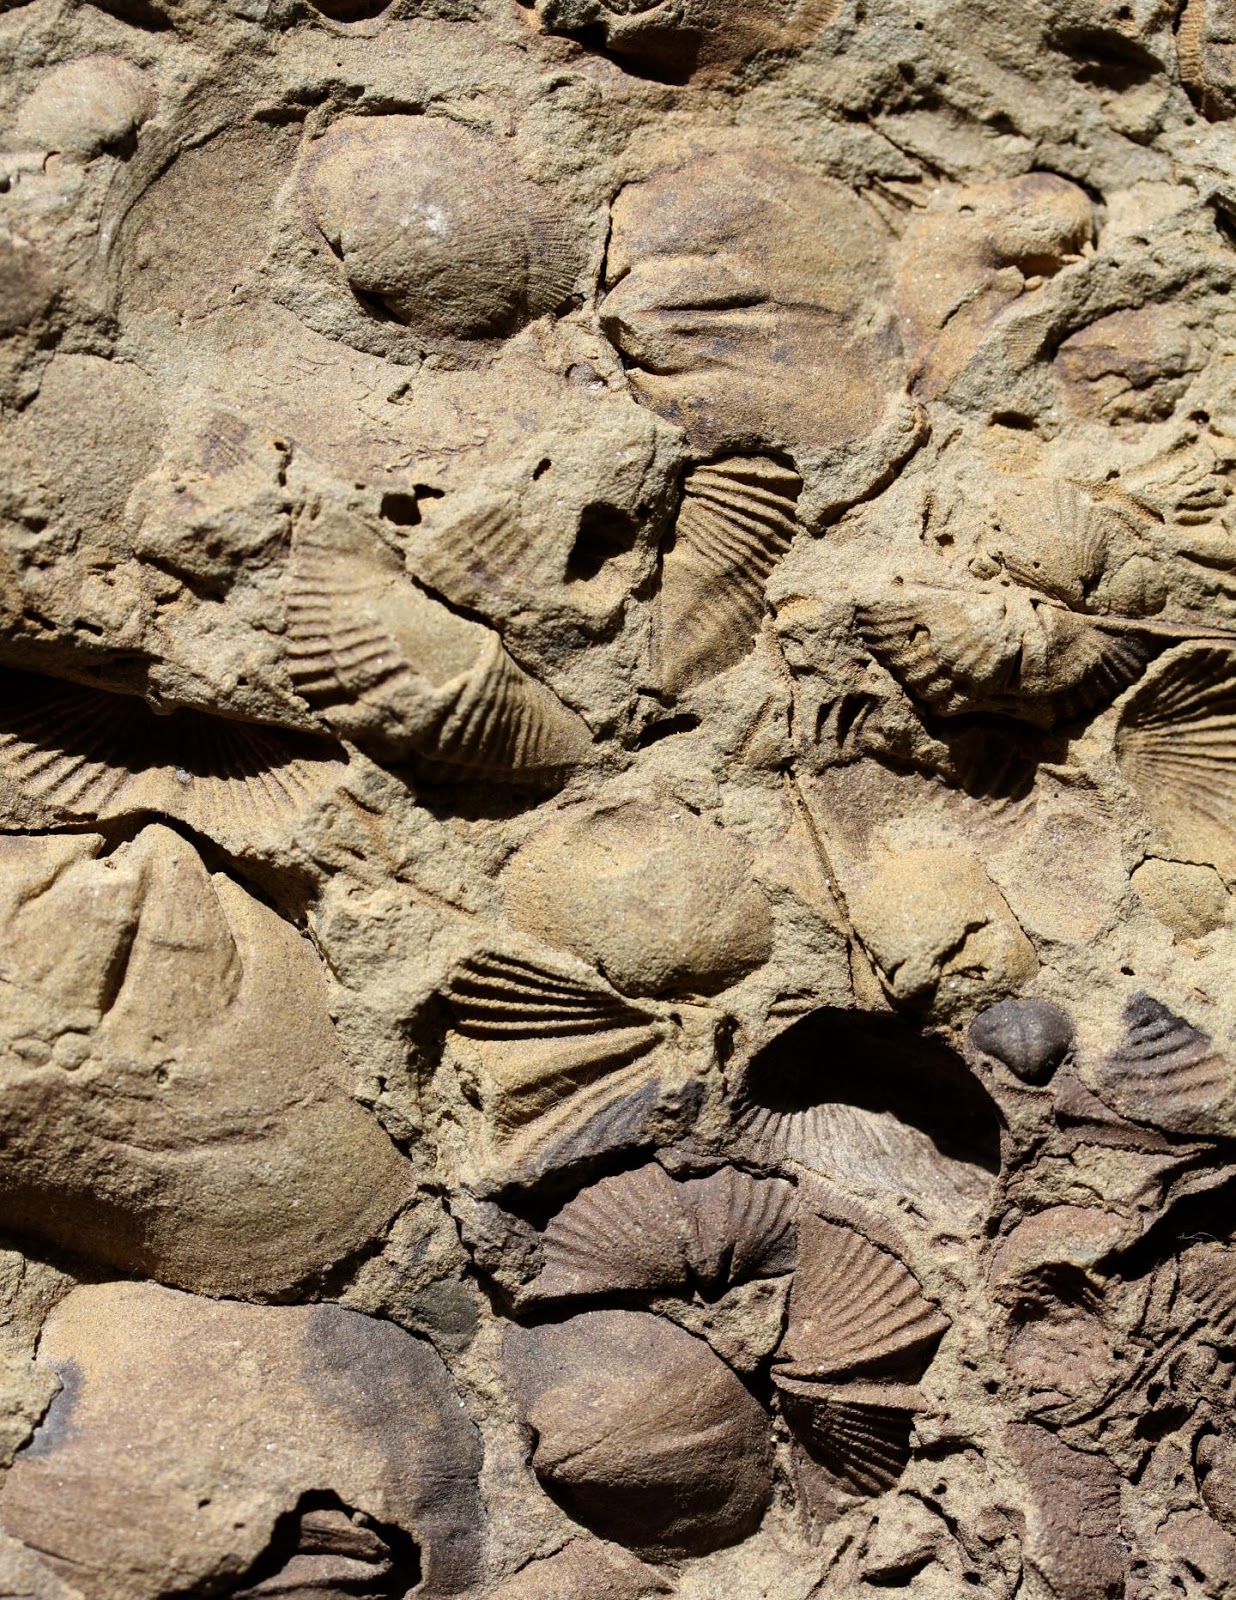
Late Devonian brachiopod fossils were preserved as molds in a fine-grained sandstone (Big Creek, Hornell, New York, N 42.364361, W 77.645760). Individual fossil samples like this are the basis for testing the effects of biases on the global record of biodiversity history. From “Sustained Mesozoic-Cenozoic diversification of marine Metazoa: A consistent signal from the fossil record,” by A.M. Bush and R.K. Bambach. Credit: Geology and A.M. Bush and R.K. Bambach
A new analysis of the fossil record by paleontologists at the University of Connecticut and the Smithsonian Institute demonstrates that the number of animal species in the world’s oceans has skyrocketed during the past 200 million years, despite mass extinctions like the one at the end of the Cretaceous Period (66 million years ago).
The history of diversification has been controversial due to concerns about data quality, but these biases were controlled in this analysis of a large Internet database of paleontological data. The analyses demonstrate that modern oceans are uniquely diverse — never before in the history of the Earth have so many species coexisted. These results provide context for concerns about escalating extinction rates — humans have been fortunate to live at an exceptional time of unprecedented biodiversity, but human impacts could tip the Earth from a state of increasing biodiversity to one of decline.
Reference:
Sustained Mesozoic-Cenozoic diversification of marine Metazoa: A consistent signal from the fossil record
Andrew M. Bush and Richard K. Bambach, Department of Ecology and Evolutionary Biology and Center for Integrative Geosciences, University of Connecticut, 75 North Eagleville Road, Storrs, Connecticut 06269-3043, USA and Department of Paleobiology, MRC-121, National Museum of Natural History, Smithsonian Institution, P.O. Box 37012, Washington, D.C. 20013-7012, USA. This article is online at DOI: 10.1130/G37162.1
Two University of Washington scientists are featured in a new series — created by the National Science Foundation, NBC Learn and The Weather Channel — that focuses on natural hazards. Each of the short videos features an NSF-supported scientist who studies one of ten types of natural disasters. Two of them are from the UW’s Department of Earth & Space Sciences.
David Montgomery, a UW professor of Earth and space sciences, studies past and present landslides to try to understand their ultimate cause. In the episode on landslides, Montgomery talks about landslide activity in Oso, Washington and at Carbon Glacier near Mount Rainier. He also looks at what aerial surveys suggest about risks at the Oso site, which in March 2014 gave way to become the deadliest landslide in U.S. history.
John Vidale, a UW professor of Earth and space sciences, and his team at the UW-based Pacific Northwest Seismic Network are monitoring ground motion across Washington and Oregon. He also leads a UW M9 Project to prepare for one of the most powerful natural hazards on the planet — a magnitude-9 “megathrust” earthquake. In the episode on earthquakes, Vidale talks about the 2001 Nisqually earthquake and travels into the field to seismic monitoring stations in West Seattle and downtown Seattle.
“When Nature Strikes: Science of Natural Hazards” was produced by NBC Learn in partnership with the National Science Foundation. Other segments focus on such events as hurricanes, wildfires, volcanoes and space weather. The series is narrated by The Weather Channel host Marshall Shepherd, a professor at the University of Georgia. The segments will air on The Weather Channel and NBC affiliate stations, and are all now available online.
Montgomery and Vidale will also both speak this fall during the College of the Environment’s annual lecture series. This year’s theme is “Surviving Disaster: Natural Hazards & Resilient Communities.” Register online for the free talks, which begin Tuesday, Oct. 13, with Montgomery’s presentation on landslides.
Video
Landslides occur when material like debris, rock, and soil become dislodged from the earth and slide downward at speeds that can approach 100 miles per hour. David Montgomery at the University of Washington studies past and present landslides to try to understand what causes them. “When Nature Strikes” is produced by NBC Learn in partnership with the National Science Foundation.
John Vidale and his team at the Pacific Northwest Seismic Network are monitoring ground motion across Washington State and Oregon to prepare residents for one of the most powerful natural hazards on the planet – a magnitude 9 “megathrust” earthquake. “When Nature Strikes” is produced by NBC Learn in partnership with the National Science Foundation.
Research published in the journal Paleobiology is showing more about the life history of Maiasaura peeblesorum than any other known dinosaur. Credit: Courtesy Holly Woodward
Decades of research on Montana’s state fossil — the “good mother lizard” Maiasaura peeblesorum — has resulted in the most detailed life history of any dinosaur known and created a model to which all other dinosaurs can be compared, according to new research published recently in the journal Paleobiology.
Researchers from Oklahoma State University, Montana State University and Indiana Purdue University used fossils collected from a huge bonebed in western Montana for their study.
“This is one of the most important pieces of paleontology involving MSU in the past 20 years,” said Jack Horner, curator of the Museum of the Rockies at MSU. “This is a dramatic step forward from studying fossilized creatures as single individuals to understanding their life cycle. We are moving away from the novelty of a single instance to looking at a population of dinosaurs in the same way we look at populations of animals today.”
The study was led by Holly Woodward, who did the research as her doctoral thesis in paleontology at MSU. Woodward is now professor of anatomy at Oklahoma State University Center for Health Sciences.
The Paleobiology study examined the fossil bone microstructure, or histology, of 50 Maiasaura tibiae (shin bones). Bone histology reveals aspects of growth that cannot be obtained by simply looking at the shape of the bone, including information about growth rate, metabolism, age at death, sexual maturity, skeletal maturity and how long a species took to reach adult size.
“Histology is the key to understanding the growth dynamics of extinct animals,” Woodward said. “You can only learn so much from a bone by looking at its shape. But the entire growth history of the animal is recorded within the bone.”
A sample of 50 might not sound like much, but for dinosaur paleontologists dealing with an often sparse fossil record, the Maiasaura fossils are a treasure trove.
“No other histological study of a single dinosaur species approaches our sample size,” Woodward said.
With it, the researchers discovered a wealth of new information about how Maiasaura grew up: it had bird-level growth rates throughout most of its life, and its bone tissue most closely resembled that of modern day warm-blooded large mammals such as elk.
Major life events are recorded in the growth of the bones and the rates at which different-aged animals died.
“By studying the clues in the bone histology, and looking at patterns in the death assemblage, we found multiple pieces of evidence all supporting the same timing of sexual and skeletal maturity,” said Elizabeth Freedman Fowler, curator of paleontology at the Great Plains Dinosaur Museum in Malta and adjunct professor at MSU, who performed the mathematical analyses for the study.
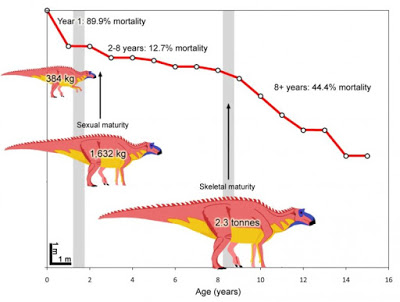
Sexual maturity occurred within the third year of life, and Maiasaura reached an average adult mass of 2.3 tonnes in eight years. Life was especially hard for the very young and the old. The average mortality rate for those less than a year of age was 89.9 percent, and 44.4 percent for individuals 8 years and older.
If Maiasaura individuals could survive through their second year, they enjoyed a six-year window of peak physical and reproductive fitness, when the average mortality rate was just 12.7 percent.
“By looking within the bones, and by synthesizing what previous studies revealed, we now know more about the life history of Maiasaura than any other dinosaur and have the sample size to back up our conclusions,” Woodward said. “Our study makes Maiasaura a model organism to which other dinosaur population biology studies will be compared.”
The 50 tibiae also highlighted the extent of individual size variation within a dinosaur species. Previous dinosaur studies histologically examined a small subset of dinosaur bones and assigned ages to the entire sample based on the lengths of the few histologically aged bones.
“Our results suggest you can’t just measure the length of a dinosaur bone and assume it represents an animal of a certain age,” Woodward said. “Within our sample, there is a lot of variability in the length of the tibia in each age group. It would be like trying to assign an age to a person based on their height because you know the height and age of someone else. Histology is the only way to quantify age in dinosaurs.”
Horner, a coauthor on the research and curator of the Museum of the Rockies at MSU where the Maiasaura fossils are reposited, discovered and named Maiasaura in 1979. He made headlines by announcing the world’s first discovery of fossil dinosaur embryos and eggs. Based on the immature development of the baby dinosaur fossils found in nests, Horner hypothesized that they were helpless upon hatching and had to be cared for by parents, so naming the dinosaur Maiasaura, Latin for “good mother lizard.”
Studies that followed revealed aspects of Maiasaura biology including that they were social and nested in colonies; Maiasaura walked on two legs when young and shifted to walking on all four as they got bigger; their preferred foods included rotting wood; and that their environment was warm and semi-arid, with a long dry season prone to drought.
The tibiae included in the Paleobiology study came from a single bonebed in western Montana covering at least two square kilometers. More than 30 years of excavation and thousands of fossils later, the bonebed shows no signs of running dry. Woodward plans to lead annual summer excavations of the Maiasaura bonebed to collect more data.
“Our study kicks off The Maiasaura Life History Project, which seeks to learn as much as possible about Maiasaura and its environment 76 million years ago by continuing to collect and histologically examine fossils from the bonebed, adding statistical strength to the sample,” she said.
“We plan to examine other skeletal elements to make a histological ‘map’ of Maiasaura, seeing if the different bones in its body grew at different rates, which would allow us to study more aspects of its biology and behavior. We also want to better understand the environment in which Maiasaura lived, including the life histories of other animals in the ecosystem,” she added.
The Maiasaura Life History Project will also provide opportunities for college-aged students accompanying Woodward in her excavations to learn about the fields of ecology, biology and geology, thereby encouraging younger generations to pursue careers in science.
In addition to Woodward, Horner and Freedman Fowler, James Farlow, professor emeritus of Geology at Indiana Purdue University, contributed to the Paleobiology paper.
Reference:
Holly N. Woodward, Elizabeth A. Freedman Fowler, James O. Farlow, John R. Horner. Maiasaura, a model organism for extinct vertebrate population biology: a large sample statistical assessment of growth dynamics and survivorship. Paleobiology, 2015; 1 DOI: 10.1017/pab.2015.19
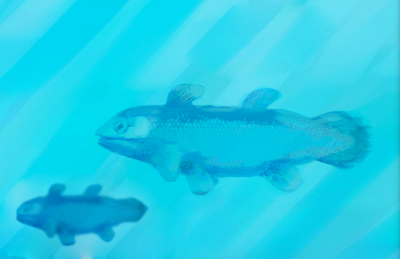
The coelacanth fish, found today in the Indian Ocean, is often called a ‘living fossil’ because its last ancestors existed about 70 million years ago and it has survived into the present — but without leaving any fossil remains younger than that time. Now, some much older coelacanth remains have been uncovered in a fossil deposit near Bristol by Harry Allard, a student at the University of Bristol, UK. Credit: Harry Allard
The coelacanth fish, found today in the Indian Ocean, is often called a ‘living fossil’ because its last ancestors existed about 70 million years ago and it has survived into the present – but without leaving any fossil remains younger than that time. Now, some much older coelacanth remains have been uncovered in a fossil deposit near Bristol by a student at the University of Bristol.
While working last summer in Bristol’s School of Earth Sciences, Harry Allard, a recent graduate from the University of Exeter, found remains of coelacanth fishes, ranging in size from juveniles to adults, in a section of Late Triassic rocks, dated at about 210 million years old, at Manor Farm, Aust, close to the first Severn crossing.
He discovered the new fossils in a large collection of fish and reptile teeth and bones, representing animals that lived in the shallow seas, and on the neighbouring landmass at that time when Bristol teemed with dinosaurs, and the landscape consisted of numerous tropical islands.
Harry said: “These fossils provide an amazing glimpse of an ecosystem which is so different from the contemporary landscape of south west England. It has been fascinating to look at the changing composition of that long-lost ecosystem.”
The Manor Farm site was created 15 years ago when the second Severn crossing was under construction and contractors excavated there to obtain road-building materials. After the site was made safe, a section was dug out so geologists, and the public, could visit and learn about the local geology. One of the fossil collectors at the time, the late Mike Curtis of Gloucester, collected batches of sediment, and worked through the material to extract nearly 20,000 teeth and bones.
“Mike Curtis kept such excellent records that Harry was able to separate the collections into findings from five separate bone beds, each perhaps separated by a few hundred thousand years,” said Professor Michael Benton, supervisor of the project. “This provides unique insight into a turbulent time, when seas flooded across the landscape, submerging much of Europe. Dry land became shallow seas almost overnight, and the energy of the floods churned up the soil and rock below and deposited bone beds in some places.”
Tracking upwards through the five bone beds, Harry was able to show how the fish faunas changed through time, from being dominated by small sharks at first, and then switching to more thick-scaled bony fishes higher up.
“The coelacanths were smaller than the living coelacanth Latimeria,” said Chris Duffin, a fossil fish expert who was involved in the work, “but these fishes were quite diverse in the Triassic, and only dwindled in importance later. They are most unusual, having gills and lungs, and moving both by paddling with their gills, and stilt-walking along the seabed as well.”
Reference:
‘Microvertebrates from the classic Rhaetian bone beds of Manor Farm Quarry, near Aust (Bristol, UK)’ by Harry Allard, Simon Carpenter, Chris Duffin, and Michael Benton in Proceedings of the Geologists’ Association DOI: 10.1016/j.pgeola.2015.09.002
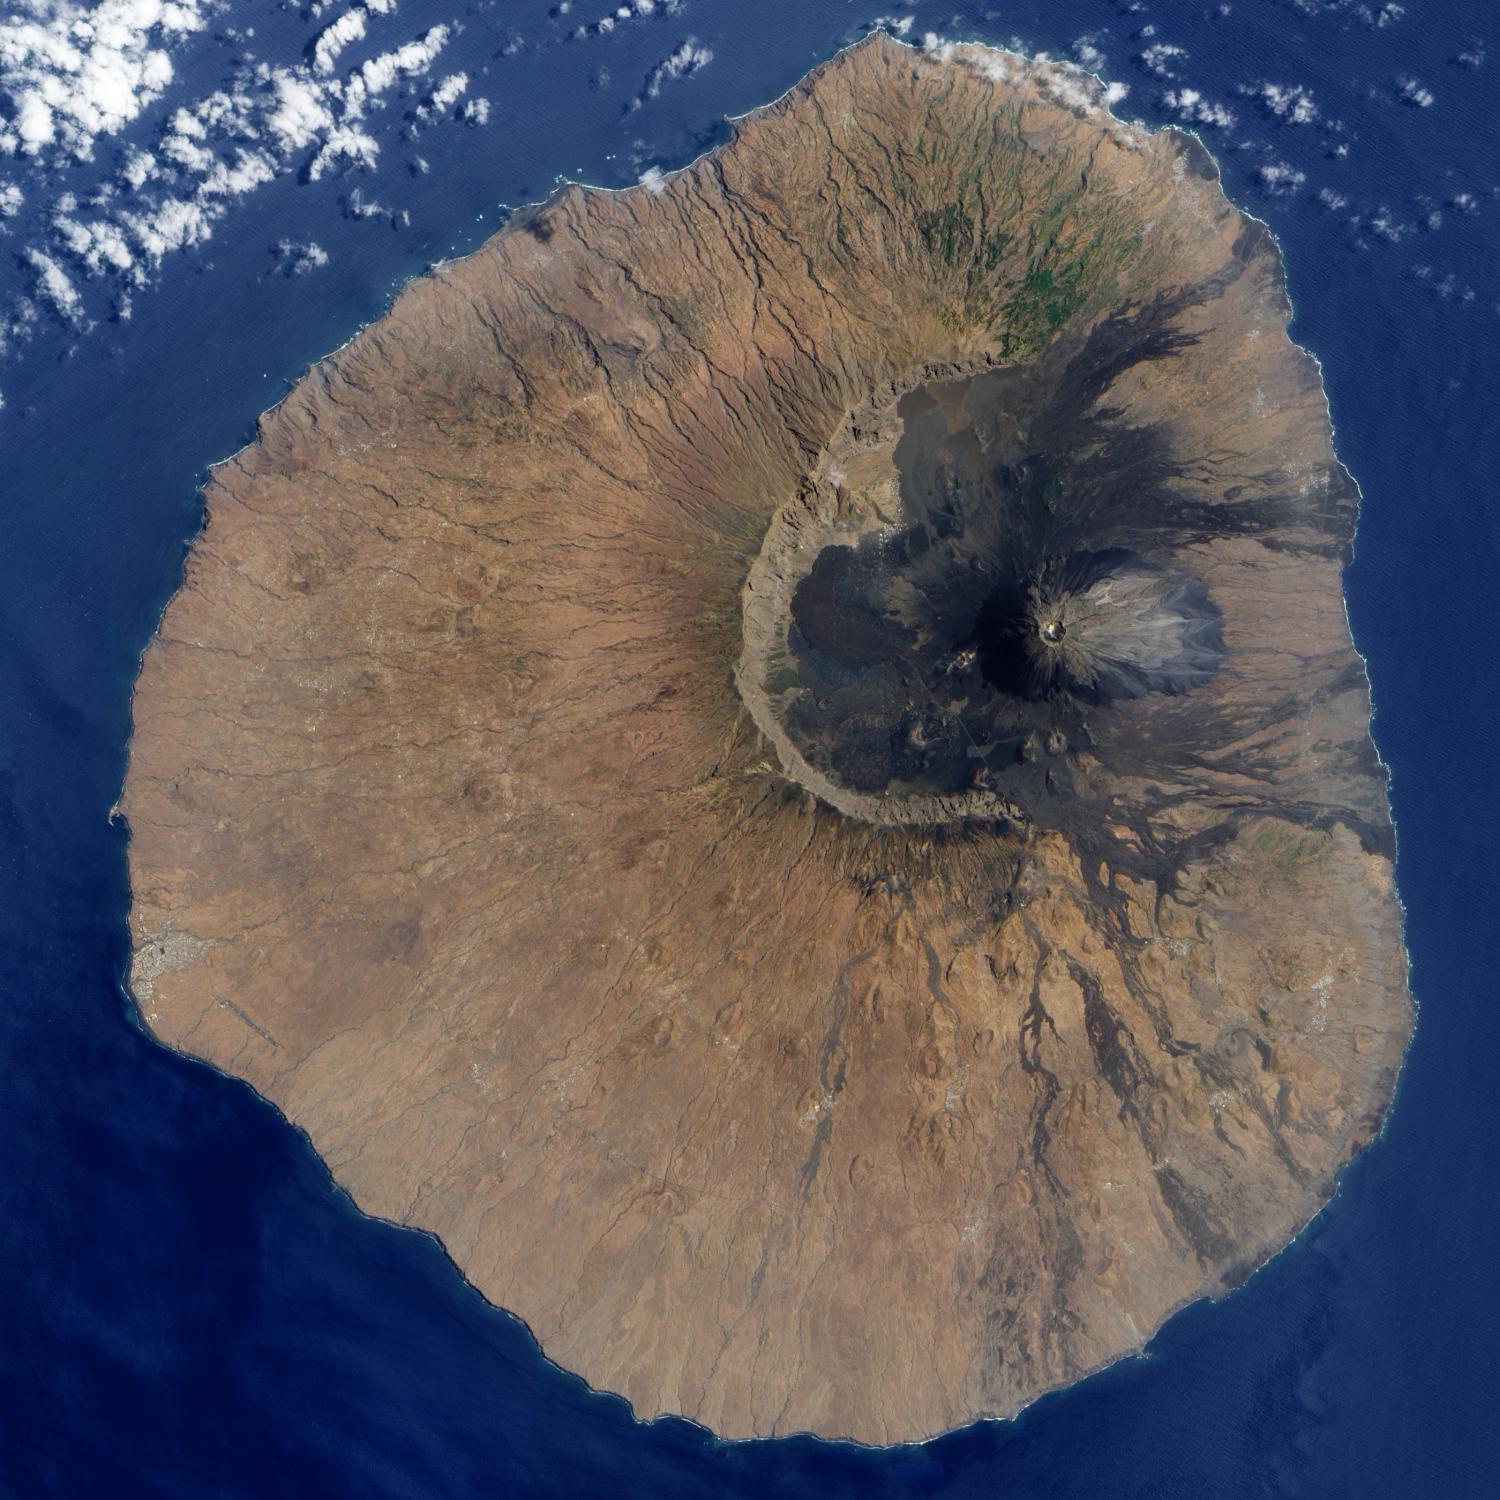
Geologists think that the eastern slope of Fogo volcano crashed into the sea some 65,000 to 124,000 years ago, leaving a giant scar where a new volcano can be seen growing in this satellite image. Credit: NASA
Scientists working off west Africa in the Cape Verde Islands have found evidence that the sudden collapse of a volcano there tens of thousands of years ago generated an ocean tsunami that dwarfed anything ever seen by humans. The researchers say an 800-foot wave engulfed an island more than 30 miles away. The study could revive a simmering controversy over whether sudden giant collapses present a realistic hazard today around volcanic islands, or even along more distant continental coasts. The study appears today in the journal Science Advances.
“Our point is that flank collapses can happen extremely fast and catastrophically, and therefore are capable of triggering giant tsunamis,” said lead author Ricardo Ramalho, who did the research as a postdoctoral associate at Columbia University’s Lamont-Doherty Earth Observatory, where he is now an adjunct scientist. “They probably don’t happen very often. But we need to take this into account when we think about the hazard potential of these kinds of volcanic features.”
The apparent collapse occurred some 73,000 years ago at the Fogo volcano, one of the world’s largest and most active island volcanoes. Nowadays, it towers 2,829 meters (9,300 feet) above sea level, and erupts about every 20 years, most recently last fall. Santiago Island, where the wave apparently hit, is now home to some 250,000 people.
There is no dispute that volcanic flanks present a hazard; at least eight smaller collapses have occurred in Alaska, Japan and elsewhere in the last several hundred years, and some have generated deadly tsunamis. But many scientists doubt whether big volcanoes can collapse with the suddenness that the new study suggests. Rather, they envision landslides coming in gradual stages, generating multiple, smaller tsunamis. A 2011 French study also looked at the Fogo collapse, suggesting that it took place somewhere between 124,000-65,000 years ago; but that study says it involved more than one landslide. The French researchers estimate that the resulting multiple waves would have reached only 45 feet—even at that, enough to do plenty of harm today.
A handful of previous other studies have proposed much larger prehistoric collapses and resulting megatsunamis, in the Hawaiian islands, at Italy’s Mt. Etna, and the Indian Ocean’s Reunion Island. But critics have said these examples are too few and the evidence too thin. The new study adds a new possible example; it says the estimated 160 cubic kilometers (40 cubic miles) of rock that Fogo lost during the collapse was dropped all at once, resulting in the 800-foot wave. By comparison, the biggest known recent tsunamis, which devastated the Indian Ocean’s coasts in 2004 and eastern Japan in 2011, reached only about 100 feet. (Like most other well documented tsunamis, these were generated by movements of undersea earthquake faults—not volcanic collapses.)
Santiago Island lies 55 kilometers (34 miles) from Fogo. Several years ago, Ramalho and colleagues were working on Santiago when they spotted unusual boulders lying as far as 2,000 feet inland and nearly 650 feet above sea level. Some are as big as delivery vans, and they are utterly unlike the young volcanic terrain on which they lie. Rather, they match marine-type rocks that ring the island’s shoreline: limestones, conglomerates and submarine basalts. Some weigh up to 770 tons. The only realistic explanation the scientists could come up with: A gigantic wave must have ripped them from the shoreline and lofted them up. They derived the size of the wave by calculating the energy it would have taken to accomplish this feat.
To date the event, in the lab Ramalho and Lamont-Doherty geochemist Gisela Winckler measured isotopes of the element helium embedded near the boulders’ surfaces. Such isotopes change depending on how long a rock has been lying in the open, exposed to cosmic rays. The analyses centered around 73,000 years—well within the earlier French estimate of a smaller event. The analysis “provides the link between the collapse and impact, which you can make only if you have both dates,” said Winckler.
Tsunami expert Bill McGuire, a professor emeritus at University College London who was not involved in the research, said the study “provides robust evidence of megatsunami formation [and] confirms that when volcanoes collapse, they can do so extremely rapidly.” Based on his own work, McGuire s says that such megatsunamis probably come only once every 10,000 years. “Nonetheless,” he said, “the scale of such events, as the Fogo study testifies, and their potentially devastating impact, makes them a clear and serious hazard in ocean basins that host active volcanoes.”
Ramalho cautions that the study should not be taken as a red flag that another big collapse is imminent here or elsewhere. “It doesn’t mean every collapse happens catastrophically,” he said. “But it’s maybe not as rare as we thought.”
In the early 2000s, other researchers started publishing evidence that the Cape Verdes could generate large tsunamis. Others have argued that Spain’s Canary Islands have already done so. Simon Day, a senior researcher at University College London has sparked repeated controversy by warning that any future eruption of the Canary Islands’ active Cumbre Vieja volcano could set off a flank collapse that might form an initial wave 3,000 feet high. This, he says, could erase more than nearby islands. Such a wave might still be 300 feet high when it reached west Africa an hour or so later he says, and would still be 150 feet high along the coasts of North and South America. So far, such studies have raised mainly tsunamis of publicity, and vigorous objections from other scientists that such events are improbable. A 2013 study of deep-sea sediments by the United Kingdom’s National Oceanography Centre suggests that the Canaries have probably mostly seen gradual collapses.
Part of the controversy hangs not only on the physics of the collapses themselves, but on how efficiently resulting waves could travel. In 1792, part of Japan’s Mount Unzen collapsed, hitting a series of nearby bays with waves as high as 300 feet, and killing some 15,000 people. On July 9, 1958, an earthquake shook 90 million tons of rock into Alaska’s isolated Lituya Bay; this created an astounding 1,724-foot-high wave, the largest ever recorded. Two fishermen who happened to be in their boat that day were carried clear over a nearby forest; miraculously, they survived.
These events, however, occurred in confined spaces. In the open ocean, waves created by landslides are generally thought to lose energy quickly, and thus to pose mainly a regional hazard. However, this is based largely on modeling, not real-world experience, so no one really knows how fast a killer wave might decay into a harmless ripple. In any case, most scientists are more concerned with tsunamis generated by undersea earthquakes, which are more common. When seabed faults slip, as they did in 2004 and 2011, they shove massive amounts of water upward. In deep water, this shows up as a mere swell at the surface; but when the swell reaches shallower coastal areas, its energy concentrates into in a smaller volume of water, and it rears up dramatically. The 2004 Indian Ocean earthquake and tsunami killed 230,000 people in 14 countries; the 2011 Tohoku event killed nearly 20,000 in Japan, and has caused a long-term nuclear disaster.
James Hunt, a tsunami expert at the United Kingdom’s National Oceanography Centre who was not involved in the study, said the research makes it clear that “even modest landslides could produce high-amplitude anomalous tsunami waves on opposing island coastlines.” The question, he said, “is whether these translate into hazardous events in the far field, which is debatable.”
When Fogo erupted last year, Ramalho and other geologists rushed in to observe. Lava flows (since calmed down) displaced some 1,200 people, and destroyed buildings including a new volcano visitors’ center. “Right now, people in Cape Verde have a lot more to worry about, like rebuilding their livelihoods after the last eruption,” said Ramalho. “But Fogo may collapse again one day, so we need to be vigilant.”
Video
Reference:
Hazard Potential of Volcanic Flank Collapses Raised by New Megatsunami Evidence, DOI: 10.1126/sciadv.1500456
As the planet faces the dawn of a sixth mass extinction, scientists are searching for clues about the uncertain road ahead by exploring how ancient ecosystems collapsed and bounced back from traumatic upheavals. A new study follows the lengthy collapses and revival of South African ecosystems during one of the “big five” mass extinctions, the Permian-Triassic event, revealing unexpected results about the types of animals that were most vulnerable to extinction, and the factors that might best predict community stability during times of great change.
The study’s authors–including Peter Roopnarine, PhD, of the California Academy of Sciences–say inventive, cutting-edge modeling techniques helped highlight the critical importance of understanding food webs (knowing “who eats what”) when trying to predict what communities look like before, during, and after a mass extinction. The thought-provoking study is the first of its kind, and is published today in Science.
“Vital clues” in deep time
“There is no real precedent for what’s happening to our planet at the moment,” says Roopnarine, who co-authored the study with Kenneth Angielczyk, PhD, of Chicago’s Field Museum. “We can’t look into recent history and find this particular cocktail of accelerated climate change, habitat destruction, and global extinction. We can, however, explore instances of extreme crises in the fossil record–looking far back in time to reconstruct what happened, and how ecosystems responded.”
As Curator of Geology, Roopnarine is accustomed to thinking in “deep time”–a geologic reference to the vast, multimillion-year timeframe some scientists use to unravel mysteries from Earth’s pre-human existence. Past extinctions and climate perturbations may lack the human factors driving today’s phenomena, but Roopnarine says those periods “contain vital clues” about the ways natural communities respond to crises and rebuild.
“The challenge with researching extinctions that happened more than 200 million years ago is that there is not enough fossil or other geological evidence to recreate a perfectly complete ecosystem,” says Roopnarine. “It’s a bit like knowing a long, complex experiment–a mass extinction–was conducted, but nobody took notes. That’s where the reconstruction and modeling comes in.”
Modeling ancient extinctions
Roopnarine and Angielczyk were interested in the factors that encouraged or impeded stability while these ancient South African communities faced large-scale disturbances. They wondered whether the roles each species played in the broader ecosystem had more influence on stability than species richness–the number of different species in a system– and the number and strength of interactions among species. The scientists decided to use a clever form of mathematical modeling to dig into the importance of these variables in (sometimes spotty) fossil food webs.
“It’s difficult to compare food webs over such an enormous timeframe–especially when there are gaps in the fossil record,” says Roopnarine. “For each time slice, we used a ‘real’ pre-extinction ecosystem full of the species we know existed to help create several alternate models of food webs for the same place and time. We always held the number of species constant, but made changes to the roles each animal played as well as the links between predators and their prey.”
After generating several alternate food webs for each important period, the scientists examined each to see how stable they might have been. Results were surprising.
“We saw that, after disturbing a pre-extinction community and all of its alternate models, the real community always emerged as the most stable,” says Roopnarine. “Since we held species richness constant, we know that each species’ ecological roles–the jobs in the food web–are the key factors influencing big-picture stability. It’s amazing that some of these ecosystems may have remained relatively stable despite huge biodiversity loss.”
“A bad time to be a rat”
Aside from the glaring absence of human influence, mass extinctions during the Permian still looked quite different than the ecological upheaval we see on Earth today. Modern conservation efforts tend to center around large animals–such as tigers, elephants, and wolves–and top predators in peril, while Roopnarine and Angielczyk show that small amniotes (reptiles and ancient mammal relatives) were most vulnerable during the early phase of this long-ago period of extinction.
“It’s surprising that small amniotes were the species initially most at-risk,” says Roopnarine. “It doesn’t fit with the terrestrial extinctions we see today, but it makes sense when you think about how different Earth looks after so much time and change.”
“What I’m saying,” Roopnarine adds, “is that it was a bad time to be a rat. We think they can survive anything now, but during the Permian and Triassic, their ancient cousins played an unlucky role in the larger community. The food webs at the time could remain stable if they were dominated by large amniotes and lacked smaller ones, but not the other way around. Though individually successful, collectively the smaller species could not support very stable communities. Over time, the quality of a single business matters less than the quality of the overall economy.”
Food webs as conservation tools
Every line in an intricate food web represents powerful ecosystem interactions and exchanges of energy. Clues from past systems that recovered or failed following disasters help scientists peer into the future of the ever-changing natural world. This study’s results are an urgent call for an increased focus on modern food webs–an area of research Roopnarine says needs increased attention in a time of unprecedented environmental stress.
“We need to understand the relationships between the species we’re driving to extinction,
The ancient mammal Lystrosaurus was a survivor of the Permian-Triassic Mass Extinction. The specimen shown is part of the Iziko: South African Museum collection (SAM-PK-K8524). Credit: Kenneth Angielczyk
and the roles they play in ecosystem stability,” says Roopnarine. “We know the collapse of Atlantic cod wreaked havoc on marine ecosystems, but we know very little about the ways most species’ ecologies relate to stability. It can be surprising which species help hold ecosystems together. We desperately need more data for the modern environment.”
Roopnarine says museum collections, including the Academy’s nearly 46 million specimens, are powerful tools in the race to understand what helps an environment remain stable. When applied to scientific specimens, new technologies and advanced techniques help uncover the complex relationships inherent in biodiverse–and threatened–regions worldwide.
Reference:
P. D. Roopnarine, K. D. Angielczyk. Community stability and selective extinction during the Permian-Triassic mass extinction. Science, 2015; 350 (6256): 90 DOI: 10.1126/science.aab1371
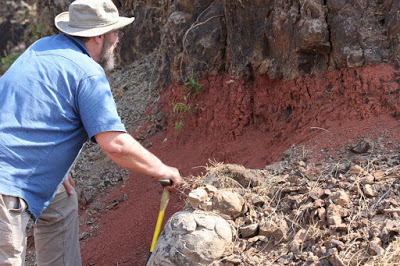
Paul Renne inspects a reddened soil horizon between lava flows in the Deccan Traps region of India. Renne is director of the Berkeley Geochronology Center and a professor-in-residence at UC Berkeley. Credit: Mark Richards/UC Berkeley
Berkeley geologists have uncovered compelling evidence that an asteroid impact on Earth 66 million years ago accelerated the eruptions of volcanoes in India for hundreds of thousands of years, and that together these planet-wide catastrophes caused the extinction of many land and marine animals, including the dinosaurs.
For 35 years, paleontologists and geologists have debated the role these two global events played in the last mass extinction, with one side claiming the eruptions were irrelevant, and the other side claiming the impact was a blip in a long-term die-off.
The new evidence includes the most accurate dates yet for the volcanic eruptions before and after the impact. The new dates show that the Deccan Traps lava flows, which at the time were erupting at a slower pace, doubled in output within 50,000 years of the asteroid or comet impact that is thought to have initiated the last mass extinction on Earth.
Both the impact and the volcanism would have blanketed the planet with dust and noxious fumes, drastically changing the climate and sending many species to an early grave.
“Based on our dating of the lavas, we can be pretty certain that the volcanism and the impact occurred within 50,000 years of the extinction, so it becomes somewhat artificial to distinguish between them as killing mechanisms: both phenomena were clearly at work at the same time,” said lead researcher Paul Renne, a UC Berkeley professor-in-residence of earth and planetary science and director of the Berkeley Geochronology Center. “It is going to be basically impossible to ascribe actual atmospheric effects to one or the other. They both happened at the same time.”
The geologists argue that the impact abruptly changed the volcanoes’ plumbing system, which produced major changes in the chemistry and frequency of the eruptions. After this change, long-term volcanic eruptions likely delayed recovery of life for 500,000 years after the KT boundary, the term for the end of the Cretaceous and the beginning of the Tertiary period when large land animals and many small sea creatures disappeared from the fossil record.
“The biodiversity and chemical signature of the ocean took about half a million years to really recover after the KT boundary, which is about how long the accelerated volcanism lasted,” Renne said. “We are proposing that the volcanism unleashed and accelerated right at the KT boundary suppressed the recovery until the volcanoes waned.”
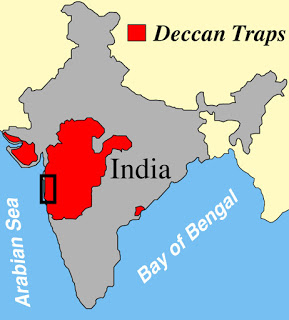
The Deccan Traps lava flows occupy a large part of India (red). The UC Berkeley team collected samples for dating and analysis at spots within the black rectangle near Mumbai.
Co-author Mark Richards, a UC Berkeley professor of earth and planetary science and the one who originally proposed that the comet or asteroid impact reignited the Deccan Traps lava flows, is agnostic about which event was the real death knell for much of life on Earth. But the link between the impact and the flood basalts is becoming harder to deny.
“If our high-precision dates continue to pin these three events — the impact, the extinction and the major pulse of volcanism — closer and closer together, people are going to have to accept the likelihood of a connection among them. The scenario we are suggesting — that the impact triggered the volcanism — does in fact reconcile what had previously appeared to be an unimaginable coincidence,” he said.
Renne, Richards and their colleagues will publish the new dates for the Deccan Traps eruptions in the Oct. 2 issue of the journal Science.
Impact or volcanism?
Since 1980, when UC Berkeley geologist Walter Alvarez and his father, the late UC Berkeley physicist Luis Alvarez, discovered evidence of a comet or asteroid impact on Earth 66 million years ago, scientists have argued about whether the impact was the cause of the mass extinction that occurred at the same time, the end of the Cretaceous period, or the KT boundary. Some argued that the huge volcanic eruptions in India known as the Deccan Traps, which occurred around the same time, were the main culprit in the extinctions. Others insisted the death knell had been the impact, which left behind a large crater dubbed Chicxulub off Mexico’s Yucatan peninsula, and viewed the Deccan Traps eruptions as a minor sideshow.
Earlier this year, Richards, Renne and eight other geoscientists proposed a new scenario: that the impact ignited volcanoes around the globe, most catastrophically in India, and that the two events combined to cause the KT extinction.
In attempts to test this hypothesis, the team last year collected lava samples from throughout the Deccan Traps east of Mumbai, sampling flows from near the beginning, several hundred thousand years before the extinction and near the end, some half a million years after the extinction. High-precision argon-40/argon-39 isotope dating allowed them to establish the chronology of the flows and the rate of flow over time.
In the Science paper, they describe major changes in the Deccan Traps volcanism, which was probably “bubbling along happily, continuously and relatively slowly” before the extinction, Renne said. After the impact, the eruption rate more than doubled and the volcanism became more punctuated, with more voluminous lava flows interspersed with long periods of quiet. This is consistent with a change in the underground plumbing feeding the flows, he said: Smaller magma chambers before the impact became larger, which means they took longer to fill but spewed more lava when they did erupt.
“At the KT boundary, we see major changes in the volcanic system of the Deccan Traps, in terms of the rate at which eruptions were happening, the size of the eruptions, the volume of the eruptions and some aspects of the chemistry of the eruptions, which speaks to the actual processes by which the magmas were generated,” Renne said. “All these things changed in a fundamental way, and increasingly it seems they happened right at the KT boundary. Our data don’t conclusively prove that the impact caused these changes, but the connection looks increasingly clear.”
Richards said that a large nearby earthquake of a magnitude 8, 9 or 10 — as large or larger than the quake that struck Japan in 2011 — could also have reignited the Deccan Trap flows. In fact, large quakes may have rattled underground magma chambers and ignited eruptions throughout Earth’s history. But the simultaneous changes in the lava flows and the impact at the KT boundary seem more than mere coincidence.
“These changes are consistent with an accelerated rate of magma production and eruption that you could get from a large earthquake such as would be created by the Chicxulub impact,” he said.
In 2013, Renne and his team at the Berkeley Geochronology Center and elsewhere also dated the KT boundary extinction and dust from the impact and found they occurred within less than 32,000 years of one another — the blink of an eye in geologic terms, he said. Renne’s team plans to obtain isotope dates for more basalt samples from the Deccan Traps to detail the history of the lava flows that cover much of western India, in order to better understand how they changed with time and correlate to the impact and extinctions. Meanwhile, Richards is working with volcano experts to understand how large ground shaking caused by earthquakes or asteroid impacts affects volcanic eruptions.
Reference:
P. R. Renne, C. J. Sprain, M. A. Richards, S. Self, L. Vanderkluysen, K. Pande. State shift in Deccan volcanism at the Cretaceous-Paleogene boundary, possibly induced by impact. Science, 2015; 350 (6256): 76 DOI: 10.1126/science.aac7549
New magma injected from below (red) combines with older magma (blue) and solid crystals (black and white) in a “mixing bowl” region discovered by the simulation. Credit: George Bergantz/University of Washington
Months of warning signs from Mauna Loa, on Hawaii’s Big Island, prompted the U.S. Geological Society to recently start releasing weekly updates on activity at the world’s largest active volcano.
For now, such warning signs can only rely on external clues, like earthquakes and venting gases. But a University of Washington simulation has managed to demonstrate what’s happening deep inside the volcano. The study, published Sept. 7 in Nature Geoscience, is the first to simulate the individual crystals’ movement in the magma chamber to better understand the motion of the magma and buildup of pressure.
“The thing about studying volcanoes is we can’t really see inside of them to know what’s going on,” said co-author Jillian Schleicher, a UW doctoral student in Earth and space sciences. “Whenever there’s unrest, like earthquakes, gas emissions or surface deformation, it’s really difficult to know what processes are taking place inside the volcano.”
Each volcano has a unique personality. Volcanologists use the remains of past eruptions and previous warning signs to predict when it might blow. But those predictions are based on only vague understanding of the system’s inner workings.
The idealized UW computer simulation could help volcanologists better understand how energy builds up inside a system like Mauna Loa, which is a focus of the UW group’s research, to predict when it will erupt.
“This tool is novel because it lets us explore the mechanics,” said first author George Bergantz, a UW professor of Earth and space sciences. “It creates an interpretive framework for what controls the movement, and what might produce the signals we see on the outside.”
The team used a computer model originally developed by the U.S. Department of Energy to model fuel combustion. The UW group previously adapted the code to simulate volcanic eruptions and ash plumes; this paper is the first time it’s been used to go down inside the volcano and examine the movement of each individual crystal.
A volcano is filled with “magma mush,” a slushy material that is part magma, or liquid rock, and part solid crystal. Previous studies approximated it as a thick fluid. But capturing its true dual nature makes a difference, since the crystals interact in ways that matter for its motion.
“If we see earthquakes deep inside Mauna Loa, that tells us that there’s magma moving up through the volcano,” Bergantz said. “But how can we better understand its progress up through that plumbing system?”
The simulation shows the magma has three circulation states: slow, medium and fast. In the slow state, new magma just percolates up through the crystal pores. As the rate of injected magma increases, however, it creates a “mixing bowl” region where older crystals get mixed in with the new material.
“In these crystal-rich mushes, we know that we have magma going in and sometimes it might punch through [the layer of crystals at the bottom],” Schleicher said. “But we don’t know how the mixing is happening or the timescales involved.”
The current model is an idealized magma chamber, but with more computing power it could be expanded to reproduce a particular volcano’s internal structure.
Now that researchers can simulate what happens inside a magma chamber, Schleicher will look at rock samples from Mauna Loa and analyze the layers in the crystals. Crystals preserve chemical clues as they grow, similar to tree rings. Matching the model with the crystals’ composition will help recreate the rock’s history and track how magma has moved inside Mauna Loa.
“Mauna Loa is a terrific place to study because it’s very active, and the rocks contain a single type of crystal,” Bergantz said. “What we learn at Mauna Loa will allow us to make headway on other places, like Mount St. Helens, that are intrinsically more difficult.”
Video
The first simulation of the individual crystals in volcanic mush, a mix of liquid magma and solid crystals, shows mixing to help understand pressure buildup deep inside a volcano.
Reference:
G. W. Bergantz, J. M. Schleicher & A. Burgisser. Open-system dynamics and mixing in magma mushes. DOI:10.1038/ngeo2534
These are the earliest Jurassic solitary corals discovered by UM researchers in New York Canyon, Nevada. Credit: Montana Hodges
Five times in Earth’s history mass extinction events have wiped out up to 90 percent of global life. University of Montana doctoral student Montana Hodges and geosciences Professor George Stanley recently found the fossil record of the earliest North American coral species that reappeared after the Triassic-Jurassic mass extinction event.
Their findings were published in the October issue of GSA Today: A Publication of the Geological Society of America. The article “North American coral recovery after the end-Triassic mass extinction, New York Canyon, Nevada,” is featured on the journal’s cover.
Hodges and Stanley research the collapse and recovery of coral reefs. Corals are particularly hard-hit by subtle changes in ocean temperature and acidity. About 200 million years ago, corals and reefs completely collapsed. During this particular extinction event, researchers have found no evidence of asteroid impact or other catastrophic events. Instead, the geologic and paleontological records point to massive global climate change.
A UM field team measure rocks at New York Canyon, Nevada. A UM field team measure rocks at New York Canyon, Nevada. “We believe the warming climate was due to a combination effect from supercontinent Pangea breaking apart, changes in sea level and massive amounts of gas spewing into the atmosphere from cracks in the Earth’s crust,” Hodges said.
After that mass extinction event, it took coral reefs more than 20 million years to completely recover. In the dusty, high desert of central Nevada, the team discovered the earliest North American Jurassic corals.
New York Canyon, Nevada, is swathed with sedimentary rocks that during the Jurassic period represented the west coast of North America. Geologists have flocked to this site for almost a hundred years to study the unique and continuous deposition of rocks that span the Triassic-Jurassic boundary. The fossils left in the rocks offer a fairly complete snapshot of the mass extinction. Yet, the significance of the corals found there had not been noted until now.
“The Jurassic corals represent a recovery of all species after the event,” Hodges said. “They are simple, solitary corals that lived in thick mud, which may have helped their survival during such a tumultuous time. Or they may have migrated from the distant side of Pangea.”
Regardless, they are the earliest representatives of the coral that would slowly rebuild and diversify over millions of years.
By studying these unique corals, Hodges and Stanley aim to contribute a better understanding of survival and recovery.
“Our study may lend valuable information to understanding the peril of coral reefs today,” Hodges said.
Layered lava flows of the Deccan Traps east of Mumbai, India. Credit: Mark Richards, UC Berkeley
While there is general consensus that a massive asteroid colliding with Earth 66 million years ago contributed to the ensuing mass extinction, including that of dinosaurs, new evidence suggests that this impact triggered more intense volcanic activity, further compounding the extermination.
The new measurements of volcanic activity, which may be the most precise to date, indicate a dramatic increase in the rate of eruption of the Deccan volcanos within 50,000 years of the impact. To gain an understanding of activity at this volcanic range in India, Paul Renne et al. used high-resolution argon dating of local igneous minerals.
This data, combined with the layering of rock, reveals that some subsections of this volcanic region were already active before the asteroid hit. Following the collision, the team notes that the mean eruption frequency of a particular subsection decreased dramatically, but the lava volume (per single eruptive event) increased, causing the mean magma eruption rate to roughly double.
The transition from high-frequency, low-volume eruptions to low-frequency, high-volume eruptions suggests a fundamental change in the magma plumbing system, the authors say. This large volume of magma continued for approximately 500,000 years after the mass extinction, which is similar to the timescale between extinction and the initial recovery of marine ecosystems.
Therefore the authors suggest that the Cretaceous extinction may have resulted from the combined effects of both the asteroid collision and increased volcanic activity.
Reference:
“State shift in Deccan volcanism at the Cretaceous-Paleogene boundary, possibly induced by impact,” by P.R. Renne; C.J. Sprain at Berkeley Geochronology Center in Berkeley, CA; P.R. Renne; C.J. Sprain; M.A. Richards; S. Self at University of California, Berkeley in Berkeley, CA; L. Vanderkluysen at Drexel University in Philadelphia, PA; K. Pande at Indian Institute of Technology Bombay in Mumbai, India. DOI: 10.1126/science.aac7549