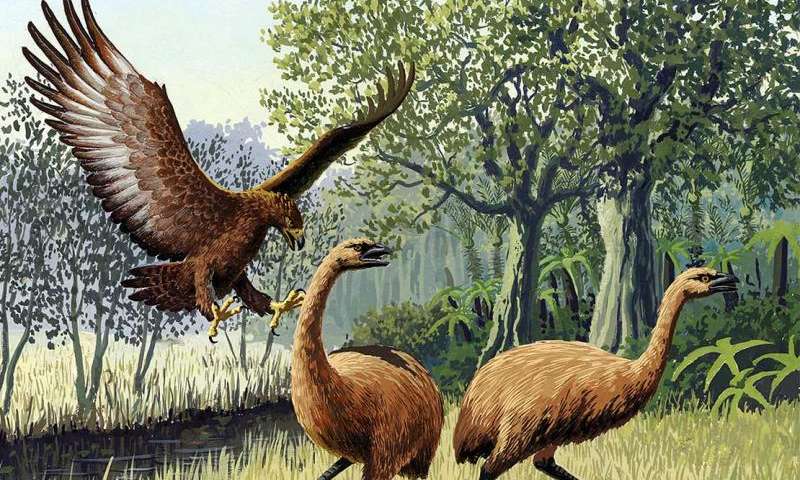
An artists rendition extinct Haast’s Eagle, left, hunting moa. Credit: John Megahan, Creative Commons licence.
Some of New Zealand’s extinct bird species, including the Haast’s eagle, Forbes Harrier and a giant weka-like bird with a weaponised beak (Adzebill) are being brought to life as three-dimensional digital models thanks to staff at Massey University, the Auckland War Memorial Museum and The Museum of New Zealand Te Papa Tongarewa.
The skulls, along with several wing and leg bones, will be scanned at Te Papa this week. It is part of an on-going project between the museums to exchange collections and make them more accessible to the public.
Massey University ornithologist Dr Daniel Thomas is leading the scanning project under the supervision of Auckland Museum Natural Sciences Collections Manager Jason Froggatt, Curator of Land Vertebrates Dr Matt Rayner and Te Papa vertebrate Curator Alan Tennyson.
This is not the first time Dr Thomas has digitised ancient bones. He has been working with Mr Froggatt to scan moa bones and build a full skeleton. They are showing their progress on a web page titled “Evolution in Isolation,” which includes other three-dimensional digital models, wildlife photos and sound recordings from animals that live in New Zealand, from spiders to songbirds.
Dr Thomas says the recent trend of displaying three-dimensional digital versions of museum objects online has been supported by major museums internationally, like the Smithsonian Institution and the London Natural History Museum.
“We are going to see more of this in New Zealand. For a while now, researchers have used CT scanners to make digital versions of 3D bones, but few museums have this technology in-house. The 3D scanner we have is portable, so it can be brought into museum collections”.
Mr Froggatt is pleased to have new ways of showcasing their collections.
“This is a great example of collaboration between museums and universities, using new technologies to enrich collections and provide greater access to extinct fossils of New Zealand fauna.”
Mr Tennyson says this is an exciting project for the national museum to be a part of.
“Technology like 3D printing is the way of the future, and will help to ensure precious objects, like bones from long extinct birds, are protected while still being fully accessible to the public” he says.
In exchange for digitised versions of the birds, the team will be scanning fossils at Auckland Museum later in the year, to be sent to Te Papa.
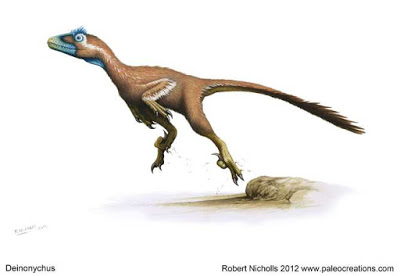
Taking flight? Deinonychus David Nicholls. Credit: Sedgwick Museum, University of Cambridge, Author provided
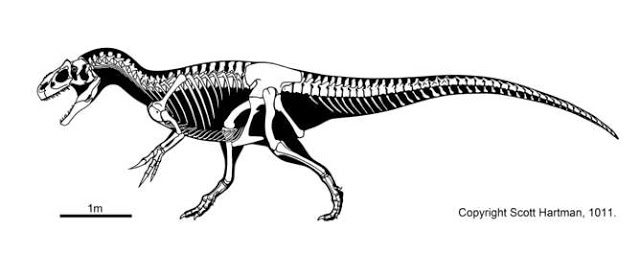
Recently, an auction of a dinosaur skeleton, discovered in Jurassic-aged rocks in the US, was held in West Sussex, England. The skeleton was that of a largely complete, immature, three-metre long carnivorous dinosaur: Allosaurus fragilis – “delicate strange reptile”. It was anticipated that the specimen would sell for somewhere in the region of £300,000-£500,000. Interestingly, bidding stopped before the reserve price was reached, so the specimen is still on the open market.
The price or value of fossils has a history that is practically as long as the science of palaeontology (the study of fossils) itself. Believe it or not, the tongue-twister “she sells seashells on the seashore” has its origin in the work of one of the earliest and most celebrated fossil collectors, Mary Anning. Mary lived during the early decades of the 19th century and had the knack of finding fossils, including those of seashells – bivalves, brachiopods, belemnites and ammonites – along the shores of Dorset and in the crumbling Jurassic cliffs, which she then sold.
Dinosaurs are fossils and do have a value, but I am only really interested in their value as scientific objects. Here are some of the discoveries that really have made a difference to science.
Megalosaurus
Allosaurus. Credit: Scott Hartman, Author provided
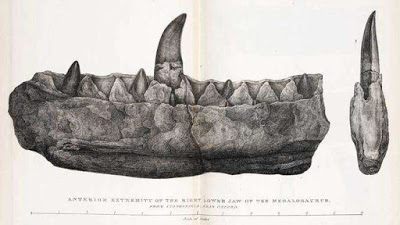
Pride of place must go to Megalosaurus bucklandi “Buckland’s big reptile” – because it proved to be the earliest discovered and scientifically described dinosaur.
It’s remains, though incomplete, began to be collected from quarries at the village of Stonesfield in Oxfordshire in about 1815. The bones, teeth and jaws were passed to Oxford University Museum, where they still reside, and were studied by the greatest living anatomist of the time Georges Cuvier, who visited Oxford (and its custodian William Buckland) from Paris to see the material.
William Buckland (with Cuvier’s help) described these fossils in a scientific article published in 1824. Buckland as well as Cuvier deduced that the bones belonged to a gigantic reptile, the like of which had not been seen before. Over the next decade and half more large fossil reptile bones were recovered in England and reviewed by the British anatomist Richard Owen. In 1842 Owen decided that these fossils were so utterly different from any known reptiles that they deserved to be classified as a completely new group of giant fossil reptiles: Dinosauria – “terrible, or fearfully great, reptiles”. Prior to 1842 nobody had heard of dinosaurs, the rest is, in essence, history. And Megalosaurus was the first.
Archaeopteryx
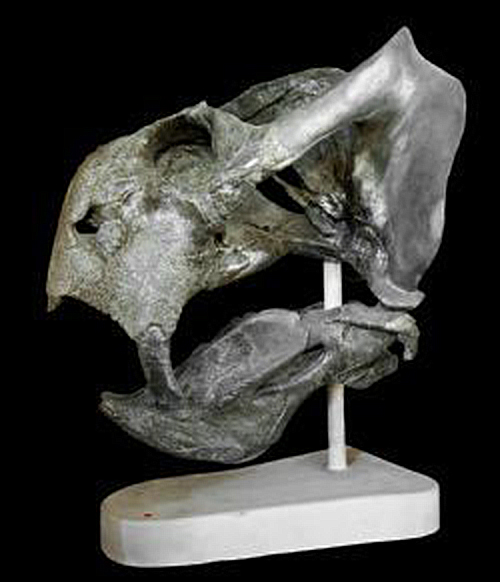
Megalosaurus jaw Buckland
Charles Darwin profoundly disturbed the established Victorian world and galvanised scientific interest in evolution when he published his book On the Origin of Species in 1859. With masterly circumspection, his book laid out the reasons for concluding that organic life had changed or evolved over the immensity of geological time.
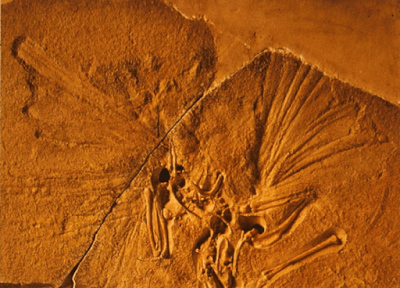
By an astonishing coincidence, a fossil was discovered in a quarry in southern Germany just one year after the publication of Origin. This fossil comprised the major part of the crow-sized, delicately-boned skeleton of a creature that was named by Richard Owen Archaeopteryx lithographica (“ancient wing on writing stone”).
The fossil was extraordinary because around the bones were seen the impressions of feathers (which of course implied that this was a bird) yet what was also seen in the skeleton were clear traces of teeth (no bird has teeth), hands with three well-developed clawed fingers (no bird has clawed fingers of that type) and its tail comprised a long string of small bones from which radiated a fan of feathers (no bird has a long string of tail bones).
This animal was an absolutely perfect “missing link” that connected living birds with feathers, to the group of scaly reptiles with teeth in their jaws, clawed fingers and long bony tails. Just a few years after this discovery was announced a friend and colleague of Darwin’s, Thomas Henry Huxley, suggested on the basis of the structure of Archaeopteryx, that birds and dinosaurs (not just any old reptile) were close relatives.
Not many agreed with Huxley at the time, but he has been proved to have been absolutely correct. Its original remains are preserved at the Natural History Museum, London.
Diplodocus
Archaeopteryx
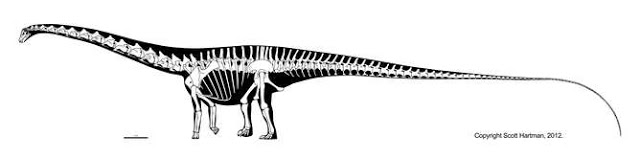
Andrew Carnegie was a profoundly wealthy industrialist based in Pittsburgh, Pennsylvania during the latter half of the 19th century. After he had amassed his fortune, Carnegie began to spend his money philanthropically. News came to him of the discovery of impressive dinosaur skeletons in the American mid-west so he decided he wanted one for his new museum (The Carnegie Museum) in Pittsburgh. So he financed expeditions to northern Wyoming and southern Utah to find some more dinosaurs. And find them they did, including a near complete skeleton of the biggest dinosaur discovered to date.
The skeleton was named Diplodocus carnegiei – “Carnegie’s double-beam”. The entire animal, as reconstructed (with just a few additions for completeness, such as “borrowed” front feet from another animal altogether) was over 25 metres long and dwarfed in size and completeness anything discovered up to that date.
So proud of this dinosaur was Carnegie that he had many copies cast in plaster and sent to museums around the world. The giant dinosaur in the main hall of the Natural History Museum in London is a cast of Carnegie’s Diplodocus.
Deinonychus
Diplodocus Credit: Scott Hartman
In the mid 1960s a young palaeontology professor, John Ostrom from Yale University was exploring the badlands of Montana looking for dinosaur fossils. What he found was to change our understanding of dinosaurs, their biology and behaviour in the most extraordinary way. Ostrom discovered the scattered remains of a medium-sized predatory dinosaur which he studied and then named Deinonychus antirrhopus – “Terrible claw with a counterbalance”.
He realised that this animal was a fast moving, highly intelligent, keen-sighted predator (not at all the slow, lumbering and slow-witted image of the dinosaur that was current at the time). He also showed that it was remarkably bird-like in its anatomy, and suggested that the bird similarities suggested that birds and small predatory dinosaurs were so closely similar that birds probably evolved from them.
These were highly controversial views at the time, even though they echoed the early ideas of Thomas Huxley in the 1860s. They also posed serious biological questions: if birds and dinosaurs of this type are related could it be that some dinosaurs were more like birds in a biological sense? The debate raged for decades.
Scelidosaurus
Sinosauropteryx
I include this dinosaur, which is somewhat less heralded than the others, because it really ought to have been a dinosaur that changed the world.
In 1858 dinosaur bones were discovered in the Jurassic cliffs at Charmouth and soon a nearly complete skeleton of this dinosaur was excavated and given to Richard Owen (the person who invented the Dinosauria) at the British Museum in London.
In the 1860s, Owen named it Scelidosaurus harrisonii – “Harrison’s shoulder reptile”, but almost inexplicably failed to grasp the importance of its anatomy, or the way in which it pointed to the divisions between differing dinosaur groups and, in fact, why dinosaurs had proved so difficult to understand at the time.
Owen had the equivalent of a Rosetta Stone before him, yet he failed to grasp its importance. The probable reason why such an insightful scientist missed such an important moment is that he was simply too busy, including setting in motion the plans to have an entirely new national museum built. Without Owen the Natural History Museum in London, where the original bones of Scelidosaurus still lie, would not have been constructed. In fact, I am studying them at this very moment – hence my undoubted bias.
Sinosauropteryx
In 1996 an astonishing discovery was made in Liaoning, China. It comprised a virtually complete skeleton of a small, predatory dinosaur (smaller than, but generally similar to, Deinonychus).
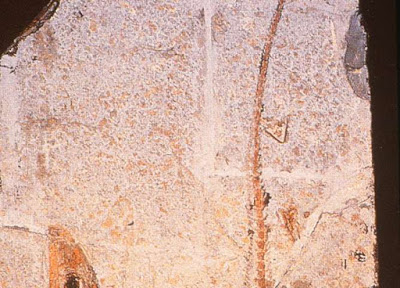
It was described briefly in 1998 and named Sinosauropteryx prima – “First Chinese reptile wing” – but the most extraordinary feature associated with this fossil was that on the rocky slab upon which the skeleton was displayed there were traces of a wispy, dark-staining material that formed a sort of fringe following the body outline, as well as forming a dark spot in the area of the eye, and also formed a dark mass in the area of the gut/body cavity. The conditions of exceptional fossil preservation associated with these rocks in Liaoning seemed to preserve some remnant of the body tissues of the original animal.
Most intriguing was the fringe of tissue around the body: it looked like fur. The implication was that it had an epidermal covering (outer coat), perhaps an insulating layer. Given Ostrom’s earlier work on Deinonychus, the suggestion was made that this was indeed an insulated dinosaur that was able to keep its body warm (rather like a modern bird using fine down-like feathers that might have been preserved as a halo-like fringe when fossilised).
This and subsequent discoveries demonstrated the wisdom of Huxley’s intuition based largely upon Archaeopteryx and the validity of Ostrom’s work on Deinonychus. We now know that many (but not all) dinosaurs were feathered, and that some were capable of flight and some were indeed the progenitors of modern birds.
Note: The above post is reprinted from materials provided by The Conversation. This story is published courtesy of The Conversation (under Creative Commons-Attribution/No derivatives).
Dicynodont skull, an extinct plant-eater Photographer: Hwaja Götz, MfN Berlin
Periods of high extinction on Earth, rather than evolutionary adaptations, may have been a key driver in the diversification of amniotes (today’s dominant land vertebrates, including reptiles, birds, and mammals), according to new research published in Scientific Reports.
The new study reveals that mass extinctions among some groups of amniotes coincide with numerous and large diversifications in other closely related groups.
Conducted by scientists from the Museum für Naturkunde in Berlin, Germany, and the University of Lincoln, UK, the research challenges commonly held views that support a relationship between the evolution of “key innovations” in a group and the rapid increase in its number of species. The researchers behind the new study suggest the evidence for such a relationship has only ever been circumstantial.
The new study examined the issue of adaptive radiations among early amniotes, from 315 to 200 million years ago. This time period witnessed some of the most profound climate changes on a global scale, including the dramatic shrinking of the southern polar icecap, the disappearance of equatorial rainforests, a substantial increase in temperature, and prolonged drought conditions. The time period under study also included the largest mass extinction in Earth’s history, about 252 million years ago.
The concept of adaptive radiation is central to modern evolutionary biology. An adaptive radiation is an extremely rapid increase in the number of species in a group, often as a result of a key evolutionary innovation, which gives the group an advantage over its competitors or allows it to exploit a new resource. Often, if the appearance of an evolutionary novelty coincides temporarily with a large increase in species richness, it is assumed that the innovation is responsible for this pattern.
The scientists used statistical methods to identify which of the amniote groups present during this time were significantly more species-rich than their close relatives, and attempted to identify the factors responsible for this diversity imbalance. The results suggest that, usually, large differences in diversity between two closely related groups are not because more species evolve in the larger group, but rather because more species of the smaller group go extinct.
A key finding of the research is that even the appearance of an important innovation in the larger group does not trigger a large proliferation of species until a major new extinction takes place.
Dr Neil Brocklehurst, a postdoc at the Museum für Naturkunde in Berlin, is the lead author of the paper. He said: “It appears that these ‘key innovations’ do not promote massive increases in species richness, but instead buffer against extinction when times get tough.”
As part of their study, the scientists examined the evolution of the dicynodont therapsids, a group of extinct plant-eaters closely related to mammals. About 270 million years ago, dicynodonts evolved a toothless beak and a back-and-forwards motion of the lower jaw, all of which are clear functional adaptations to help them process plant material. However, it was not until 10 million years later, during a minor extinction event, that dicynodonts began to outcompete their close relatives and became hugely diverse.
A similar pattern is seen in sauropodomorph dinosaurs, the group which would go on to produce the largest land vertebrates of all times, such as the celebrated Brachiosaurus housed at the Museum für Naturkunde Berlin. The large-bodied members of this group do end up becoming significantly more diverse than their close relatives, but not until a mass extinction event that took place at the end of the Triassic, almost 30 million years after their first appearance.
Co-author Dr Marcello Ruta, Senior Lecturer in the School of Life Sciences at the University of Lincoln, UK, explained: “Using large-scale tree diagrams to depict the evolutionary relationships of various groups of organisms, it is possible to address major evolutionary questions that Charles Darwin, and many generations of biologists after him, asked. How did life become so diverse? What triggers major diversification events? How do animals and plants respond to global catastrophes?”
Co-author Jörg Fröbisch, Professor for Palaeobiology and Evolution at the Museum für Naturkunde and Humboldt-Universität zu Berlin, added: “Surprisingly, when these early terrestrial vertebrates evolved a novel structure or function, they did not undergo a dramatic increase in species number. Instead, an adaptive radiation usually occurs much later in the history of these groups, during one of the many extinction events or during times of climate stress.”
Co-author Johannes Müller, Professor of Palaeozoology at the Museum für Naturkunde and Humboldt-Universität zu Berlin, said: “We really did not expect any of these patterns. Our results go against many of the traditional predictions from evolutionary biology, and show that the scientific views about the relevance of key innovations should be carefully reconsidered.”
Reference:
Neil Brocklehurst, Marcello Ruta, Johannes Müller, Jörg Fröbisch. Elevated Extinction Rates as a Trigger for Diversification Rate Shifts: Early Amniotes as a Case Study. Scientific Reports, 2015; 5: 17104 DOI: 10.1038/srep17104
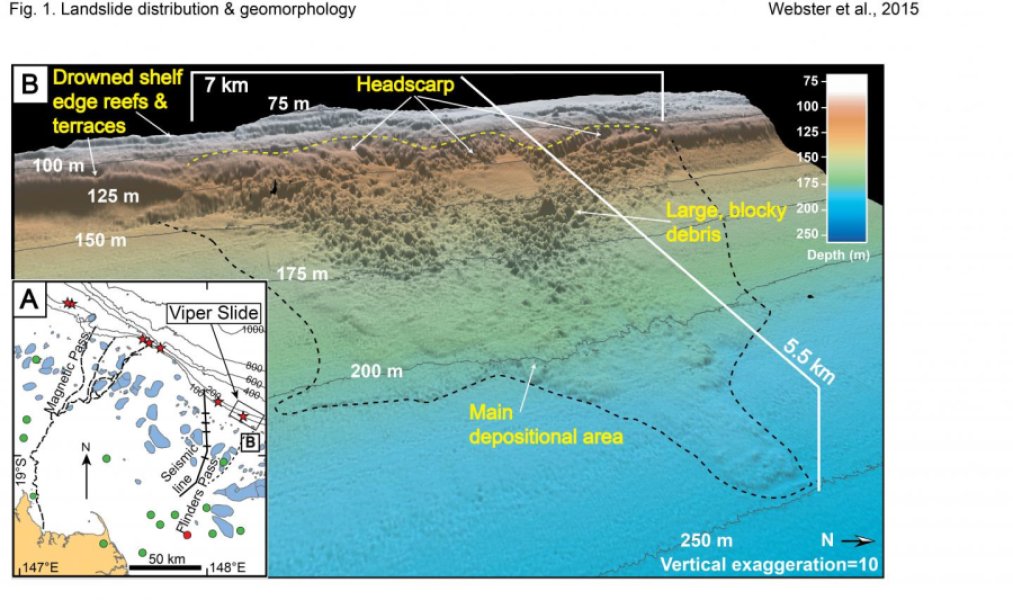
Landslide distribution and geomorphology. Credit: Webster et al, University of Sydney
The world-famous Australian reef is providing an effective barrier against landslide-induced tsunamis, new research shows.
What has developed into the Great Barrier Reef was not always a barrier reef — it was once a fringing reef and did not offer the same protective quality. This is because the coast at this time was much closer to the source of the tsunamis, said lead author of the paper, Associate Professor Jody Webster, from the Geocoastal Research Group at the University of Sydney.
The research shows a shallow underwater landslide occurred 20,000-14,000 years ago, which caused a tsunami 2-3m high. The tsunami could have impacted Aborigines living at the time along estuaries and on islands off the paleo-coastline, which has since receded under the rising sea levels that followed the last ice age.
The 7km-wide landslide occurred off the edge of the continental shelf causing the tsunami on the paleo-coastline lying between Airlie Beach and Townsville in the northern State of Queensland.
Details of the discovery of the submarine landslide and tsunami were published this week in Marine Geology. The international team of researchers used sophisticated computer simulations to recreate what the tsunami would have looked like.
Associate Professor Webster said similar landslides under the sea could occur without our knowledge.
“There is a relatively low chance that a similar submarine landslide with the potential to cause a tsunami of up to three metres or more would happen today,” Associate Professor Webster said.
“However, if one did occur, our findings suggest that the Great Barrier Reef is doing us a great service because of its ability to absorb some of that potential wave energy.”
Just how much energy would be absorbed and what the extent of damage could be done by rising sea levels and tsunamis or king tides is the subject of future research.
In reaching their findings, Dr Jon Hill from the University of York created visual simulations of the tsunami impact at today’s sea level, as well as at a depth of -70m, where the paleo-coastline was before it receded to its current position and was replaced at the shelf edge by the formation of the Great Barrier Reef.
The research team has named the submarine landslide the Viper Slide because of its location adjacent to Viper Reef.
“The discovery of the Viper Slide is the first solid evidence that submarine landslides existed on the Great Barrier Reef,” said Dr Robin Beaman from James Cook University — a member of the expedition that mapped the slide.
Video
A submarine landslide 70m below sea-level causes a tsunami, which travels along the paleo-coastline.
Credit: Dr Jon Hill, University of York.
Reference:
Jody M. Webster, Nicholas P.J. George, Robin J. Beaman, Jon Hill, Ángel Puga-Bernabéu, Gustavo Hinestrosa, Elizabeth A. Abbey, James J. Daniell. Submarine landslides on the great barrier reef shelf edge and upper slope: A mechanism for generating tsunamis on the north-east Australian coast? Marine Geology, 2015; DOI: 10.1016/j.margeo.2015.11.008
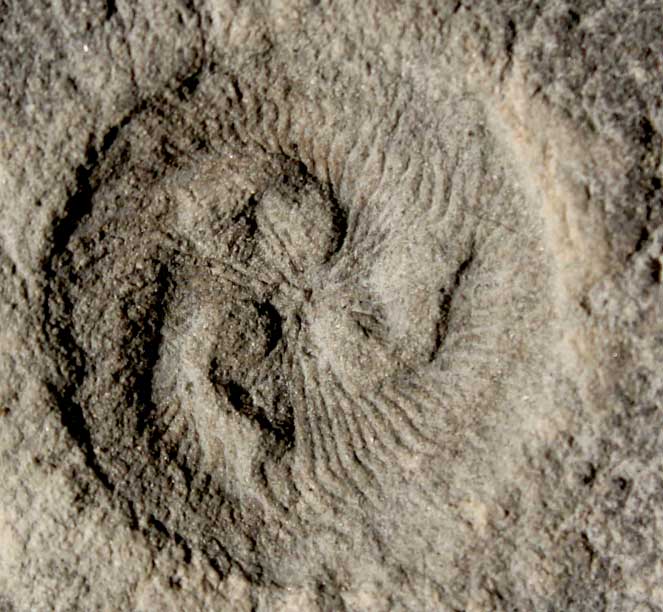
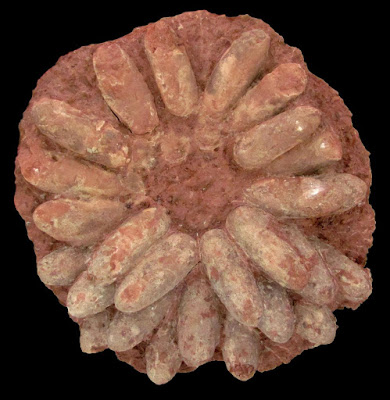
Computer simulations have allowed scientists, led by Dr Imran Rahman of the University of Bristol, UK to work out how this 555-million-year-old organism with no known modern relatives fed. Their research reveals that some of the first large, complex organisms on Earth formed ecosystems that were much more complex than previously thought. Credit: M. Laflamme
Computer simulations have allowed scientists to work out how a puzzling 555-million-year-old organism with no known modern relatives fed, revealing that some of the first large, complex organisms on Earth formed ecosystems that were much more complex than previously thought.
The international team of researchers from Canada, the UK and the USA, including Dr Imran Rahman from the University of Bristol, UK studied fossils of an extinct organism called Tribrachidium, which lived in the oceans some 555 million years ago. Using a computer modelling approach called computational fluid dynamics, they were able to show that Tribrachidium fed by collecting particles suspended in water. This is called suspension feeding and it had not previously been documented in organisms from this period of time.
Tribrachidium lived during a period of time called the Ediacaran, which ranged from 635 million to 541 million years ago. This period was characterised by a variety of large, complex organisms, most of which are difficult to link to any modern species. It was previously thought that these organisms formed simple ecosystems characterised by only a few feeding modes, but the new study suggests they were capable of more types of feeding than previously appreciated.
Dr Simon Darroch, an Assistant Professor at Vanderbilt University, said: “For many years, scientists have assumed that Earth’s oldest complex organisms, which lived over half a billion years ago, fed in only one or two different ways. Our study has shown this to be untrue, Tribrachidium and perhaps other species were capable of suspension feeding. This demonstrates that, contrary to our expectations, some of the first ecosystems were actually quite complex.”
Co-author Dr Marc Laflamme, an Assistant Professor at the University of Toronto Mississauga, added: “Tribrachidium doesn’t look like any modern species, and so it has been really hard to work out what it was like when it was alive. The application of cutting-edge techniques, such as CT scanning and computational fluid dynamics, allowed us to determine, for the first time, how this long-extinct organism fed.”
Computational fluid dynamics is a method for simulating fluid flows that is commonly used in engineering, for example in aircraft design, but this is one of the first applications of the technique in palaeontology (following up previous research carried out at Bristol).
Dr Rahman, a Research Fellow in Bristol’s School of Earth Sciences said: “The computer simulations we ran allowed us to test competing theories for feeding in Tribrachidium. This approach has great potential for improving our understanding of many extinct organisms.”
Co-author Dr Rachel Racicot, a postdoctoral researcher at the Natural History Museum of Los Angeles County added: “Methods for digitally analysing fossils in 3D have become increasingly widespread and accessible over the last 20 years. We can now use these data to address any number of questions about the biology and ecology of ancient and modern organisms.”
The study is published today in the journal Science Advances.
Reference:
‘Suspension feeding in the enigmatic Ediacaran organism Tribrachidium demonstrates complexity of Neoproterozoic ecosystems’ by Imran A. Rahman, Simon A. F. Darroch, Rachel A. Racicot and Marc Laflamme in Science Advances, DOI: 10.1126/sciadv.1500800
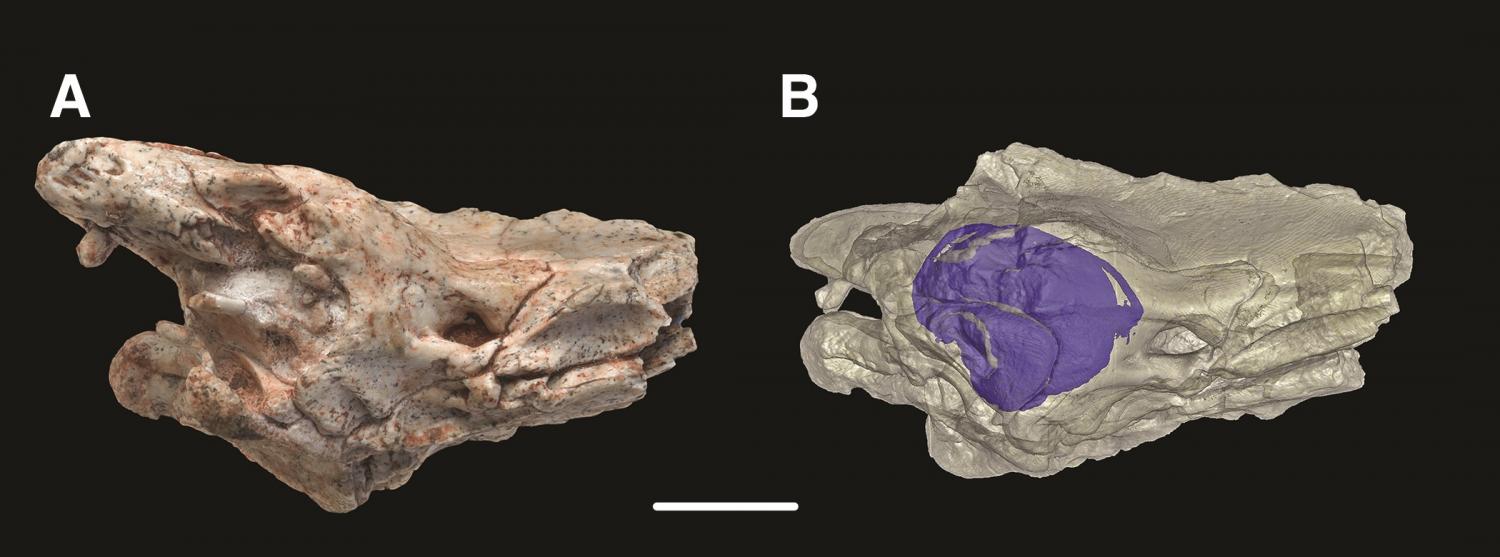
Image and representation of brain case and inner ear of Dinilysia patagonica fossil, which scientists at the University of Edinburgh and American Museum of Natural History have used to show that modern snakes lost their legs when their ancestors became expert burrowers. Credit: Hongyu Yi
Fresh analysis of a reptile fossil is helping scientists solve an evolutionary puzzle – how snakes lost their limbs.
The 90 million-year-old skull is giving researchers vital clues about how snakes evolved.
Comparisons between CT scans of the fossil and modern reptiles indicate that snakes lost their legs when their ancestors evolved to live and hunt in burrows, which many snakes still do today.
The findings show snakes did not lose their limbs in order to live in the sea, as was previously suggested.
Scientists used CT scans to examine the bony inner ear of Dinilysia patagonica, a 2-meter long reptile closely linked to modern snakes. These bony canals and cavities, like those in the ears of modern burrowing snakes, controlled its hearing and balance.
They built 3D virtual models to compare the inner ears of the fossils with those of modern lizards and snakes. Researchers found a distinctive structure within the inner ear of animals that actively burrow, which may help them detect prey and predators. This shape was not present in modern snakes that live in water or above ground.
The findings help scientists fill gaps in the story of snake evolution, and confirm Dinilysia patagonica as the largest burrowing snake ever known. They also offer clues about a hypothetical ancestral species from which all modern snakes descended, which was likely a burrower.
The study, published in Science Advances, was supported by the Royal Society.
Dr Hongyu Yi, of the University of Edinburgh’s School of GeoSciences, who led the research, said: “How snakes lost their legs has long been a mystery to scientists, but it seems that this happened when their ancestors became adept at burrowing. The inner ears of fossils can reveal a remarkable amount of information, and are very useful when the exterior of fossils are too damaged or fragile to examine.”
Mark Norell, of the American Museum of Natural History, who took part in the study, said: “This discovery would not have been possible a decade ago – CT scanning has revolutionised how we can study ancient animals. We hope similar studies can shed light on the evolution of more species, including lizards, crocodiles and turtles.”
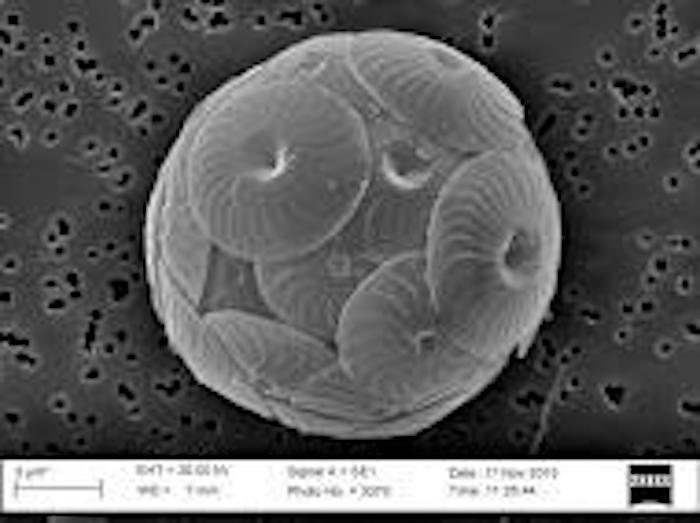
This is a scanning electron microscope image of a coccolithophore, which can measure from 5 to 15 microns across, less than a fifth the width of a human hair. Credit: Amy Wyeth, Bigelow Laboratory for Ocean Sciences
A microscopic marine alga is thriving in the North Atlantic to an extent that defies scientific predictions, suggesting swift environmental change as a result of increased carbon dioxide in the ocean, a study led a by Johns Hopkins University scientist has found.
What these findings mean remains to be seen, however, as does whether the rapid growth in the tiny plankton’s population is good or bad news for the planet.
Published Thursday in the journal Science, the study details a tenfold increase in the abundance of single-cell coccolithophores between 1965 and 2010, and a particularly sharp spike since the late 1990s in the population of these pale-shelled floating phytoplankton.
“Something strange is happening here, and it’s happening much more quickly than we thought it should,” said Anand Gnanadesikan, associate professor in the Morton K. Blaustein Department of Earth and Planetary Sciences at Johns Hopkins and one of the study’s five authors.
Gnanadesikan said the Science report certainly is good news for creatures that eat coccolithophores, but it’s not clear what those are. “What is worrisome,” he said, “is that our result points out how little we know about how complex ecosystems function.” The result highlights the possibility of rapid ecosystem change, suggesting that prevalent models of how these systems respond to climate change may be too conservative, he said.
The team’s analysis of Continuous Plankton Recorder survey data from the North Atlantic Ocean and North Sea since the mid-1960s suggests rising carbon dioxide in the ocean is causing the coccolithophore population spike, said Sara Rivero-Calle, a Johns Hopkins doctoral student and lead author of the study. A stack of laboratory studies supports the hypothesis, she said. Carbon dioxide is a greenhouse gas already fingered by scientific consensus as one of the triggers of global warming.
“Our statistical analyses on field data from the CPR point to carbon dioxide as the best predictor of the increase” in coccolithophores, Rivero-Calle said. “The consequences of releasing tons of CO2 over the years are already here and this is just the tip of the iceberg.”
The CPR survey is a continuing study of plankton, floating organisms that form a vital part of the marine food chain. The project was launched by a British marine biologist in the North Atlantic and North Sea in the early 1930s. It is conducted by commercial ships trailing mechanical plankton-gathering contraptions through the water as they sail their regular routes.
William M. Balch of the Bigelow Laboratory for Ocean Sciences in Maine, a co-author of the study, said scientists might have expected that ocean acidity due to higher carbon dioxide would suppress these chalk-shelled organisms. It didn’t. On the other hand, their increasing abundance is consistent with a history as a marker of environmental change.
“Coccolithophores have been typically more abundant during Earth’s warm interglacial and high CO2 periods,” said Balch, an authority on the algae. “The results presented here are consistent with this and may portend, like the ‘canary in the coal mine,’ where we are headed climatologically.”
Coccolithophores are single-cell algae that cloak themselves in a distinctive cluster of pale disks made of calcium carbonate, or chalk. They play a role in cycling calcium carbonate, a factor in atmospheric carbon dioxide levels. In the short term they make it more difficult to remove carbon dioxide from the atmosphere, but in the long term — tens and hundreds of thousands of years — they help remove carbon dioxide from the atmosphere and oceans and confine it in the deep ocean.
In vast numbers and over eons, coccolithophores have left their mark on the planet, helping to show significant environmental shifts. The White Cliffs of Dover are white because of massive deposits of coccolithophores. But closer examination shows the white deposits interrupted by slender, dark bands of flint, a product of organisms that have glassy shells made of silicon, Gnanadesikan said.
“These clearly represent major shifts in ecosystem type,” Gnanadesikan said. “But unless we understand what drives coccolithophore abundance, we can’t understand what is driving such shifts. Is it carbon dioxide?”
The study was supported by the Sir Alister Hardy Foundation for Ocean Science, which now runs the CPR, and by the Johns Hopkins Applied Physics Laboratory. Other co-authors are Carlos del Castillo, a former biological oceanographer at APL who now leads NASA’s Ocean Ecology Laboratory, and Seth Guikema, a former Johns Hopkins faculty member now at the University of Michigan.
Reference:
S. Rivero-Calle, A. Gnanadesikan, C. E. Del Castillo, W. Balch, S. D. Guikema. Multidecadal increase in North Atlantic coccolithophores and the potential role of rising CO2. Science, 2015; DOI: 10.1126/science.aaa8026
During upheaval in Libya in 2013, a window of opportunity opened for scientists from the University of Kansas to perform research at the Zallah Oasis, a promising site for unearthing fossils from the Oligocene period, roughly 30 million years ago.
From that work, the KU-led team last week published a description of a previously unknown anthropoid primate — a forerunner of today’s monkeys, apes and humans — in the Journal of Human Evolution. They’ve dubbed their new find Apidium zuetina.
Significantly, it’s the first example of Apidium to be found outside of Egypt.
“Apidium is interesting because it was the first early anthropoid primate ever to be found and described, in 1908,” said K. Christopher Beard, Distinguished Foundation Professor of Ecology and Evolutionary Biology and senior curator with KU’s Biodiversity Institute, who headed the research. “The oldest known Apidium fossils are about 31 million years old, while the youngest are 29 million. Before our discovery in Libya, only three species of Apidium were ever recovered in Egypt. People had come up with the idea that these primates had evolved locally in Egypt.”
Beard said evidence that Apidium had dispersed across North Africa was the key facet of the find. He believes shifting climatic and environmental conditions shaped the distribution of species of Apidium, which affected their evolution.
“We’ve found evidence that climate change — not warming, but cooling and drying — across the Eocene-Oligocene boundary probably is the root cause in kicking anthropoid evolution into overdrive,” he said. “All of these anthropoids, which were our distant relatives, were living up in the trees — none of them were coming down. When the world became cooler and dryer in this period, what was previously a continuous belt of forest became more fragmented. This created barriers to gene flow and movement of animals from one part of forest to what used to be adjacent forest.”
With a forest broken up, there was an inhibition of gene flow that through time resulted in speciation, or the creation of new species, according to the KU researcher.
“Animals that are sequestered become different species over millions of years,” Beard said. “As the climate oscillates again, you’ve got different species of Apidium. As forests expand and contract, now you’ve got competition between species of Apidium that have never seen each other before. One species outcompetes the other, the other goes extinct, and we think that’s what we’re picking up with this Libyan Apidium, which is related to the youngest and largest species of Apidium known from Egypt.”
Beard said that Apidium zuetina would have been physically similar to modern-day squirrel monkeys from South America, but with smaller brains, and would have dined on fruits, nuts and seeds.
“We know that Apidium was a very active arboreal monkey, a really good leaper,” he said. “We know they actually had fused lower-leg bones just above the ankle joint. That’s really unusual for anthropoid primates, and the only reason for it to happen is because you like to jump a lot, as it stabilized the join between those bones and the ankle.”
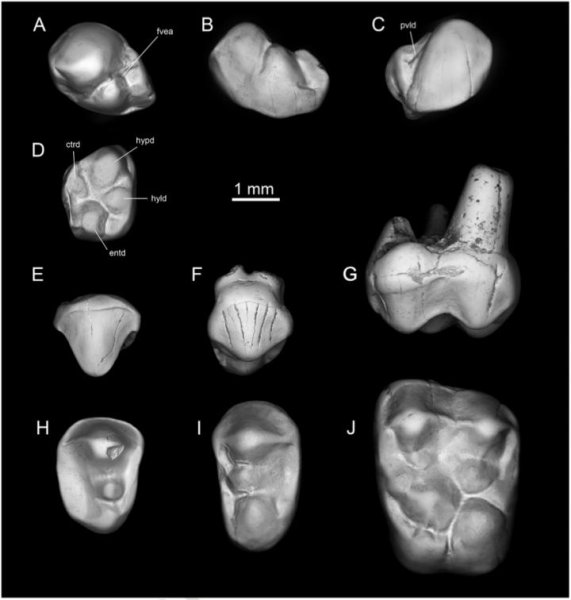
The team identified Apidium zuetina through detailed analysis of its teeth.
“All of the fossils we have so far are just teeth, not even jaw bones — but fortunately, the teeth of these anthropoids are so distinct and diagnostic that they function like fingerprints at a crime scene,” Beard said. “Studying details of cusps and crests on teeth, we can determine evolutionary relationships. It might sound like thin evidence, but I suspect even with whole skeletons we’d still be focused on teeth to determine relationships. This is because teeth evolve rapidly in response to shifting diets, while an animal’s skull and skeleton typically evolves more slowly. Fortunately for paleontologists, teeth are well-documented in the fossil record because tooth enamel is the hardest part of a mammal body, durable and easy to fossilize.”
Yet, the researchers chose to name Apidium zuetina not after any of its physical characteristics, but after the Zuetina Oil Company that made the dangerous Libyan fieldwork possible.
“Without their logistical support, we couldn’t have done this work at all,” Beard said. “We did this just after end of the Libyan civil war that led to the overthrow of Gadhafi.”
Beard said the discovery took place during a brief lull in violence in Libya. But the trip to the Zallah Oasis was precarious nonetheless.
“We knew it was risky, but we thought we could go because of our local collaborator, Mustafa Salem, a geology professor at Tripoli University,” he said. “He’s revered as a father figure among Libyan geologists. An oil facility was close to some interesting sites, and after Mustafa contacted a former student who was working there, they provided our team with charter flights to an airstrip near the oil facility. Without that alone, we couldn’t have done our fieldwork — the roads are too dangerous with bandits and the like. They also gave us lodging, food, water and security.”
Beard said armed guards accompanied the team everywhere, manning trucks mounted with antiaircraft guns.
“They never asked for a nickel from us in return,” said the KU researcher. “There was an Islamist attack on a gas facility at the same time near the Algerian-Libyan border, and they killed 30-40 workers. So the security protected us and potentially saved our lives.”
Reference:
K. Christopher Beard, Pauline M.C. Coster, Mustafa J. Salem, Yaowalak Chaimanee, Jean-Jacques Jaeger. A new species of Apidium (Anthropoidea, Parapithecidae) from the Sirt Basin, central Libya: First record of Oligocene primates from Libya. Journal of Human Evolution, 2016; 90: 29 DOI: 10.1016/j.jhevol.2015.08.010
Extinct archosaurs’ eggshell porosity may be used as a proxy for predicting covered or exposed nest types, according to a study published November 25, 2015 in the open-access journal PLOS ONE by Kohei Tanaka from the University of Calgary and colleagues.
Knowledge about dinosaur nests may provide insight into the evolution of nesting and reproductive behaviors among archosaurs, a group that includes living birds and crocodilians, as well as extinct dinosaurs. Unfortunately, little remains of prehistoric nests, and most information on extinct archosaurs is only gleaned indirectly through comparison with living relatives.
Among extant archosaurs, two general types of nests are observed: open nests, where the eggs are uncovered and built by species that brood their eggs; and covered nests, built by species that incubate their eggs using external heat sources. Scientists try to infer the type of nest by looking at different characteristics of the eggs and the nest setting. The authors of this particular study proposed a statistically rigorous approach to infer nest type based on large datasets of eggshell porosity and egg mass compiled for over 120 extant archosaur species and 29 extinct archosaur taxa.
The researchers found a strong correlation between eggshell porosity and covered or exposed nest types among extant archosaurs, which indicates that eggshell porosity may be used as a proxy for nest type, which may help predict nest type in extinct taxa.
Their results show that covered nests were likely used by more primitive dinosaurs, and the transition of theropods from covered to uncovered nests may have allowed the exploitation of alternate nesting locations. These changes in nesting styles may have lessened the odds of nesting failure due to predation, flooding, or torrential rainfall, and may have played a role in the evolutionary success of maniraptorans, including birds.
Reference:
Tanaka K, Zelenitsky DK, Therrien F (2015) Eggshell Porosity Provides Insight on Evolution of Nesting in Dinosaurs. PLoS ONE 10(11): e0142829. DOI: 10.1371/journal.pone.0142829
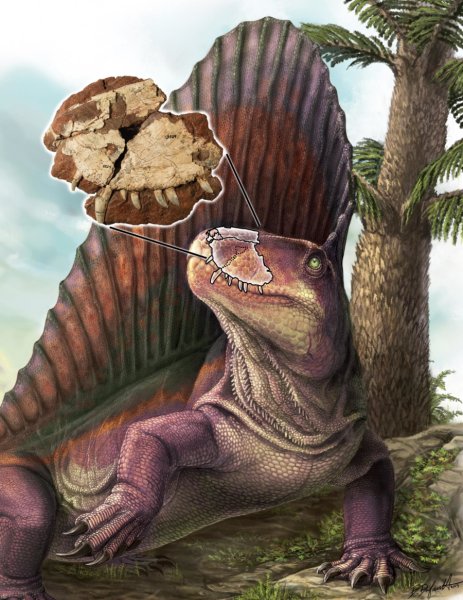
Dimetrodon is shown with an overlay of the “Bathygnathus” fossil from PEI, with a Walchia tree in the background (a common fossil found on PEI). Credit: Illustration by Danielle Dufault
A “dinosaur” fossil originally discovered on Prince Edward Island has been shown to have steak knife-like teeth, and researchers from U of T Mississauga, Carleton University and the Royal Ontario Museum have changed its name to Dimetrodon borealis–marking the first occurrence of a Dimetrodon fossil in Canada.
“It’s really exciting to discover that the detailed anatomy of the teeth has finally allowed us to identify precisely this important Canadian fossil,” says lead author Kirstin Brink, who did the research while at UTM. “Dimetrodon is actually more closely related to mammals than it is to dinosaurs.” In fact, it’s believed they went extinct some 40 million years before the dinosaurs.
The study appears in the November 23 issue of the Canadian Journal of Earth Sciences.
The fossil, previously known at Bathygnathus borealis, was collected in 1845 while a farmer was digging out a well on his property near French River, PEI. As there were no natural history museums in Canada at the time the fossil was found, it was sold to the Academy of Natural Sciences in Philadelphia, where Joseph Leidy–a preeminent paleontologist–could study and name it.
Leidy named the fossil Bathygnathus (meaning deep jaw) borealis (from the north) because he mistook it as the lower jaw of a dinosaur, similar to the large bipedal species that were being collected in Europe at the time.
The Bathygnathus specimen was the first “dinosaur,” and the second vertebrate fossil named from Canada (Dendrerpeton, an extinct amphibian from Nova Scotia, was named by Sir Richard Owen two months earlier). Several paleontologists have studied the Bathygnathus specimen since it was first named, but its precise identity was unknown. For example, it was unclear whether it had Dimetrodon’s signature dorsal sail–created by tissue stretched between spines sticking up from its backbone–or lacked a sail like its smaller cousin Sphenacodon.
Using family trees and imaging techniques to see the internal anatomy of the fossil, researchers found that the eight preserved teeth linked the fossil to the Dimetrodon family–the first terrestrial animal to have “ziphodont” teeth.
“These are blade-like teeth with tiny serrations along the front and back of the teeth, similar to a steak knife,” says Professor Robert Reisz, the senior author of the study. “The roots of these teeth are very long, around double the length of the crowns. This type of tooth is very effective for biting and ripping flesh from prey.”
Fossils of Dimetrodon have now been found in the USA, Canada and Germany.
Reference:
Kirstin S. Brink, Hillary C. Maddin, David C. Evans, Robert R. Reisz, Hans-Dieter Sues. Re-evaluation of the historic Canadian fossilBathygnathus borealisfrom the Early Permian of Prince Edward Island. Canadian Journal of Earth Sciences, 2015; 1 DOI: 10.1139/cjes-2015-0100
Note: The above post is reprinted from materials provided by University of Toronto. The original item was written by Nicolle Wahl.
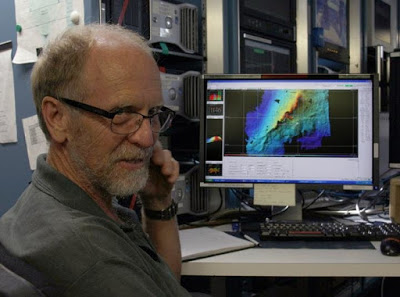
This image shows Professor Arculus, The Australian National University. Credit: Charles Tambiah & MNF
Scientists drilling into the ocean floor have for the first time found out what happens when one tectonic plate first gets pushed under another.
The international expedition drilled into the Pacific ocean floor and found distinctive rocks formed when the Pacific tectonic plate changed direction and began to plunge under the Philippine Sea Plate about 50 million years ago.
“It’s a bit like a rugby scrum, with two rows of forwards pushing on each other. Then one side goes down and the other side goes over the top,” said study leader Professor Richard Arculus, from The Australian National University (ANU).
“But we never knew what started the scrum collapsing,” said Professor Arculus, a petrologist in the ANU Research School of Earth Sciences.
The new knowledge will help scientists understand the huge earthquakes and volcanoes that form where the Earth’s plates collide and one plate gets pushed under the other.
As part of the International Ocean Discovery Program, the team studied the sea floor in 4,700 metres of water in the Amami Sankaku Basin of the north-western Pacific Ocean, near the Izu-Bonin-Mariana Trench, which forms the deepest parts of the Earth’s oceans.
Drilling 1,600 metres into the sea floor, the team recovered rock types from the extensive rifts and big volcanoes that were initiated as one plate bored under the other in a process known as subduction.
“We found rocks low in titanium, but high in scandium and vanadium, so the Earth’s mantle overlying the subducting plate must have been around 1,300 degrees Celsius and perhaps 150 degrees hotter than we expected to find,” Professor Arculus said.
The team found the tectonic scrum collapsed at the south end first and then the Pacific Plate rapidly collapsed 1,000 kilometres northwards in about one million years.
“It’s quite complex. There’s a scissoring motion going on. You’d need skycam to see the 3D nature of it,” Professor Arculus said.
Professor Arculus said that the new knowledge could give insights into the formation of copper and gold deposits that are often formed where plates collide.
The research is published in Nature Geoscience.
Reference:
Richard J. Arculus, Osamu Ishizuka, Kara A. Bogus, Michael Gurnis, Rosemary Hickey-Vargas, Mohammed H. Aljahdali, Alexandre N. Bandini-Maeder, Andrew P. Barth, Philipp A. Brandl, Laureen Drab, Rodrigo do Monte Guerra, Morihisa Hamada, Fuqing Jiang, Kyoko Kanayama, Sev Kender, Yuki Kusano, He Li, Lorne C. Loudin, Marco Maffione, Kathleen M. Marsaglia, Anders McCarthy, Sebastién Meffre, Antony Morris, Martin Neuhaus, Ivan P. Savov, Clara Sena, Frank J. Tepley III, Cees van der Land, Gene M. Yogodzinski, Zhaohui Zhang. A record of spontaneous subduction initiation in the Izu–Bonin–Mariana arc. Nature Geoscience, 2015; 8 (9): 728 DOI: 10.1038/ngeo2515
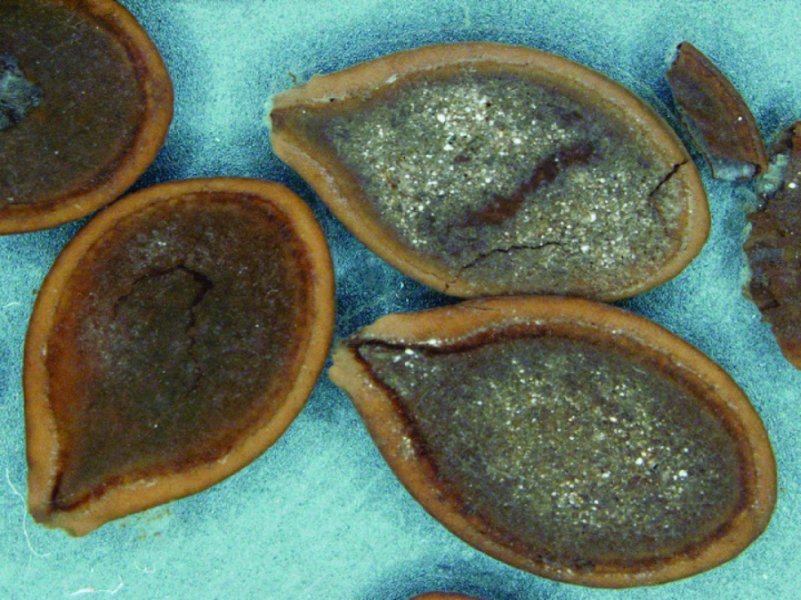
Cucurbita seeds were found in mastadon dung. Credit: Lee Newsom, Penn State
If Pleistocene megafauna — mastodons, mammoths, giant sloths and others — had not become extinct, humans might not be eating pumpkin pie and squash for the holidays, according to an international team of anthropologists.
“It’s been suggested before and I think it’s a very reasonable hypothesis, that wild species of pumpkin and squash weren’t used for food early in the domestication process,” said Logan Kistler, NERC Independent Research Fellow, University of Warwick, U.K. and recent Penn State postdoctoral fellow. “Rather, they might have been useful for a variety of other purposes like the bottle gourd, as containers, tools, fishnet floats, etc. At some point, as a symbiotic relationship developed, palatability evolved, but the details of that process aren’t known at the present.”
Researchers believe that initially humans did not eat wild pumpkin and squash — members of the cucurbita family — because the wild fruit is not only bitter but also toxic to humans and smaller animals. However, clear evidence exists that very large animals — megafauna — that lived 12,000 years ago did eat these fruit.
“Lee Newsom (associate professor of anthropology, Penn State and study co-author) has recovered many wild gourd/squash seeds from ancient Mastodon dung, suggesting that large herbivores may have been an important feature in the natural history of these wild plants,” said Kistler.
The researchers looked at varieties of modern domestic cucurbits, modern wild cucurbits and archaeological specimens. They believe that changes in distribution of the wild plants are directly related to the disappearance of the large animals.
“We performed an ancient DNA study of cucurbita including modern wild plants, domesticated plants and archaeological samples from multiple locations,” said George Perry, assistant professor of anthropology and biology. “The results suggest, or confirm, that some lineages domesticated by humans are now extinct in the wild.”
Without elephant-sized animals to distribute seeds, wild plants will grow only where the fruit drops — as far as the pumpkin rolls. At the same time, the disappearance of megafauna altered the landscape from one of a patchwork of environments to something more uniform. Cucurbita are weedy plants that liked the disturbed landscape created by the megafauna, but faired less well in the new landscape of the Holocene.
The researchers also looked at bitter taste receptors in animals and found that smaller animals with more diverse dietary patterns posses many more bitter taste receptors than large animals that ete only a few things.
“We compared bitter taste receptor genes in about 40 living mammals and found that body sizes and dietary breadth were important,” said Perry. “The greater the size, the fewer receptors. The greater the dietary depth, the more receptors.”
If humans initially used cucurbita for nonfood applications, they somehow eventually managed to find those plants that mutated and lost their toxicity. According to Kistler, cucurbita may have been domesticated at least six different times in six different places.
“There is a huge amount of diversity in some of the domestic species and between them as well,” said Kistler. “Cucurbita pepo is probably the most variable, with jack-o-lantern pumpkins, acorn squash, zucchinis and others. Cucurbita moschata contains the butternut squashes and the kind of pumpkin that goes into the cans that a lot of folks will be baking into pies in a few weeks.”
Reference:
L. Kistler, L. A. Newsom, T. M. Ryan, A. C. Clarke, B. D. Smith, G. H. Perry. Gourds and squashes (Cucurbita spp.) adapted to megafaunal extinction and ecological anachronism through domestication. Proceedings of the National Academy of Sciences, 2015; DOI: 10.1073/pnas.1516109112
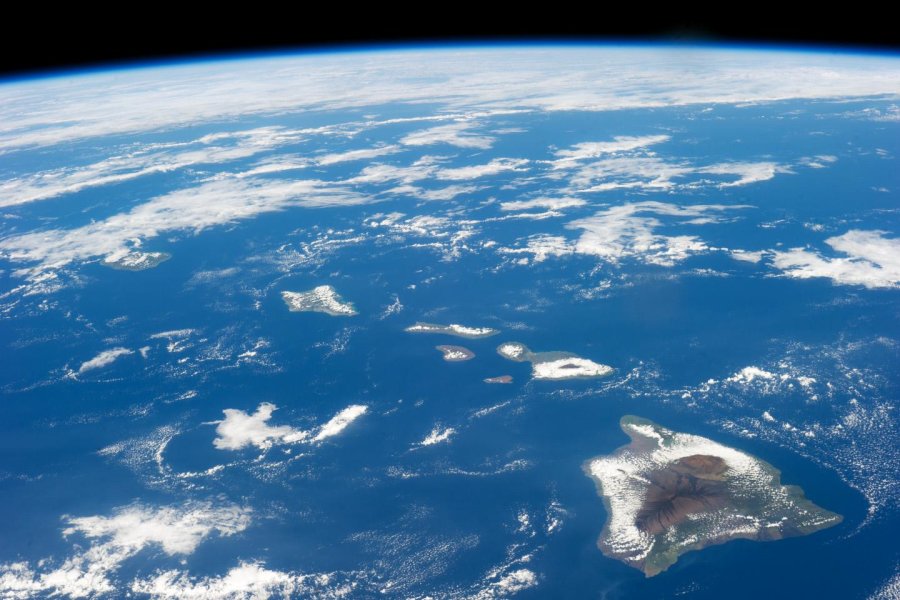
A group of former and current Arizona State University researchers say chemical differences found between rocks samples at volcanic hotspots around the world can be explained by a model of mantle dynamics that involves plumes, upwellings of abnormally hot rock within the Earth’s mantle, that originate in the lower mantle and physically interact with chemically distinct piles of material. Credit: NASA/Jeff Schmaltz/LANCE/EOSDIS MODIS Rapid Response Team/GSFC
The journey for volcanic rocks found on many volcanic islands began deep within Earth.
Brought to Earth’s surface in eruptions of deep volcanic material, these rocks hold clues as to what is going on deep beneath Earth’s surface.
Studies of rocks found on certain volcanic islands, known as ocean island basalts, revealed that although these erupted rocks originate from Earth’s interior, they are not the same chemically.
According to a group of current and former researchers at Arizona State University, the key to unlocking this complex, geochemical puzzle rests in a model of mantle dynamics consisting of plumes — upwelling’s of abnormally hot rock within Earth’s mantle — that originate in the lower mantle and physically interact with chemically distinct piles of material.
The team revealed that this theoretical model of material transport can easily produce the chemical variability observed at hotspot volcanoes (such as Hawaii) around the world.
“This model provides a platform for understanding links between the physics and chemistry that formed our modern world as well as habitable planets elsewhere,” says Curtis Williams, lead author of the study whose results are published in the Nov. 24 issue of the journal Nature Communications.
Basalts collected from ocean islands such as Hawaii and those collected from mid-ocean ridges (that erupt at spreading centers deep below oceans) may look similar to the naked eye; however, in detail their trace elements and isotopic compositions can be quite distinct. These differences provide valuable insight into the chemical structure and temporal evolution of Earth’s interior.
“In particular, it means that Earth’s mantle — the hot rock below Earth’s crust but above the planet’s iron core — is compositionally heterogeneous. Understanding when and where these heterogeneities are formed and how they are transported through the mantle directly relates to the initial composition of Earth and how it has evolved to its current, habitable state,” said Williams, a postdoc at UC Davis.
While a graduate student in ASU’s School of Earth and Space Exploration, Williams and faculty members Allen McNamara and Ed Garnero conceived a study to further understand how chemical complexities that exist deep inside Earth are transported to the surface and erupt as intraplate volcanism (such as that which formed the Hawaiian islands). Along with fellow graduate student Mingming Li and Professional Research Associate Matthijs van Soest, the researchers depict a model Earth, where in its interior resides distinct reservoirs of mantle material that may have formed during the earliest stages of Earth’s evolution.
Employing such reservoirs into their models is supported by geophysical observations of two, continent-sized regions — one below the Pacific Ocean and one below parts of the Atlantic Ocean and Africa — sitting atop the core-mantle boundary.
“In the last several years, we have witnessed a sharpening of the focus knob on seismic imaging of Earth’s deep interior. We have learned that the two large anomalous structures at the base of the mantle behave as if they are compositionally distinct. That is, we are talking about different stuff compared to the surrounding mantle. These represent the largest internal anomalies in Earth of unknown chemistry and origin,” said Garnero.
These chemically distinct regions also underlie a majority of hotspot volcanism, via hot mantle plumes from the top of the piles to Earth’s surface, suggesting a potential link between these ancient, chemically distinct regions and the chemistry of hotspot volcanism.
To test the validity of their model, Williams and coauthors compare their predictions of the variability of the ratios of helium isotopes (helium-3 and helium-4) in plumes to that observed in ocean island basalts.
3He is a so-called primordial isotope found in Earth’s mantle. It was created before Earth was formed and is thought to have become entrapped within Earth during planetary formation. Today, it is not being added to Earth’s inventory at a significant rate, unlike 4He, which accumulates over time.
Williams explained: “The ratio of helium-3 to helium-4 in mid-ocean ridge basalts are globally characterized by a narrow range of small values and are thought to sample a relatively homogenous upper mantle. On the other hand, ocean island basalts display a much wider range, from small to very large, providing evidence that they are derived from different source regions and are thought to sample the lower mantle either partially or in its entirety.”
The variability of 3He to 4He in ocean island basalts is not only observed between different hotspots, but temporally within the different-aged lavas of a single hotspot track.
“The reservoirs and dynamics associated with this variability had remained unclear and was the primary motivation behind the study presented here,” said Williams.
Reference:
Curtis D. Williams, Mingming Li, Allen K. McNamara, Edward J. Garnero, Matthijs C. van Soest. Episodic entrainment of deep primordial mantle material into ocean island basalts. Nature Communications, 2015; 6: 8937 DOI: 10.1038/ncomms9937
Planet Earth experienced a global climate shift in the late 1980s on an unprecedented scale, fuelled by anthropogenic warming and a volcanic eruption, according to new research published this week.
Scientists say that a major step change, or ‘regime shift’, in Earth’s biophysical systems, from the upper atmosphere to the depths of the ocean and from the Arctic to Antarctica, was centred around 1987, and was sparked by the El Chichón volcanic eruption in Mexico five years earlier.
Their study, published in Global Change Biology, documents a range of associated events caused by the shift, from a 60% increase in winter river flow into the Baltic Sea to a 400% increase in the average duration of wildfires in the Western United States. It also suggests that climate change is not a gradual process, but one subject to sudden increases, with the 1980s shift representing the largest in an estimated 1,000 years.
Philip C. Reid, Professor of Oceanography at Plymouth University’s Marine Institute, and Senior Research Fellow at the Sir Alister Hardy Foundation for Ocean Science (SAHFOS), is the lead author of the report, Global impacts of the 1980s regime shift.
“We demonstrate, based on 72 long time series, that a major change took place in the world centred on 1987 that involved a step change and move to a new regime in a wide range of Earth systems,” said Professor Reid.
“Our work contradicts the perceived view that major volcanic eruptions just lead to a cooling of the world. In the case of the regime shift it looks as if global warming has reached a tipping point where the cooling that follows such eruptions rebounds with a rapid rise in temperature in a very short time. The speed of this change has had a pronounced effect on many biological, physical and chemical systems throughout the world, but is especially evident in the Northern temperate zone and Arctic.”
Over the course of three years, the scientists — drawing upon a range of climate models, using data from nearly 6,500 meteorological stations, and consulting innumerable scientists and their studies round the world — found evidence of the shift across a wide range of biophysical indicators, such as the temperature and salinity of the oceans, the pH level of rivers, the timing of land events, including the behaviour of plants and birds, the amount of ice and snow in the cryosphere (the frozen world), and wind speed changes.
They detected a marked decline in the growth rate of CO2 in the atmosphere after the regime shift, coinciding with a sudden growth in land and ocean carbon sinks — such as new vegetation spreading into polar areas previously under ice and snow. And they found that the annual timing of the regime shift appeared to have moved regionally around the world from west to east, starting with South America in 1984, North America (1985), North Atlantic (1986), Europe (1987), and Asia (1988).
These dates coincide with significant shifts to an earlier flowering date for cherry trees around Earth in Washington DC, Switzerland, and Japan and coincided with the first evidence of the extinction of amphibians linked to global warming, such as the harlequin frog and golden toad in Central and South America.
Second author Renata E. Hari, Eawag, Dübendorf, Switzerland, said: “The 1980s regime shift may be the beginning of the acceleration of the warming shown by the IPCC. It is an example of the unforeseen compounding effects that may occur if unavoidable natural events like major volcanic eruptions interact with anthropogenic warming.”
Reference:
Philip C. Reid, Renata E. Hari, Grégory Beaugrand, David M. Livingstone, Christoph Marty, Dietmar Straile, Jonathan Barichivich, Eric Goberville, Rita Adrian, Yasuyuki Aono, Ross Brown, James Foster, Pavel Groisman, Pierre Hélaouët, Huang-Hsiung Hsu, Richard Kirby, Jeff Knight, Alexandra Kraberg, Jianping Li, Tzu-Ting Lo, Ranga B. Myneni, Ryan P. North, J. Alan Pounds, Tim Sparks, René Stübi, Yongjun Tian, Karen H. Wiltshire, Dong Xiao, Zaichun Zhu. Global impacts of the 1980s regime shift. Global Change Biology, 2015; DOI: 10.1111/gcb.13106
Note: The above post is reprinted from materials provided by University of Plymouth. The original item was written by Andrew Merrington.
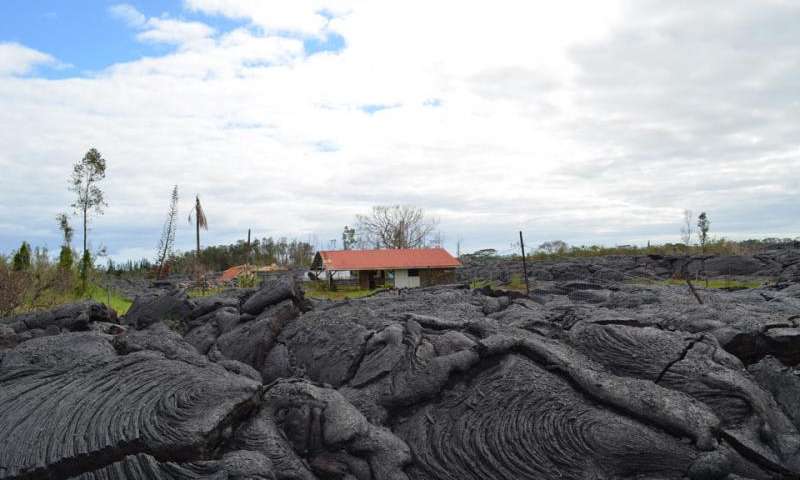
An eruption from Kilauea’s flank began in summer 2014. By fall, a stream of lava had reached the outskirts of the town of Pahoa, about 11 miles distant. It flowed through this farm, taking out pastures, trees, fences and the owners’ house. For some reason, the detached garage in the middle was surrounded, but not touched.
When the most recent eruption of Hawaii’s Kilauea volcano started last June, Melvin Sugimoto at first did not think much of it. Hawaii, where he has lived all his life, is made entirely of hardened lava, and Kilauea, perhaps the world’s most active volcano, has been adding more off and on for the last 300,000 years. “Lava is everywhere, but I never thought in a million years it would come through here,” said Sugimoto, who lives in the small town of Pahoa.
The source of this eruption is the Pu’u ‘O’O vent, on the vast, mostly unpopulated flanks below Kilauea’s summit. The vent first came to life in 1983, and has since sent dozens of flows seaward. Eruptions have buried some 50 square miles of existing land up to 300 feet deep–much of it in Hawaii Volcanoes National Park, but also along the populous coast, where they have obliterated some 200 homes and 9 miles of coastal road. This has added about 500 acres of new land–mostly solid rock, actually–along the coast, where the lava has reached the ocean.
Previous flows headed away from Pahoa, but on June 27, 2014, new fissures opened up at Pu’u ‘O’O, and the lava turned toward the town. At a slow walk, it burned through miles of the national park’s rain forest, then crossed onto state land. By October it had traveled about 10 miles, to Pahoa’s outskirts. It crossed a back road, and into a small farm. The owners’ house burst into flames and disappeared under the flow, but for some reason the lava detoured around a detached garage and fish pond. Next door, like a river lapping against a levee, the edge of the flow piled against a berm surrounding the town transfer station, but petered out partway across the parking lot, near the recyclables containers. Meanwhile, the main flow continued downhill into the Pahoa Japanese Cemetery, where it reburied or re-cremated many residents; Sugimoto went up there and rescued his grandparents’ ashes just in time, for safekeeping at home. Days later, the lava breached his own property and buried 4 acres of macadamia-nut trees. Sugimoto, an excavation contractor, rallied heavy equipment and built a series of earthen barriers to try and keep the lava from his house. “Some nights, I wasn’t sure I should go to sleep,” he said. “I’d go to bed and the edge of the lava was two feet high. I’d get up in the morning, and it would be 8 feet high.”
Sugimoto told this story during a visit to his place by Einat Lev, a volcanologist at Columbia University’s Lamont-Doherty Earth Observatory. Lev and colleagues from the University of Hawaii were there to study how lava moves. It is a surprisingly complex business. The routes and speeds of lava flows are influenced by many factors, including slight variations in local topography; manmade structures; and the lava’s own temperature, chemical composition and viscosity. Lava may head down a gully, or detour through some hidden crack. It may surge quickly, or stop somewhere, pile up and then go sideways. Secondary flows may break out behind the first one, scattering in different directions. In some cases, tunnels evolve under the cooled surface, providing unseen conduits for later eruptions to rush through at high speed. In places like Hawaii, Iceland and Italy, people have sometimes used berms or giant fire hoses to divert or cool flows, but this doesn’t always work. Lev and her colleagues aim to bring more science to the table, by understanding how all these factors work together, so that residents and officials can make the best of human attempts to forecast and manage flows. “Just like water, [lava] seeks out the lowest areas,” said Lev. “But then, once you add all the other factors, it gets a lot more complicated. Volcanoes present such a big hazard, it’s important to understand how they behave.”
Lev’s journey to Pahoa began at a lab at New York’s Syracuse University, where she and colleagues have been trying to understand how things work in nature by making their own artificial lava flows. They get chunks of basalt—the rock formed when lava hardens—and feed it into a furnace. Once it melts, they pour it down a ramp, put various obstacles in its way, and see what happens. They place objects parallel, diagonal and perpendicular to flows, and experiment with different volumes of melt. Once, they put some ice in the way—a crude artificial model for volcanoes in Iceland, which often sit under glaciers. The experiments help confirm observations made in nature during eruptions from Cape Verde to Hawaii. Among them: block a lava flow, and it will often form a bow wave that quickly overtops the obstacle, especially if the obstruction runs perpendicular to the flow. Faster flows form bigger bow waves. Obstacles placed obliquely work better to rechannel lava—but this generally also will speed up the flow, sometimes by as much as 150 percent. Confining a flow to a gully also increases its velocity.
Lev traveled to Hawaii in March 2015, and began at the figurative eye of Kilauea—Halema ‘uma ‘u Crater, at the summit. Native Hawaiian religion holds Halema ‘uma ‘u to be the home and body of Pele, the goddess of fire, wind, lightning and lava. For all of human memory, it has been active on and off, and from time to time, it changes form. Currently, a deep pit within the crater harbors a roiling lake of lava about 600 feet across, which appeared in 2008 after a series of tremors and explosions. Lava lakes that last so long without draining or blowing up are rare; there are only about a half-dozen known in the world. Lucky for Hawaiians and park visitors, Kilauea is mainly a so-called effusive volcano; that is, its main product is lava. Destructive for sure, but rarely fatal, because lava generally moves slowly enough for people or animals to get out of the way. Worldwide, lava killed only about 100 people during the 20th century. The real killers are explosive volcanoes, such as Italy’s Mt. Vesuvius or Washington state’s Mt. St. Helens. These tend to erupt not lava, but sudden, fast-traveling clouds of gases, ash, boulders and mud, from which there is no escape; these can kill thousands at a time. That said, volcanoes can shift behavior, and there is evidence that Kilauea has in the past exploded. A U.S. Geological Survey observatory overlooking the crater monitors the area all around continuously with seismometers, gas sensors, GPS units, helicopter flights and live cameras.
Halema ‘uma ‘u often jets out poisonous gases in the immediate vicinity, so the park keeps tourists at a distance—but Lev and USGS geologist Matt Patrick, armed with special training and tight-fitting gas masks, were permitted to venture within inches of the lip. Here, Lev set up a specialized camera combo to take high-definition video and infrared imagery of the liquid circulating and sputtering several hundred feet below. She and colleagues hope to add to data collected by USGS, and compare it to other active lava lakes in Africa and Antarctica to understand what keeps them bubbling, and not troubling. One idea says that lava slowly circulates to the surface, cools off a bit, then sinks back to be replaced by fresher, hotter material. Another idea is that the lava mostly stays put, but is constantly stirred by streams of gases emerging from below. More sophisticated imagery and measurements might resolve this question. Whatever the answer, Kilauea apparently has a huge, interconnected plumbing system; sometimes the lake level in Halema ‘uma ‘u goes down, and a day or two later, the opposite happens 15 miles away, at Pu’u ‘O’O. This may then cause lava to pour out of Pu’u ‘O’O.
After consultations with USGS staff, Lev’s next stop was Pahoa. The lava flow that started last year has since largely stalled—at least for now. By the time of Lev’s visit, the leading edges had split into two main streams, one lurking in the woods a few hundred yards from the town shopping center and police and fire stations, the other terminating near Melvin Sugimoto’s macadamia-nut orchard. But more lava was still making its way from the faraway vent, and some of it was still piling up and breaking out of older sections further from town. USGS and the Hawaii civil-defense authorities were watching things closely.
Lev and her colleagues spent a couple of days walking around on the solidified lava near town. Looming up as high as 50 feet and covering swaths as wide as a quarter mile, it had created its own jumbled topography, with plains, ravines, craters and hillocks. It was treacherous walking—razor-sharp edges everywhere, and occasional thin crusts apt to collapse several inches under the weight of a foot. It seemed more or less cool, but a thermal camera Lev pointed into one deep crack registered 350 degrees C (660 degrees F). “Something is still happening down there,” she observed. Which places got overrun and which survived sometimes seemed just a matter of luck. At points, obstacles had broken the front into separate branches, but then more lava had come from behind, and the branches had recombined. Along a partly lava-covered back road, the local utility company had tried to save its poles by surrounding them with giant piles of cinders, and wrapping them with reflective material. It worked for some—but at least one wooden pole got incinerated, without the lava directly touching it.
One day, Lev accompanied a team from the nearby University of Hawaii, Hilo, which has been regularly deploying drones to map the topography of the lava and surrounding ground at a fine scale. The aim is to understand how subtle changes in ground elevation and the lava’s own topography may influence its path, and whether manmade defenses can really work. “Thanks to drones, we’re now able to make these maps practically in real time, and track how things change,” said Ryan Perroy, a geographer at the university. Lev plans to deploy drones in her own studies as well.
Local people try their best to respect Madam Pele, as many call her. “Ultimately, whatever the volcano, Pele, decides to do is what we will have to obey,” one Pahoa woman told a newspaper reporter in March. “If she wants to flow to the sea and she wants to create new beaches and new lava fields, then we will allow her to do that. She’s the boss.” That was necessarily the guiding principle a dozen miles southwest of Pahoa, where a series of flows that started in 1990 turned the former seaside communities of Kalapana, Kapa ‘ahu and Kaimu into a barren plain of basalt running into the ocean. The lone surviving house in the Royal Gardens subdivision of Kalapana was buried in March 2012, its occupants evacuated by helicopter.
One of the few places spared was the family compound of Robert Po’okapu Keli’iho’omalu, a patriarch of the local native community known to all simply as Uncle Robert. In 1990, the flow came so close, the family could feel the heat on their faces. They placed Catholic religious objects at each of their land’s four corners, and prayed. The lava bypassed them. Chance? Miracle? The USGS’s Patrick points out that the property was on the waterfront, at the edge of a bay. It might have been spared because the lava entered the bay sideways and filled it like a baking dish, but did not have enough energy to back up and also take the land behind it. The flow created entirely new shoreline hundreds of yards beyond what is now the formerly waterfront property, and the coastal road now ends here. The family has taken advantage of the dead-end location by building a huge bar/restaurant, and hosting a farmers’ market with parking up on the lava flow, where the bay used to be. They have claimed the new real estate for the Kingdom of Hawaii, a sovereignty movement that asserts the United States illegally annexed the islands in the 1890s. The U.S. state of Hawaii says the new land belongs to it. But at least on the surface, no one is fighting over it. The place has become a sort of cult pilgrimage destination overflowing with Hawaiian food, music and old-fashioned aloha. When Uncle Robert died in March 2015, the family put on a three-day public celebration with free meals and entertainment for whoever showed up, and buried Uncle Robert in the back yard a stone’s throw from the lava flow.
As for Melvin Sugimoto, he decided to fight. As the lava crossed his land, he and a neighbor erected a series of berms. The results were mixed. One, perpendicular to the flow and only a few feet high, was easily overtopped, and the lava just kept coming. He set up a much larger one diagonal to the flow, but that only diverted it, without halting the forward motion. Down closer to his house, he made a last stand, with a big bowl-shaped earthen barrier. He never got to find out if it worked; the lava lapped up against its base and just stopped by itself. That is, at least for now. Months later, he says it still steams when it rains, and of course he knows more could come at any time. He has since bulldozed a road through the mass so he can reach his cacao patch and other parts of his land. Blocks of broken basalt boulders lie where he has piled them up with a steam shovel. “What can you do?” he shrugged with a smile. “Do you want to buy some rock? I have a lot of extra.”
Video
Volcanologist Einat Lev of Lamont-Doherty Earth Observatory investigates the physics of lava flows at Hawaii’s Kilauea, the world’s most active volcano.
Brotherswater, a small waterbody in the eastern English Lake District, drains a catchment deforested over recent centuries for hillsheep farming. The steep, glaciated terrain has created a fluvial system sensitive to intense precipitation and a lake that preserves a long and rich sedimentary record of historical floods. See Schillereff et al., ‘Hydrological thresholds and basin control over paleoflood records in lakes.’ Credit: Geology by Daniel N. Schillereff.
Whether extreme river floods are becoming more frequent and/or severe in a warming world remains under debate, partly because instrumental measurements of river discharge are too restricted in length to detect shifts from natural variability.
In this open access article for Geology, Daniel Schillereff and colleagues demonstrate for the first time the recovery in a systematic manner of flood frequency and magnitude data from temperate lakes that accumulate homogeneous (visually similar) sediments.
Characterizing contemporary sediment dynamics and material accumulated during recent floods of known-magnitude has established a relationship to river discharge and quantified a threshold of deposit preservation. Lakes of this type are widely distributed globally but largely unexploited for the purposes of paleoflood research; implementation of our approach will yield new sources of paleohydrological information to help model and mitigate future flood risk.
Reference:
Hydrological thresholds and basin control over paleoflood records in lakes, Daniel N. Schillereff et al., School of Environmental Sciences, Roxby Building, University of Liverpool, L69 7ZT Liverpool, UK. This paper is OPEN ACCESS online at DOI: 10.1130/G37192.1
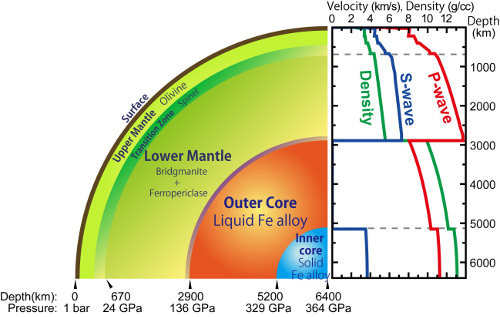
The interior of the Earth and sound velocity and density profiles Credit: RIKEN
The most direct information about the interior of the earth comes from measuring how seismic acoustic waves—such as those created by earthquakes—travel through the earth. Those measurements show that 95% of the earth’s core is liquid. But, scientists also want to know the composition of the liquid, and that is harder. Now, in research published in Nature Communications, scientists from the Materials Dynamics Laboratory at the RIKEN SPring-8 Center, along with collaborators from the Tokyo Institute of Technology’s Earth-Life Science Institute and other institutes, have succeeded in measuring the speed of sound in mixtures of liquid iron and carbon in extreme conditions, allowing limits to be set on the core composition.
According to Alfred Baron, head of the Materials Dynamics Laboratory, “Understanding the composition of the liquid within the earth’s core is an important question, as it can give us clues about how the earth was formed.” It is known that the liquid in the core is mostly molten iron, but it has a density about 10% too small to be only iron, and geoscientists are trying to determine what elements are mixed with the iron to reduce its density.
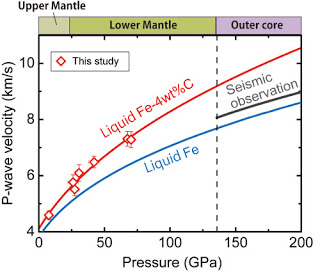
P-wave velocity of liquid alloys The present results of P-wave velocities in liquid Fe-C alloy are compared with that of liquid Fe and seismological observations. Credit: RIKEN
Worldwide, researchers are now creating a ‘catalogue’ that matches sound velocities with material composition and temperature. However, the temperatures of materials inside the earth range up to several thousand degrees (greater than 5,000 K) and the pressures reach several million atmospheres, so measurements are difficult. Thus the ‘catalogue’ has grown very slowly, with each point requiring man-years of work. Also, even though 95% of the earth’s core is liquid, almost all the measurements so far have been of solids because they are easier to handle.
With the current work, the researchers succeeded in extending the catalogue to include the first liquid measurements taken at very high pressure. Using a combination of diamond anvil cell technology—where a sample is squeezed between two diamonds—laser heating, and a large inelastic scattering spectrometer at SPring-8, weighing more than 20 tons, they were able to measure the sound velocity of liquid iron-carbon mixtures at very high temperatures and pressures. While the values they achieved were only about half that of the outermost part of the liquid core—where the pressure is about 1.3 million atmospheres, and the temperature about 4,000 K—they were able to extrapolate to core conditions from the measurements.
According to first author of the study, Yoichi Nakajima, “The extrapolation gives us important insights, suggesting that at most only about 1.2% of the core, by weight, is carbon. Thus while there may be, and, in fact, probably is, some carbon in the core, there must also be some other light elements, such as silicon, oxygen, sulfur or hydrogen.” Says Baron, “While already leading the world in our ability to measure velocities like this under extreme conditions, we will continue to work with different materials and even more extreme conditions at a new RIKEN facility, the Quantum NanoDynamics Beamline, BL43LXU, at SPring-8”.
Reference:
Yoichi Nakajima, Saori Imada, Kei Hirose, Tetsuya Komabayashi, Haruka Ozawa, Shigehiko Tateno, Satoshi Tsutsui, Yasuhiro Kuwayama, Alfred Q. R. Baron, “Carbon-depleted outer core revealed by sound velocity measurements of liquid iron-carbon alloy”, Nature Communications, DOI: 10.1038/NCOMMS9942
Note: The above post is reprinted from materials provided by RIKEN.
The role volcanic activity played in mass extinction events in the Earth’s early history is likely to have been much less severe than previously thought, according to a study led by the University of Leeds.
Asteroid impacts and long-lasting volcanic eruptions called continental flood basalts—the two most commonly cited possible causes of mass extinction events—would have propelled gas and dust into the atmosphere and altered climate for years. But, until now, the impact of years of sulphur dioxide emissions from continental flood basalts was unknown.
In a study published online today in Nature Geoscience, researchers have provided for the first time a quantitative estimate of the degree and nature of the effects that such eruptions had on the Earth’s climate, vegetation and oceans.
Study lead author Dr Anja Schmidt, from the University’s School of Earth and Environment, said: “At the time when the dinosaurs reigned, numerous long-lasting eruptions took place over the course of about a million years. These eruptions, called ‘continental flood basalts’ were not like volcanic eruptions we often see today, with lava gushing from the ground like a curtain of fire.
“Each eruption is likely to have lasted years, even decades, and eruptions were separated by periods without volcanic activity. The lava produced by an eruption of average intensity would have filled 150 Olympic-size swimming pools per minute.”
In the new study, the researchers used a sophisticated computer simulation of the spread of the gas and aerosol particles, which showed that the climatic impacts of flood basalts was less grim than scientists had previously suggested. They found that only if such flood basalts oozed for hundreds of years, without interruption, may the climatic impacts have had a severe effect on plants and animals.
The researchers used information on the duration and intensity of continental flood basalt eruptions, such as the Deccan Traps eruptions 65 million years ago, which covered one-third of what is now India, to estimate the climatic and environmental effects of the huge quantities of sulphur dioxide gas emitted by these eruptions.
Their computer simulation showed that temperatures on Earth were indeed cooler as a result of the eruptions—by as much as 4.5 degrees Celsius—but that the temperature would return to normal within 50 years after an eruption ceased.
Dr Schmidt noted that the conclusions are based on the assumption that climate feedbacks were very similar to those today.
“Perhaps most intriguingly, we found that the effects of acid rain on vegetation were rather selective. Vegetation in some but not all parts of the world would have died off, whereas in other areas the effects would have been negligible,” said Dr Schmidt.
The new findings will challenge the earth sciences community as a whole to re-examine the causes of mass extinctions and the role of volcanism. “We now need to better understand how long both the individual eruptions and the periods without volcanic activity lasted,” concludes Dr Schmidt.
Reference:
Selective environmental stress from sulfur emitted by continental flood basalt eruptions, Nature Geoscience, DOI: 10.1038/ngeo2588
A 3-D image of the Nazca slab subduction. Credit: University of Southampton
Typically during subduction, plates slide down at a constant rate into the warmer, less-dense mantle at a fairly steep angle. However, in a process called flat-slab subduction, the lower plate moves almost horizontally underneath the upper plate.
The research, published in the journal Nature Geoscience, found that the Earth’s largest flat slab, located beneath Peru, where the oceanic Nazca Plate is being subducted under the continental South American Plate, may be relatively weak and deforms easily.
By studying the speed at which seismic waves travel in different directions through the same material, a phenomenon called seismic anisotropy, the researchers found that interior of the Nazca plate had been deformed during subduction.
Lead author of the study, Dr Caroline Eakin, Research Fellow in Ocean and Earth Science at the University of Southampton, said: “The process of consuming old seafloor at subduction zones, where great slabs of oceanic material are swallowed up, drives circulation in the Earth’s interior and keeps the planet going strong. One of the most crucial but least known aspects of this process is the strength and behavior of oceanic slabs once they sink below the Earth’s surface. Our findings provide some of the first direct evidence that subducted slabs are not only weaker and softer than conventionally envisioned, but also that we can peer inside the slab and directly witness their behavior as they sink.”
When oceanic plates form at mid-ocean ridges, their movement away from the ridge causes olivine (the most abundant mineral in the Earth’s interior) to align with the direction of plate growth. This olivine structure is then ‘frozen’ into the oceanic plate as it travels across the Earth’s surface. The olivine fabric causes the seismic waves to travel at different speeds in different directions, depending on whether or not they are going ‘with the grain’ or ‘against the grain’.
The scientists measured seismic waves at 15 local seismic stations over two and a half years, from 2010 to 2013, and seven further stations located on different continents. They found that the original olivine structure within the slab had vanished and been replaced by a new olivine alignment in an opposing orientation to before.
Dr Eakin said: “The best way to explain this observation is that the slab’s interior must have been stretched or deformed during subduction. This means that slabs are weak enough to deform internally in the upper mantle over time.”
The researchers believe that deformation associated with stretching of the slab as it bends to takes on its flat-slab shape was enough to erase the frozen olivine structure and create a new alignment, which closely follows the contours of the slab bends.
“Imaging Earth’s plates once they have sunk back into the Earth is very difficult,” said Lara Wagner, from the Carnegie Institution for Science and a principal investigator of the PULSE Peruvian project. “It’s very exciting to see results that tell us more about their ultimate fate, and how the materials within them are slowly reworked by the planet’s hot interior. The original fabric in these plates stays stable for so long at the Earth’s surface, that it is eye opening to see how dramatically and quickly that can change,” Lara added.
Reference:
Internal deformation of the subducted Nazca slab inferred from seismic anisotropy, DOI: 10.1038/ngeo2592
Artistic impression of latitudinally more widespread aurora as an expected consequence of geomagnetic field strength much lower than today’s. Credit: Huapei Wang (with material courtesy of NASA’s Earth Observatory) and edited by MIT News
The intensity of Earth’s geomagnetic field has been dropping for the past 200 years, at a rate that some scientists suspect may cause the field to bottom out in 2,000 years, temporarily leaving the planet unprotected against damaging charged particles from the sun. This drop in intensity is associated with periodic geomagnetic field reversals, in which the Earth’s North and South magnetic poles flip polarity, and it could last for several thousand years before returning to a stable, shielding intensity.
With a weakened geomagnetic field, increased solar radiation might damage electronics—from individual pacemakers to entire power grids—and could induce genetic mutations. A reversal may also affect the navigation of animals that use Earth’s magnetic field as an internal compass.
But according to a new MIT study in the Proceedings of the National Academy of Sciences, the geomagnetic field is not in danger of flipping anytime soon: The researchers calculated Earth’s average, stable field intensity over the last 5 million years, and found that today’s intensity is about twice that of the historical average.
This indicates that the current field intensity has a long way to fall before reaching an unstable level that would lead to a reversal.
“It makes a huge difference, knowing if today’s field is a long-term average or is way above the long-term average,” says lead author Huapei Wang, a postdoc in MIT’s Department of Earth, Atmospheric and Planetary Sciences. “Now we know we are way above the unstable zone. Even if the [field intensity] is dropping, we still have a long buffer that we can comfortably rely on.”
Flip-flopping through history
Earth has undergone multiple geomagnetic reversals over its lifetime, flip-flopping its polarity at random intervals.
“Sometimes you won’t have a flip for about 40 million years; other times there will be 10 flips in 1 million years,” Wang says. “On average, the duration between two flips is a few hundred thousand years. The last flip was around 780,000 years ago, so we are actually overdue for a flip.”
The most obvious sign of an impending reversal is a geomagnetic field intensity that’s significantly below its historical, long-term average—a sign that the planet is tipping toward an unstable state. While satellites and ground-based observatories have made accurate measurements over the last 200 years of the current field intensity, there are less reliable estimates over the last few million years.
Wang and his colleagues, from Rutgers University and France, sought to measure Earth’s paleomagnetic field using ancient rocks erupted from volcanoes on the Galapagos Islands—an ideal site, since the island chain is on the equator. As Earth’s magnetic field, in its stable configuration, is a dipole, the intensity of the field should be the same at both poles, and half that intensity at the equator.
Wang reasoned that knowing the paleomagnetic field intensity at the equator and the poles would therefore give an accurate estimate of the planet’s average historical intensity.
Rocks from a dipole
Wang obtained samples of ancient volcanic lavas from the Galapagos, while his colleagues from the Scripps Institution of Oceanography at the University of California at San Diego excavated similarly aged rocks from Antarctica. Such volcanic rocks retain information on the geomagnetic field intensity at the time they cooled.
The two teams brought the samples back to their respective labs, and measured the rocks’ natural remanent magnetization, or orientation of ferromagnetic particles. They then heated the rocks, and cooled them in the presence of a known magnetic field, measuring the rocks’ magnetization after cooling.
A rock’s remanent magnetization is proportional to the magnetic field in which it cooled. Therefore, using the data from their experiments, the researchers were able to calculate the peak distribution of the ancient geomagnetic field intensity, both at the equator—about 15 microtesla—and the poles—about 30 microtesla. Today’s field intensities at the same locations are around 30 microtesla and 60 microtesla, respectively—double the historical, long-term values.
“That means today’s value is anomalously high, and even if it’s dropping, it’s dropping to a long-term average, not from an average to zero,” Wang says.
Far from zero
So why have scientists assumed that Earth’s geomagnetic field is dropping to a precipitous low? It turns out this assumption is based on flawed historical data, Wang says.
Scientists have estimated paleomagnetic intensities at various latitudes around the Earth, but Wang’s is the first data from equatorial regions. However, Wang found that scientists were misinterpreting how rocks recorded their magnetic fields, leading to inaccurate estimates of paleomagnetic intensity. Specifically, scientists were assuming that as individual ferromagnetic grains of rocks cooled, their unpaired electron spins assumed a uniform orientation, reflecting the magnetic field intensity.
However, this effect only holds true up to a certain size. In larger grains, unpaired electron spins assume various orientations in different domains of the grain, thereby complicating the field intensity picture.
Wang developed a method to correct for such multidomain effects, and applied the method to his Galapagos lavas. The results, he says, are more reliable than previous estimates of the paleomagnetic field.
As for when Earth may experience its next flip, Wang says the answer is still up in the air.
“What I can say is, if you keep a constant present-day decrease rate, it will take another 1,000 years for the field to drop to its long-term average,” Wang says. “From there, the field intensity may go up again. There’s really no way to predict what will happen after that, given the random nature of the magnetohydrodynamic process of the geodynamo.”
Reference:
Weaker axially dipolar time-averaged paleomagnetic field based on multidomain-corrected paleointensities from Galapagos lavas, PNAS, DOI: 10.1073/pnas.1505450112