Researchers have discovered a ‘bizarre’ microorganism which plays a key role in the food web of Earth’s oceans.
Researchers from Spain’s Institute of Marine Sciences (ICM-CSIC), alongside colleagues at the University of Bristol in the UK, discovered that symbiotic phytoplankton capable of fertilising the ocean with nitrogen ‘fertilizer’ evolved back in the Cretaceous at a time when the oceans were nutrient deprived.
This study, which used data from the Tara Oceans circumnavigation expedition, is published in Nature Communications today [22 March].
The cyanobacterium which the researchers have discovered is unique because it has no photosynthetic capabilities – a trait commonly associated with these microorganisms. Instead, its sole purpose is to provide nitrogen to a more complex cell host.
This ‘slaving event’ evolved around 90 million years ago towards the end of the Cretaceous period, when the oceans were starved of nutrients.
While nitrogen is hugely abundant in the atmosphere, most organisms can’t breathe nitrogen, instead relying on bacteria to transform atmospheric nitrogen into bioavailable nitrogen – critical for growth and survival in the marine food web.
Marine scientists have known that bioavailable nitrogen is provided by cyanobacteria, but the new findings take this knowledge one step further, by identifying the intimate relationship of this marine nitrogen factory which is formed by a single-celled alga (prymnesiophyte) and the cyanobacterium UCYN-A.
Dr Silvia G. Acinas, from ICM-CSIC in Spain, led the study and said: “This is a very important symbiotic system in marine environments because they are globally distributed, playing a significant role in today’s nitrogen and carbon marine cycles.”
Dr. Patricia Sánchez-Baracaldo, from the School of Geographical Sciences at the University of Bristol, added: “A stage of scarce nutrients in the ocean could have led to the establishment of the symbiotic relationship between the algae and the cyanobacteria back in the late Cretaceous, after the oceans had been deprived in nutrients.”
This research has been made possible thanks to the metagenomes and metatranscriptomes dataset obtained from the Tara Oceans oceanographic expedition.
Several international laboratories including the University of Bristol (UK), VIB/VUB/KU Leuven (Belgium), Aix-Marseille Université (France), Centre National de la Recherche Scientifique – CNRS (France), Genoscope (France), European Molecular Biology Laboratory – EMBL (Germany) and the University of California (USA) have participated in this study.
Reference:
‘Cyanobacterial symbionts diverged in the late Cretaceous towards lineage-specific nitrogen fixation factories in single-celled phytoplankton’ by Francisco M. Cornejo-Castillo et al in Nature Communications. DOI:10.1038/ncomms11071
The largest oval fancy vivid diamond ever to appear at auction is headed for sale in Hong Kong next month, where it is expected to fetch $30 million – $35 million.
The internally flawless blue diamond, at 10.10 carats, was mined in South Africa and is one of a collection of 11 cut by jewellers De Beers in London in 2000.
“Blue diamonds are extremely rare and when they are over 10 carats and flawless, they are quite special,” Quek Chin Yeow, Sotheby’s auction house Deputy Chairman for Asia said at a press event in London.
“It’s also the largest oval vivid blue diamond to ever be offered at auction.”
The blue diamond will lead an April 5 Sotheby’s auction in Hong Kong after being exhibited in London, Geneva, New York, Singapore and Taipei.
Photos
Video
Note: The above post is reprinted from materials provided by Reuters.
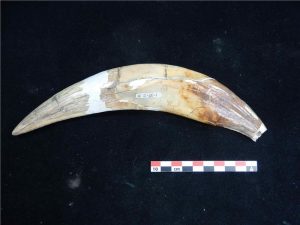
Canine tooth of a saber-toothed cat. Credit: Hervé Bocherens
Like the lion which today lives in the African savannah, the saber-tooth “tiger,” Smilodon populator, inhabited the open, dry country found in South America during the ice age, according to Professor Hervé Bocherens of the Senckenberg Center for Human Evolution and Palaeoenvironment at the University of Tübingen. The results of his latest study have been published in the latest edition of the journal Palaeogeography, Palaeoclimatology, Palaeoecology. To find out more about the eating habits of what was then South America’s biggest cat, Bocherens and his team examined the bones of saber-toothed cats which lived in Argentina’s Pampas region in the period 25,000-10,000 B.C.
“Up to now, palaeontologists assumed that a predator weighing up to 400 kilograms and with bone structure similar to that of a forest-dwelling cat would have hunted in woodlands,” says Hervé Bocherens. It was thought that would make it easier for the animals — with their canines up to 30 centimeters long — to find hiding places from which to attack their prey. But Bocherens’ study points to a different conclusion. He compared collagen samples from the bones of various ice age predators — including the saber-toothed cat, the jaguar (Panthera onca), and a species of wild dog (Protocyon) — with those of their likely prey. The carbon and nitrogen isotopes he found there enable him to draw conclusions about the kind of environment the animals lived in.
The saber-toothed cats did not eat animals which were at home in thickly wooded country. Their chief prey seems to have been a camel-like, steppe-dwelling ungulate known to scientists as Macrauchenia, and two species of giant sloth (Megatherium und Lestodon) — who, unlike their surviving relatives, lived on the ground and could grow to several tonnes in weight. There could be a further parallel with today’s African lions; the bones of several individual saber-toothed tigers were found together and contained similar isotopes, Bocherens says — “It may be that these predators, too, hunted together in groups.”
The saber-toothed cat (Smilodon) evolved in North America and spread to South America with the formation of a stable land bridge between the two continents some three million years ago. It appears that the saber-toothed tigers’ fiercest competitors were not other big cats. The study indicates that the jaguar preferred smaller prey, such as rodents and species of horse. But the ice age dog (Protocyon) seems to have shared the saber-tooths’ culinary tastes.
Many types of megafauna died out at the end of the ice age, including the saber-toothed cat. Researchers debate the possible influence of climate change and human activity on the extinctions. The Tübingen researchers believe that a damper climate could have led to increased forestation of the steppe — reducing the saber-toothed tigers’ hunting grounds and ultimately causing them to die out.
Reference:
Hervé Bocherens, Martin Cotte, Ricardo Bonini, Daniel Scian, Pablo Straccia, Leopoldo Soibelzon, Francisco J. Prevosti. Paleobiology of sabretooth cat Smilodon populator in the Pampean Region (Buenos Aires Province, Argentina) around the Last Glacial Maximum: Insights from carbon and nitrogen stable isotopes in bone collagen. Palaeogeography, Palaeoclimatology, Palaeoecology, 2016; DOI: 10.1016/j.palaeo.2016.02.017
Radiocarbon dating of a bear’s knee bone reveals that it was hunted by humans in 10,500 BC as opposed to earlier evidence of human life in Ireland dated at 8,000 BC
Analysis of a bear bone found in an Irish cave has provided evidence of human existence in Ireland 2,500 years earlier than previously thought, academics announced Sunday.
For decades, the earliest evidence of human life in Ireland dated from 8,000 BC.
But radiocarbon dating of a bear’s knee bone indicated it had been butchered by a human in about 10,500 BC—some 12,500 years ago and far earlier than the previous date.
“This find adds a new chapter to the human history of Ireland,” said Marion Dowd, an archaeologist at the Institute of Technology Sligo who made the discovery along with Ruth Carden, a research associate with the National Museum of Ireland.
The knee bone, which is marked by cuts from a sharp tool, was one of thousands of bones first found in 1903 in a cave in County Clare on the west coast of Ireland.
It was stored in the National Museum of Ireland since the 1920s, until Carden and Dowd re-examined it and applied for funding to have it radiocarbon dated—a technique developed in the 1940s—by Queen’s University Belfast.
The team sent a second sample to the University of Oxford to double-check the result. Both tests indicated the bear had been cut up by a human about 12,500 years ago.
The new date means there was human activity in Ireland in the Stone Age or Palaeolithic period, whereas previously, scientists only had evidence of humans in Ireland in the later Mesolithic period.
“Archaeologists have been searching for the Irish Palaeolithic since the 19th century, and now, finally, the first piece of the jigsaw has been revealed,” Dowd said.
Three experts further confirmed that the cut marks on the bone had been made when the bone was fresh, confirming they dated from the same time as the bone.
The results were revealed in a paper published in the journal Quaternary Science Reviews.
As well as pushing back the date of human history in Ireland, the find may have important implications for zoology, as scientists have not previously considered that humans could have influenced extinctions of species in Ireland so long ago.
“From a zoological point of view, this is very exciting,” Carden said. “This paper should generate a lot of discussion within the zoological research world and it’s time to start thinking outside the box… or even dismantling it entirely!”
The National Museum of Ireland noted that approximately two million more specimens are held in its collections and could reveal more secrets.
“All are available for research and we never know what may emerge,” said Nigel Monaghan, keeper of the natural history division of the National Museum of Ireland.
“Radiocarbon dating is something never imagined by the people who excavated these bones in caves over a century ago, and these collections may have much more to reveal about Ireland’s ancient past.”
Note: The above post is reprinted from materials provided by AFP.
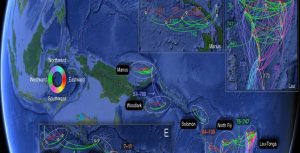
Map of Larval Dispersal in the Western Pacific Ocean
Deep below the ocean’s surface are hydrothermal vent fields, or submarine hot springs that can reach temperatures of up to 400 °C. These fields are surrounded by a unique set of animals, including vent crabs and eyeless vent shrimp, that survive off of the chemicals emitted from the hydrothermal vents. Recently, Okinawa Institute of Science and Technology Graduate University (OIST) researchers and collaborators have computed the dispersal of larvae from these hydrothermal vent ecosystems to understand and safeguard the animals found there. The results have been published in Proceedings of the National Academy of Sciences (PNAS).
“We are trying to understand how these western Pacific vent fields are connected,” Prof. Satoshi Mitarai, first author and principal investigator of OIST’s Marine Biophysics Unit said. “And we want to know how the creatures are migrating from one site to another, as well as how they are evolving.”
Another goal of this research is to protect the native vent species from deep-sea mining, a process that retrieves metals from the ocean floor that could negatively affect the animals living near these hydrothermal vents.
“Deep ocean mining would destroy these habitats,” Mitarai said.
In order to understand and protect these animals, the researchers quantified larval dispersal because the larval stage is the only time these creatures can freely move through the ocean via the currents. To do this, they calculated the average depth at which the larvae would travel, which is 1000 meters, and the average time at which vent animals would stay in the larval stage at this depth, which is 83 days. Then, they deployed 10 deep-ocean profiling floats every other month for two years, with the help of the Japan Coast Guard, in the Hatoma Knoll, off the coast of Ishigaki Island in southern Okinawa. They programmed the floats to stay at 1,000 m and drift along with the ocean’s current. The floats surfaced every 30 days to transmit their location.
“This is the first time we could see how deep ocean circulation processes potentially transport materials from hydrothermal vents,” Mitarai said.
In addition, the scientists used cutting-edge ocean models to quantify larval dispersal on a larger scale with simulated ‘model’ floats. By combining the data from the ocean models and from the deep-ocean profiling floats experiments, the researchers are able to “estimate what is possible and what is not possible for larval dispersal,” Mitarai said.
The data can help to predict where larvae will travel over the course of the larval stage and even show that larvae could be transported over long distances to far off vent fields. The ability to see where larvae is potentially going is important for understanding gene flows – movement from one population to another – in these vent species.
“We have provided concrete background information that population geneticists can use to set up their hypotheses to understand gene flows,” Mitarai said.
It is also important for estimating the evolutionary processes of these creatures and for protection against deep-sea mining. “This information can help marine ecologists to design optimum plans to protect these areas from deep ocean mining,” Mitarai said.
Reference:
Satoshi Mitarai et al. Quantifying dispersal from hydrothermal vent fields in the western Pacific Ocean, Proceedings of the National Academy of Sciences (2016). DOI: 10.1073/pnas.1518395113
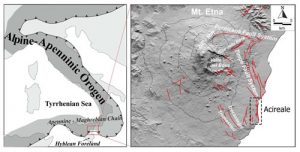
Fig. 1. Sketch map showing the (left) location and (right) main tectonic and structural features of Sicily’s Etna volcano; the dashed rectangle encloses the area where scientists will deploy the first European Urban Seismic Network based on microelectromechanical systems (MEMS) technologies.
When a strong earthquake hits an urban area, prompt rescue operations can minimize the number of victims. Logically, the probability of saving a human trapped under debris or injured during the course of a disaster decreases exponentially as function of time, vanishing almost completely after about few hours. The Tokyo Fire Fighting Department Planning Section [2002] has quantified this further, stating that rescue within 3 hours is desirable and survival rate is drastically lower after 72 hours.
Past disasters—like the magnitude 6.6 quake that struck Iran on 26 December 2003—support this assessment. As a result of that earthquake, more than 43,000 people died, and only 30 were saved, despite the intervention of 1600 rescuers from 43 nations. This tragic outcome is likely related to the fact that many rescuers didn’t arrive until after 3 days.
The impact of a strong earthquake on an urban center can be considerably reduced by an efficient emergency management center, through timely and targeted actions immediately following the quake. A real-time urban seismic network—sensors laid out in a grid through a city—could help emergency management centers by providing immediate alert and postearthquake information summarized in maps of ground motion.
Researchers are using new technological advances to develop one such urban seismic network in Acireale, Italy. The network will not use traditional seismometers; rather, they will harness the less expensive technology of accelerometers. Once operational, it will be the first urban seismic network in Europe.
Goals of an Urban Seismic Network
Urban seismic networks allow the disaster’s first responders to manage available resources, such as personnel and equipment needed to rescue people. Rescue operations and verification of damage to buildings could then be carried out according to a logical priority according to where the highest shaking was measured by the seismic network. Such an approach would minimize secondary effects induced by an earthquake and allow officials to protect critical infrastructure, thereby mitigating the economic and social costs of the earthquake.
Accelerometers to the Rescue
The high costs associated with the construction and installation of traditional seismic stations has made it nearly impossible to realize a true seismic network on an urban scale. However, recent technological developments in the field of microelectromechanical systems (MEMS) sensors, which can be configured to detect minute accelerations, may allow scientists to create an urban seismic network at low cost.
MEMS sensors are a set of highly miniaturized devices that receive information from the environment and translate physical quantities they sense into electrical impulses. Depending on how the sensors are configured, they can measure phenomena of various kinds: mechanical (sound, acceleration, and pressure), thermal (temperature and heat flux), biological (cell potential), chemical (pH), optical (intensity of light radiation and spectroscopy), and magnetic (intensity of flow). The MEMS devices that will be used in the project integrate a three-axis accelerometer, which can measure both constant accelerations (usable as a tilt sensor) and those that vary in time (used to measure the oscillation induced by an earthquake).
In the 1990s, MEMS sensors revolutionized the automotive airbag system and are today widely used in laptops, games controllers, drones, and mobile phones. When configured to measure ground shaking, the sensitivity and the dynamic range of these sensors are high enough to allow the researchers to record earthquakes of moderate magnitude even at a distance of several tens of kilometers [D’Alessandro and D’Anna, 2003; Evans et al., 2014]. Because of their low cost and their small size, MEMS accelerometers could be easily installed in urban areas to achieve a seismic network with a high density of measuring points.
In the past decade, a number of research institutes that focus on geophysics and seismology have shown interest in this promising technology. In California and Japan, scientists are developing networks consisting entirely of MEMS sensors. These include the Quake-Catcher Network, managed by Stanford University [Cochran et al., 2009; Chung et al., 2011; Kohler et al., 2013]; the Community Seismic Network, managed by the California Institute of Technology [Clayton et al., 2011; Kohler et al., 2013]; and the Home Seismometer Network, managed by the Japan Meteorological Agency [Horiuchi et al., 2009].
First European Urban Seismic Network
In September 2015, the Italian Ministry of Education, University and Research funded a 3-year project to create the first European urban seismic network using MEMS technology. The project is called Monitoring of Earthquakes through MEMS Sensors (MEMS project).
We chose the municipality of Acireale, Italy, an urban area particularly vulnerable to earthquake hazards [Azzaro et al., 2010, 2013], as a pilot site for the MEMS project (Sicily, Italy; Figure 1). Acireale is located on the southeastern slopes of Sicily’s Etna volcano and is vulnerable to damage from tectonic and volcanic earthquakes.
Founded in the 14th century, Acireale contains many seismically vulnerable buildings of historical and cultural value. In the past 2 centuries, more than 190 damaging earthquakes have occurred in the Etna region, almost 1 per year. This includes an earthquake sequence that began with a main shock on 29 October 2002—following this magnitude 4.4 event, more than 400 buildings in Acireale were declared uninhabitable [Azzaro et al., 2010].
Fig. 2. The internal devices that will constitute the MEMS accelerometric stations: the sensor, single-board computer, and GPS are manufactured by Phidgets Inc.
We aim to develop an urban seismic network comprising about 200 MEMS stations (Figure 2). Each station will consist of a three-axis digital MEMS accelerometer connected to a computer for on-site signals preprocessing. Each station will be supplied with a GPS for time synchronization and an Internet connection for data transmission to a processing center. Should an earthquake cause a power outage, the station can function autonomously for about 2 hours, thanks to the buffer battery shown in Figure 2.
The MEMS stations will be located mainly inside buildings characterized by high vulnerability (old buildings that weren’t built to withstand high shaking) and high flux of people moving in and out, such as schools, hospitals, public buildings, and places of worship. The geometry of the network will be designed to create homogeneous coverage of the urban center, with a high enough density of stations in the vicinity of the well-known faults.
The network’s success will depend on our ability to implement algorithms able to prevent false alarms. Such algorithms will allow the creation of a shaking map only if a significant percentage of the MEMS stations have simultaneously detected a shaking event—if shaking is human made (e.g., an explosion), only the nearest stations would detect it, but an earthquake would be recorded by many stations. Automatic detection of patterns in waveforms that signal a specific seismic source will also be helpful.
What Can We Learn?
If all goes well, the network will be operational by the end of 2017. The seismic waveforms captured by the sensors will be processed in real time to identify several shaking parameters that will be used to create shake maps at the urban scale. The earthquake waveforms collected by the network will also be used to reconstruct the movement along the faults that caused the earthquakes to map seismic hazards and risks on a fine scale for the area covered.
The system could be used to implement a site-specific earthquake early warning system [Horiuchi et al., 2009]. Such a system could enhance the safety margin of specific critical engineered systems—such as energy plants or high-speed railway networks—in real time, mitigating the seismic risk by triggering automatic actions that aim to shelter people from exposure to shaking.
If successful, the MEMS project could provide a useful tool to reduce the seismic risk by increasing the safety of the population of the urban area covered by the network. Such a system could be quickly extended to other areas of high seismic risk, revolutionizing how communities monitor earthquakes. Communities would no longer need to focus on the characterization of earthquakes in terms of focus parameters (e.g., hypocenter and magnitude). Instead, networks like the MEMS project would characterize shaking by direct measurements of how shaking affects a city, neighborhood by neighborhood.
Nevadaite (Cu2+,Al,V3+)6[Al8(PO4)8F8](OH)2·22H2O) is a category 1 and 2 rarity–formed from the scarce elements vanadium and copper under very restricted environmental conditions. The crystals are colorful but microscopic, and only known from two localities–Eureka County, Nevada, and a copper mine in Kyrgyzstan. Credit: Robert Downs, University of Arizona.Scientists have inventoried and categorized all of Earth’s rare mineral species described to date, each sampled from five or fewer sites around the globe. Individually, several of the species have a known supply worldwide smaller than a sugar cube.
These 2,550 minerals are far more rare than pricey diamonds and gems usually presented as tokens of love. But while their rarity would logically make them the most precious of minerals, many would not work in a Valentine’s Day ring setting. Several are prone to melt, evaporate or dehydrate. And a few, vampire-like, gradually decompose on exposure to sunlight.
Their greatest value to humanity lies in the tell-tale clues they offer about the sub-surface conditions and elements that created them, as well as insights into the planet’s past biological upheavals. In fact, rare minerals represent Earth’s truest distinction from all other planets, according to authors of a paper in press to appear in the journal American Mineralogist.
Scientists Robert Hazen of the Carnegie Institution and Jesse Ausubel of The Rockefeller University say that knowing fully the mineral signature of our life-supporting planet — understanding the distinct combinations of circumstances that create rare minerals — also informs anticipation of what an inter-planetary probe might find.
Their paper, “On the Nature and Significance of Rarity in Mineralogy,” establishes the first system for categorizing rarities in the mineral kingdom and provides mineralogists a framework that parallels one used for understanding rare plant and animal species.
The authors note the irony that precious gems and other minerals highly valued by humankind — including so-called “rare earth” minerals required to make electronics — don’t meet the definition of rare as far as Planet Earth is concerned.
Says the paper: “Diamond, ruby, emerald, and other precious gems are found at numerous localities and are sold in commercial quantities, and thus are not rare in the sense used in this contribution. Uses of the word ‘rare’ in the context of ‘rare earth elements’ or ‘rare metals’ are similarly misleading, as many thousands of tons of these commodities are produced annually.”
On the other hand, notes Dr. Hazen, the mineral ichnusaite (image, http://bit.ly/1NUniMX), exemplifies a true rarity — created through a subterranean mash-up of the radioactive element thorium and lead-like molybdenum, with only one specimen ever found, in Sardinia a few years ago.
“If you wanted to give your fiancé a really rare ring, forget diamond. Give her Sardinian ichnusaite.”
Fewer than 100 of 5,090 known minerals make up 99% of Earth’s crust
There are 5,090 known, formally recognized mineral species (see endnotes), fewer than 100 of which make up 99% of Earth’s crust, with a handful of feldspar species comprising about 60%.
Of those 5,090, roughly 2,550 are defined as rare — found at five or fewer locations worldwide. And, according to the paper, more than two-thirds of known mineral species, “including the great majority of rare species, have been attributed to biological changes in Earth’s near-surface environment.”
“We need to re-think ‘animal, vegetable, or mineral’,” says Prof. Ausubel. “In the old parlor game, if it isn’t alive, doesn’t grow and comes from the ground, it’s a mineral, but some of these rare minerals do grow and don’t entirely come from the ground.”
Each rare mineral (a selection of 99 examples is available at http://bit.ly/1KlU6U4) fits into one or more of four categories:
1) Unique conditions that created the mineral
“In very simple terms, imagine making minerals at a kitchen stove using a pressure cooker,” says Dr. Hazen. “What results in the pot is a function of variables: temperature, pressure and the ingredients — one or more of just 72 chemical elements that make up Earth’s mineral kingdom.”
“Some minerals are rare because, even though they form from the commonest of ingredients, they must be cooked at exquisitely controlled conditions. For example, the mineral hatrurite, (http://www.mindat.org/min-1828.html) is formed from three of Earth’s most abundant elements–calcium, silicon, and oxygen. But hatrurite forms only in a very restricted environment with temperatures above 1250°C — many times hotter than the boiling point of water — and in the absence of another extremely common element, aluminum.”
By knowing the idiosyncratic combination of circumstances involved in a rare mineral’s creation, scientists can deduce what elements are or aren’t present at a specific depth, and in some cases such information as acidity at that level below surface.
2) Planetary constraints:
Incorporation of rare elements, or mineral formation at pressure-temperature conditions rarely encountered in near-surface environments
Other minerals are extremely rare because their ingredients are almost never found concentrated in Earth’s crust. Thus, such scarce chemical elements as beryllium, hafnium and tellurium form relatively few minerals and most species are rare.
3) Ephemeral minerals
Some minerals form under unusual conditions–extreme cold or dry environments, for example–but then simply melt, evaporate or dehydrate when exposed to different surface conditions.
A crystalline form of methane hydrate, for example, found in core samples from continental shelf and Arctic drill sites, evaporates at room pressure.
As well, “water-soluble minerals may also be under-reported, and thus appear to be rare,” the paper says. More than 100 mineral species can persist in dry environments for many years, “only to be washed away during rare rain events.”
4) Places geologists rarely sample
In the fourth category are rare minerals that simply come from under-sampled regions, from extreme environments such as the flanks of erupting volcanoes, frigid and remote regions of Antarctica, or the deepest reaches of the oceans. Other minerals that may be much more common than are represented in mineral museums include a host of species that are difficult to recognize based of their lack of bright colors or showy crystal faces. Most mineral collectors favour eye-popping specimens for their display case.
As well, some minerals occur only at the micro or nano-scale. A number of rare minerals known only from Otto Mountain, near San Bernardino in southern California, for example, have been discovered recently through the use of high-tech instruments.
Positive sampling biases also likely affect perceptions of mineral rarity. Intensive searches for deposits of gold, uranium and “rare earths” needed by the electronics industry, for example, have undoubtedly led to the discovery and reporting of certain mineral species at more localities relative to commercially unimportant elements, according to the paper.
Most mineral experts are familiar with at best a handful of the 2,550 obscure rarities, says Dr. Hazen, citing the mineral fingerite from El Salvador as “a perfect storm of rarity.”
“Fingerite forms under extremely restrictive conditions (category 1), from rare elements (category 2), it is water soluble and disappears when rained upon (category 3), and it comes from dangerous volcanic fumeroles near active volcanoes, so is rarely collected (category 4). Consequently, fingerite is only known from near the summit of the Izalco Volcano in El Salvador.
As in biology, the scientist who first describes a new mineral earns the right to name it. Fingerite (photo: http://bit.ly/1So4Ap4), described in 1983, was named in honour of mineralogist and crystallographer Larry Finger, a longtime colleague of Dr. Hazen.
Biological vs. mineralogical rarity
The paper points out important differences between biological and mineralogical rarity. For example, biological species, once extinct, will not re-emerge naturally. Rare minerals, on the other hand, may disappear from Earth for a time, only to reappear when the necessary physical and chemical conditions arise again.
“In contrast to mineral species, biological species that do not become extinct nevertheless are constantly evolving, in some instances not so gradually, into new forms.”
“Minerals do not evolve in this way, though an intriguing and as yet little explored aspect of mineralogy is how trace and minor elements and isotopes in common mineral species have varied through Earth history in response to changing near-surface conditions.”
Rare minerals, the authors say:
Are key to understanding the diversity and disparity of Earth’s mineralogical environments;
Often point to extreme compositional regimes that can arise in Earth’s shallow crust;
Are valuable in understanding Earth as a complex evolving system in which pervasive fluid-rock interactions and biological processes lead to new mineral-forming niches
Increase the likelihood of finding novel crystal structures and advancing crystal chemistry
Finally, they say, “another possible contribution of rare minerals, though as yet speculative, relates to the origins of life. While most origins-of-life scenarios incorporate common minerals such as feldspars or clays, a number of uncommon minerals, including species of sulfides, borates, and molybdates, have also been invoked.”
“We live on a planet with remarkable mineralogical diversity, featuring countless variations of color and form, richly varied geochemical niches, and captivating compositional and structural complexities. Rare species, comprising as they do more than half of the diversity of Earth’s rich mineral kingdom, thus provide the clearest and most compelling window into the complexities of the evolving mineralogical realm.”
The paper was prepared as a contribution to the Deep Carbon Observatory, a cooperative international project concerned with quantities, movements, origins and forms of the element carbon.
This is a still life of grizzly bear (Ursos arctos) with diet inferred from multiple proxies, such as isotopes of hair, teeth, and blood. Credit: Peabody Museum of Natural History/Yale University
Researchers at Yale and the Smithsonian Institution say it’s time to settle a very old food fight.
In a study published March 18 in the journal Ecology and Evolution, authors Matt Davis and Silvia Pineda-Munoz argue that scientists need to focus as much on “when” animals eat as they do “what” animals eat. Without the proper time context, they say, an animal’s diet can tell very different stories.
“Diet is one of the most important features of animals,” said Davis, a Yale graduate student in geology and geophysics. “But often, we can’t seem to agree on what animals ate. Grizzly bears, for example, eat different foods at different times. If you looked at their diet in the spring, it would look like what wolves eat, but in the fall, bears eat mostly seeds, just like squirrels.”
Researchers use diet reconstructions to provide crucial information for managing habitats of endangered species, understanding evolutionary changes in species’ function, and describing ancient habitats and climates. Routinely, this bit of diet detective work is achieved with dietary proxies: chemicals in hair or blood samples, dental remains, stomach contents, skeletal analysis, and measurements of feeding sites, for example.
Yet often, diet proxies don’t agree. This is because each one records what an animal eats over different lengths of time. Chemicals in hair, for example, may offer information about nutrition over the course of several years; stomach contents would reveal perhaps a week’s worth of meals. Each could give a different answer for what an animal ate.
Davis and Pineda-Munoz give examples of how such disparity can be problematic in research. In one instance, scientists unintentionally reversed the order of a food chain in a lake in East Africa because they hadn’t factored in the different speeds that zooplankton and their predators absorb nutrients. In another, researchers thought that certain regions of ancient Africa were covered in forests because they assumed the fossil elephants they found there ate mostly trees, just like modern elephants; however chemical analysis showed the ancient elephants actually ate mostly grass, so the “forests” were most likely fields.
“The correct diet proxy depends on the question you’re asking,” Davis said. “We can’t just look at stomach contents sampled yesterday and extrapolate them out for 1 million years.”
Davis and Pineda-Munoz suggest that researchers explicitly state the time scales for the diet proxies they use to avoid confusion. They also call upon scientists to consider the effects of time scale at each stage of their research.
Pineda-Munoz points out that the different time scales can actually be helpful to research. “By using different proxies like the chemical signatures in feathers and blood we can tell not just what a bird is eating but what it ate a year ago and how its diet changed since then,” she said. “This is especially important for rare or endangered species because we can effectively time travel through their diet without harming the animal.”
Reference:
Matt Davis, Silvia Pineda Munoz. The temporal scale of diet and dietary proxies. Ecology and Evolution, 2016; DOI: 10.1002/ece3.2054
Note: The above post is reprinted from materials provided by Yale University. The original item was written by Jim Shelton.
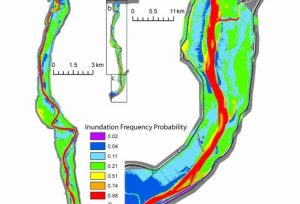
This map shows flood frequency probabilities for each sector based on combined daily flows. Credit: UCSB
Gold mining in California in the 19th century was a boon for the state’s economy but not so much for the environment. Mining left a protracted legacy that impacts the natural landscape even today. Mercury, used in the gold extraction process, has been detected throughout the Lower Yuba/Feather River system in the state’s Central Valley, and its presence could prove dangerous to local wildlife.
That mercury, which will remain in dry river sediment for thousands of years, generally poses a problem only when exposed to extreme water conditions. Flooding triggers a process called methylation, which causes a portion of the mercury to become toxic. When ingested by wildlife, this so-called methylmercury can negatively affect cardiovascular and central nervous systems.
A new study by UC Santa Barbara researchers Michael Singer, Lee Harrison and colleagues from the University of Michigan has identified how flooding frequency and duration affect mercury biogeochemistry along a 40-mile stretch of the Yuba/Feather River system. They found that about 5 percent of the total mercury in this lower section has the potential to become toxic. Their research appears in the journal Science of the Total Environment.
“First of all, it was really striking to find a riverine aquatic ecosystem exposed to mercury with no sign of any permanent wetlands nearby,” said Singer, an associate researcher at UCSB’s Earth Research Institute. “We had always thought mercury had to reach a big wetland area before significant methylation could occur, but our work indicates that this is not the case. It’s important to note that most of the time this area is totally dry so no methylation occurs — which underscores the importance of flood events as the hot moments of methylation.”
In addition to demonstrating that the ecosystem’s fauna have significant levels of toxicity in their tissues, the study identified the spatial patterns of flooding capable of triggering mercury methylation.
“This work really allows us to visualize the landscape as a whole unit, rather than just studying one small plot, and points out how potential toxicity varies in space over several decades,” Singer explained. “This is controversial because people aren’t used to thinking about this kind of problem at the landscape scale and over timescales.
“Our modeling estimated methylmercury concentrations that are quite high, so the science community could be very shocked by the degree of mercury methylation that could be possible,” Singer continued. “However, not all of this mercury will enter Central Valley food webs. Much of it will be converted back to a nontoxic form by bacteria.”
The presence of a certain community of bacteria is necessary in order to convert mercury into a toxic form that can be absorbed into the ecosystem. However, those bacteria don’t operate without water and only under conditions of low oxygen. Floodwaters push out air from the pore spaces in between sediment grains in the floodplains where oxygen in stagnating water is quickly consumed. As a result, a low-oxygen condition triggers the bacteria to methylate mercury in the sediments.
Singer’s team used historical flow record from the U.S. Geological Survey and an Army Corps of Engineers software platform to model the effects of flood frequency and inundation on relative amounts of methylmercury. They looked at 50 years of flood and hydrology, which represented the period since dams were installed in the system.
“We were able to identify the spatial patterns of the flooding based on the topography of the flood plain,” Singer explained. “Then we were able to assign statistical frequencies of the flooding to each flood map we created.”
But frequency painted only part of the picture. The researchers also investigated the significance of consecutive days of inundation. “It wasn’t enough to know that this area was flooded 50 days out of the 50-year record,” Singer said. “We wanted to know whether that flooding occurred in two long floods or was spread out in 50 separate one-day floods. The longer the area was inundated, the more opportunity existed for methylation to occur.”
The scientists also analyzed total mercury and methylmercury concentrations of wildlife that live along the Feather and Yuba rivers. They documented high concentrations, starting with sediment and moving into the food chain, from algae to small aquatic insects such as mayflies and caddisflies and to small forage fish that live locally.
Some scientists have proposed that the predominant origin of the methylmercury in many food webs is coal-fired power plants and other industry. However, previous research led by the University of Michigan co-authors of the current paper tracked mercury isotopes through this same river system to prove that mercury from gold mining was the plausible source of high mercury concentrations in the local food web.
Most researchers believe that Earth’s climatic conditions were hot at 3.5 Ga. New findings in South Africa create a new theory, presenting a much colder climate than previously suggested. Credit: Harald Furnes
When Earth’s first organisms were formed, it may have been in an ice cold ocean. New research, published in Science Advances, indicates that both land and ocean were much colder than previously believed.
Many researchers believe that Earth’s early oceans were very hot, reaching 80° Celsius, and that life originated in these conditions. New findings may prove the opposite to be true. Harald Furnes, Professor Emeritus at the Department of Earth Science, has analysed volcanic and sedimentary rocks in the Barberton Greenstone Belt, South Africa. The volcanic rocks were deposited at depths of 2 to 4 kilometres.
“We have found evidence that the climate 3.5 billion years ago was a cold environment,” says Furnes.
Along with Professor Maarten de Wit from Nelson Mandela Metropolitan University, South Africa, Furnes has published the results in the journal Science Advances.
A cold globe
The rocks analysed by Furnes and de Wit were formed at latitudes comparable with that of the Canary Islands. Some of the sedimentary rocks associated with the volcanic rocks, show a remarkable resemblance to those known from more recent ice ages.
“This may indicate that Earth, 3.5 billion years ago, experienced an extensive, perhaps global, ice age,” Furnes says.
Past ocean temperatures are measured by analysing the relations between oxygen isotopes in rocks known as “chert,” a rock composed of pure silicium-oxide. These South African rocks have been exposed to high temperatures. Even so, this is related to hydrothermal activity, or springs of extremely hot water, pumped from the ocean bed.
Similar to present climate
Additionally, the researchers found more proof indicating that these rocks had been exposed to cold water. By examining finely grained sedimentary rocks (originally a claylike mud), that exists along with the deep-submarine volcanic rocks, the researchers found gypsum. Gypsum is produced under high pressure and at very cold temperatures, as in the present deep ocean.
“In other words, we have found independant lines of evidence that the climate conditions at this time may have been quite similar to the conditions we have today,” says Furnes.
Furnes thinks some researchers may have difficulties accepting the new knowledge of an early, cold Earth. A paradigm shift in Earth Science is not to be expected, but he thinks the climate of the early earth will be seen in a new light.
“I think that this will force research to go further,” he says.
Reference:
M. J. de Wit, H. Furnes. 3.5-Ga hydrothermal fields and diamictites in the Barberton Greenstone Belt–Paleoarchean crust in cold environments. Science Advances, 2016; 2 (2): e1500368 DOI: 10.1126/sciadv.1500368
Note: The above post is reprinted from materials provided by University of Bergen. The original item was written by Jens Helleland Ådnanes. Note: Materials may be edited for content and length.
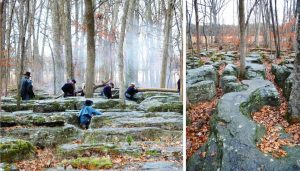
Figure 5 from the Hippensteel article, “Carbonate rocks and American Civil War infantry tactics.” Union reenactors during a National Battlefield Park demonstration in the limestone outcrops at the center of the Union line at Stones River on the 152nd anniversary of the battle. Karrens (or “cutters,” right) provided critical defensive positions for the center of the crumbling Union line during the Battle of Stones River. Credit: Scott P.Hippensteel and Geosphere.
The most studied battleground from the American Civil War, from a geological perspective, is the rolling terrain surrounding Gettysburg, Pennsylvania. Here, the mixture of harder igneous and softer sedimentary rocks produced famous landform features such as Cemetery Hill and Little Round Top that provided strong defensive positions for the Union Army.
Another even more common type of rock — carbonates such as limestone — provided similarly formidable defensive positions at numerous other battlefields in both the eastern and western theaters of conflict.
Limestones and dolostones shaped the terrain of multiple important battle sites, including Antietam, Stones River, Chickamauga, Franklin, Nashville, and Monocacy, and these rock types proved consequential with respect to the tactics employed by both Union and Confederate commanders.
This article by Scott P. Hippensteel of the University of North Carolina at Charlotte describes how carbonate rocks produced rolling terrain that limited the range and effectiveness of both artillery and small arms. Additionally, thin soils above limestone bedrock prevented tillage and the resulting forests provided concealment and cover for advancing troops. From a defensive perspective, on a larger geographic scale carbonates provided natural high ground from chert-enriched limestones. On a smaller scale, erosion of these same rocks produced karrens (or “cutters”) that provided natural rock-lined trenches for defending troops.
Reference:
Carbonate rocks and American Civil War infantry tactics. Scott P. Hippensteel, Department of Geography and Earth Sciences, University of North Carolina at Charlotte, 9201 University City Boulevard, Charlotte, North Carolina 28223, USA. Themed issue: Human Dimensions in Geoscience. DOI: 10.1130/GES01266.1
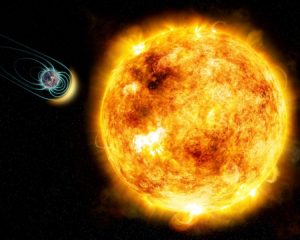
In this artist’s illustration, the young Sun-like star Kappa Ceti is blotched with large starspots, a sign of its high level of magnetic activity. New research shows that its stellar wind is 50 times stronger than our Sun’s. As a result, any Earth-like planet would need a magnetic field in order to protect its atmosphere and be habitable. The physical sizes of the star and planet and distance between them are not to scale. Credit: M. Weiss/CfA
Nearly four billion years ago, life arose on Earth. Life appeared because our planet had a rocky surface, liquid water, and a blanketing atmosphere. But life thrived thanks to another necessary ingredient: the presence of a protective magnetic field. A new study of the young, Sun-like star Kappa Ceti shows that a magnetic field plays a key role in making a planet conducive to life.
“To be habitable, a planet needs warmth, water, and it needs to be sheltered from a young, violent Sun,” says lead author Jose-Dias Do Nascimento of the Harvard-Smithsonian Center for Astrophysics (CfA) and University of Rio G. do Norte (UFRN), Brazil.
Kappa Ceti, located 30 light-years away in the constellation Cetus, the Whale, is remarkably similar to our Sun but younger. The team calculates an age of only 400-600 million years old, which agrees with the age estimated from its rotation period (a technique pioneered by CfA astronomer Soren Meibom). This age roughly corresponds to the time when life first appeared on Earth. As a result, studying Kappa Ceti can give us insights into the early history of our solar system.
Like other stars its age, Kappa Ceti is very magnetically active. Its surface is blotched with many giant starspots, like sunspots but larger and more numerous. It also propels a steady stream of plasma, or ionized gases, out into space. The research team found that this stellar wind is 50 times stronger than our Sun’s solar wind.
Such a fierce stellar wind would batter the atmosphere of any planet in the habitable zone, unless that planet was shielded by a magnetic field. At the extreme, a planet without a magnetic field could lose most of its atmosphere. In our solar system, the planet Mars suffered this fate and turned from a world warm enough for briny oceans to a cold, dry desert.
The team modeled the strong stellar wind of Kappa Ceti and its effect on a young Earth. The early Earth’s magnetic field is expected to have been about as strong as it is today, or slightly weaker. Depending on the assumed strength, the researchers found that the resulting protected region, or magnetosphere, of Earth would be about one-third to one-half as large as it is today.
“The early Earth didn’t have as much protection as it does now, but it had enough,” says Do Nascimento.
Kappa Ceti also shows evidence of “superflares” — enormous eruptions that release 10 to 100 million times more energy than the largest flares ever observed on our Sun. Flares that energetic can strip a planet’s atmosphere. By studying Kappa Ceti, researchers hope to learn how frequently it produces superflares, and therefore how often our Sun might have erupted in its youth.
Reference:
J.-D. do Nascimento Jr., A.A. Vidotto, P. Petit C. Folsom, M. Castro, S. C. Marsden, J. Morin, G.F. Porto de Mello, S. Meibom, S.V. Jeffers, E. Guinan, I. Ribas. Magnetic field and wind of Kappa Ceti: towards the planetary habitability of the young Sun when life arose on Earth. Astrophysical Journal Letters, 2016 [arXiv:1603.03937]
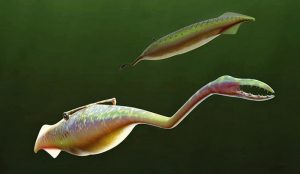
A reconstruction of the Tully Monster as it would have looked 300 million years ago. Credit: Sean McMahon/Yale University
The Tully Monster, an oddly configured sea creature with teeth at the end of a narrow, trunk-like extension of its head and eyes that perch on either side of a long, rigid bar, has finally been identified.
A Yale-led team of paleontologists has determined that the 300-million-year-old animal — which grew to only a foot long — was a vertebrate, with gills and a stiffened rod (or notochord) that supported its body. It is part of the same lineage as the modern lamprey. “I was first intrigued by the mystery of the Tully Monster. With all of the exceptional fossils, we had a very clear picture of what it looked like, but no clear picture of what it was,” said Victoria McCoy, lead author of a new study in the journal Nature. McCoy conducted her research as a Yale graduate student and is now at the University of Leicester.
For decades, the Tully Monster has been one of the great fossil enigmas: It was discovered in 1958, first described scientifically in 1966, yet never definitively identified even to the level of phylum (that is, to one of the major groups of animals). Officially known as Tullimonstrum gregarium, it is named after Francis Tully, the amateur fossil hunter who came across it in coal mining pits in northeastern Illinois.
Thousands of Tully Monsters eventually were found at the site, embedded in concretions — masses of hard rock that formed around the Tully Monsters as they fossilized. Tully donated many of his specimens to the Field Museum of Natural History, which collaborated on the Nature study along with Argonne National Laboratory and the American Museum of Natural History.
The Tully Monster has taken on celebrity status in Illinois. It became the state fossil in 1989, and more recently, U-Haul trucks and trailers in Illinois began featuring an image of a Tully Monster.
“Basically, nobody knew what it was,” said Derek Briggs, Yale’s G. Evelyn Hutchinson Professor of Geology and Geophysics, curator of invertebrate paleontology at the Yale Peabody Museum of Natural History, and co-author of the study. “The fossils are not easy to interpret, and they vary quite a bit. Some people thought it might be this bizarre, swimming mollusk. We decided to throw every possible analytical technique at it.”
Using the Field Museum’s collection of 2,000 Tully Monster specimens, the team analyzed the morphology and preservation of various features of the animal. Powerful, new analytical techniques also were brought to bear, such as synchrotron elemental mapping, which illuminates an animal’s physical features by mapping the chemistry within a fossil.
The researchers concluded that the Tully Monster had gills and a notochord, which functioned as a rudimentary spinal cord. Neither feature had been identified in the animal previously.
“It’s so different from its modern relatives that we don’t know much about how it lived,” McCoy said. “It has big eyes and lots of teeth, so it was probably a predator.”
Some key questions about Tully Monsters remain unanswered, however. No one knows when the animal first appeared on Earth or when it went extinct. Its existence in the fossil record is confined to the Illinois mining site, dating back 300 million years.
“We only have this little window,” Briggs said.
Additional Yale co-authors are Erin Saupe, Lidya Tarhan, Sean McMahon, Christopher Whalen, Elizabeth Clark, Ross Anderson, Holger Petermann, Emma Locatelli, and former Yale researcher James Lamsdell, who is at the American Museum of Natural History.
Reference:
Victoria E. McCoy, Erin E. Saupe, James C. Lamsdell, Lidya G. Tarhan, Sean McMahon, Scott Lidgard, Paul Mayer, Christopher D. Whalen, Carmen Soriano, Lydia Finney, Stefan Vogt, Elizabeth G. Clark, Ross P. Anderson, Holger Petermann, Emma R. Locatelli, Derek E. G. Briggs. The ‘Tully monster’ is a vertebrate. Nature, 2016; DOI: 10.1038/nature16992
Note: The above post is reprinted from materials provided by Yale University. The original item was written by Jim Shelton.
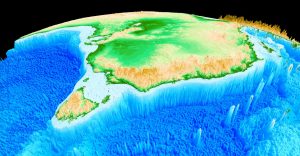
Topography of Eastern Australia is shown. Credit: Professor Dietmar Müller
Geologists from the University of Sydney and the California Institute of Technology have solved the mystery of how Australia’s highest mountain – Mount Kosciuszko – and surrounding Alps came to exist.
Most of the world’s mountain belts are the result of two continents colliding (e.g. the Himalayas) or volcanism. The mountains of Australia’s Eastern highlands – stretching from north-eastern Queensland to western Victoria – are an exception. Until now no one knew how they formed.
A research team spearheaded by Professor Dietmar Müller from the University’s School of Geosciences used high performance computing code to investigate the cause of the uplift which created the mountain range. The team found the answer in the mountains’ unusually strong gravity field.
“The gravity field led us to suspect the region might be pushed up from below so we started looking at the underlying mantle: the layer of rock between the Earth’s core and its crust,” said Professor Müller.
The team found the mantle under Australia’s east coast has been uplifted twice.
The first occurred during the Early Cretaceous Period, when Australia was part of Gondwanaland.
Over Earth’s lifespan or ‘geological time’ the largely solid mantle has continuously been stirred by old, cold tectonic plate sections sinking into the deep mantle, under another plate. This process, called subduction, was occurring during the Early Cretaceous Period.
“Eastern Australia was drifting over a subducted plate graveyard, giving it a sinking feeling,” said co-author Dr Kara Matthews, a former PhD candidate at the University now at the University of Oxford. “But around 100 million years ago subduction came to a halt, resulting in the entire region being uplifted, forming the Eastern Highlands.”
The next 50 million years was a time of relative inactivity.
“Then, about 50 million years ago Australia’s separation from Antarctica accelerated and it started moving north-northeast, gradually taking it closer to a vast mantle upwelling called the South Pacific Superswell,” said co-author Dr Nicolas Flament. “This provided a second upward push to the Eastern Highlands as they gradually rode over the edge of the superswell.”
Professor Müller said the two-phase uplift suggested by supercomputer models is supported by geological features from rivers in the Snow Mountains, where river incision occurred in two distinct phases.
“The model we built explains why the iconic Australian Alps exist and is also a new mechanism for figuring out how some other mountainous regions elsewhere in the world were formed.”
The team’s findings have been published in Earth and Planetary Sciences.
Reference:
R. Dietmar Müller, Nicolas Flament, Kara J. Matthews, Simon E. Williams, Michael Gurnis. Formation of Australian continental margin highlands driven by plate–mantle interaction. DOI: 10.1016/j.epsl.2016.02.025
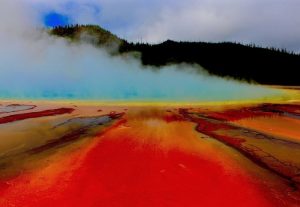
Primitive bacteria at Yellowstone National Park. Credit: Albatros4825, Wikimedia Commons
Photosynthesis is the process by which plants, algae and cyanobacteria use the energy from the Sun to make sugar from water and carbon dioxide, releasing oxygen as a waste product. But a few groups of bacteria carry out a simpler form of photosynthesis that does not produce oxygen, which evolved first.
A new study by an Imperial researcher suggests that this more primitive form of photosynthesis evolved in much more ancient bacteria than scientists had imagined, more than 3.5 billion years ago.
Photosynthesis sustains life on Earth today by releasing oxygen into the atmosphere and providing energy for food chains. The rise of oxygen-producing photosynthesis allowed the evolution of complex life forms like animals and land plants around 2.4 billion years ago.
However, the first type of photosynthesis that evolved did not produce oxygen. It was known to have first evolved around 3.5-3.8 billion years ago, but until now, scientists thought that one of the groups of bacteria alive today that still uses this more primate photosynthesis was the first to evolve the ability.
But the new research reveals that a more ancient bacteria, that probably no longer exists today, was actually the first to evolve the simpler form of photosynthesis, and that this bacteria was an ancestor to most bacteria alive today.
“The picture that is starting to emerge is that during the first half of Earth’s history the majority of life forms were probably capable of photosynthesis,” said study author Dr Tanai Cardona, from the Department of Life Sciences at Imperial College London.
The more primitive form of photosynthesis is known as anoxygenic photosynthesis, which uses molecules such as hydrogen, hydrogen sulfide, or iron as fuel — instead of water.
Traditionally, scientists had assumed that one of the groups of bacteria that still use anoxygenic photosynthesis today evolved the ability and then passed it on to other bacteria using horizontal gene transfer — the process of donating an entire set of genes, in this case those required for photosynthesis, to unrelated organisms.
However, Dr Cardona created an evolutionary tree for the bacteria by analyzing the history of a protein essential for anoxygenic photosynthesis. Through this, he was able to uncover a much more ancient origin for photosynthesis.
Instead of one group of bacteria evolving the ability and transferring it to others, Dr Cardona’s analysis reveals that anoxygenic photosynthesis evolved before most of the groups of bacteria alive today branched off and diversified. The results are published in the journal PLOS ONE.
“Pretty much every group of photosynthetic bacteria we know of has been suggested, at some point or another, to be the first innovators of photosynthesis,” said Dr Cardona. “But this means that all these groups of bacteria would have to have branched off from each other before anoxygenic photosynthesis evolved, around 3.5 billion years ago.
“My analysis has instead shown that anoxygenic photosynthesis predates the diversification of bacteria into modern groups, so that they all should have been able to do it. In fact, the evolution of oxygneic photosynthesis probably led to the extinction of many groups of bacteria capable of anoxygenic photosynthesis, triggering the diversification of modern groups.”
To find the origin of anoxygenic photosynthesis, Dr Cardona traced the evolution of BchF, a protein that is key in the biosynthesis of bacteriochlorophyll a, the main pigment employed in anoxygenic photosynthesis. The special characteristic of this protein is that it is exclusively found in anoxygenic photosynthetic bacteria and without it bacteriochlorophyll a cannot be made.
By comparing sequences of proteins and reconstructing an evolutionary tree for BchF, he discovered that it originated before most described groups of bacteria alive today.
Reference:
Tanai Cardona. Origin of Bacteriochlorophyll a and the Early Diversification of Photosynthesis. PLOS ONE, 2016; 11 (3): e0151250 DOI: 10.1371/journal.pone.0151250
Note: The above post is reprinted from materials provided by Imperial College London. The original item was written by Hayley Dunning.
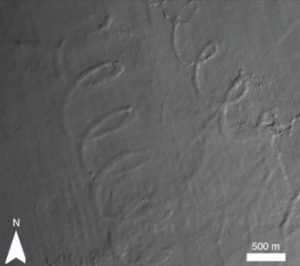
A researcher from the University of Manchester has discovered 430,000 year-old spiral-shaped landforms beneath the seafloor of the North Atlantic Ocean, which may help scientists to improve their predictions of future climate change.
Over the last 2.8 million years, Northwest Europe has been subjected to the repeated growth and decay of large ice sheets. These fluctuations in ice sheet extent are recorded in glacial sediments preserved off the coast of Norway, which are over 1 km thick in places. When these ice sheets reached the sea, they released icebergs whose keels sometimes scraped across the seafloor, sculpting the sediments into distinct landforms. Some of these were preserved by sediment burial, and can be used to reconstruct environmental conditions during past glaciations.
Andrew Newton and his team used 3D seismic reflection data to build models of the buried ancient seafloor. They found spiral-shaped landforms caused by icebergs moved by the combination of an ancient version of the North Atlantic Current (NAC) and the tide. These date from a period of glacial melting 430,000 years ago. By using the landforms to reconstruct the speeds of these currents, they were able to show for the first time that as the European ice sheets began to decay, the NAC was about 50% slower than it is now. This is important, because the NAC plays a significant role in helping to transport heat from the tropics to Northwest Europe, and any change in its strength would have an important influence on our climate.
The vast majority of scientific work carried out in these areas has tended to concentrate on the most recent glaciation, which is already well-documented. By investigating older records of glaciation, scientists will be better equipped to reconstruct the longer-term history of glacial fluctuations and climate change, and the rates at which these environments changed.
“We hope that the documentation of these spiral iceberg scours and the methodology we have developed will lead to the discovery of similar landforms around the Arctic, and will allow for better reconstructions of ancient ocean currents. The more we understand about the ancient environments around the Arctic and Northwest Europe, the more capable we will be of predicting future climate change,” says Andrew Newton.
A new computer model better predicts the extent of permafrost area and stability in the northern high latitudes, researchers report. Credit: Rahul Barman
Uncertainties are a fact of life for those who model climate change and the factors that amplify or moderate its effects. One important dynamic in climate change studies is the extent of permafrost (permanently frozen soils) in the northern high latitudes and the rate at which it defrosts as the climate warms.
Scientists from the University of Illinois report they have found a way to improve predictions of permafrost area and stability in the northern high latitudes. By including four key biophysical processes in their computer model – soil organic carbon, compacted snow, frozen ice crystals in the soil and the transfer of heat from shallow ground to much deeper soils – the researchers are able to estimate permafrost area and permafrost lost as a result of climate change more accurately than previous models have. Their model also suggests that permafrost has declined more slowly in recent decades than previously thought.
The study is reported in the Journal of Advances in Modeling Earth Systems.
“These four processes are crucial to understanding the dynamics of the permafrost and the changes occurring in the northern high latitudes,” said University of Illinois atmospheric sciences professor Atul Jain, who led the new analysis with Ph.D. student Rahul Barman. “And they are not being accounted for in other climate modeling studies.”
Permafrost is a major player in the climate cycle, Jain said.
“There is a huge amount of nutrients such as carbon and nitrogen stored in the permafrost,” he said. “If this frozen soil melts due to climate change, you could expect all the nutrients stored to be released to the atmosphere, triggering further climate change.”
The new model focused on continuous (90-100 percent of the land area) and discontinuous (50-90 percent) permafrost areas in the northern high latitudes.
Barman, who conducted this work as part of his Ph.D. research, used an Earth System model, which accounts for several key processes influencing permafrost stability. He incorporated the four additional processes discussed above into his model, testing each individually – and all of them together – against previous models and actual measurements of permafrost dynamics. He demonstrated that adding the four additional processes greatly improved the accuracy of the model.
“Soil organic carbon has a very dynamic effect on thermal energy in the summer and in the winter,” Jain said. The carbon acts as an insulator, keeping the soil cooler in summer and warmer in winter.
“Frozen crystals in the upper layers of soil act as insulation, trapping warmth in the soil in winter,” Jain said. “And while thick snow also insulates the soil, snow compaction due to winds allows more heat to escape to the atmosphere.”
The new model also is unique in that it accounted for thermal energy fluxes down to 50 meters below the surface. This allowed Barman to study a previously underestimated phenomenon: Heat transfer from shallow soils to deeper soils helps maintain permafrost stability.
“Our study shows that including detailed analyses of cold-region biogeophysical processes in models of permafrost extent and degradation greatly improves the models,” Jain said. “It also suggests that improving our understanding of other influences, such as climate change variability, land-use and land-cover changes, also will produce notable differences in the accuracy of models of northern high-latitude permafrost area. More work must be done to further improve our models.”
Reference:
Comparison of effects of cold-region soil/snow processes and the uncertainties from model forcing data on permafrost physical characteristics” is available online or from the U. of I. News Bureau. DOI: 10.1002/2015MS000504
Peter Ditlevsen’s calculations show that you can view the climate as fractals, that is, patterns or structures that repeat in smaller and smaller versions indefinitely. The formula is: Fq(s)~sHq . Credit: Maria Lemming
When we talk about climate change today, we have to look at what the climate was previously like in order to recognise the natural variations and to be able to distinguish them from the human-induced changes. Researchers from the Niels Bohr Institute have analysed the natural climate variations over the last 12,000 years, during which we have had a warm interglacial period and they have looked back 5 million years to see the major features of the Earth’s climate. The research shows that not only is the weather chaotic, but the Earth’s climate is chaotic and can be difficult to predict. The results are published in the scientific journal, Nature Communications.
The Earth’s climate system is characterised by complex interactions between the atmosphere, oceans, ice sheets, landmasses and the biosphere (parts of the world with plant and animal life). Astronomical factors also play a role in relation to the great changes like the shift between ice ages, which typically lasts about 100,000 years and interglacial periods, which typically last about 10-12,000 years.
Climate repeats as fractals
“You can look at the climate as fractals, that is, patterns or structures that repeat in smaller and smaller versions indefinitely. If you are talking about 100-year storms, are there then 100 years between them? — Or do you suddenly find that there are three such storms over a short timespan? If you are talking about very hot summers, do they happen every tenth year or every fifth year? How large are the normal variations? — We have now investigated this,” explains Peter Ditlevsen, Associate Professor of Climate Physics at the Niels Bohr Institute at the University of Copenhagen. The research was done in collaboration with Zhi-Gang Shao from South China University, Guangzhou in Kina.
The researchers studied temperature measurements over the last 150 years, ice core data from Greenland from the interglacial period 12,000 years ago, for the ice age 120,000 years ago, ice core data from Antarctica, which goes back 800,000 years, as well as data from ocean sediment cores going back 5 million years.
“We only have about 150 years of direct measurements of temperature, so if, for example, we want to estimate how great of variations that can be expected over 100 years, we look at the temperature record for that period, but it cannot tell us what we can expect for the temperature record over 1000 years. But if we can determine the relationship between the variations in a given period, then we can make an estimate. These kinds of estimates are of great importance for safety assessments for structures and buildings that need to hold up well for a very long time, or for structures where severe weather could pose a security risk, such as drilling platforms or nuclear power plants. We have now studied this by analysing both direct and indirect measurements back in time,” explains Peter Ditlevsen.
The research shows that the natural variations over a given period of time depends on the length of this period in the very particular way that is characteristic for fractals. This knowledge tells us something about how big we should expect the 1000-year storm to be in relation to the 100-year storm and how big the 100-year storm is expected to be in relation to the 10-year storm. They have further discovered that there is a difference in the fractal behaviour in the ice age climate and in the current warm interglacial climate.
Abrupt climate fluctuations during the ice age
“We can see that the climate during an ice age has much greater fluctuations than the climate during an interglacial period. There has been speculation that the reason could be astronomical variations, but we can now rule this out as the large fluctuation during the ice age behave in the same ‘fractal’ way as the other natural fluctuations across the globe,” Peter Ditlevsen.
The astronomical factors that affect the Earth’s climate are that the other planets in the solar system pull on the Earth because of their gravity. This affects the Earth’s orbit around the sun, which varies from being almost circular to being more elliptical and this affects solar radiation on Earth. The gravity of the other planets also affects the Earth’s rotation on its axis. The Earth’s axis fluctuates between having a tilt of 22 degrees and 24 degrees and when the tilt is 24 degrees, there is a larger difference between summer and winter and this has an influence on the violent shifts in climate between ice ages and interglacial periods.
The abrupt climate changes during the ice age could be triggered by several mechanisms that have affected the powerful ocean current, the Gulf Stream, which transports warm water from the equator north to the Atlantic, where it is cooled and sinks down into the cold ocean water under the ice to the bottom and is pushed back to the south. This water pump can be put out of action or weakened by changes in the freshwater pressure, the ice sheet breaking up or shifting sea ice and this results in the increasing climatic variability.
Natural and human-induced climate changes
The climate during the warm interglacial periods is more stable than the climate of ice age climate.
“In fact, we see that the ice age climate is what we call ‘multifractal’, which is a characteristic that you see in very chaotic systems, while the interglacial climate is ‘monofractal’. This means that the ratio between the extremes in the climate over different time periods behaves like the ratio between the more normal ratios of different timescales,” explains Peter Ditlevsen
This new characteristic of the climate will make it easier for climate researchers to differentiate between natural and human-induced climate changes, because it can be expected that the human-induced climate changes will not behave in the same way as the natural fluctuations.
“The differences we find between the two climate states also suggest that if we shift the system too much, we could enter a different system, which could lead to greater fluctuations. We have to go very far back into the geological history of the Earth to find a climate that is as warm as what we are heading towards. Even though we do not know the climate variations in detail so far back, we know that there were abrupt climate shifts in the warm climate back then,” points out Peter Ditlevsen.
Reference:
Zhi-Gang Shao, Peter D. Ditlevsen. Contrasting scaling properties of interglacial and glacial climates. Nature Communications, 2016; 7: 10951 DOI: 10.1038/ncomms10951
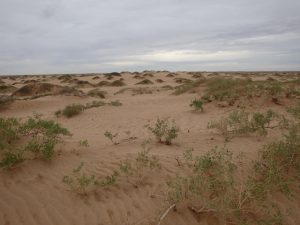
These are coppice dunes from the Jilantai area, China. Credit: Science China Press
Dust storms are a common occurrence in the deserts of northern China, and has accumulated to great thicknesses to form the vast Chinese loess plateau. Researchers have attempted to locate the most important sources of this dust. It is important from a variety of environmental and health-related perspectives, and over longer time scales, it impacts climate change. A better understanding of the potential sources of dust can contribute to planning and mitigating the effects of the next dust storm or identify problem dust sources in the future.
Sand dunes, a common feature of many deserts, are composed almost entirely of sand and are usually ignored as dust sources. Recent research by scientists, including those in the U.K. and Israel, however, has revealed that sand grain collisions result in breaking and chipping of sand grains, highlighting a potentially important dust generation mechanism. In order to test whether sand dunes could produce substantial amounts of dust, Mark Sweeney, a dust researcher from the University of South Dakota, Huayu Lu and students from Nanjing University, and Joe Mason from the University of Wisconsin-Madison used portable wind tunnel technology, the Portable in situ Wind Erosion Laboratory (PI-SWERL), to measure the potential of dunes to emit dust in the Ulan Buh, Tengger, and Mu Us deserts of northern China in 2013.
The PI-SWERL, a technology developed by the Desert Research Institute in Las Vegas, Nevada, can measure the potential of dust emissions in places otherwise unaccessible to large field wind tunnels. Sweeney and colleagues conducted a number of tests on large, mobile transverse dunes, smaller, vegetated coppice dunes, and dry river and lake beds. High resolution particle size analysis revealed that the transverse dunes contained no dust-sized material, yet these dunes emitted low levels of dust. One explanation for this discrepancy is that dust was generated by the removal of grain coatings or breaking apart the grains themselves during grain collisions.
Coppice dunes, which are vegetated dunes that trap sand and dust-sized particles, emitted the most dust compared to all potential sources that they measured. The amount of dust emitted was similar to that emitted from dry river beds, which are considered important desert dust sources. Presently, the coppice dunes are not sources of dust because the vegetation prohibits the dust from being emitted. But if climate change, extended drought, or declining groundwater levels kill off the vegetation stabilizing these dunes, they can become large dust sources. Coppice dunes are very extensive in northern China.
This research emphasizes the importance of sand dunes as dust sources in the present and future and provides a more accurate picture of the types and variability of desert dust sources. A better understanding of dust sources can also lead to improved dust modeling efforts. Future work might expand on more types of dunes and determine the relative importance of grain coatings or grain chipping in dust formation.
Reference:
Mark R. Sweeney et al. Sand dunes as potential sources of dust in northern China, Science China Earth Sciences (2016). DOI: 10.1007/s11430-015-5246-8
Note: The above post is reprinted from materials provided by Science China Press.
Avian fibular reduction occurs between HH31 and HH36. (A) Sox9 in situ hybridization shows the earliest development of tibia and fibula; (B) Expression of Coll-IX, a marker of early cartilage, shows the fibula is separate but in close contact with the fibulare during early development, later detaching from each other. (C) Early chicken hind limbs stained with Alcian blue reveal the growth and maturation of zeugopodial cartilages between embryonic days 6 and 10. Cartilage composes the entire element at earlier stages, while bone differentiation at the center is revealed by the absence of staining. Scale: 1 mm. (D) Double staining for cartilage and calcified bone at HH36 and HH42 shows that the length ratio of the tibia/fibula is established at HH36 and is maintained from that stage onward (not in scale).
Scientists in Chile have created a chicken embryo that developed dinosaur-like feet after genetic manipulation, highlighting the evolutionary link between theropod dinosaurs and birds.
The research—published last week in the journal Evolution—shows that “by inhibiting early maturation of a leg of the chicken embryo, the leg reverts to the shape that dinosaurs’ legs had,” said Alexander Vargas, one of the six researchers at the University of Chile.
“The result is a chicken embryo with dinosaur legs,” Vargas told AFP on Tuesday, explaining what amounts to reverse evolution.
Theropods, a group of dinosaurs, started as carnivores but evolved to eat plants and insects.
Birds evolved from small theropods in the Jurassic period more than 145 million years ago.
In their study, scientists manipulated the Indian Hedgehog Homolog gene common to all animals, including man.
They were trying to pinpoint when birds had a dinosaur-like fibula bone. When the researchers delayed early development, the bone took on the tubular shape it once had in dinosaurs.
The research should help shed new light not just on the links between birds and dinosaurs, but on the genetic changes involved in the evolution, Vargas said.
It also confirmed the hypothesis that a bone can be made to regrow with characteristics from the evolutionary past by interfering with early maturation, according to the study led by Brazilian Joao Botelho at the University of Chile.
Fossil taxa documenting the early evolution of distal fibular reduction. Basal pygostylia such as Sapeornis and Jeholornis, and the basal enantiornithes Eopengornis show a splinter-like distal fibula, lacking an epiphysis and articulation to the ankle. However, the fibula is not much shorter than the tibia. Thereafter, lower fibulo–tibial ratios evolved in different lineages, such as Qiliania within enantinornithes, and Gansus within Ornithotoraces.
Reference:
João Francisco Botelho et al. Molecular development of fibular reduction in birds and its evolution from dinosaurs, Evolution (2016). DOI: 10.1111/evo.12882
Note: The above post is reprinted from materials provided by AFP.



 The largest oval fancy vivid diamond ever to appear at auction is headed for sale in Hong Kong next month, where it is expected to fetch $30 million – $35 million.