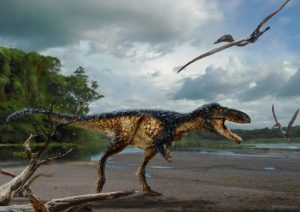
This is a life reconstruction of the new tyrannosaur Timurlengia euotica in its environment 90 million years ago. It is accompanied by two flying reptiles (Azhdarcho longicollis). The fossilized remains of a new horse-sized dinosaur, Timurlengia euotica, reveal how Tyrannosaurus rex and its close relatives became top predators, according to a new study published in the Proceedings of the National Academy of Sciences. Credit: Original painting by Todd Marshall.
The fossilized remains of a new horse-sized dinosaur reveal how Tyrannosaurus rex and its close relatives became top predators, according to a new study published in the Proceedings of the National Academy of Sciences.
Paleontologists have long known from the fossil record that the family of dinosaurs at the center of the study–tyrannosaurs–transitioned from small-bodied species to fearsome giants like the T. rex over the course of 70 million years. But now, newly discovered dinosaur fossils suggest that much of this transition and growth in size occurred suddenly, toward the end of this 70 million-year period. The study also shows that before the evolution of their massive size, tyrannosaurs had developed keen senses and cognitive abilities, including the ability to hear low-frequency sounds. This positioned them to take advantage of opportunities to reach the top of their food chain in the Late Cretaceous Period after other groups of large meat-eating dinosaurs had gone extinct about 80-90 million years ago.
Until now, little was known about how tyrannosaurs became the giant, intelligent predators that dominated the landscape about 70 to 80 million years ago. The newly discovered species, named Timurlengia euotica, lived about 90 million years ago and fills a 20 million-year gap in the fossil record of tyrannosaurs. The new species is a tyrannosaur but not the ancestor of the T. rex.
“Timurlengia was a nimble pursuit hunter with slender, blade-like teeth suitable for slicing through meat,” said Hans Sues, chair of the Department of Paleobiology at the Smithsonian’s National Museum of Natural History. “It probably preyed on the various large plant-eaters, especially early duck-billed dinosaurs, which shared its world. Clues from the life of Timurlengia allow us to fill in gaps and better understand the life and evolution of other related dinosaurs, like T. rex.”
Sues and Alexander Averianov, a senior scientist at the Russian Academy of Sciences, collected the fossils at the center of the study between 1997 and 2006 while co-leading international expeditions to the Kyzylkum Desert of Uzbekistan.
“Central Asia was the place where many of the familiar groups of Cretaceous dinosaurs had their roots,” Sues said. “The discoveries from the Kyzylkum Desert of Uzbekistan are now helping us to trace the early history of these animals, many of which later flourished in our own backyard in North America.”
Sues and a team of paleontologists led by Steve Brusatte at the University of Edinburgh studied tyrannosaur fossils collected from the international expedition and discovered the new species. The team later reconstructed the brain of the dinosaur using CT scans of its brain case to glean insights into the new species’ advanced senses.
“The ancestors of T. rex would have looked a whole lot like Timurlengia, a horse-sized hunter with a big brain and keen hearing that would put us to shame,” Brusatte said. “Only after these ancestral tyrannosaurs evolved their clever brains and sharp senses did they grow into the colossal sizes of T. rex. Tyrannosaurs had to get smart before they got big.”
The species’ skull was much smaller than that of T. rex. However, key features of Timurlengia’s skull reveal that its brain and senses were already highly developed, the team says.
Timurlengia was about the size of a horse and could weigh up to 600 pounds. It had long legs and was likely a fast runner.
The first tyrannosaurs lived during the Jurassic Period, around 170 million years ago, and were only slightly larger than a human. However, by the Late Cretaceous Period–around 100 million years later–tyrannosaurs had evolved into animals like T. rex, which could weigh up to 7 tons.
The new species’ small size some 80 million years after tyrannosaurs first appeared in the fossil record indicates that its huge size developed only toward the end of the group’s long evolutionary history.
The new study was funded by the European Commission. The fieldwork was supported by the National Science Foundation and the National Geographic Society. The work was carried out in collaboration with researchers at the University of Edinburgh, Russian Academy of Sciences and Saint Petersburg State University.
Reconstructed skeleton of Timurlengia euotica with discovered fossilized bones, highlighted in red, and other bones remaining to be discovered inferred from other related species of tyrannosaurs in white. Individual scale bars for the pictured fossilized bones each equal 2 cm. The fossilized remains of a new horse-sized dinosaur, Timurlengia euotica, reveal how Tyrannosaurus rex and its close relatives became top predators, according to a new study published in the Proceedings of the National Academy of Sciences. Credit: Proceedings of the National Academy of Sciences
Reference:
Stephen L. Brusatte, Alexander Averianov, Hans-Dieter Sues, Amy Muir, and Ian B. Butler. New tyrannosaur from the mid-Cretaceous of Uzbekistan clarifies evolution of giant body sizes and advanced senses in tyrant dinosaurs. PNAS, March 14, 2016 DOI: 10.1073/pnas.1600140113
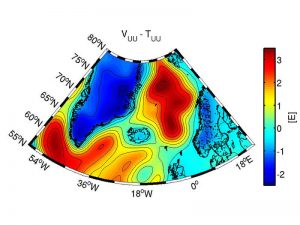
Gravity gradients for the North Atlantic region. Credit: Illustration: Bouman / TUM
How does the ice on the polar caps change? And which are the geological characteristics of the Earth’s crust beneath? What is the structure of the boundary between the Earth’s crust and mantle? Geophysicists will be able to answer these questions in the future using gravity field measurements from ESA’s GOCE gravity satellite. Geodesists from the Technical University of Munich (TUM) have prepared the measurement data mathematically in such a way that they can be used to resolve structures deep below the surface.
If an astronaut could see gravity fields, then he would not perceive the Earth as round; instead, it would appear dented like a potato. The reason: the masses in oceans, continents and deep in the Earth’s interior are not distributed equally. The gravitational force therefore differs from location to location. These variations, which are invisible to the human eye, have been measured by highly sensitive acceleration sensors on board the Gravity Field and Steady-State Ocean Circulation Explorer — GOCE for short.
The satellite transmitted several hundred million data records to ground control between 2009 and 2013. Groups of the TUM are significantly involved in the development of the mission and the analysis and application of the measurements. “This data has helped us to map the Earth’s gravity field with great precision. And now — by putting on the gravity glasses — we can use the measurement values to see deep beneath the surface of our planet,” explains Dr. Johannes Bouman from the German Geodetic Research Institute at TUM.
The Earth’s crust becomes visible
On the gravity field maps that the team has now published in the online magazine Scientific Reports, you can recognize, for example, a wide, red stripe in the North Atlantic that symbolizes increased gravity. This is consistent with the plate tectonic model: between Greenland and Scandinavia thick and heavy material rises up from the Earth’s mantle along the mid-ocean ridge, cools down and creates fresh oceanic crust. “With the gravity field measurements we can provide additional information to the plate tectonic model as we can draw conclusions regarding density and thickness of the different plates,” says Bouman.
Algorithms offer new perspectives
Together with his team Bouman worked on preparing the GOCE data for two years. This data proved difficult to interpret because the satellite’s height and orientation fluctuated as it orbited the Earth. “The location of the satellite could be pinpointed at any time using GPS, but you had to correlate each measurement with the coordinates saved when evaluating the data,” recalls the TUM researcher. Using the algorithms that he developed with his team, he was able to transform the data in such a way as to enable geophysicists to use it without additional adjustments going forward.
Two grids — two eyes
The trick: the measurement values were not correlated with the actual trajectory of the satellite; instead, they were converted into two reference ellipsoids. These ellipsoids, which surround the Earth at heights of 225 and 255 kilometers, have a fixed height and their geographical orientation is defined, too. Each ellipsoid consists of 1.6 million grid points that can be combined. “In this way — as with stereoscopic vision with two eyes — you can make the third dimension visible. If you then combine this information with a geophysical model, you get a three-dimensional image of the Earth,” explains Bouman.
“This method is very interesting for geophysicists,” emphasizes Prof. Jörg Ebbing, Head of the Work Group for Geophysics and Geoinformation at the University of Kiel and also author of the paper. “Previously, the models were predominantly based on seismic measurements — from the course that seismic waves travel, you can deduce, for example, boundaries between the Earth’s crust and mantle. This new data allows us to check and improve our ideas and perceptions.”
Analyzing the Earth’s crust in the North Atlantic is only the beginning. “Using the geodetic data from the GOCE mission, we will be able to examine the structure of the entire crust in more detail in the future,” adds Prof. Florian Seitz, Director of the German Geodetic Research Institute at TUM. “And we will even be able to make dynamic movements visible, such as the melting of the polar ice sheets, which seismology could not see.”
Reference:
Johannes Bouman, Jörg Ebbing, Martin Fuchs, Josef Sebera, Verena Lieb, Wolfgang Szwillus, Roger Haagmans, Pavel Novak. Satellite gravity gradient grids for geophysics. Scientific Reports, 2016; 6: 21050 DOI: 10.1038/srep21050
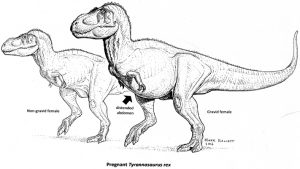
A pregnant Tyrannosaurus rex that roamed Montana 68 million years ago may be the key to discerning gender differences between theropod, or meat-eating dinosaur, species. Researchers from North Carolina State University and the North Carolina Museum of Natural Sciences have confirmed the presence of medullary bone — a gender-specific reproductive tissue — in a fossilized T. rex femur. Beyond giving paleontologists a definitively female fossil to study, their findings could shed light on the evolution of egg laying in modern birds.
Medullary bone is only found in female birds, and then only during the period before or during egg laying. It is chemically distinct from other bone types, like the dense cortical bone that makes up the outer portion of our bones, or the spongy cancellous bone found inside them. This is because medullary bone has to be laid down and mobilized quickly in order for birds to shell their eggs. Theropod dinosaurs, the broader dinosaurian group that includes modern birds and other toothy relatives such as T. rex, also laid eggs in order to reproduce, and paleontologists have hypothesized that they may have had medullary bone as well.
In 2005, Mary Schweitzer, an NC State paleontologist with a joint appointment at the NC Museum of Natural Sciences and lead author of a paper describing the research, found what she believed to be medullary bone in the femur of a 68 million year old T. rex fossil (MOR 1125).
“All the evidence we had at the time pointed to this tissue being medullary bone,” Schweitzer says, “but there are some bone diseases that occur in birds, like osteopetrosis, that can mimic the appearance of medullary bone under the microscope. So to be sure we needed to do chemical analysis of the tissue.”
Medullary bone contains keratan sulfate, a substance not present in other bone types, but it was previously thought that none of the original chemistry of dinosaur bone would survive millions of years. However, Schweitzer and her colleagues conducted a number of different tests on the T. rex sample, including testing for keratan sulfate using monoclonal antibodies, and compared their results to the same tests performed on known medullary tissue from ostrich and chicken bone. Their findings confirmed that the tissue from the T. rex was medullary bone.
“This analysis allows us to determine the gender of this fossil, and gives us a window into the evolution of egg laying in modern birds,” Schweitzer says, although she adds that the fleeting nature of medullary bone means that finding more of it in the fossil record may be difficult.
The femur of MOR1125 was already broken when Schweitzer got it, and she acknowledges that most paleontologists wouldn’t want to cut open or demineralize their fossils in order to search for rare medullary bone. However, co-author Lindsay Zanno, an NC State paleontologist with a joint appointment at the NC Museum of Natural Sciences, showed that CT scans of fossils may help narrow down the search.
“It’s a dirty secret, but we know next to nothing about sex-linked traits in extinct dinosaurs. Dinosaurs weren’t shy about sexual signaling, all those bells and whistles, horns, crests, and frills, and yet we just haven’t had a reliable way to tell males from females,” Zanno says. “Just being able to identify a dinosaur definitively as a female opens up a whole new world of possibilities. Now that we can show pregnant dinosaurs have a chemical fingerprint, we need a concerted effort to find more.”
The research appears in Scientific Reports. Funding was provided by the National Science Foundation and the David and Lucile Packard Foundation. Wenxia Zheng of NC State, Sarah Werning of Des Moines University, and Toshie Sugiyama of Niigata University, Japan, also contributed to the work.
Reference:
Mary Higby Schweitzer, Wenxia Zheng, Lindsay Zanno, Sarah Werning, Toshie Sugiyama. Chemistry supports the identification of gender-specific reproductive tissue in Tyrannosaurus rex. Scientific Reports, 2016; 6: 23099 DOI: 10.1038/srep23099
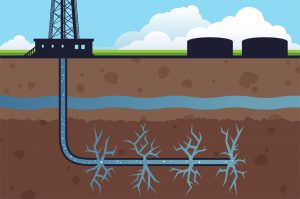
Fires caused by lightning strikes on hydrocarbon storage plants are a century-old, yet to be addressed, problem, according to research published in the International Journal of Forensic Engineering. In the era of hydraulic fracturing, or fracking, this is becoming an even more poignant issue for the fossil fuel industry.
Sterling Rooke of X8 Inc in Crofton, Maryland, and Miroslaw Skibniewski of the Department of Civil and Environmental Engineering, at the University of Maryland, USA, explain that uncontrolled fires and explosions at storage facilities can cost US $10 million per incidence. Moreover, given that some facilities are in areas of high-frequency lightning storms, the threat is significant. They point out that a third of all modern hydrocarbon tank accidents are associated with lightning. Ironically, the burning of fossil fuels that has led to anthropogenic climate change during this last century, might also increase the frequency of lightning storms.
Fracking, the team says, has revolutionized oil and gas production in the USA but the industry is a controversial one. The idea of uncertainty surrounding the safety of the chemicals used, potential contamination of drinking water supplies and the environment and the risk of triggering seismic activity through fracking are issues that remain high on the agenda. However, direct strike lightning accidents could be a critical factor in fracking safety in the long term.
The team has now overlaid the current US National Lightning Detection Network (NLDN) risk map and the Energy Information Administration (EIA) shale play map and found that the lightning threat will only increase with the migration of future shale activities. “Lightning is an increasing threat to a critical component of the world’s energy security,” the team suggests. They add that planning may change, but shale deposits and regional lightning threats do not change geographically. “This research quantifies the threat and outlines clear lightning mitigation strategies,” they explain.
Reference:
Rooke, S.S. and Skibniewski, M.J. Sensors for lightning mitigation at hydraulic fracturing storage facilities. Int. J. Forensic Engineering, Vol. 2, No. 4, pp.293-311
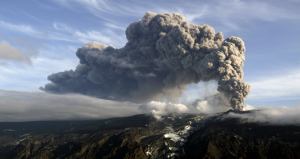
Volcanic ash can damage jet engines, and Ludwig-Maximilians-Universitaet (LMU) in Munich volcanologists have developed a new empirical model for assessment of the risk. Their results show that tests using sand do not reflect the behavior of ash in this context.
Volcanic ash is hazardous to commercial aircraft because, when drawn into jet engines, it can severely damage the turbines as well as compromising the operation of other components. For this reason, the eruption of the volcano Eyjafjallajökull in Iceland in 2010 led to widespread disruption of air traffic over Europe and resulted in considerable economic losses. “Damage to the engines is primarily attributable to the deposition of melted ash on the vanes of the turbines,” says Professor Donald Dingwell, Director of the Department of Earth and Environmental Sciences at LMU. “And one of the grounds for the extensive closure of airspace in 2010 was that nothing was known about the melting behavior of volcanic ash under the conditions found inside jet engines.
” He and his research group have now investigated the issue, and shown that the chemical composition of the ash, which varies depending on its source, plays a crucial role in determining how much damage it can cause. Furthermore, the new study shows that the standard tests, which use sand or dust particles as proxies, do not reproduce the effects of volcanic ash on jet engines. On the basis of these results, the LMU team has developed a model which enables them to provide more realistic estimates of the risk to aviation posed by volcanic ash. Their findings appear online in the journal Nature Communications.
Temperatures in working jet engines range between 1200°C and 2000°C. Under such conditions, volcanic ash particles melt and the molten material is deposited on the hot surfaces of the turbines. This in turn can lead to clogging of fuel nozzles, cooling ducts and other engine parts. In addition, ash particles may penetrate the protective ceramic coatings on the turbines, compromising their performance as thermal barriers and exacerbating damage. “The only available data concerning the effects of airborne particles on turbines come from outdated tests based on the use of sand,” Dingwell points out. “However, in terms of its chemical composition, volcanic ash differs significantly from sand. Furthermore, ash varies widely in composition depending on which volcano it comes from.
Ash melts at lower temperatures than sand
The LMU researchers have therefore performed the first systematic analysis of the melting behavior of volcanic ash obtained from a variety of sources. They heated samples of ash from nine different volcanos at various rates up to a maximum temperature of 1650°C, thus simulating the range of temperatures found at different locations within commercial jet engines. Melting temperatures were found to depend strongly on the chemical composition of the ash: The higher the fraction of basic oxides in the sample, the lower the melting temperature. “With the aid of our data, we were able to develop an empirical model, which describes how the melting behavior of volcanic ash as a function of its chemical composition and the rate at which it is heated,” Dingwell explains. “We also confirmed earlier reports that ash generally melts at significantly lower temperatures than dust particles or sand—and consequently will be deposited at much higher rates on hot engine parts.” He and his colleagues are therefore convinced that tests based on the use of sand are unsuitable for assessing the effects of volcanic ash on turbines, because they severely underestimate the degree of damage that the latter particulates can cause.
“With this model, we provide the basis for more accurate estimation of the effects of the deposition of volcanic ash in turbine engines,” says Dingwell. The researchers now plan to broaden their database in order to extend the applicability of the model. They also intend to explore how jet engines can be rendered less susceptible to damage by volcanic ash – by developing deposition-resistant coatings for component surfaces.
Reference:
Wenjia Song et al. Volcanic ash melting under conditions relevant to ash turbine interactions, Nature Communications (2016). DOI: 10.1038/ncomms10795
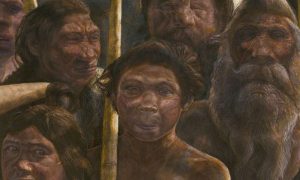
The Sima de los Huesos hominins lived approximately 400,000 years ago during the Middle Pleistocene. Credit: Kennis & Kennis, Madrid Scientific Films
Previous analyses of the hominins from Sima de los Huesos in 2013 showed that their maternally inherited mitochondrial DNA was distantly related to Denisovans, extinct relatives of Neandertals in Asia. This was unexpected since their skeletal remains carry Neandertal-derived features. Researchers of the Max Planck Institute for Evolutionary Anthropology in Leipzig, Germany, have since worked on sequencing nuclear DNA from fossils from the cave, a challenging task as the extremely old DNA is degraded to very short fragments. The results now show that the Sima de los Huesos hominins were indeed early Neandertals. Neandertals may have acquired different mitochondrial genomes later, perhaps as the result of gene flow from Africa.
Until now it has been unclear how the 28 400,000-year-old individuals found at the Sima de los Huesos (“pit of bones”) site in Northern Spain were related to Neandertals and Denisovans who lived until about 40,000 years ago. A previous report based on analyses of mitochondrial DNA from one of the specimens suggested a distant relationship to Denisovans, which is in contrast to other archaeological evidence, including morphological features that the Sima de los Huesos hominins shared with Neandertals.
“Sima de los Huesos is currently the only non-permafrost site that allow us to study DNA sequences from the Middle Pleistocene, the time period preceding 125,000 years ago”, says Matthias Meyer of the Max Planck Institute for Evolutionary Anthropology, lead author of an article that was published in Nature today. “The recovery of a small part of the nuclear genome from the Sima de los Huesos hominins is not just the result of our continuous efforts in pushing for more sensitive sample isolation and genome sequencing technologies”, Meyer adds. “This work would have been much more difficult without the special care that was taken during excavation.”
New techniques and precise work make the difference
“We have hoped for many years that advances in molecular analysis techniques would one day aid our investigation of this unique assembly of fossils”, explains Juan-Luis Arsuaga of the Complutense University in Madrid, Spain, who has led the excavations at Sima de los Huesos for three decades. “We have thus removed some of the specimens with clean instruments and left them embedded in clay to minimize alterations of the material that might take place after excavation.” The nuclear DNA sequences recovered from two specimens secured in this way show that they belong to the Neandertal evolutionary lineage and are more closely related to Neandertals than to Denisovans. This finding indicates that the population divergence between Denisovans and Neandertals had already occurred by 430,000 years ago when the Sima de los Huesos hominins lived.
According to Svante Pääbo of the Max Planck Institute for Evolutionary Anthropology “these results provide important anchor points in the timeline of human evolution. They are consistent with a rather early divergence of 550,000 to 750,000 years ago of the modern human lineage from archaic humans”.
Consistent with the previous study, the mitochondrial DNA of the Sima de los Huesos hominins is closer related to Denisovans than Neandertals. Mitochondrial DNA seen in Late Pleistocene Neandertals may thus have been acquired by them later in their history, perhaps as a result of gene flow from Africa. The researchers propose that retrieval of further mitochondrial and nuclear DNA from Middle Pleistocene fossils could help to clarify the evolutionary relationship between Middle and Late Pleistocene hominins in Eurasia.
Reference:
Matthias Meyer et al. Nuclear DNA sequences from the Middle Pleistocene Sima de los Huesos hominins, Nature (2016). DOI: 10.1038/nature17405
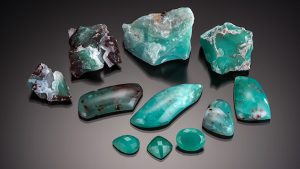
Figure 1. This bluish green chalcedony, colored by chromium and nickel, is marketed under the trade name “Aquaprase.” Credit: Kevin Schumacher.
A new type of chalcedony (figure 1) was recently submitted to GIA’s Carlsbad laboratory by Yianni Melas of Greece. According to Melas, this material originated in Africa (figure 2), although a more precise location has not been made available. The translucent material displayed a vibrant bluish green color and is currently marketed under the trade name “Aquaprase.” Although chalcedony varieties such as chrysoprase and Gem Silica are well known and occur in yellowish green and greenish blue colors, the color of this material was distinctly different from any African chalcedony examined by GIA to date.
From a gemological perspective, it was important to conclusively determine that this material was naturally colored and not artificially dyed. Since the quartz crystals present in this material were colorless rather than brown, we ruled irradiation out as a possible treatment. Microscopic examination of rough and cut stones in conjunction with chemical analysis and visible spectroscopy were used to characterize this chalcedony. Standard gemological testing revealed an RI range from 1.531 to 1.539, with no observable birefringence. The SG, measured hydrostatically, ranged from 2.55 to 2.57. A handheld spectroscope revealed faint, narrow lines in the red end of the spectrum, rather than the broadband absorption one would expect if the material had been dyed with an organic pigment. All of these features were consistent with natural-color chalcedony.
Microscopic examination revealed a granular aggregate structure with a few areas showing subtle banding and faint green concentrations of color between some of the coarser quartz grains, which appeared to be a greenish mineral phase located along the grain boundaries. A waxy luster was observed on fractured areas, consistent with an aggregate material. Some areas contained small cavities that were filled with colorless drusy quartz crystals (figure 3, left and center). Dark brown and black inclusions of various metal oxides were also observed scattered throughout most of the samples examined, along with some areas of whitish cloudy inclusions that were not identified (figure 3, right).
Raman analysis confirmed the material was quartz. EDXRF was used to analyze the trace-element metals that might be responsible for the bluish green color. All seven finished gemstones tested showed the presence of chromium and nickel. Interestingly, iron, vanadium, and copper were also detected in one of the cut samples, but these elements might not be related to the color, as other bluish green samples did not contain them. Visible spectroscopy (figure 4) revealed broad absorption bands centered at approximately 420 and 600 nm, with a large transmission window at approximately 500 nm producing the bluish green color. Sharp absorption peaks at 646, 676, and 679 nm were presumably related to chromium.
This new type of African chalcedony is easily recognized by its unique composition and absorption spectrum, which is significantly different from the chrysoprase and Gem Silica varieties. The attractive bluish green color of Aquaprase, which may be caused by chromium and nickel, should prove to be a popular and welcome addition to the gem trade.
Figure 2. A large piece of chalcedony rough recovered from the mining area. Photo by Yianni Melas.Figure 3. The Aquaprase samples contained minute pockets of colorless drusy quartz (left and center) and irregular brown and black metal oxide inclusions (right). Photomicrographs by Nathan Renfro; field of view 2.83 mm (left), 4.76 mm (center), and 4.62 mm (right).Figure 4. The visible spectrum for the Aquaprase (bluish green trace) showed two broad absorption bands at 420 and 600 nm in addition to sharper peaks at 646, 676, and 679 nm. This absorption pattern is clearly different from that of chrysoprase (yellowish green trace) and Gem Silica (greenish blue trace).
Reference:
Natural-Colored Chrome Chalcedony Identified Using Laser Ablation–Inductively Coupled Plasma–Mass Spectrometry (LA-ICP-MS). A report on the use of trace-element LA-ICP-MS analysis to determine the coloring agent (natural or artificial) of chrome chalcedony. Download PDF to view.
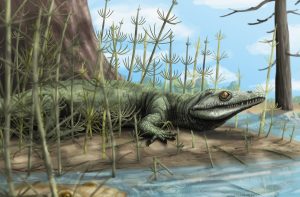
An international team of scientists, from three Brazilian universities and one UK university, have discovered a new fossil reptile that lived 250 million years ago in the state of Rio Grande do Sul, southernmost Brazil. The species has been identified from a mostly complete and well preserved fossil skull that the team has named Teyujagua paradoxa.
The fossil was discovered in the beginning of 2015 by a team from the Paleobiology Laboratory of the Universidade Federal do Pampa (Unipampa), in a Triassic rock exposure near the city of São Francisco de Assis. This discovery, published today in the journal Scientific Reports (Nature Publishing Group), helps to clarify the initial evolution of the group that gave rise to dinosaurs, pterosaurs (flying reptiles), crocodiles and birds.
The name Teyujagua comes from the language of the Guarani ethnic group and means ‘fierce lizard’. It references a mythological beast called Teyú Yaguá, usually depicted as a lizard with a dog´s head. Teyujagua is very different from other fossils from the same age. Its anatomy is intermediate between the more primitive reptiles and a diverse and important group called ‘archosauriforms’. Archosauriformes include all the extinct dinosaurs and pterosaurs, along with modern day birds and crocodiles.
The discovery of Teyujagua is important because it lived just after the great Permo-Triassic mass extinction event that occurred 252 million years ago. This extinction wiped out about 90 per cent of all species then living and was probably triggered by giant and intense volcanic eruptions in the eastern part of what is now Russia.
Teyujagua provides new insights into how ecosystems on land recovered and developed following this extinction. After the extinction, ecosystems on land were sparsely populated, providing opportunities for some groups of survivors to expand in number and diversity. Archosauriforms and their close kin like Teyujagua became the dominant animals in ecosystems on land and eventually gave rise to dinosaurs.
Teyujagua was a small, quadrupedal animal, and grew up to about 1.5 metres in length. Its teeth were recurved with fine serrations and sharply pointed, indicating a carnivorous diet. The nostrils were placed on the upper part of the snout, a typical feature of some aquatic or semi-aquatic animals, such as modern day crocodiles. Teyujagua likely lived in the margins of lakes and rivers, hunting amphibians and procolophonids, extinct, small bodied reptiles similar to lizards.
Dr Felipe Pinheiro, from Universidade Federal do Pampa, São Gabriel, Rio Grande do Sul said: ‘The discovery of Teyujagua was really exciting. Ever since we saw that beautiful skull for the first time in the field, still mostly covered by rock, we knew we had something extraordinary in our hands. Back in the lab, after slowly exposing the bones, the fossil exceeded our expectations. It had a combination of features never seen before, indicating the unique position of Teyujagua in the evolutionary tree of an important group of vertebrates.’
Dr Richard Butler, from the University of Birmingham’s School of Geography, Earth and Environmental Sciences, said: ‘Teyujagua is a really important discovery because it helps us understand the origins of a group of vertebrates called archosauriforms. Archosauriforms are spectacularly diverse and include everything from hummingbirds and crocodiles to giant dinosaurs like Tyrannosaurus rex and Brachiosaurus. Teyujagua fills an evolutionary gap between archosauriforms and more primitive reptiles and helps us understand how the archosauriform skull first evolved.’
Excavations in the site where Teyujagua was found are still ongoing, with more promising fossil materials being found. These new discoveries will certainly provide new insights into the nature of terrestrial ecosystems just before the appearance of the first dinosaurs, as well as the patterns of faunal recovery after major extinction events.
Reference:
Felipe L. Pinheiro, Marco A. G. França, Marcel B. Lacerda, Richard J. Butler, Cesar L. Schultz. An exceptional fossil skull from South America and the origins of the archosauriform radiation. Scientific Reports, 2016; 6: 22817 DOI: 10.1038/srep22817
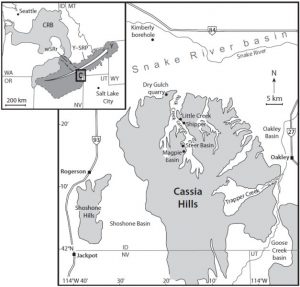
The Cassia Hills of southern Idaho preserve evidence of twelve catastrophic large-scale explosive eruptions. Credit: Knott et al.
Ancient super-eruptions west of Yellowstone, USA, were investigated by an international initiative to examine the frequency of massive volcanic events. Yellowstone famously erupted cataclysmically in recent times, but these were just the latest of a longer succession of huge explosive eruptions that burned a track from Oregon eastward toward Yellowstone during the past 16 million years.
The Cassia Hills of southern Idaho preserve evidence of twelve catastrophic large-scale explosive eruptions, which left widespread glassy deposits fused to the landscape. Each deposit preserves subtly distinctive magnetic, mineralogical, and chemical characteristics that allow them to be traced great distances.
Painstaking work by Thomas R. Knott and colleagues has revealed records of previously undiscovered large-scale eruptions, which caused Earth’s crust in the area to subside by more than three kilometers, leaving a deep volcanic basin along the Snake River Plain. These older volcanic eruptions were hotter and probably more frequent than the Yellowstone eruptions.
Reference:
Thomas R. Knott, Michael J. Branney, Marc K. Reichow, David R. Finn, Robert S. Coe, Michael Storey, Dan Barfod, Michael McCurry. Mid-Miocene record of large-scale Snake River−type explosive volcanism and associated subsidence on the Yellowstone hotspot track: The Cassia Formation of Idaho, USA. Geological Society of America Bulletin, 2016; B31324.1 DOI: 10.1130/B31324.1
A crystal or crystalline solid is a solid material whose constituents, such as atoms, molecules or ions, are arranged in a highly ordered microscopic structure, forming a crystal lattice that extends in all directions. In addition, macroscopic single crystals are usually identifiable by their geometrical shape, consisting of flat faces with specific, characteristic orientations.
The scientific study of crystals and crystal formation is known as crystallography. The process of crystal formation via mechanisms of crystal growth is called crystallization or solidification. The word crystal is derived from the Ancient Greek word κρύσταλλος (krustallos), meaning both “ice” and “rock crystal”, from κρύος (kruos), “icy cold, frost”.
Most minerals occur naturally as crystals. Every crystal has an orderly, internal pattern of atoms, with a distinctive way of locking new atoms into that pattern to repeat it again and again. The shape of the resulting crystaL-such as a cube (like salt) or a six-sided form (like a snowflake)-mirrors the internal arrangement of the atoms. As crystals grow, differences in temperature and chemical composition cause fascinating variations. But students will rarely find in their backyard the perfectly shaped mineral crystals that they see in a museum. This is because in order to readily show their geometric form and flat surfaces, crystals need ideal growing conditions and room to grow. When many different crystals grow near each other, they mesh together to form a conglomerated mass. This is the case with most rocks, such as granite mentioned above, which is made up of many tiny mineral crystals. The museum-quality specimens shown in the images here grew in roomy environments that allowed the geometric shapes to form uninhibited.
The internal arrangement of atoms determines all the minerals’ chemical and physical properties, including color. Light interacts with different atoms to create different colors. Many minerals are colorless in their pure state; however, impurities of the atomic structure cause color. Quartz, for example, is normally colorless, but occurs in a range of colors from pink to brown to the deep purple of amethyst, depending on the number and type of impurities in its structure. In its colorless state, quartz resembles ice. In fact, the root for crystal comes from the Greek word krystallos-ice-because the ancient Greeks believed clear quartz was ice frozen so hard it could not melt.
Scientists typically describe crystals as “growing,” even though they are not alive. In subterranean gardens, they branch and bristle as trillions of atoms connect in regular three-dimensional patterns. Each crystal starts small and grows as more atoms are added. Many grow from water rich in dissolved minerals, but they also grow from melted rock and even vapor. Under the influence of different temperatures and pressures, atoms combine in an amazing array of crystal shapes. It is this variety and perfection of form and symmetry that has long drawn scientists to the study of minerals. Symmetry is a regular, repeated pattern of component parts. Symmetry is everywhere in nature-the paired wings of a butterfly, the whorls and petals in a sunflower, the pattern of a snowflake, the legs of a spider-and minerals are no exception. In crystals, these repeated patterns occur within the basic atomic structure and reflect the pattern of faces of the crystal. You often can see the characteristic symmetry of a mineral crystal with the naked eye, but if the crystal is tiny, then you may need to look at it with a magnifying glass or microscope (as will be demonstrated in Lesson Plan 2). Recognizing symmetrical patterns in crystals may be difficult at first, but experience helps: the more specimens you look at, the more symmetry-and crystals-you will recognize. However, some specimens do not have well-formed crystals and are difficult even for experts to classify.
Crystal structure
Schematic of how atoms are arranged in crystalline, polycrystalline, and amorphous matter.
The scientific definition of a “crystal” is based on the microscopic arrangement of atoms inside it, called the crystal structure. A crystal is a solid where the atoms form a periodic arrangement.
Not all solids are crystals. For example, when liquid water starts freezing, the phase change begins with small ice crystals that grow until they fuse, forming a polycrystalline structure. In the final block of ice, each of the small crystals (called “crystallites” or “grains”) is a true crystal with a periodic arrangement of atoms, but the whole polycrystal does not have a periodic arrangement of atoms, because the periodic pattern is broken at the grain boundaries. Most macroscopic inorganic solids are polycrystalline, including almost all metals, ceramics, ice, rocks, etc. Solids that are neither crystalline nor polycrystalline, such as glass, are called amorphous solids, also called glassy, vitreous, or noncrystalline. These have no periodic order, even microscopically. There are distinct differences between crystalline solids and amorphous solids: most notably, the process of forming a glass does not release the latent heat of fusion, but forming a crystal does.
A crystal structure (an arrangement of atoms in a crystal) is characterized by its unit cell, a small imaginary box containing one or more atoms in a specific spatial arrangement. The unit cells are stacked in three-dimensional space to form the crystal.
The symmetry of a crystal is constrained by the requirement that the unit cells stack perfectly with no gaps. There are 219 possible crystal symmetries, called crystallographic space groups. These are grouped into 7 crystal systems, such as cubic crystal system (where the crystals may form cubes or rectangular boxes, such as halite shown at right) or hexagonal crystal system (where the crystals may form hexagons, such as ordinary water ice).
Crystal faces and shapes
Crystals are commonly recognized by their shape, consisting of flat faces with sharp angles. These shape characteristics are not necessary for a crystal—a crystal is scientifically defined by its microscopic atomic arrangement, not its macroscopic shape—but the characteristic macroscopic shape is often present and easy to see.
Euhedral crystals are those with obvious, well-formed flat faces. Anhedral crystals do not, usually because the crystal is one grain in a polycrystalline solid.
The flat faces (also called facets) of a euhedral crystal are oriented in a specific way relative to the underlying atomic arrangement of the crystal: They are planes of relatively low Miller index. This occurs because some surface orientations are more stable than others (lower surface energy). As a crystal grows, new atoms attach easily to the rougher and less stable parts of the surface, but less easily to the flat, stable surfaces. Therefore, the flat surfaces tend to grow larger and smoother, until the whole crystal surface consists of these plane surfaces. (See diagram on right.)
One of the oldest techniques in the science of crystallography consists of measuring the three-dimensional orientations of the faces of a crystal, and using them to infer the underlying crystal symmetry.
A crystal’s habit is its visible external shape. This is determined by the crystal structure (which restricts the possible facet orientations), the specific crystal chemistry and bonding (which may favor some facet types over others), and the conditions under which the crystal formed.
Occurrence in nature
Rocks
Calcite crystals inside a test of the cystoid Echinosphaerites aurantium (Middle Ordovician, Estonia). Credit: Mark A. Wilson
By volume and weight, the largest concentrations of crystals in the Earth are part of its solid bedrock. Crystals found in rocks typically range in size from a fraction of a millimetre to several centimetres across, although exceptionally large crystals are occasionally found. As of 1999, the world’s largest known naturally occurring crystal is a crystal of beryl from Malakialina, Madagascar, 18 m (59 ft) long and 3.5 m (11 ft) in diameter, and weighing 380,000 kg (840,000 lb).
Some crystals have formed by magmatic and metamorphic processes, giving origin to large masses of crystalline rock. The vast majority of igneous rocks are formed from molten magma and the degree of crystallization depends primarily on the conditions under which they solidified. Such rocks as granite, which have cooled very slowly and under great pressures, have completely crystallized; but many kinds of lava were poured out at the surface and cooled very rapidly, and in this latter group a small amount of amorphous or glassy matter is common. Other crystalline rocks, the metamorphic rocks such as marbles, mica-schists and quartzites, are recrystallized. This means that they were at first fragmental rocks like limestone, shale and sandstone and have never been in a molten condition nor entirely in solution, but the high temperature and pressure conditions of metamorphism have acted on them by erasing their original structures and inducing recrystallization in the solid state.
Other rock crystals have formed out of precipitation from fluids, commonly water, to form druses or quartz veins. The evaporites such as halite, gypsum and some limestones have been deposited from aqueous solution, mostly owing to evaporation in arid climates.
Snow flakes Credit: Wilson Bentley
Ice
Water-based ice in the form of snow, sea ice and glaciers is a very common manifestation of crystalline or polycrystalline matter on Earth. A single snowflake is typically a single crystal, while an ice cube is a polycrystal.
Organigenic crystals
Many living organisms are able to produce crystals, for example calcite and aragonite in the case of most molluscs or hydroxylapatite in the case of vertebrates.
Crystallization
Crystallization is the process of forming a crystalline structure from a fluid or from materials dissolved in a fluid. (More rarely, crystals may be deposited directly from gas; see thin-film deposition and epitaxy.)
Crystallization is a complex and extensively-studied field, because depending on the conditions, a single fluid can solidify into many different possible forms. It can form a single crystal, perhaps with various possible phases, stoichiometries, impurities, defects, and habits. Or, it can form a polycrystal, with various possibilities for the size, arrangement, orientation, and phase of its grains. The final form of the solid is determined by the conditions under which the fluid is being solidified, such as the chemistry of the fluid, the ambient pressure, the temperature, and the speed with which all these parameters are changing.
Specific industrial techniques to produce large single crystals (called boules) include the Czochralski process and the Bridgman technique. Other less exotic methods of crystallization may be used, depending on the physical properties of the substance, including hydrothermal synthesis, sublimation, or simply solvent-based crystallization.
Large single crystals can be created by geological processes. For example, selenite crystals in excess of 10 meters are found in the Cave of the Crystals in Naica, Mexico. For more details on geological crystal formation, see above.
Crystals can also be formed by biological processes, see above. Conversely, some organisms have special techniques to prevent crystallization from occurring, such as antifreeze proteins.
Defects, impurities, and twinning
Twinned pyrite crystal group.
An ideal crystal has every atom in a perfect, exactly repeating pattern. However, in reality, most crystalline materials have a variety of crystallographic defects, places where the crystal’s pattern is interrupted. The types and structures of these defects may have a profound effect on the properties of the materials.
A few examples of crystallographic defects include vacancy defects (an empty space where an atom should fit), interstitial defects (an extra atom squeezed in where it does not fit), and dislocations (see figure at right). Dislocations are especially important in materials science, because they help determine the mechanical strength of materials.
Another common type of crystallographic defect is an impurity, meaning that the “wrong” type of atom is present in a crystal. For example, a perfect crystal of diamond would only contain carbon atoms, but a real crystal might perhaps contain a few boron atoms as well. These boron impurities change the diamond’s color to slightly blue. Likewise, the only difference between ruby and sapphire is the type of impurities present in a corundum crystal.
In semiconductors, a special type of impurity, called a dopant, drastically changes the crystal’s electrical properties. Semiconductor devices, such as transistors, are made possible largely by putting different semiconductor dopants into different places, in specific patterns.
Twinning is a phenomenon somewhere between a crystallographic defect and a grain boundary. Like a grain boundary, a twin boundary has different crystal orientations on its two sides. But unlike a grain boundary, the orientations are not random, but related in a specific, mirror-image way.
Mosaicity is a spread of crystal plane orientations. A mosaic crystal is supposed to consist of smaller crystalline units that are somewhat misaligned with respect to each other.
Quasicrystals
The material Holmium–Magnesium–Zinc (Ho–Mg–Zn) forms quasicrystals
A quasicrystal consists of arrays of atoms that are ordered but not strictly periodic. They have many attributes in common with ordinary crystals, such as displaying a discrete pattern in x-ray diffraction, and the ability to form shapes with smooth, flat faces.
Quasicrystals are most famous for their ability to show five-fold symmetry, which is impossible for an ordinary periodic crystal (see crystallographic restriction theorem).
The International Union of Crystallography has redefined the term “crystal” to include both ordinary periodic crystals and quasicrystals (“any solid having an essentially discrete diffraction diagram”).
Quasicrystals, first discovered in 1982, are quite rare in practice. Only about 100 solids are known to form quasicrystals, compared to about 400,000 periodic crystals measured to date. The 2011 Nobel Prize in Chemistry was awarded to Dan Shechtman for the discovery of quasicrystals.
Crystallography
Crystallography is the science of measuring the crystal structure (in other words, the atomic arrangement) of a crystal. One widely used crystallography technique is X-ray diffraction. Large numbers of known crystal structures are stored in crystallographic databases.
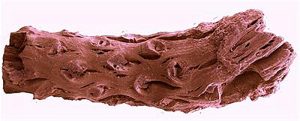
Scientists have found the oldest fossils of the familiar pine tree that dominates Northern Hemisphere forests today.
Scientists from the Department of Earth Sciences at Royal Holloway, University of London have found the oldest fossils of the familiar pine tree that dominates Northern Hemisphere forests today.
The 140-million-year-old fossils (dating from the Cretaceous ‘Age of the Dinosaurs’) are exquisitely preserved as charcoal, the result of burning in wildfires. The fossils suggest that pines co-evolved with fire at a time when oxygen levels in the atmosphere were much higher and forests were especially flammable.
Dr Howard Falcon-Lang from Royal Holloway, University of London) discovered the fossils in Nova Scotia, Canada. He said: “Pines are well adapted to fire today. The fossils show that wildfires raged through the earliest pine forests and probably shaped the evolution of this important tree.” Modern pines store flammable resin-rich deadwood on the tree making them prone to lethal fires. However, they also produce huge numbers of cones that will only germinate after a fire, ensuring a new cohort of trees is seeded after the fire has passed by.”
The research is published in the journal Geological Society of America.
Reference:
Howard J. Falcon-Lang, Viola Mages, Margaret Collinson. The oldestPinusand its preservation by fire. Geology, 2016; G37526.1 DOI: 10.1130/G37526.1
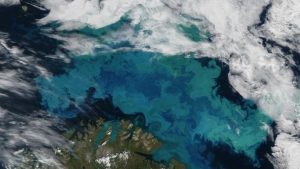
Satellite imagery captures a massive bloom of microscopic phytoplanktonexploding across the Barents Sea. Among the most abundant organisms in the sea, phytoplankton, scientists find, are able to biologically produce methanol — and in quantities that could rival or exceed that which is produced on land. Credit: Photo courtesy of NASA MODIS
As one of the most abundant organic compounds on the planet, methanol occurs naturally in the environment as plants release it as they grow and decompose. It is also found in the ocean, where it is a welcome food source for ravenous microbes that feast on it for energy and growth.
While scientists have long known methanol exists in the ocean, and that certain microbes love to snack on it, they’ve been stymied by one key question: where does it come from?
Researchers at the Woods Hole Oceanographic Institution (WHOI) have solved this mystery through the discovery of a massive — and previously unaccounted for — source of methanol in the ocean: phytoplankton.
The study found that these microscopic, plant-like organisms, which form the base of the marine food web, have a unique ability to biologically produce methanol in the ocean in quantities that could rival or exceed that which is produced on land. The results, published in the March 10, 2016, issue of PLOS ONE, challenge previous thinking on sources of methanol in the ocean, and help fill important knowledge gaps about ocean microbiology and the amount of methanol generated on our planet. The discovery may also spur research leading to biofuel applications in the future.
“Methanol can be considered a ‘baby sugar’ molecule and is rapidly consumed in the ocean by abundant bacteria — called methylotrophs — which specialize in this type of food,” said Dr. Tracy Mincer, WHOI associate scientist and lead author of the paper. “However, up until now, the thought was that methanol in the ocean came from an overflow of terrestrial methanol in the atmosphere. So, this discovery reveals a huge source of methanol that has gone completely unaccounted for in global methanol estimates.”
Mincer first became interested in the idea of biologically-produced methanol in the ocean through previous work where he found methanol-nibbling bacteria in a phytoplankton culture he was growing. Intrigued, he extracted the microbe’s DNA and its barcodes matched up with a well-known methylotroph in the ocean.
“Once we were able to characterize this bacteria, I wanted to explore the idea of plankton-produced methanol,” said Mincer. “I began reviewing literature and found a paper where a student, as part of his dissertation, had reported some measurements of methanol from phytoplankton. At that point, I knew something was really going on there. It was like a fist coming right out of the computer screen and punching me in the face.”
Growing pains
As Mincer set out to explore things further, he quickly learned that trying to measure methanol from marine phytoplankton wasn’t easy.
“I asked a number of colleagues how to measure methanol in seawater and no one had done it before,” said Mincer. “There didn’t appear to be any methods to directly measure it, so we had to develop our own.”
Given the high solubility of methanol, extracting samples proved challenging. Mincer and his lab team had to separate out methanol from the salts in seawater by bubbling helium through it to push the volatile organic compounds out. This made it possible to get the samples onto an instrument to be separated and detected. But then they discovered that, instead of producing methanol steadily over time, phytoplankton release it in quick episodic pulses, and only during certain stages of growth. So, they had to be there at the right time to see it.
“As we were growing the phytoplankton cultures, we measured like crazy during the first week and didn’t detect anything,” he said. “But after about ten days, they started to run out of nutrients and hit a plateau, which is when we saw that initial pulse of methanol.”
Strength in numbers
One of the most noteworthy aspects of the study, according to Mincer, was the amount of methanol plankton were able to produce. Based on lab measurements, he estimates that at least a million tons of the compound is produced in the world’s oceans each year — which could exceed the amount found in the atmosphere.
“In our cultures, we were surprised to see so much methanol being produced,” said Mincer. “The fact that the quantities in the ocean could rival or exceed levels on land indicates that the abundance of methylotrophic microbes — and the overall metabolic demand for methanol — is higher than previously thought.”
According to Dr. Brian Heikes, a professor and atmospheric chemist at the University of Rhode Island’s Graduate School of Oceanography, the findings help shore up previously hypothesized — but unquantified — oceanic sources of methanol.
“Up until now, in situ oceanic methanol sources have been speculative. This study is significant because it shows there is a system that can make and consume methanol biologically in the ocean in large quantities. That wasn’t fully appreciated before,” said Heikes.
Fast food of the ocean
While volumes may be high, methanol in seawater doesn’t hang around. Like burgers at a fast food joint, high production is quickly offset by fast consumption: most of the methanol is scavenged within a day or two. This, combined with its high solubility, makes the prospect of methanol escaping up into the atmosphere in significant quantities questionable.
But according to Mincer, methanol can head towards the ocean floor.
“We believe that when phytoplankton die and sink, they emit methanol,” he said. “This can fuel deeper populations of bacteria in the ocean, and helps answer the question of where methylotrophs in the deep ocean are getting the methanol from.”
Food source to fuel source
Methanol is a key food source that energizes ocean microbes, but could it be harvested from plankton to fuel other things? According to Mincer, there may be opportunities to turn the vast resource into biofuel.
“Like terrestrial plants, we believe phytoplankton produce methanol enzymatically, so if we can obtain the enzymes involved and use them to digest their biomass, we may be able to extract useful methanol from them. Methanol is a waste product of these organisms, and they can produce a good amount of it. So when those pulses come out, they could be taken advantage of and harvested from cultures.”
New questions
While the findings fill a number of important knowledge gaps, Mincer feels the study has opened up a new set of research questions that need to be addressed. In future work, he hopes to understand, for example, if methanol can tell us anything about phytoplankton growth patterns, what the “chemical currency” is in terms of what, if anything, microbes give back to the phytoplankton community, and what the velocity of the methanol consumption loop is in the ocean.
“Sometimes in research you have a finding that’s bigger than you or your lab can tackle,” he said. “If we can answer these questions, we will understand the whole relationship of microbiology in the oceans better and be able to treat this layer of life in the upper ocean like a layer of skin. We’ll know when it’s healthy, when it’s not, and how it functions. Understanding how our planet works at those fundamental levels is critically important.”
Reference:
Tracy J. Mincer, Athena C. Aicher. Methanol Production by a Broad Phylogenetic Array of Marine Phytoplankton. PLOS ONE, 2016; 11 (3): e0150820 DOI: 10.1371/journal.pone.0150820
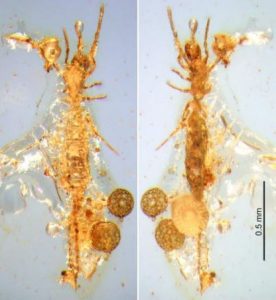
This is a photograph of Electrokoenenia yaksha. Credit: Copyright Michael S. Engel
It’s smaller than a grain of rice, yellowish, trapped in amber and lived 100 million years ago alongside dinosaurs. Meet Electrokoenenia yaksha, a newly described type of microwhip scorpion, or palpigrade, from Myanmar, whose minute fossilised remains have been found, trapped in Burmese amber. It has been described by an international team led by Michael S. Engel of the University of Kansas and the American Museum of Natural History in the US and Diying Huang of the Nanjing Institute of Geology and Palaeontology in the People’s Republic of China in Springer’s journal The Science of Nature.
Despite the name, the microwhip scorpion is only distantly related to true scorpions. Engel discovered a single example of Electrokoenenia yaksha while investigating the diversity of arthropods preserved in pieces of Burmese amber from the Hukawng Valley in northern Myanmar. These are kept in the Nanjing Institute of Geology and Paleontology of the Chinese Academy of Sciences.
Many of the finer details commonly used to compare fossilised remains with those of living microwhip scorpions are not visible in the sample. This is because it is contained in amber and it is obscured by microscopic fractures and debris.
Nonetheless, the researchers believe the sample to be that of a yellowish female of 1.47 millimetres long that lived some 100 million years ago during the Mesozoic period. It is the first microwhip scorpion fossil from this period to be found, and also the only one of its order known of to be contained in amber. The only other fossil record from this order is encased in limestone from the Onyx Marble Formation, and is therefore in geological terms between 94 and 97 million years younger than Electrokoenenia yaksha. Because it looks so similar to other microwhip scorpions still found today, it most probably shared the same habitat and preferences as its modern-day kin.
The fossilised microwhip scorpion’s name is partly derived from electrum, which means “amber.” The research team further acknowledged that the fossil was found resting in Burmese amber by naming it after “yaksha.” These nature spirits in South Asian mythology are said to have held stewardship over the wonders hidden in the earth.
It is hoped that similar examples might yet be discovered to further the study of these tiny, soft-bodied arthropods in more detail. Because of their minute size, they are easily overlooked, particularly if placed near other fossilised items, debris, or when situated among fissures in the material it is trapped in. In the case of Electrokoenenia yaksha, it was initially overlooked owing to its placement among a series of reflective fractures, and appeared to be a slightly darker, thick area. It was discovered upon more careful examination.
“Preservation in amber is perhaps the only medium through which such minute animals could be adequately characterized, their fine features and fragile forms too readily destroyed or rendered unidentifiable in sediments,” says Engel. He believes that further specimens might be discovered in amber deposits from India, the Dominican Republic, Lebanon, eastern North America and Archingeay in France.
Reference:
Michael S. Engel, Laura C. V. Breitkreuz, Chenyang Cai, Mabel Alvarado, Dany Azar, Diying Huang. The first Mesozoic microwhip scorpion (Palpigradi): a new genus and species in mid-Cretaceous amber from Myanmar. The Science of Nature, 2016; 103 (3-4) DOI: 10.1007/s00114-016-1345-4
Note: The above post is reprinted from materials provided by Springer.
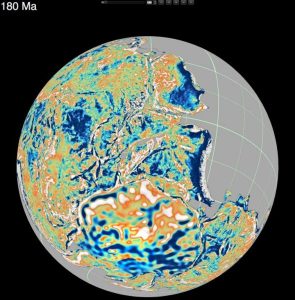
This is a reconstruction of the supercontinent Pangea 180 million years ago. The colors correspond to fluctuations in the continental gravity field, which reflect the deep continental structure such as roots of ancient mountain chains, basins and fold belts. These features are used to solve the puzzle of re-arranging all continents from today¹s positions to their ancient placement in Pangea. Credit: Professor Dietmar Müller
How did Madagascar once slot next to India? Where was Australia a billion years ago?
Cloud-based virtual globes developed by a team led by University of Sydney geologists mean anyone with a smartphone, laptop or computer can now visualise, with unprecedented speed and ease of use, how the Earth evolved geologically.
Reported today in PLOS ONE, the globes have been gradually made available since September 2014. Some show Earth as it is today while others allow reconstructions through ‘geological time’, harking back to the planet’s origins.
Uniquely, the portal allows an interactive exploration of supercontinents. It shows the breakup and dispersal of Pangea over the last 200 million years. It also offers a visualisation of the supercontinent Rodinia, which existed 1.1 billion years ago. Rodinia gradually fragmented, with some continents colliding again more than 500 million years later to form Gondwanaland.
“Concepts like continental drift, first hypothesised by Alfred Wegener more than a century ago, are now easily accessible to students and researchers around the world,” said University of Sydney Professor of Geophysics Dietmar Müller.
“The portal is being used in high schools to visualise features of the Earth and explain how it has evolved through time.”
The virtual globes includes visual depictions of a high-resolution global digital elevation model, the global gravity and magnetic field as well as seabed geology, making the amazing tapestry of deep ocean basins readily accessible.
The portal also portrays the dynamic nature of Earth’s surface topography through time. It visualises the effect of surface tectonic plates acting like giant wobble boards as they interact with slow convection processes in the hot, toffee-like mantle beneath Earth’s crust.
“When continents move over hot, buoyant swells of the mantle they bob up occasionally causing mountains,” said Professor Müller. “Conversely the Earth’s surface gets drawn down when approaching sinking huge masses of old, cold tectonic slabs sinking in the mantle, creating lowlands and depressions in the earth’s crust.”
Since its inception the portal has been visited more than 300,000 times from more than 200 countries and territories. Individual globes have featured in numerous media articles around the world. The seafloor geology globe is the most popular, viewed on average 500 times per day. The globe allows the viewer to explore how different types of deep-sea sediments vary between ocean basins, and at different latitudes and depths.
“These cloud-based globes offer many future opportunities for providing on-the-fly big data analytics, transforming the way big data can be visualised and analysed by end users,” said Professor Müller.
The interactive globes can be viewed on any browser at: portal.gplates.org
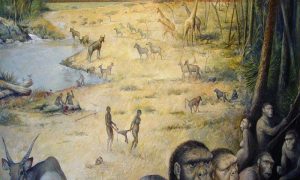
An artist’s rendition of an early human habitat in East Africa 1.8 million years ago. Credit: M.Lopez-Herrera via The Olduvai Paleoanthropology and Paleoecology Project and Enrique Baquedano.
Scientists have pieced together an early human habitat for the first time, and life was no picnic 1.8 million years ago.
Our human ancestors, who looked like a cross between apes and modern humans, had access to food, water and shady shelter at a site in Olduvai Gorge, Tanzania. They even had lots of stone tools with sharp edges, said Gail M. Ashley, a professor in the Rutgers Department of Earth and Planetary Sciences in the School of Arts and Sciences.
But “it was tough living,” she said. “It was a very stressful life because they were in continual competition with carnivores for their food.”
During years of work, Ashley and other researchers carefully reconstructed an early human landscape on a fine scale, using plant and other evidence collected at the sprawling site. Their pioneering work was published recently in the Proceedings of the National Academy of Sciences.
The landscape reconstruction will help paleoanthropologists develop ideas and models on what early humans were like, how they lived, how they got their food (especially protein), what they ate and drank and their behavior, Ashley said.
Famous paleoanthropologist Mary Leakey discovered the site in 1959 and uncovered thousands of animal bones and stone tools. Through exhaustive excavations in the last decade, Ashley, other scientists and students collected numerous soil samples and studied them via carbon isotope analysis.
The landscape, it turned out, had a freshwater spring, wetlands and woodland as well as grasslands.
“We were able to map out what the plants were on the landscape with respect to where the humans and their stone tools were found,” Ashley said. “That’s never been done before. Mapping was done by analyzing the soils in one geological bed, and in that bed there were bones of two different hominin species.”
The two species of hominins, or early humans, are Paranthropus boisei – robust and pretty small-brained – and Homo habilis, a lighter-boned species. Homo habilis had a bigger brain and was more in sync with our human evolutionary tree, according to Ashley.
Both species were about 4.5 to 5.5 feet tall, and their lifespan was likely about 30 to 40 years.
Through their research, the scientists learned that the shady woodland had palm and acacia trees. They don’t think the hominins camped there. But based on the high concentration of bones, the primates probably obtained carcasses elsewhere and ate the meat in the woods for safety, Ashley said.
In a surprising twist, a layer of volcanic ash covered the site’s surface, nicely preserving the bones and organic matter, said Ashley, who has conducted research in the area since 1994.
“Think about it as a Pompeii-like event where you had a volcanic eruption,” she said, noting that a volcano is about 10 miles from the site. The eruption “spewed out a lot of ash that completely blanketed the landscape.”
On the site, scientists found thousands of bones from animals such as giraffes, elephants and wildebeests, swift runners in the antelope family. The hominins may have killed the animals for their meat or scavenged leftover meat. Competing carnivores included lions, leopards and hyenas, which also posed a threat to hominin safety, according to Ashley.
Paleoanthropologists “have started to have some ideas about whether hominins were actively hunting animals for meat sources or whether they were perhaps scavenging leftover meat sources that had been killed by say a lion or a hyena,” she said.
“The subject of eating meat is an important question defining current research on hominins,” she said. “We know that the increase in the size of the brain, just the evolution of humans, is probably tied to more protein.”
The hominins’ food also may have included wetland ferns for protein and crustaceans, snails and slugs.
Scientists think the hominins likely used the site for a long time, perhaps tens or hundreds of years, Ashley said.
“We don’t think they were living there,” she said. “We think they were taking advantage of the freshwater source that was nearby.”
Reference:
Clayton R. Magill et al. Dietary options and behavior suggested by plant biomarker evidence in an early human habitat, Proceedings of the National Academy of Sciences (2016). DOI: 10.1073/pnas.1507055113
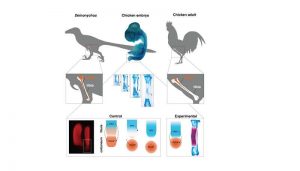
The fibula bone (orange) in Dinosaurs is as long as the tibia and reaches down to the ankle (upper left), whereas in adult birds, it is splinter-like and shorter than the tibia, missing its lower end (upper right). However, bird embryos actually start out like dinosaurs, and then develop their adult anatomy (centre). The transformation can be stopped by experimental inhibition of Indian Hedgehog (IHH), a bone maturation gene, which leads to a bird with a dinosaur-like fibula (lower right). Credit: Image courtesy of Universidad de Chile
Any one that has eaten roasted chicken can account for the presence in the drumstick (lower leg) of a long, spine-like bone. This is actually the fibula, one of the two long bones of the lower leg (the outer one). In dinosaurs, which are the ancestors of birds, this bone is tube-shaped and reaches all the way down to the ankle. However, in the evolution from dinosaurs to birds, it lost its lower end, and no longer connects to the ankle, being shorter than the other bone in the lower leg, the tibia. In the 19th century, scientists had already noted that bird embryos first develop a tubular, dinosaur-like fibula. Only afterwards, it becomes shorter than the tibia and acquires its adult, splinter-like shape.
Brazilian researcher Joâo Botelho, working at the lab of Alexander Vargas (University of Chile) decided to study the mechanisms that underlie this transformation. In normal bone development, the shaft matures and ceases growth (cell division) long before the ends do. Botelho found that molecular mechanisms of maturation were active very early at the lower end, ceasing cell division and growth. When a maturation gene called Indian Hedgehog was inhibited, this resulted in chickens that kept a tubular fibula as long as the tibia and connected to the ankle, just like a dinosaur.
Botelho and collaborators believe that early maturation at the lower end of the fibula occurs because of the influence of a nearby bone in the ankle, the calcaneum. Unlike other animals, the calcaneum in bird embryos presses against the lower end of the fibula: They are so close they have even been confused with a single element by some researchers. Botelho proposes that at this stage, the lower end of the fibula receives signals more like those at the bone shaft. In normal development, the calcaneum then becomes detached from the fibula. However, its distal end has already become committed to shaft-like development, and matures early. In the chickens with experimentally dinosaur-like lower legs, the calcaneum was still attached to the fibula. Botelho also confirmed the calcaneum strongly expresses PthrP, a gene that allows growth at the ends of bones.
Another interesting observation in the experimental chickens was that the other bone of the lower leg, the tibia, was significantly shorter. This suggests that a dinosaur-like fibula connected to the ankle stops the tibia from outgrowing the fibula, as it would normally do. Working with Jingmai O’Connor (IVPP, China), the research team realized this was consistent with an evolutionary pattern documented by the fossil record. The earliest forms to evolve reduced fibulas were toothed birds from the early cretaceous age, which lived alongside dinosaurs. These forms had splinter-like fibulas that did not connect to the ankle, but were almost as long as the tibia. The fibula first lost its lower end in evolution. This may have allowed the evolution of tibias that are much longer than the fibula, which occurred afterwards.
The results of the entire study have been published this week in the journal Evolution. This is the second time Botelho has achieved an experimental reversal to a dinosaur-like trait in birds. Previously, he had managed to undo the evolution of the perching toe of birds, to produce a non-twisted, non-opposed toe, as in dinosaursand another lab at Yale obtained a dinosaur-like snout by altering gene expression in embryonic chickens. However, these studies are not aimed to producing dinosaurs for commercial or non-scientific purposes, as in the “Jurassic Park” movie series.
“The experiments are focused on single traits, to test specific hypotheses” says Vargas. “Not only do we know a great deal about bird development, but also about the dinosaur-bird transition, which is well-documented by the fossil record. This leads naturally to hypotheses on the evolution of development, that can be explored in the lab.”
References:
João Francisco Botelho, Daniel Smith-Paredes, Sergio Soto-Acuña, Jorge Mpodozis, Verónica Palma, Alexander O. Vargas. Skeletal plasticity in response to embryonic muscular activity underlies the development and evolution of the perching digit of birds. Scientific Reports, 2015; 5: 9840 DOI: 10.1038/srep09840
João Francisco Botelho, Daniel Smith-Paredes, Sergio Soto-Acuña, Jingmai O’Connor, Verónica Palma, Alexander Vargas. Molecular development of fibular reduction in birds and its evolution from dinosaurs. Evolution, 2016; DOI: 10.1111/evo.12882
Note: The above post is reprinted from materials provided by Universidad de Chile.
The demise of ichthyosaurs has long been a mystery. Credit: Andrey Atuchin
Ichthyosaurs — shark-like marine reptiles from the time of dinosaurs — were driven to extinction by intense climate change and their own failure to evolve quickly enough, according to new research by an international team of scientists.
The study provides an explanation for one of the longest-standing enigmas in palaeobiology: how and why ichthyosaurs died out. Unlike other marine reptile groups, ichthyosaurs disappeared tens of millions of years before the end-Cretaceous extinction (65 million years ago) that marked the end for dinosaurs and the beginning of the age of mammals.
The research is published in the journal Nature Communications.
First author Dr Valentin Fischer, of the University of Liège, Belgium, and the University of Oxford, UK, said: ‘We analysed the extinction of this crucial marine group thoroughly for the first time. We compared the diversity of ichthyosaurs with the geological record of global change, emphasising the dynamics of these datasets.
‘Ichthyosaurs were actually well diversified during the last chapter of their reign, with several species, body shapes and ecological niches present. However, their evolution was much slower than earlier in their history. Additionally, they were seemingly negatively affected by the profound global changes going on during the Cretaceous, as their extinction rate correlates with environmental volatility.’
Causes of extinctions — including the demise of the ichthyosaurs, or ‘sea dragons’ — have often remained elusive and conjectural, particularly when they cannot be linked to an obvious geological or geochemical event such as a large meteorite or massive volcanic eruption. Ichthyosaurs were regarded as undiversified for a prolonged period before their extinction, and their dying out has previously been linked to minor events including increased competition with other marine predators and a decline in their assumed principal source of food.
However, using a battery of cutting-edge techniques to quantify ancient biodiversity and its fluctuations, the team was able to reconstruct the evolution of the ichthyosaurs during the last 120 million years of their lifetime and assess the causes of their extinction. The researchers — comprising Belgian, British, French and Russian scientists — demonstrated that before their extinction, ichthyosaurs were in fact highly diverse, both in terms of body shape and ecological role.
A two-phase event then suppressed their ecological diversity and wiped out the group at the beginning of the Late Cretaceous period, about 100 million years ago. At that time, the Earth’s poles were essentially ice-free, and sea levels were much higher than today. Analyses revealed that this two-phase extinction can be associated both with reduced evolutionary rates (a failure to evolve novel body plans for a prolonged period) and intense climate change (strong variations in sea surface temperatures and sea levels).
Dr Fischer added: ‘Although the rising temperatures and sea levels evidenced in rock records throughout the world may not directly have affected ichthyosaurs, related factors such as changes in food availability, migratory routes, competitors and birthing places are all potential drivers, probably occurring in conjunction to drive ichthyosaurs to extinction.’
This new work supports a growing body of evidence suggesting that a major, global, change-driven turnover profoundly reorganised marine ecosystems at the beginning of the Late Cretaceous, giving rise to the highly peculiar and geologically brief Late Cretaceous marine world. Ichthyosaurs disappeared in the course of this turnover, while numerous lineages of bony fishes and sharks evolved. The extinction of ichthyosaurs thus appears to be one aspect of a larger event — something the team is currently investigating.
Reference:
Valentin Fischer, Nathalie Bardet, Roger B. J. Benson, Maxim S. Arkhangelsky, Matt Friedman. Extinction of fish-shaped marine reptiles associated with reduced evolutionary rates and global environmental volatility. Nature Communications, 2016; 7: 10825 DOI: 10.1038/ncomms10825
This is an illustration of Carpolestes simpsoni, a stem primate species that lived in Wyoming at the end of the Paleocene epoch. Credit: Doug M. Boyer/Duke University Department of Evolutionary Anthropology
Fifty-six million years ago, just before earth’s carbon dioxide levels and average temperatures soared, many species of primitive primates went extinct in North America for reasons unclear to scientists. Now, a study of fossilized molars appears to exonerate one potential culprit in the animals’ demise: competition with primitive rodents for food.
In a study described in an advance online article in the American Journal of Physical Anthropology and conducted primarily by Kristen Prufrock, now a graduate student at the Johns Hopkins University School of Medicine, a team of paleontologists examined dental clues to the diets of so-called stem primates and rodents who plied North America at the end of the Paleocene epoch.
Other paleontologists had suggested many of the stem primates — which superficially resembled rodents but had some primate characteristics, such as long, grasping fingers — died off because rodents outcompeted them for their preferred foods. But when Prufrock, then studying at the University of Toronto Scarborough, and her colleagues took CT scans of 13 rodent and 181 stem primate jaws held in multiple museums, the shapes of their molars revealed that most of the primates ate different types of food than the rodents. The results, says Prufrock, call into doubt the idea that food competition with rodents killed off the primates.
Most of the jaw specimens were collected in Wyoming and Montana and were scanned with a micro CT scanner. Second mandibular molars used for grinding food were isolated using imaging software.
“We found that one genus of stem primates, Chiromyoides, lived at about the same time and had adapted to eat the same foods as primitive rodents, but the others either were adapted to eating different foods or lived at different times,” Prufrock says. “So competition from rodents was unlikely to have been the main reason for the decline of most of the stem primates. Something else must have been the driving force.”
Prufrock says the North American primate extinction drew her curiosity because of its broad evolutionary implications. “Many of these stem primate groups seem to have gone extinct at the same time, but some survived much longer,” she says. “Ultimately, we want to know what traits made those survivors special and what that tells us about the biology, physiology and adaptations of modern primates.”
Prufrock plans to continue the work she began in the laboratory of Mary Silcox, Ph.D., in Toronto to gather dental clues that shed light on how the ancient animals lived — and, ultimately, how and why they died off.
Doug M. Boyer of Duke University was also an author on the paper.
The study was supported by an NSERC Discovery Grant, the National Science Foundation (grant number BCS 1304045) and the Leakey Foundation.
Reference:
Kristen A. Prufrock, Doug M. Boyer, Mary T. Silcox. The first major primate extinction: An evaluation of paleoecological dynamics of North American stem primates using a homology free measure of tooth shape. American Journal of Physical Anthropology, 2016; 159 (4): 683 DOI: 10.1002/ajpa.22927
Figure 1 from Birch et al.: Changing ecology schematic of selected foraminiferal species for isotopic analysis across the Cretaceous-Paleogene (K-Pg) boundary.
The impact of an asteroid at the end of the Cretaceous caused mass extinctions in the oceans, as well as killing the dinosaurs on land. The carbon isotope difference between surface and seabed organisms (foraminifera) also collapsed due to these extinctions, suggesting that organic matter from surface waters did not reach the seafloor for up to 3 million years. However, seafloor organisms, which are dependent on food from surface waters, did not die off, suggesting some food must have reached the seabed.
In their open-access paper for Geology, Heather S. Birch and colleagues investigate this paradox by looking at carefully selected foraminiferal isotopes from a well-dated deep-sea core in the South Atlantic.
By taking into account the likely ecology of the foraminifera studied and whether any water mass changes were occurring at the time, they can better assess the carbon isotope record and transfer of organic matter to the seafloor. Birch and colleagues find that the flux of organic matter was reduced for a much shorter time (1.7 million instead of 3 million years). The authors note that ecology and water mass changes likely did have a small effect on the carbon isotope record, but they cannot explain the full reduction in carbon isotopes on their own.
Reference:
Partial collapse of the marine carbon pump after the Cretaceous-Paleogene boundary, Geology, DOI: 10.1130/G37581.1
Marine turtles experienced an evolutionary windfall thanks to a mass extinction of crocodyliforms around 145 million years ago, say researchers.
Crocodyliforms comprise modern crocodiles and alligators and their ancient ancestors, which were major predators that thrived on Earth millions of years ago. They evolved into a variety of species including smaller ones that lived on land through to mega-sized sea-swimming species that were up to 12 metres long. However, around 145 million years ago crocodyliforms, along with many other species, experienced a severe decline – an extinction event during a period between two epochs known as the Jurassic/Cretaceous boundary.
Now a PhD student and his colleagues from Imperial College London and University College London have carried out an extensive analysis of 200 species of crocodyliforms from a fossil database. One of the findings of the study is that the timing of the extinction coincided with the origin of modern marine turtles. The team suggest that the ecological pressure may have been lifted from early marine turtle ancestors due to the extinction of many marine crocodyliforms, which were one of their primary predators.
Jon Tennant, lead author of the study from the Department of Earth Science and Engineering at Imperial, said: “This major extinction of crocodyliforms was literally a case of out with the old and in with the new for many species. Marine turtles, the gentle, graceful creatures of the sea, may have been one of the major winners from this changing of the old guard. They began to thrive in oceans around the world when their ferocious arch-predators went into terminal decline.”
In the study, published today in the journal Proceedings of the Royal Society B, the researchers point to evidence in the records of a dramatic extinction of crocodyliforms during the Jurassic/Cretaceous boundary. Up to 80 per cent of species on land and in marine environments were wiped out. This decline was primarily due to a drop in sea levels, which led to a closing off of shallow marine environments such as lagoons and coastal swamps. These were the homes and primary hunting grounds for many crocodyliforms.
The decimation of many marine crocodyliforms may also have laid the way for their ecological replacement by other large predatory groups such as modern shark species and new types of plesiosaurs. Plesiosaurs were long-necked, fat-bodied and small-headed ocean-going creatures with fins, which later went extinct around 66 million years ago.
Other factors that contributed to the decline of marine crocodyliforms included a change in the chemistry of ocean water with increased sulphur toxicity and a depletion of oxygen.
While primitive crocodyliform species on land also suffered major declines, the remaining species diversified into new groups such as the now extinct notosuchians, which were much smaller in size at around 1.5 metres in length. Eusuchians also came to prominence after the extinction, which led to today’s crocodiles.
To carry out the study on crocodyliforms the team used the Paleobiology Database, which is a professionally curated digital archive of all known fossil records. The team analysed almost 1,200 crocodyliform fossil records.
Scientists have known since the early 1970s about the Jurassic/Cretaceous boundary extinction from fossil records. However, researchers have focussed on other extinction events and as a consequence less has been done to understand in detail the effects of Jurassic/Cretaceous boundary extinction on species like crocodyliforms.
The next steps will see the analysis extended to other groups including dinosaurs, amphibians and mammals to learn more about the effects of the Jurassic/Cretaceous boundary on their biodiversity.
Reference:
Environmental drivers of crocodyliform extinction across the Jurassic/Cretaceous transition, Proceedings of the Royal Society B: Biological Sciences, DOI: 10.1098/rspb.2015.2840