Home Blog Page 150

Satellites confirm sinking of San Francisco tower

Data from the Sentinel-1 satellites acquired between 22 February 2015 and 20 September 2016 show that Millennium Tower in San Francisco is sinking by about 40 mm a year in the ‘line of sight’ – the direction that the satellite is ‘looking’ at the building. This translates into a vertical subsidence of almost 50 mm a year, assuming no tilting. The coloured dots represent targets observed by the radar. The colour scale ranges from 40 mm a year away from radar (red) to 40 mm a year towards radar (blue). Green represents stable targets. Credit: Contains modified Copernicus Sentinel data (2015–16) / ESA SEOM INSARAP study / PPO.labs / Norut / NGU
Data from the Sentinel-1 satellites acquired between 22 February 2015 and 20 September 2016 show that Millennium Tower in San Francisco is sinking by about 40 mm a year in the ‘line of sight’ – the direction that the satellite is ‘looking’ at the building. This translates into a vertical subsidence of almost 50 mm a year, assuming no tilting. The coloured dots represent targets observed by the radar. The colour scale ranges from 40 mm a year away from radar (red) to 40 mm a year towards radar (blue). Green represents stable targets.
Credit: Contains modified Copernicus Sentinel data (2015–16) / ESA SEOM INSARAP study / PPO.labs / Norut / NGU

The Sentinel-1 satellites have shown that the Millennium Tower skyscraper in the centre of San Francisco is sinking by a few centimetres a year. Studying the city is helping scientists to improve the monitoring of urban ground movements, particularly for subsidence hotspots in Europe.

Completed in 2009, the 58-storey Millennium Tower has recently been showing signs of sinking and tilting. Although the cause has not been pinpointed, it is believed that the movements are connected to the supporting piles not firmly resting on bedrock.

To probe these subtle shifts, scientists combined multiple radar scans from the Copernicus Sentinel-1 twin satellites of the same area to detect subtle surface changes – down to millimetres. The technique works well with buildings because they better reflect the radar beam.

It is also useful for pinpointing displacement hotspots over large areas, thanks to Sentinel-1’s broad coverage and frequent visits.

Working with ESA, the team from Norut, PPO.labs and Geological Survey of Norway have also mapped other areas in the wider San Francisco Bay Area that are moving. These include buildings along the earthquake-prone Hayward Fault, as well as subsidence of the newly reclaimed land in the San Rafael Bay.

An uplift of the land was detected around the city of Pleasanton, possibly from the replenishment of groundwater following a four-year drought that ended in 2015.

European cities experience similar subsidence, and the San Francisco study is helping because it contains a multitude of features.

For example, the area around Oslo’s train station in Norway is reclaimed land. Newer buildings, such as the nearby opera house, have proper foundation into bedrock, but the older parts of the station experience severe subsidence.

“Experience and knowledge gained within the ESA’s Scientific Exploitation of Operational Missions programme give us strong confidence that Sentinel-1 will be a highly versatile and reliable platform for operational deformation monitoring in Norway, and worldwide,” noted John Dehls from the Geological Survey of Norway.

The studies of San Francisco and Oslo are paving the way for moving from targeted case studies to a nationwide or even continental-scale land deformation service.

“The Copernicus Sentinel-1 mission is, for the first time, making it possible to launch operational national deformation mapping services,” said Dag Anders Moldestad from the Norwegian Space Centre.

The open data policy and regular coverage plan of Copernicus promise cost-efficient and reliable services.

“In Norway, we have already initiated a framework project to provide nationwide basic deformation products to the public, with a free and open data policy. Many other countries in Europe are also working towards setting up similar services,” noted Dr Moldestad.

The Sentinel-1 twins provide ‘radar vision’ for Europe’s Copernicus environment monitoring programme. In addition to watching land movements, they feed numerous other services for monitoring Arctic sea ice, routine sea-ice mapping, surveillance of the marine environment, mapping for forest, water and soil management, and mapping to support humanitarian aid and crisis situations.

Note: The above post is reprinted from materials provided by European Space Agency.

‘Jurassic World’ comes alive at Philadelphia exhibit

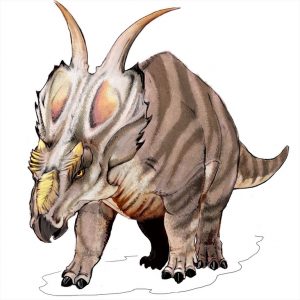
Photo, shows a pair of pachyrhinosaurus that move around as part of the “Jurassic World” exhibit opening Friday, Nov. 25, at the Franklin Institute in Philadelphia. Credit: AP Photo/Josh Cornfield
Photo, shows a pair of pachyrhinosaurus that move around as part of the “Jurassic World” exhibit opening Friday, Nov. 25, at the Franklin Institute in Philadelphia.
Credit: AP Photo/Josh Cornfield

Dinosaurs in museums tend to be of the fossilized variety, but a new exhibit in Philadelphia is bringing the creatures and their world to life.

“Jurassic World: The Exhibition” opens at the Franklin Institute on Friday. Based on the blockbuster dinosaur movie franchise, the experience mixes the vibe of a theme park with the backstory of science, but the big—like, really big—attraction is the animatronic dinosaurs, some measuring over 24 feet tall.

The traveling show made its world premiere in Melbourne, Australia, earlier this year, but Philadelphia’s U.S. debut offers some new features.

Here’s what visitors can expect at the exhibit, which runs through April 23:

DINOSAUR PETTING ZOO

Guests can meet a towering Brachiosaurus, come face-to-face with a Velociraptor and get up close and personal with a Tyrannosaurus rex. The lifelike, life-size dinosaurs were designed by The Creature Technology Co., which created the enormous creatures for the “Walking with Dinosaurs” arena shows. A family-friendly “Gentle Giants Petting Zoo” also promises interactions with a baby Pachyrhinosaurus and its 29-foot-long mother. Visitors can even “pet” a small dinosaur.

WHAT’S DIFFERENT FROM MELBOURNE?

The U.S. debut of the exhibit offers a look inside a raptor training paddock, like the one used by Chris Pratt’s character in 2015’s “Jurassic World.” It also includes an interactive raptor.

Tom Zaller, president of Imagine Exhibitions, said that the U.S. show also adds additional science-related content and interactive elements.

The exhibit is nearly double the size of the Australian version.

PRO PALEONTOLOGIST

Exhibit organizers worked closely with paleontologist Jack Horner, one of the best-known dinosaur researchers in the world, to help get the science right. Horner discovered the world’s first dinosaur embryos and found that dinosaurs had nests and cared for their young.

In his book “Jurassic Park,” Michael Crichton based the character Alan Grant on Horner. Steven Spielberg brought Horner on as a technical adviser on all of the “Jurassic Park” movies—and Horner did it without a college degree and with dyslexia.

FAKE CREATURES, REAL SCIENCE

The museum hopes to appeal to fans of science in addition to fans of the movie. An educator guide offers ways to look at the exhibit through scientific eyes on topics including: ethics in science; climate change; DNA and genetics; and extinction.

It also offers interactive exhibits. Brave visitors can even stick an arm into a pile of dinosaur dung to feel its squishy, warm interior as a way to learn about identifying animals by studying their leavings.

Note: The above post is reprinted from materials provided by The Associated Press.

Endangered Australasian marsupials are ancient survivors of climate change

In a new paper, published in Scientific Reports, an international team of researchers has analyzed fossils and DNA from living and recently extinct species to show that conservation sensitive Australasian marsupials are much older than previously thought. Credit: Ken Aplin
In a new paper, published in Scientific Reports, an international team of researchers has analyzed fossils and DNA from living and recently extinct species to show that conservation sensitive Australasian marsupials are much older than previously thought.
Credit: Ken Aplin

In a new paper, published in Scientific Reports, an international team of researchers has analysed fossils and DNA from living and recently extinct species to show that conservation sensitive Australasian marsupials are much older than previously thought.

“We used bandicoots as a model to examine the radiation of marsupials relative to climate change through time. Bandicoots are the marsupial equivalents of rodents and rabbits that today occupy a spectrum of desert through to rainforest habitats across Australia, New Guinea and surrounding islands. Alarmingly, however, most bandicoot species are under dire threat of extinction from introduced predators, habitat loss, and human hunting,” says Dr Benjamin Kear from the Museum of Evolution at Uppsala University, and lead author on the study.

Bandicoot fossils are important for understanding how Australia’s unique biodiversity has reacted to climate change in the past. They suggest that a shift towards drier conditions 5-10 million years ago drove ancient species into extinction, while simultaneously prompting the emergence of modern groups.

“The evolution of Australia’s mammals has long been linked to aridity. Yet this hypothesis is based upon only a few distinguishing features found in the teeth and skulls of modern species,” says Dr Ken Aplin of the Smithsonian National Museum of Natural History.

Dr Aplin recovered the remains of a remarkably archaic new fossil bandicoot, Lemdubuoryctes aruensis, from the Aru Islands of Eastern Indonesia.

The earliest bandicoot fossils are more than 25 million years old, but isolated teeth over 50 million years old hint at a deeper ancestry. In contrast, the first demonstrably modern bandicoots appeared less than 5 million years ago, while their most ancient relatives seemingly inhabited rainforests some 20 million years ago.

“The Aru Islands fossils are very primitive and resemble the most archaic extinct bandicoots, but amazingly are only 9,000 years old,” says Dr Kear.

Lemdubuoryctes also did not live in a primordial rainforest, but rather a vast savannah plain that stretched between Australia and New Guinea during the last glacial maximum.

“While retreating rainforests and spreading grasslands did provide a backdrop for ecosystem change 5-10 million years ago. The Australian fauna likely adapted via changing its distribution rather than undergoing wholesale extinction and replacement,” says Emeritus Prof. Michael Westerman from La Trobe University in Australia.

“This agrees with our results from DNA, which indicate that modern desert-living bandicoot groups pre-date the onset of aridity by as much as 40 million years,” says Prof. Westerman.

Pointedly, such timeframes coincide with increasing seasonality and the proliferation of open Eucalyptus woodlands in the Australian continental interior.

“Bandicoots, like other Australasian marsupials, probably occupied a range of different habitats over many millions of years. However, our study has further implications for future conservation. Arid zone bandicoots are amongst the most vulnerable mammals in Australasia today, with multiple species having gone extinct within the last 100 years. By demonstrating their profound evolutionary antiquity we can thus serve to highlight how extremely urgent it is to protect these living fossils as part of Australia’s unique biodiversity”, says Dr Kear.

Reference:
Benjamin P. Kear, Ken P. Aplin & Michael Westerman. Bandicoot fossils and DNA elucidate lineage antiquity amongst xeric-adapted Australasian marsupials. DOI:10.1038/srep37537

Note: The above post is reprinted from materials provided by Uppsala University.

Subduction zone geometry: Mega-earthquake risk indicator

When a subduction plate is flat (left), the rupture threshold is reached simultaneously over the whole zone, which can start mega-earthquakes. On the contrary, when the subduction plate is highly curved, the threshold is more heterogeneous, leading to more frequent, but more moderate, earthquakes. Credit: Quentin Bletery
When a subduction plate is flat (left), the rupture threshold is reached simultaneously over the whole zone, which can start mega-earthquakes. On the contrary, when the subduction plate is highly curved, the threshold is more heterogeneous, leading to more frequent, but more moderate, earthquakes.
Credit: Quentin Bletery

Mega-earthquakes (with a magnitude greater than 8.5) mainly occur on subduction faults where one tectonic plate passes under another. But the probability of such earthquakes does not appear to be even across these zones. In a study published on 25 November 2016 in the journal Science, researchers from the University of Oregon and Géoazur laboratory (CNRS/Université Nice Sophia Antipolis/Observatoire de la Côte d’Azur/IRD) show that mega-earthquakes mostly occur on the flattest subduction zones. Thus, the Philippines, Salomon Islands and Vanuatu areas would not be favorable to mega-earthquakes, unlike South America, Indonesia and Japan. The discovery of this new indicator should improve earthquake monitoring and seismic and tsunami risk prevention.

At the point where two tectonic plates converge, an area known as the subduction zone can form where one of the plates passes on top of the other. Rocks do not slide over one another easily and the movement of tectonic plates can be blocked along the entire length of such interaction zones for periods exceeding a thousand years. This ‘slip deficit’ results in an accumulation of energy, which is released abruptly during earthquakes.

A theory that held sway for many years suggested that mega-earthquakes mostly occurred in subduction zones where plates converged rapidly and those where the subducting plate was relatively young. However, the mega-earthquakes of Sumatra-Andaman in 2004 and Tohoku-Oki in 2011, which generated deadly tsunamis, go against this theory: in the first case, the speed of plate movement is relatively slow (3 to 4 cm per year) and in the second, the Pacific plate that subducts under Japan is more than 120 million years old. A new question therefore arose: can all subduction zones generate mega-earthquakes?

In this new study, the researchers examined another parameter: subduction zone geometry. By comparing the degree of curvature of the subducting plates in great historical earthquakes, they discovered that the maximum magnitude of earthquakes recorded in each subduction zone was inversely proportional to the degree of curvature of the fault. In other words, the flatter the contact between the two plates, the more likely it is that mega-earthquakes will occur.

Earthquakes take place once the energy accumulated as a result of the slip deficit exceeds a certain threshold. The researchers showed that the greater the curvature of the subduction fault, the more this threshold varies along the subduction zone. A heterogeneous threshold produces more frequent earthquakes, but these affect a smaller spatial area and are therefore of lower magnitude. In contrast, a homogeneous rupture threshold over a large portion of a fault has a greater chance of resulting in a simultaneous rupture of the whole blocked zone and, consequently, a greater chance of generating a mega-earthquake.

As a consequence, subduction zones such as the Philippines, Salomon Islands or Vanuatu do not appear likely to generate mega-earthquakes. Others, however, such as Peru, Java or Mexico, which have not seen very large earthquakes over the last 200-300 years, appear to have all the necessary characteristics for a mega-earthquake in the future.

Reference:
Q. Bletery, A. M. Thomas, A. W. Rempel, L. Karlstrom, A. Sladen, L. De Barros. Mega-earthquakes rupture flat megathrusts. Science, 2016; 354 (6315): 1027 DOI: 10.1126/science.aag0482

Note: The above post is reprinted from materials provided by CNRS (Délégation Paris Michel-Ange).

Fault curvature may control where big earthquakes occur

The Cascadia fault, which last experienced a mega-quake in 1700, lies along a flat region where mega-quakes can occur. Credit: USGS
The Cascadia fault, which last experienced a mega-quake in 1700, lies along a flat region where mega-quakes can occur.
Credit: USGS

Major earthquakes — magnitude 8.5 and stronger — occur where faults are mostly flat, say University of Oregon and French geologists. Curvier faults, they report in the journal Science, are less likely to experience earthquakes exceeding that strength.

Large earthquakes, known as mega-quakes, were long thought to be possible only at the boundary between fast converging, young tectonic plates until two giant earthquakes — the magnitude 9.4 quake in Indonesia in 2004 and the 9.0 quake in Japan in 2011 — disconfirmed the theory.

Since then giant earthquakes have been thought to be possible on any large fault. In the new paper UO researchers show that the maximum size of earthquakes may be controlled by another parameter: the fault curvature.

“The way people in the science community think about earthquakes is that some fault areas resist failure more than others, and when they break they generate large earthquakes,” said lead author Quentin Bletery, a postdoctoral researcher at the UO. “The reason they resist failure longer is often debated. I thought variations in fault geometry could be responsible, so I looked for changes in the slope of the major subduction faults of the world.”

Bletery had arrived at the UO with the idea that geometry could provide clues, based on his doctoral work at the Universite Nice — Sophia Antipolis. He developed a mechanical model to study his theory in collaboration with UO co-authors Amanda Thomas, Alan Rempel and Leif Karlstrom, all in the Department of Earth Sciences.

For the National Science Foundation-supported research, Bletery examined the geometry of subduction faults around the world to find the slope gradients, not the steepness of dipping itself, but its variations.

“I calculated the gradient of the slope (or curvature) curvature along the main faults and compared it with the distribution of very large earthquakes that happened in the past,” he said. “What I found is the opposite of what I expected: Very large earthquakes occur on fault areas where the slope is the most regular, or flat.”

The Cascadia fault, which last experienced a mega-quake in 1700, lies along such a flat region, Rempel and Thomas said.

“Earthquakes like the one that happened in Sumatra are mind-bogglingly large,” Thomas said. “The rupture was 1,600 kilometers (994 miles) long. When Cascadia goes, it could be 1,000 kilometers (621 miles) if it ruptures completely.”

A key aspect is that rupture thresholds are more heterogeneous along curved faults, therefore ruptures distances are restricted by portions of curvy sections that are not ready to fail. The rupture threshold is more homogeneous along flat faults, allowing larger fault areas to rupture simultaneously, the researchers said.

“The correlation of the curvatures to mega-quakes is strong,” Thomas said. “The data don’t lie.”

Based on the average curvature inside the giant earthquake rupture areas, the researchers concluded that the likelihood that mega-earthquakes are linked to fault curvatures is more than 99 percent.

The discovery is not expected to have direct impact on the ability of scientists to predict when an earthquake will occur, Thomas said.

“Instead, our findings backstop the idea that if you are at a location that hasn’t had evidence for large earthquakes in the past and your location is on a curvy plate, then maybe mega-quake will never happen,” Rempel said. “Not all subduction zones can have really large earthquakes is the implication of this study.”

That’s not to say a 7.5 quake can’t cause significant damage, Thomas said. “The next step in the research is asking why having a flat plate is more amenable to a large earthquake than a curvy plate,” she said. The information eventually, she said, could lead to improved hazard maps for earthquake-prone areas around the world.

Reference:
Q. Bletery, A. M. Thomas, A. W. Rempel, L. Karlstrom, A. Sladen, L. De Barros. Mega-earthquakes rupture flat megathrusts. Science, 2016; 354 (6315): 1027 DOI: 10.1126/science.aag0482

Note: The above post is reprinted from materials provided by University of Oregon.

To recover from next big quake, start today

The USGS recently discovered that the Hayward Fault and Rodgers Creek Fault connect under San Pablo Bay. Credit: samkinsley via Flickr)
The USGS recently discovered that the Hayward Fault and Rodgers Creek Fault connect under San Pablo Bay.
Credit: samkinsley via Flickr

Seismologists with the U.S. Geological Survey recently discovered that the Hayward Fault, considered the most dangerous fault in the San Francisco Bay Area, is connected to another—the Rodgers Creek Fault—under San Pablo Bay. If the two faults ruptured simultaneously, it could cause major devastation.

While most Bay Area residents know a big earthquake is predicted to strike the region in the next two or three decades, many are unprepared. Berkeley News spoke with Mary Comerio, an expert in disaster recovery and reconstruction and a professor in the College of Environmental Design at UC Berkeley, about what stops us from preparing and how to plan for the big quake.

Berkeley News: How prepared is California for the big earthquake?

Mary Comerio: We’re better in California than in most places because we had these little wakeup calls. In 1989 in the Bay Area, and Northridge in 1994 in Southern California—they got people’s attention. But really, it took until this last round of international events, all the earthquakes that started happening around 2008, 2010, in Japan, in New Zealand, Chile… in developed countries. And then people thought, “It could happen here.”

We’re probably as well-prepared here in the Bay Area as anyone in the world, but we still have a long way to go to deal with things like this.

We are going to have a major earthquake in an urban area at some point in the future. And when we do, we are going to have a whole lot of people with huge mortgages and no way to pay for the repairs. And that’s going to be a very serious public policy issue. We could see the kinds of foreclosures we saw in the 2008 financial crisis. And would there be a federal bailout of some kind? Who knows? It totally depends on the politics of the time.

What does it take to be prepared for a disaster?

I always say there are two parts to disaster preparedness. One is the physical stuff—making buildings and bridges stronger, that sort of thing. Then there’s the administrative stuff, which is thinking about what issues are going to come up in your situation, your business, your government agency, and then making a plan. Planning is cheap. All you have to do is sit around a table and think about it. Write it down. Rehearse it. It’s hard to get people to do that.

Why is it so hard to get people to plan?

There’s always something more politically pressing. The earthquake might happen tomorrow or it might happen in 25 years. Politicians are hoping it won’t happen on their watch. Why should they spend money on something that’s not going to get them brownie points with the electorate, whereas if they do a tax rebate or some other social program, it’s going to have a direct impact on voters?

The same goes for families. Should you brace your house’s foundation or get braces for your kid’s teeth? It’s why it’s so hard to get people to do long-range planning.

How can individuals prepare now to become more resilient?

Think about your situation and make a plan. Think about where you live, where you work, where your children are in school. What sort of risks might your family encounter? And how would you deal with that? How would you deal with it if one of your kids had their apartment building collapse? Or their dorm? Do you have hazardous conditions?

You don’t have to do everything all at once, but thinking about it—taking some time to step back and think about it and decide which things you can tackle—is important. At least you’re thinking about it.

What needs to change for people to sit down and actually make a plan?

Incorporating disaster recovery into larger planning and broader thinking—the things you do to make a place, a city, a country, a government, a state better. It can’t just function for something that might happen in 20 years; it actually needs to do some good now. So policies need to have social benefits in the present as well as reducing the risks over the long term.

And if you do that, you make recovery easier. You make it less problematic, less damage to begin with. That involves changing building codes and planning attitudes. You know, not letting people build in floodplains. It’s a very slow process, but if I look back 20 or 30 years, I see huge amounts of progress. But is it anywhere near where I’d like it to be? No. It’s like being on a crusade. I just keep trying to make it a little better.

What work is happening now in the field of disaster recovery?

The most exciting work is what’s coming out from recent Ph.D. students. They blend engineering modeling with city planning modeling about growth, and then being able to show how they can gain risk reduction through certain kinds of city policies or urban planning policies. We’re beginning to develop a more sophisticated and linked way of modeling that is helping to demonstrate the benefits of this kind of thinking and planning. And my students are getting jobs in major universities, which means they will be training the next generation.

Note: The above post is reprinted from materials provided by University of California – Berkeley.

Living fossil genome unveiled

The ginkgo tree's emblematic fan-shaped leaf preserved as a 49 million year old fossil with modern autumn leaf overlay. Credit: Fossil is from Klondike Mountain Formation, Republic, Ferry County, Washington, USA, Eocene, Ypresian. Stonerose Interpretive Center Collection, Modern leaf photo is by Ninjatacoshell, CC BY-SA via Wikimedia Commons
The ginkgo tree’s emblematic fan-shaped leaf preserved as a 49 million year old fossil with modern autumn leaf overlay. Credit: Fossil is from Klondike Mountain Formation, Republic, Ferry County, Washington, USA, Eocene, Ypresian. Stonerose Interpretive Center Collection, Modern leaf photo is by Ninjatacoshell, CC BY-SA via Wikimedia Commons

Published today in the open-access journal GigaScience, is an article that presents the genome sequence of Ginkgo biloba, the oldest extant tree species. The research was carried out by a team of scientists at BGI, Zheijiang University and the Chinese Academy of Sciences, who tackled and analyzed an exceptionally large genome, totalling more than 10 billion DNA “letters.” Ginkgo is considered a “living fossil,” meaning its form and structure have changed very little in the 270 million years since it first came into existence. Given its longevity as a species and unique position in the evolutionary tree of life, the ginkgo genome will provide an extensive resource for studies concerning plant defenses against insects and pathogens, and research investigating early events in tree evolution and in evolution overall.

To study the ginkgo’s extraordinary biology at a genetic and molecular level, sequencing its genome was high up on the wish list of plant biologists. However, because of its size as well as the presence of an enormous number of repeat sequences, assembling the whole genome sequence would be a difficult task. The ginkgo genome stretches over more than 10 Gb, which is 80 times larger than the “model plant” Arabidopsis thaliana genome. The tree’s genome is also larger than other plant species known for extremely big genomes, such as maize or orchids. The great interest in the history and biology of gingko, however, made the work of sequencing and assembling the genome a challenge the researchers from China felt worth taking, and one they succeeded in accomplishing.

Wenbin Chen from BGI explains some of the difficulties that they had to overcome: “A huge amount of raw data (~2 TB) was generated, and the computing capability for genome assembly was challenged by both the huge data and the remarkably high proportion of repetitive sequences. So an incredible amount of memory was required.” He went on to highlight several genome features: “The large genome of ginkgo may have resulted from whole genome duplication and insertion of a remarkably high proportion of repetitive sequences, at least 76.58%, and the longest introns among all sequenced species due to insertions of transposable elements.”

Meeting the sequencing challenge was worth it for a variety of reasons. One certainly relates to its status as a “living fossil,” at title shared by few other species, including the horseshoe crab and the nautilus. As the only surviving representative of a highly unusual group of non-flowering plants that appeared at least 270 million years ago, the ginkgo has retained traits over millions of years, such as the emblematic fan-shaped leaves, that are not seen in any other surviving plant species surviving. It further holds a very unique position in the plant evolutionary tree.

Professor Yunpeng Zhao, one of the authors from Zhejiang University, explains how this evolutionary placement is of great interest to researchers: “Ginkgo represents one of the five living groups of seed plants, and has no living relatives. Such a genome fills a major phylogenetic gap of land plants, and provides key genetic resources to address evolutionary questions like phylogenetic relationships of gymnosperm lineages, evolution of genome and genes in land plants, innovation of developmental traits, evolution of sex as well as history of demography and distribution, resistance and conservation of ginkgo.”

Researchers are also fascinated by the ginkgo’s resilience under adverse conditions — it is worth noting that ginkgo trees were one of the few living things to survive the blast of the atomic bombing of Hiroshima. This hardiness likely helped the ginkgo survive periods of glaciation in China that killed many other species, and may also promote the longevity of individual trees, some living up to several thousand years, according to reports. The ginkgo is also able to defend itself against a wide range of attackers, employing an arsenal of chemical weapons against insects, bacteria and fungi.

To better understand the ginkgo’s defensive systems, the authors analysed the repertoire of genes present in the genome that are known to play a role in fending off attackers. An initial analysis of the tree’s more than 40,000 predicted genes showed extensive expansion of gene families that provide for a variety of defensive mechanisms. Genes that enable resistance against pathogens are often duplicated. Additionally, ginkgo has a double-knockout punch in its fight against insects by synthesizing chemicals that directly fight insects and by releasing volatile organic compounds that specifically attract enemies of plant-eating insects. These findings indicated that having multiple mechanisms — the expansion of gene families, higher doses of specific genes, and versatility in its defence genes — might be linked to the ginkgo’s extraordinary resilience. This information may then be useful to aid in understanding plant defence system with an eye to improving food security.

Reference:
Rui Guan, Yunpeng Zhao, He Zhang, Guangyi Fan, Xin Liu, Wenbin Zhou, Chengcheng Shi, Jiahao Wang, Weiqing Liu, Xinming Liang, Yuanyuan Fu, Kailong Ma, Lijun Zhao, Fumin Zhang, Zuhong Lu, Simon Ming-Yuen Lee, Xun Xu, Jian Wang, Huanming Yang, Chengxin Fu, Song Ge, Wenbin Chen. Draft genome of the living fossil Ginkgo biloba. GigaScience, 2016; 5 (1) DOI: 10.1186/s13742-016-0154-1

Note: The above post is reprinted from materials provided by GigaScience.

Dino-killing crater shows clues about Ice Age sea level

 Scientists working on the crater left by an asteroid that killed the dinosaurs, found sea levels were much lower in the last Ice Age which ended about 11,000 years ago
Scientists working on the crater left by an asteroid that killed the dinosaurs, found sea levels were much lower in the last Ice Age which ended about 11,000 years ago

The massive underwater crater left by the asteroid that exterminated the dinosaurs has provided new evidence that sea levels were much lower during the last Ice Age, researchers said Wednesday.

Scientists worked on a platform off Mexico’s east coast to dig for clues about the destruction of life 66 million years ago inside the 200-kilometer (125-mile) wide Chicxulub crater.

By chance, the researchers found evidence that the sea was much further away than the current coast line during the last Ice Age, which began 110,000 years ago and ended around 11,000 years ago, said mission leader Jaime Urrutia, president of the Mexican Academy of Science.

While a large part of the crater is now under the Gulf of Mexico, it was not submerged during the Ice Age.

“We discovered a circular structure at the bottom (of the sea),” Urrutia told a news conference.

“The only way that (such structures) are made is through the dissolution of carbonate and for carbonate to dissolve it must be exposed to air,” he said.

This shows that the Yucatan peninsula was “literally much larger” between 18,000 and 23,000 years ago during the last Ice Age, the scientist said.

International geologists, paleontologists and microbiologists arrived on the Myrtle platform in the Gulf in April and worked there for two months, digging 1.5 kilometers (.93 mile) under the sea floor and extracting six tonnes of rock.

Some results of the studies have been published in the journal Science but the analysis continues at a laboratory in Bremen, Germany.

The 12-kilometer (7.4-mile) wide asteroid slammed the earth at a speed of 30 kilometers (18.6 miles) per second some 66 million years ago.

Its crater is unique on the planet because of its “peak ring” formation, a circular elevation as high as 500 meters with a 30-kilometer radius.

The platform was installed over one of the peaks to study the nature of the rocks below and how they took shape.

The scientists have yet to explain how the granite and molten rock petrified into peaks.

The first results show that the rocks moved up “like jelly,” but while the rock was molten, the granite does not show signs of heating, Urrutia said.

The $15 million Expedition 364 was the first to peer into the undersea part of the Chicxulub crater.

Note: The above post is reprinted from materials provided by AFP.

New study shows when Pine Island Glacier retreat began

Pine Island Glacier is nearly two thirds the size of the Uk or the size of Texas Credit: James Smith/ British Antarctic Survey
Pine Island Glacier is nearly two thirds the size of the Uk or the size of Texas
Credit: James Smith/ British Antarctic Survey

Reporting this week (Wednesday Nov. 23) in the journal Nature an international team led by British Antarctic Survey (BAS) explains that present-day thinning and retreat of Pine Island Glacier, one of the largest and fastest shrinking glaciers of the West Antarctic Ice Sheet, is part of a climate trend that was already underway as early as the 1940s.

It is already known that Pine Island Glacier—roughly two-thirds the size of the UK—has been thinning and retreating at an alarming rate since 1992 when satellite observations first started. The ice lost from this glacier and its neighbours, has added significantly to sea-level rise, and currently this area is one of biggest single unknowns in future projections. Until now, it was not known when the retreat of Pine Island Glacier started, or its underlying cause.

In this study, seabed sediment cores obtained from beneath the floating part of Pine Island Glacier have revealed that a cavity started to form beneath the shelf prior to the mid-1940s. This allowed warm sea water to flow under the shelf, and cause it to lift-off from a prominent sea-floor ridge which held it in place. This strongly suggests that current retreat was initiated by strong warming of the region associated with El Niño activity.

Lead author, marine geologist Dr James Smith from British Antarctic Survey, says:

‘We are very excited about this new finding as it provides the first direct evidence of the timing of glacier retreat even before we had satellites to measure them. The sediment cores were obtained through a 450-m deep hole in of ice, and up to 500 m of ocean. The sediment reveals climate events that initiated the current thinning of Pine Island Glacier. They show us how changes half-way across the planet in the tropical Pacific, reached through the ocean to influence the Antarctic ice sheet.

“Pine Island Glacier is one of the most inhospitable and remote areas of Antarctica, so to get all the equipment needed to hot-water drill through the ice shelf required a major effort from our collaborators at the US Antarctic Programme. On the ground it was real team effort to lower the drill by hand to the seabed on nearly 1000 m of rope. After all that work, the cores show us something so unexpected.”

Co-author and principal scientist Professor Bob Bindschadler of NASA says:

‘A significant implication of our findings is that once an ice sheet retreat is set in motion it can continue for decades, even if what started gets no worse. It is possible that the changes we see today on Pine Island Glacier were essentially set in motion in the 1940s’.

Professor David Vaughan, co-author and Director of Science at British Antarctic Survey, says:

“Ice loss from this part of West Antarctica is already making a very significant contribution to global sea level rise, and is actually one of the largest uncertainties in global sea-level predictions. Understanding what initiated the current changes is one major piece of the jigsaw, and now we are already looking for the next—how long will these changes continue and how much ice will Pine Island Glacier and its neighbours lose in the coming century? Data from the UK science programme iSTAR will tell us even more about Pine Island Glacier, but these are big questions that need the international science community to work together.”

Reference:
J. A. Smith et al, Sub-ice-shelf sediments record history of twentieth-century retreat of Pine Island Glacier, Nature (2016). DOI: 10.1038/nature20136

Note: The above post is reprinted from materials provided by British Antarctic Survey.

Crowdsourced data can help researchers study earthquakes

earthquake-seismograph.jpg

A new study on how people feel the effects of earthquakes illustrates the value that members of the public can add to the scientific research process.

Investigators used crowdsourced data from the Internet to investigate the areas of Italy where earthquakes are felt. The team found that intermediate-depth earthquakes in Greece can often be felt in Italy, much further from the epicentre than would normally be expected. But generally, the earthquakes are felt by people on the African side of the Africa-Eurasia plate boundary while most of the people on the European side of the plate boundary do not feel the earthquake.

“The findings indicate that plate boundaries are, in some cases, the boundaries of areas in which earthquakes are felt,” said Dr. Paola Sbarra, lead author of the Terra Nova study.

Reference:
Paola Sbarra et al, Role of African-Eurasian plate setting in the felt areas of intermediate-depth earthquakes: an investigation using crowdsourced data, Terra Nova (2016). DOI: 10.1111/ter.12245

Note: The above post is reprinted from materials provided by Wiley.

“Bahia Emerald” World’s Largest Emerald

The 180,000-carat Bahia Emerald has been the subject of a contentious court battle between a colorful crowd of gem traders, miners and a real estate tycoon all vying for the prized jewel -- once valued at $372 million. Credit: Los Angeles County Sheriff's Department
The 180,000-carat Bahia Emerald has been the subject of a contentious court battle between a colorful crowd of gem traders, miners and a real estate tycoon all vying for the prized jewel — once valued at $372 million.
Credit: Los Angeles County Sheriff’s Department

Weight: 341 kg
Carats: Containing more than 180,000 carats
Location: Mine in Bahia, Brazil
Date: 2001

The 341 kg Bahia Emerald is one of the largest pieces of rough emerald in the world and was unearthed from a mine in Bahia, Brazil, in 2001. It is a hunk of host rock composed of around nine crystals. One of the nine crystals of the Bahia Emerald is said to be among the largest single emerald crystals ever discovered. The value of the Bahia Emerald is estimated at an incredible $372 ~ 400 million.

It narrowly escaped flooding during Hurricane Katrina in 2005 during a period of storage in a warehouse in New Orleans. It was subsequently reported stolen in September 2008 from a secured vault in South El Monte in Los Angeles County, California. The stone has been valued at some $400 million, but the true value is unclear. At one point, the emerald was listed for sale on eBay for a “Buy It Now” price of $75 million.

It originally was mined in the beryl mines of north Bahia, Brazil, from which it takes its name. Bahia is an archaic form of Portuguese baía, meaning ‘bay’ after the bay first seen by European explorers in the 16th century.

After being moved from Brazil to the United States, various attempts were made to sell it without success. There were conflicting claims of ownership. Eventually the emerald was seized from a gem dealer in Las Vegas and taken into the custody of the Los Angeles Sheriff’s Department. After a series of legal actions, Judge John A. Kronstadt of the Los Angeles County Superior Court announced in September 2010 that he would hear the case.

Anthony Thomas, among the claimants, claimed to have original ownership of the gem including claimants who have paid more than $1.3 million for the emerald. A trial date was set for January 21, 2013, in the Los Angeles County Court. On January 29, 2014, Judge Kronstadt issued a ruling rejecting the claims of Anthony Thomas, leaving the determination of the remaining claimants for a future trial. Mr. Thomas subsequently filed bankruptcy to discharge the costs and attorney fees he incurred in his failed attempt to claim the Bahia Emerald as his own. Mr. Thomas’ appeal from the ruling against him was later dismissed because Thomas failed to pursue the appeal in a timely fashion.

After a trial on March 30, 2015 in the Los Angeles Superior Court, the Honorable Michael Johnson, the judge who succeeded Judge Kronstadt in the civil case, entered a final order on June 23, 2015 determining and ruling that FM Holdings, LLC was the bona fide purchaser of the Bahia Emerald and that title to the Bahia Emerald is now held solely and exclusively by FM Holdings, LLC by a series of agency relationships and lawful transactions. All other claimants to the Bahia Emerald have either been previously dismissed, e.g., Tony Thomas, or settled their claims leaving FM Holdings, LLC, as the sole and exclusive owner of the Bahia Emerald by Judge Johnson’s June 23, 2015 ruling.

On June 25, 2015, U.S. District Court Judge Colleen Kollar-Kotelly, on a request by the Department of Justice, issued a restraining order protecting the stone, arguing that it is subject to forfeiture in Brazil, where prosecutors in an upcoming criminal trial allege that two men knowingly received the stolen emerald and illegally smuggled it out of the country.

Photo

bahia-emerald-worlds-largest-3-geologypage

bahia-emerald-worlds-largest-2-geologypage
Source: Los Angeles Sheriffs Department/Reuters

bahia-emerald-worlds-largest-1-geologypage

bahia-emerald-worlds-largest-4-geologypage
From left, Scott Miller, Mark Gayman, and now retired Lt. Tom Grub, of the L.A. Sheriffs Department, in 2008. Source: Los Angeles Sheriffs Department


Reference:
Wikipedia: Bahia Emerald
Bloomberg:  The Long, Strange Saga of the 180,000-Carat Emerald
Telegraph: Judge to decide who owns £250 million Bahia emerald
CNN:  850-pound emerald at center of dispute

Keratin and melanosomes preserved in 130-million-year-old bird fossil

Eoconfuciusornis. Credit: Dr. Xiaoli Wang
Eoconfuciusornis.
Credit: Dr. Xiaoli Wang

New research from North Carolina State University, the Chinese Academy of Sciences and Linyi University has found evidence of original keratin and melanosome preservation in a 130-million-year-old Eoconfuciusornis specimen. The work extends the timeframe in which original molecules may preserve, and demonstrates the ability to distinguish between ancient microstructures in fossils.

Eoconfuciusornis, crow-sized primitive birds that lived in what is now China around 130 million years ago, are the earliest birds to have a keratinous beak and no teeth, like modern birds. Previous studies argued that the feathers of these and other ancient birds and dinosaurs preserved small, round structures interpreted to be melanosomes — pigment-containing organelles that, along with other pigments, give feathers their color. However, without additional evidence, it was not possible to prove that these structures weren’t just microbes that had coated the feather during decomposition and fossilization.

Yanhong Pan, associate research fellow at the Chinese Academy of Sciences and corresponding author of a paper describing the research and co-author Mary Schweitzer, NC State professor of biology with a joint appointment at the North Carolina Museum of Natural Sciences, examined feathers from an Eoconfuciusornis specimen taken from the Jehol Biota site in northern China, which is renowned for excellent fossil preservation.

“If these small bodies are melanosomes, they should be embedded in a keratinous matrix, since feathers contain beta-keratin,” Schweitzer says. “If we couldn’t find the keratin, then those structures could as easily be microbes, or a mix of microbes and melanosomes — in either case, predictions of dinosaur shading would not be accurate.”

Pan, Schweitzer and their team used both scanning and transmission electron microscopy to get microscopic details of the feather’s surface and its internal structure. They also utilized immunogold labeling — in which gold particles are attached to antibodies that bind to particular proteins in order to make them visible in electron microscopy — to show that filaments within the feathers were keratin.

Finally, they mapped copper and sulfur to these feathers at high resolution. Sulfur was broadly distributed, reflecting its presence in both keratin and melanin molecules in modern feathers. However copper, which is only found in modern melanosomes, and not part of keratin, was only observed in the fossil melanosomes. These findings both support the identity of the melanosomes and indicate that there was no mixing or leaching during decomposition and fossilization.

“This study is the first to demonstrate evidence for both keratin and melanosomes, using structural, chemical and molecular methods,” says Pan. “These methods have the potential to help us understand — on the molecular level — how and why feathers evolved in these lineages.”

Note: The above post is reprinted from materials provided by North Carolina State University.

Targeting mysteries of deep Earth

FSU Assistant Professor of Geology Mainak Mookherjee reports that water exists far deeper in the Earth than scientists previously thought. Credit: Bruce Palmer/Florida State University
FSU Assistant Professor of Geology Mainak Mookherjee reports that water exists far deeper in the Earth than scientists previously thought.
Credit: Bruce Palmer/Florida State University

A mineral far below Earth’s surface may hold the key to how much water is stored in the planet, a Florida State University researcher says.

In a paper published this week in the Proceedings of the National Academy of Sciences, FSU Assistant Professor of Geology Mainak Mookherjee reports that water exists far deeper in Earth than scientists previously thought.

Mookherjee and Andreas Hermann from the University of Edinburgh estimate that in the deep Earth — roughly 400 to 600 kilometers into the mantle — water is stored and transported through a high-pressure polymorph of the mineral brucite.

Previously, scientists thought brucite was not thermodynamically stable that deep in Earth. “This opens up a Pandora’s Box for us,” Mookherjee said.

“We didn’t think water could be stored by hydrous minerals such as brucite at these depths. But now that we know it’s there, we need to figure out how much water could be effectively stored inside it.”

Based on high-pressure experimental studies, scientists knew minerals that transported water — such as brucite — had limited stability and that these minerals decomposed in the deep Earth. As they decomposed, they released the water, which is recycled back to surface via volcanic activity.

But this discovery of a new high-pressure phase of brucite indicates that water could be efficiently transported to far deeper realms without decomposition.

“We had to do quantum-mechanical calculations on thousands of potential structures until we found the one we now reported,” Hermann said. “It really is remarkable that such a well-studied mineral as brucite has something so surprising to offer.”

Water plays a critical role in sustaining geological activity below Earth’s surface. Scientists have been working for years to quantify the oceans’ worth of water that lay hidden in the crust and mantle.

“For the activity of the planet, deep Earth water is equally important to water on the surface,” Mookherjee said. “My goal is to understand how much water is stored in the deep Earth. If the planet becomes dry on the inside, the planet dies because geodynamic activity within the planet ceases.”

Mookherjee said he and Hermann plan to follow up on this paper with additional simulations to better understand the physical properties of brucite at that depth and try to decipher the amount of water that is potentially stored in the deep Earth along the cold-subduction zones.

Reference:
Andreas Hermann and Mainak Mookherjee. High-pressure phase of brucite stable at Earth’s mantle transition zone and lower mantle conditions. PNAS, November 2016 DOI: 10.1073/pnas.1611571113

Note: The above post is reprinted from materials provided by Florida State University.

Scientists reconstruct formation of the southern Appalachians

The region in color denotes a shear zone where the continent of Gondwana slip atop proto-North America 300 million years ago. Credit: Fischer Lab/Brown University
The region in color denotes a shear zone where the continent of Gondwana slip atop proto-North America 300 million years ago.
Credit: Fischer Lab/Brown University

Around 300 million years ago, the landmass that is now North America collided with Gondwana, a supercontinent comprised of present-day Africa and South America. That clash of continents lifted tons of rock high above the surrounding terrain to form the southern end of the Appalachian Mountains now seen in Alabama, Tennessee and Georgia. A team of geophysicists has reconstructed the terminal phase of that collision and developed a new picture of how it unfolded.

The study, led by Brown University researchers, used seismic monitoring stations to create a sonogram-like image of the crust beneath the southern U.S., near of the southern base of the Appalachians. The research shows that Gondwana crust was thrust atop North America when the two continents collided, sliding northward as much as 300 kilometers before the two continents separated and drifted apart about 200 million years ago. The process revealed by the study looks a lot like the process that is building the Himalayas today, as the Eurasian continent is pushing atop the Indian subcontinent.

“We show that a continental collision that occurred 300 million years ago looks a lot like the collision we see in the Himalayas today,” said Karen Fischer, a professor in Brown’s Department of Earth, Environmental and Planetary Sciences and a co-author of the study. “This is the best-documented case I’m aware of in which the final suture between ancient continental crusts has a geometry similar to the present-day India-Eurasia crustal contact beneath the Himalayas.”

The research was led by Emily Hopper, who earned her doctorate from Brown in 2016 and is now a postdoctoral fellow at the Lamont-Doherty Earth Observatory of Columbia University. The study is published online in the journal Geology.

For the study, the research team placed 85 seismic monitoring stations across southern Georgia and parts of Florida, North Carolina and Tennessee. The researchers also used data from the Earthscope Transportable Array, a rolling array of seismic stations that made its way across the contiguous U.S. between 2005 and 2015. In all, 374 seismic stations recorded the faint vibrational waves from distant earthquakes as they traveled through the rocks beneath.

Acoustic energy from earthquakes can travel though the Earth as different types of waves, including shear waves, which oscillate perpendicular to the direction of propagation, and compressional waves, which oscillate in the same direction as they propagate. By analyzing the extent to which shear waves convert to compression waves when they hit a contrast in rock properties, the researchers could create a seismic image of the subsurface crust.

The study detected a thin continuous layer of rock that starts near the surface and slopes gently to the south to depths of approximately 20 kilometers, in which earthquake waves travel faster than in the surrounding rocks. That layer stretches southward about 300 kilometers from central Georgia to northern Florida. It spans about 360 kilometers east to west, from the central part of South Carolina, across all of Georgia and into eastern Alabama.

The mostly likely explanation for that anomalous layer, the researchers say, is that it’s a shear zone—the contact along which Gondwanan plate slid atop of the proto-North American plate.

“Where these two crustal blocks came into contact, there would have been tremendous deformation that aligned the mineral grains in the rocks and changed the propagation velocities of the seismic waves,” Fischer said. “So our preferred explanation for this continuous layer is that we’re seeing mineral alignment on the shear zone between these two plates.”

The presence of this widespread, gently sloped shear zone paints a new picture of the final stages of the collision between the two continents. Researchers had long thought that proto-North American and Gondwana collided on a shear zone with a much steeper slope, leading some to the view that the two plates slid laterally past each other. But such a steep shear zone would be in stark contrast to the 300 kilometers of nearly horizontal shear zone found in this new study.

The geometry of the contact detected in the study is similar to the process that is currently raising the Himalayas. In that collision, Fischer says, Eurasian crust has overtopped the Indian subcontinent by a distance similar to that found in the Appalachians. That process continues today, raising the Himalayas by 4 to 10 millimeters per year.

The similarity between the two events tells scientists that there’s consistency over time in the way mountains are built, Fischer says.

“When we think of mountain-building, the Himalayas are the archetype,” she said. “It’s interesting that a collision that took place 300 million years ago is very similar to one happening today.”

And that has implications for understanding the way the Earth’s crust has evolved.

“What that tells us is that the way the crust deforms—where it’s weak, where it’s strong and how it accommodates deformation—has been fairly uniform through time,” Fischer said. “The crust couldn’t have been much hotter; it couldn’t have been much colder; and it couldn’t have had a very different distribution of fluids, as all of these things influence the way the crust deforms.”

Reference:
Emily Hopper et al. Reconstructing the end of the Appalachian orogeny, Geology (2016). DOI: 10.1130/G38453.1

Note: The above post is reprinted from materials provided by Brown University.

Why there is increase in Oklahoma’s earthquakes

earthquake-seismograph-5

In 2015 alone, residents of Oklahoma felt the earth move beneath them a total of 907 times, as an unprecedented number of magnitude three or higher earthquakes racked the state. While Oklahoma has historically experienced its share of seismicity, in the last eight years the rate of earthquake occurrence in the state has increased by a factor of 43—approximately 4,000%. According to earthquake researchers, including civil and environmental engineering (CEE) Ph.D. student Pengyun Wang, wastewater injection and other fluid injection technologies have something to do with it.

Along with his advisors CEE Professor Mitchell Small and Assistant Professor Matteo Pozzi, and collaborator William Harbert, professor of Geology and Environmental Science at the University of Pittsburgh, Wang has spent the last two years investigating the dramatic increase in seismic activity in Oklahoma. And while it is difficult to draw causal relationships in earthquake research, the glut of seismic data in Oklahoma provides researchers a unique opportunity to study the link between seismic activity and fluid injection.

“Because the earthquake activity there has seen such a significant increase, the state has an impressive network of monitoring infrastructure,” Wang says. “They have installed a huge number of sensors across the state, and the database of the readings they collect is well-organized and open to the public.”

Fluid injection is the process by which wastewater, brine, or other fluids are shot through man-made openings in the earth deep into underground wells or reservoirs. Often, this is used as a disposal method for water used in hydraulic fracturing and other industrial processes that introduce chemicals into the water, which makes this water unsafe to reintroduce into the environment.

Based on the data gathered in Oklahoma, the researchers have come up with several mechanisms explaining how fluid injection might be causing an increase in seismic activity.

“The diffusion of the injected fluid can reach nearby, critically stressed fault lines, causing these faults to slip, leading to earthquakes,” Wang explains. “Additionally, if you have an underground reservoir sitting on or near a fault line, filling the reservoir with water increases its weight, putting undue strain on fault lines.”

Wang and his team have already published two papers on the subject in the Bulletin of the Seismological Society of America. The first, titled “Statistical method for early detection of changes in seismic rate associated with wastewater injections,” details research focused on detecting these earthquakes when they first start. The second, titled “A Bayesian approach for assessing seismic transitions associated with wastewater injections,” works to quantify the intensity of the seismicity over time. Their third study, which the team is currently conducting, takes these previous studies a step further by working to locate exactly where earthquakes are occurring and how they evolve over time.

Using this collected data, Wang has built a model that will ultimately be able to help regulators who supervise wastewater injection to make better decisions when considering where and when to inject and store wastewater. Using this model, regulators who are worried there might be an association between increased earthquake activity in their region and wastewater injection can evaluate their individual situations to reduce the risk of making the seismicity worse.

In the future, Wang hopes to develop this model further, to take past seismic trends and project them into the future by comparing seismic readings with injection data to potentially find correlations. In this way, the team’s research could be used to make recommendations for future injection plans.

“I hope this research will be useful in decision-making by revealing the past evolution of induced seismicity in the region,” Wang says. “If local residents of the area are experiencing the negative effects of increased seismicity and want to do something about it, without scientific evidence like this, these people might be powerless to argue against the owners of the wells. But if you can somehow give them evidence, I think it can improve overall awareness of the issue.”

Reference:

  1. Wang, P., Pozzi, M., Small, M., Harbert, W. (2015), Statistical Method for Early Detection of Changes in Seismic Rate Associated with Wastewater Injections. Bulletin of the Seismological Society of America. DOI: 10.1785/0120150038
  2. Wang, P., Small, M., Harbert, W., Pozzi, M. (2016), A Bayesian Approach for Assessing Seismic Transitions Associated with Wastewater Injections. DOI: 10.1785/0120150200

Note: The above post is reprinted from materials provided by Carnegie Mellon University, Department of Civil and Environmental Engineering.

Tsunami hits Japan after strong quake

A tidal surge is seen in Sunaoshi River after tsunami advisories were issued following an earthquake in Tagajo, Miyagi prefecture, Japan November 22, 2016, in this video grab image released by Miyagi Prefectural Police via Kyodo. Mandatory credit Miyagi Prefectural Police/Kyodo/via REUTERS

A powerful earthquake rocked northern Japan early on Tuesday, briefly disrupting cooling functions at a nuclear plant and generating a small tsunami that hit the same Fukushima region devastated by a 2011 quake, tsunami and nuclear disaster.

The magnitude 7.4 earthquake, which was felt in Tokyo, sent thousands of residents fleeing for higher ground as dawn broke along the northeastern coast.

There were no reports of deaths or serious injuries several hours after the quake hit at 5:59 a.m. (2059 GMT Monday). It was centered off the coast of Fukushima prefecture at a depth of about 10 kilometers (6 miles), the Japan Meteorological Agency (JMA) said.

A wave of up to 1.4 meters (4.5 ft) high was recorded at Sendai, about 70 km (45 miles) north of Fukushima, with smaller waves hitting ports elsewhere along the coast, public broadcaster NHK said.

Television footage showed ships moving out to sea from harbors as tsunami warnings wailed after alerts of waves of up to 3 meters (10 feet) were issued.

“We saw high waves but nothing that went over the tidal barriers,” a man in the city of Iwaki told NTV television network.

Aerial footage showed tsunami waves flowing up rivers in some areas, and some fishing boats were overturned in the port of Higashi-Matsushima.

The Pacific Tsunami Warning Center in Hawaii said the tsunami threat had now largely passed and the JMA later lifted its warnings.

The U.S. Geological Survey measured Tuesday’s quake at magnitude 6.9, down from an initial 7.3.

All Japan’s nuclear power plants on the coast threatened by the tsunami have been shut down in the wake of the March 2011 disaster, which knocked out cooling systems at Tokyo Electric Power Co’s Fukushima Daiichi nuclear plant, causing reactors to melt down and spew radiation into the air, soil and sea.

The cooling system for a storage pool for spent nuclear fuel at the reactor at its Fukushima Daini Plant was initially halted on Tuesday, said a spokeswoman for Tokyo Electric Power, known as Tepco, but was restarted soon after.

No other damage from the quake has been confirmed at any of its power plants, although there have been blackouts in some areas, the spokeswoman said.

Only two reactors are operating in Japan, both in the southwest. Even when in shutdown, nuclear plants need cooling systems operating to keep spent fuel cool.

Tohoku Electric Power Co said there was no damage to its Onagawa nuclear plant, while the Kyodo news agency reported there were no irregularities at the Tokai Daini nuclear plant in Ibaraki prefecture.

COAST EVACUATED

Japanese Minister for Disaster Management Jun Matsumoto told reporters about three hours after the quake that there had been no reports of significant injuries so far. One woman suffered cuts to her head from falling dishes, Kyodo news agency reported, citing fire department officials.

NHK showed footage of residents of Ishinomaki, a city badly hit in 2011, standing on a hill dressed in hats and heavy coats, staring down at the ocean.

Earthquakes are common in Japan, one of the world’s most seismically active areas. Japan accounts for about 20 percent of the world’s earthquakes of magnitude 6 or greater. (For a graphic, click: tmsnrt.rs/2fMm2pk)

The March 11, 2011, quake was magnitude 9, the strongest quake ever recorded in Japan. The massive tsunami it generated knocked out the Fukushima Daiichi plant, causing the worst nuclear crisis since Chernobyl a quarter of a century earlier.

Warning systems have been updated since the 2011 disaster to spread warnings more quickly to the affected population, said Tsunetaka Omine, head of the Disaster Management Division in Iwaki, a city in Fukushima prefecture.

Previously, warnings were broadcast on outdoor loudspeakers and by sending firefighters around communities, he said. Authorities now send tsunami warnings to every mobile phone in the area and broadcast on local radio.

Previously, there were also complicated directions on where to evacuate. “But now, we basically just tell people to head away from the sea, to the highest possible ground,” Omine said.

Nissan Motor Co said it would suspend work at its engine factory in Fukushima at least until the latest tsunami warning was lifted. A spokesman said there were no injuries or damage at the plant, which was badly damaged in the 2011 disaster.

Toyota Motor Corp said all its factories in northeastern Japan were operating as usual.

An Iwaki city fire department official said there was smoke or fire at Kureha’s research center in a petrochemical complex in Iwaki city minutes after the quake but it was extinguished soon after.

Japan’s famous Shinkansen bullet trains were halted along one stretch of track and some other train lines were also stopped.

Japanese financial markets were little affected, with Nikkei futures recovering after a brief fall and the yen up a touch against the U.S. dollar, although still near a five-month low hit earlier in the session.

Note: The above post is reprinted from materials provided by REUTERS. The original article was written by Yuka Obayashi and William Mallard .

“Teodora” World’s Largest Emerald is Fake !!

Regan Reaney, owner of the the world's largest emerald looks over the gem at the Western Star Auction House in Kelowna, British Columbia January 26, 2012. The 57,500 carat emerald, named "Teodora", which weighs 11.5 kg (25.35 lb) was mined in Brazil and cut in India. The stone will be publicly auctioned this weekend. REUTERS/Andy Clark (CANADA - Tags: SOCIETY TPX IMAGES OF THE DAY)
Regan Reaney, owner of the the world’s largest emerald looks over the gem at the Western Star Auction House in Kelowna, British Columbia January 26, 2012. The 57,500 carat emerald, named “Teodora”, which weighs 11.5 kg (25.35 lb) was mined in Brazil and cut in India. REUTERS/Andy Clark

The world’s largest cut emerald is set to go up for auction – and is expected to fetch $1.15million.

The 57,500-carat stone, which is the size of a watermelon, is scheduled to go under the hammer tomorrow by Western Star Auctions in British Columbia.

The gem, named Teodora, was found in Brazil and cut in India, before being sold to rare gems dealer Reagan Reaney in Calgary – but there are doubts over whether it is in fact a true emerald.

Real Emerald: “Bahia Emerald” World’s Largest Emerald

A BIG GREEN FAKE?

Emeralds are a green form of the mineral beryl, which is usually white. White beryl is so common that it’s worthless. But green beryl–emeralds–is rare and worth a lot of money. The darker the green, the more an emerald is likely to be worth.

As a result, many dishonest people dye white beryl green. Then they pass off their fakes as emeralds. Some gem experts say that Teodora is too big to be a real emerald. They think it must be white beryl that has been dyed.

Jeff Nechka, a gem expert in western Canada, was brought in to test Teodora to see if it’s real. “At first I was very skeptical,” says Nechka. “Anything this large occurring in nature is extremely rare.”

Nechka did find evidence that Teodora had been dyed. However, he says other factors—like its structure—show that it started off as a genuine green emerald. Someone simply dyed it a darker shade of green in an attempt to make it worth more. Nechka is the one who estimated that Teodora is worth $1.15 million, even with the dye job.

Both Nechka and Teodora’s current owner, Regan Reaney, say that it could be sold at auction for much more.

Shane McClure, director of GIA’s West Coast Identification Service, who cautions he hasn’t looked at the stone, says that, if there is any white beryl in the stone, GIA would likely term it “beryl with zones of emerald.”

But the presence of dye brings up further doubts.

“We probably would not call it emerald no matter what,” he says. “They seem to think there is indication of natural green coloration but we wouldn’t call it emerald in any case.”

Owner Of Emerald Arrested

Reaney’s arrest was as a result of fraud offenses, said RCMP Constable Kris Clark reported :

“The Kelowna RCMP became aware of his warrants through interaction with Reaney and made the arrest once Ontario agreed to return him to their jurisdiction. Reaney is known to police in Ontario, but is new to Kelowna and had no other dealings with the RCMP here.” Read the report by the Kelowna Daily Courier.


People hold the world's largest emerald at Western Star Auction House in Kelowna, British Columbia January 26, 2012. The 57,500 carat emerald, named "Teodora", which weighs 11.5 kg (25.35 lb) was mined in Brazil and cut in India. The stone will be publicly auctioned this weekend. REUTERS/Andy Clark
People hold the world’s largest emerald at Western Star Auction House in Kelowna, British Columbia January 26, 2012. The 57,500 carat emerald, named “Teodora”, which weighs 11.5 kg (25.35 lb) was mined in Brazil and cut in India.  REUTERS/Andy Clark
A security guard and local residents look at the world's largest emerald at Western Star Auction House in Kelowna, British Columbia January 26, 2012. The 57,500 carat emerald, named "Teodora", which weighs 11.5 kg (25.35 lb) was mined in Brazil and cut in India. The stone will be publicly auctioned this weekend. REUTERS/Andy Clark
A security guard and local residents look at the world’s largest emerald at Western Star Auction House in Kelowna, British Columbia January 26, 2012. The 57,500 carat emerald, named “Teodora”, which weighs 11.5 kg (25.35 lb) was mined in Brazil and cut in India.  REUTERS/Andy Clark
A worker polishes the world's largest emerald at Western Star Auction House in Kelowna, British Columbia January 26, 2012. The 57,500 carat emerald, named "Teodora", which weighs 11.5 kg (25.35 lb) was mined in Brazil and cut in India. The stone will be publicly auctioned this weekend. REUTERS/Andy Clark
A worker polishes the world’s largest emerald at Western Star Auction House in Kelowna, British Columbia January 26, 2012. The 57,500 carat emerald, named “Teodora”, which weighs 11.5 kg (25.35 lb) was mined in Brazil and cut in India.  REUTERS/Andy Clark
A visitor holds the world's largest emerald as security guards stand nearby at the Western Star Auction House in Kelowna, British Columbia January 26, 2012. The 57,500 carat emerald, named "Teodora", which weighs 11.5 kg (25.35 lb) was mined in Brazil and cut in India. The stone will be publicly auctioned this weekend. REUTERS/Andy ClarkREUTERS/Andy Clark
A visitor holds the world’s largest emerald as security guards stand nearby at the Western Star Auction House in Kelowna, British Columbia January 26, 2012. The 57,500 carat emerald, named “Teodora”, which weighs 11.5 kg (25.35 lb) was mined in Brazil and cut in India. REUTERS/Andy ClarkREUTERS/Andy Clark

Reference:
TheHuffingtonPost: Regan Reaney Arrested: Owner Of World’s Largest Emerald Held, Gem Unsold At Auction
Toronto Star Newspapers: Giant emerald unsold at Kelowna auction after co-owner arrested
Reed Exhibitions: “World’s Largest Emerald” May Not Be All Emerald
Scholastic Inc: The World’s Biggest Emerald?

Biggest, Deepest and Devastating Sinkholes around the World

Qattara Depression, Egypt

qattara-depression

The Qattara Depression is a depression in the north west of Egypt in the Matruh Governorate and is part of the Western Desert. It lies below sea level and is covered with salt pans, sand dunes and salt marshes.

The Qattara Depression contains the second lowest point in Africa at −133 metres (−436 ft) below sea level, the lowest being Lake Assal in Djibouti. The depression covers about 19,605 square kilometres (7,570 sq mi), a size comparable to Lake Ontario or twice as large as Lebanon. Due to its size and proximity to the Mediterranean Sea shore, it has been studied for its potential to generate hydroelectricity.

Umpherston Sinkhole, South Australia

umpherston-sinkhole

The Umpherston Sinkhole (or the Sunken Garden) is one of the most spectacular gardens located in the Mount Gambier region.

Umpherston sinkhole was once a typical limestone cave that formed by the corrosion of limestone rocks by seawater waves and the sinkhole was naturally created when the chamber’s roof collapsed.

Berezniki, Soviet Russia

Berezniki 1986
Berezniki 1986

Berezniki and Solikamsk, the second and third largest cities of the Perm Region, sit on abandoned and existing underground potash mines, some of those located as close as 200-300 meters from the surface.

The sinkhole in Berezniki, Soviet Russia began in 1986 as a result of a flooding event in a potash mine and has gradually worsened each passing year. At over 200m deep, 80m long and 40m wide, it is expected to swallow up the only rail line that leads to and from the potash mines, where 10% of the world’s potash used in fertilizer come from.

Guatemala City 2007

guatemala-city-2007

The 2007 Guatemala City sinkhole is a 100-metre deep sinkhole which formed in Guatemala City in 2007, due to sewage pipe ruptures. Its collapse caused the deaths of five people, and the evacuation of over a thousand.

The sinkhole was created by fluid from a sewer eroding uncemented volcanic ash, limestone, and other pyroclastic deposits underlying Guatemala City. The hazards around the pipe have since then been mitigated, by improved handling of the city’s wastewater and runoff,[3] and plans to develop on the site have been proposed.

Guatemala City 2010

guatemala-city-2010

The 2010 Guatemala City sinkhole was a disaster in which an area approximately 65 ft (20 m) across and 300 ft (90 m) deep collapsed in Guatemala City’s Zona 2, swallowing a three-story factory. The sinkhole occurred for a combination of reasons, including Tropical Storm Agatha, the Pacaya Volcano eruption, and leakage from sewer pipes.

Cerro Sarisariñama Sinkholes

cerro-sarisarinama-sinkholes

The most distinctive features of Cerro Sarisariñama are its gigantic sinkholes – four in total, with the largest one, called Sima Humboldt, is up to 352 metres wide and 314 metres deep. Down below Sima Humboldt expands to 502 meters wide. The other well known sinkhole Sima Martel is equally impressive at 248 meters deep. Both sinkholes are roughly circular and are located just 700 meters away from each other. The view of these gigantic holes from up the air is quite stunning.

The sinkholes were first discovered in 1961 by pilot Harry Gibson, but the first expedition could only be organized in 1974. The team, consisting of numerous explorers and specialists, descended into the sinkhole with ropes only to realize that getting out was not easy. The sinkhole widens as it goes down making the ropes hang freely.

Bimmah sinkhole, Oman

bimmah-sinkhole

Bimmah Sinkhole (Hawaiyat Najm) is located approximately, one and half hours away from the capital city of Muscat in the Sultanate of Oman. A lake of turquoise waters, 50m by 70 m wide, 20 – 30 m deep and 600m away from the sea, the sinkhole was formed by a collapse of the Earth’s upper crust layer due to erosion.

Devil’s Sinkhole, Texas, USA

Devil's Sinkhole bat cave at Devil's Sinkhole State Natural Area at Rockspring, Texas
Devil’s Sinkhole bat cave at Devil’s Sinkhole State Natural Area at Rockspring, Texas

The Devil’s Sinkhole is a vertical natural bat habitat. The 40 by 60 feet (12.2 m × 18.3 m) opening drops down to reveal a cavern some 400 feet (122 m) below. The cavern was first discovered by local residents in 1876. H. S. Barber carved his name inside the cave in 1889. The area was transferred to the state of Texas in 1985, and open to the public in 1992. Carved by water erosion, the cavern is home to several million Mexican free-tailed bats who emerge at sunset during April through October.

Boesmansgat, South Africa

Boesmansgat
Boesmansgat

Boesmansgat, also known in English as “Bushman’s Hole”, is believed to be the sixth-deepest submerged freshwater cave (or sinkhole) in the world, having been dived to 282.6 metres (927 ft). It is located in the Northern Cape province of South Africa.

Boesmansgat was believed to have first been explored by amateur diver Mike Rathbourne, in 1977. The greatest depth attained was by Nuno Gomes, in 1996. Its altitude of over 1,500 metres (4,921 ft) makes this a particularly challenging dive, requiring a decompression schedule equivalent for a dive to 339 metres (1,112 ft) feet at sea level. (Gomes’ dive was a close call, as he got stuck in the mud on the bottom of Bushman’s Hole for two minutes before escaping.)

On 24 November 2004, Verna van Schaik set the Guinness Woman’s World Record for the deepest dive with a dive to 221 metres (725 ft).

Agrico Gypsum Stack, Florida,USA

agrico-gypsum-stack

The most devastating sinkhole erosion in Florida occurred in 1994 when a 15-story sinkhole tore open right beneath an 80-million-ton pile of gypsum stack. The cave-in dumped 4 million to 6 million cubic feet of toxic and radioactive gypsum and waste water into the Floridian aquifer, which provides 90 percent of the state’s drinking water.

Daisetta, Texas sinkhole

daisetta-texas

On May 7, 2008, a 20-foot-wide sinkhole in Daisetta, Texas, began swallowing everything in its path and had expanded to 900 feet by the next day with a depth of 260 feet. The former oil town sits on the Hull Salt Dome, a four-mile-in-diameter geologic formation of compacted salt, and geologists speculate that years of storing saltwater waste — a byproduct of oil production — caused the massive pit.

Numby Numby, Australia

numby-numby

Numby Numby, also known as Nimby Nimby or Ngambingambi, is a sinkhole located 64 to 80 kilometres (40 to 50 mi) from Borroloola in the Northern Territory of Australia.

An underground hot spring feeds into the pit, keeping the water a steady 90 degrees Fahrenheit. The water reaches a depth of about 200 feet almost immediately, and the sinkhole’s shallow waters along its edge are occupied by large lilypads.

The Australian Aborigines believed that Numby Numby was home to evil spirits.

Schmalkalden, Germany

An aerial view of the sinkhole in Schmalkalden Photograph: Stefan Thomas/AFP/Getty Images
An aerial view of the sinkhole in Schmalkalden
Photograph: Stefan Thomas/AFP/Getty Images

A giant landslide under a residential street takes a car with it and leaves another car hanging over the edge in Schmalkalden, central Germany, on Nov. 1, 2010.

Xiaozhai Tiankeng, China

xiaozhai-tiankeng

The Xiaozhai Tiankeng, also known as the Heavenly Pit, is the world’s deepest sinkhole. It is located in Fengjie County of Chongqing Municipality.

The Xiaozhai Tiankeng is 626 metres long, 537 metres wide, and between 511 to 662 metres deep, with vertical walls. Its volume is 119,349,000 m³ and the area of its opening is 274,000 m². This material has been dissolved and carried away by the river. The sinkhole is a doubly nested structure—the upper bowl is 320 metres deep, the lower bowl is 342 metres deep, and the two bowls are on average 257 to 268 m across. Between both these steps is a sloping ledge, formed due to soil trapped in the limestone. In the rainy season, a waterfall can be seen at the mouth of the sinkhole.

Picher, Oklahoma sinkhole

picher-oklahoma-sinkhole

The EPA calls Picher, Okla., the “most toxic place in America,” and today the city is a modern a ghost town. Years of mining for lead and zinc has left the town full of sinkholes like this one. The roofs of some of the mines — unable to support the weight of the earth — collapsed, and now the former municipality is home to only giant chat piles and numerous massive sinkholes.

Cenote Ik Kil, Mexico

cenote-ik-kil

Cenote Ik Kil is a large sinkhole on Mexico’s Yucatan Peninsula that’s sacred to the Mayans. The peninsula’s unique composition of porous limestone has resulted in several of these water-filled sinkholes, but Cenote Ik Kil is one of its most famous.

The hole is 90 feet deep, adorned in tropical vegetation and filled with clear blue water that Mayan royalty used for both relaxation and ritual sacrifices.

El Zacatón sinkhole, Mexico

The Depthx robot is exploring the waters of El Zacaton, a thousand-foot the sinkhole _ or "cenote" _ in Mexico near the city of Tampico.Illustrates SINKHOLE (category a), by Ceci Connolly, special to The Washington Post. Moved Monday, May 14, 2007. (MUST CREDIT: Courtesy of University of Texas.) [PNG Merlin Archive]
The Depthx robot is exploring the waters of El Zacaton, a thousand-foot the sinkhole _ or “cenote” _ in Mexico near the city of Tampico.Illustrates SINKHOLE (category a), by Ceci Connolly, special to The Washington Post. Moved Monday, May 14, 2007. (MUST CREDIT: Courtesy of University of Texas.) [PNG Merlin Archive]
The El Zacatón sinkhole is the deepest water-filled sinkhole in the world. It was long considered to be bottomless, but in 1997 NASA solved the pit’s mystery when it sent an underwater robot into the waters and found the depth of El Zacatón to be 1,112 feet.

The clear, blue water is highly mineralized and has a sulphurous odor, and it’s quite warm — averaging 86 degrees Fahrenheit. The sinkhole’s name comes from the free-floating islands of zacate grass that blow across the lake in the wind.

Neversink Pit, USA

Photo: Peter Pham/flickr

Neversink Pit is a limestone sinkhole in Alabama, and it’s one of the most-photographed sinkholes in the world because of its beautiful fern-covered ledges and waterfalls. The hole is about 40 feet wide at the top, but it expands to 100 feet at its bottom, which is 162 feet from the ground. Neversink is home to bats and several rare and endangered fern species.

Great Blue Hole

Great Blue Hole, Coast of Belize - a phenomenon of Karst topography. Credit: U.S. Geological Survey (USGS)
Great Blue Hole, Coast of Belize – a phenomenon of Karst topography.
Credit: U.S. Geological Survey (USGS)

The Great Blue Hole is a giant submarine sinkhole off the coast of Belize. It lies near the center of Lighthouse Reef, a small atoll 70 km (43 mi) from the mainland and Belize City. The hole is circular in shape, over 300 m (984 ft) across and 124 m (407 ft) deep.

Dean’s Blue Hole

Dean’s Blue Hole 1

Dean’s Blue Hole is said to be the deepest blue hole in the world, and  the second largest underwater chamber. Experts at Reeldivers and  Vertical Blue, who have done dives at the site, report that: “It is enclosed on three sides by a natural rock amphitheatre, and on the fourth side by a turquoise lagoon and powder white beach. There is never any swell or waves inside the Hole, and visibility is usually between 50 – 100 feet (15 – 30m).”

Mississippi 2015

Credit: FOX
Credit: FOX

The parking lot at a Meridian, Mississippi, IHOP collapsed Saturday evening, causing 12 cars to tumble into the ground. The 15-foot-deep trench measured 35 feet wide by 400 feet long by the time it finished opening up. No one was injured in the accident.

St Albans 2015

Credit: Caters
Credit: Caters

A massive sinkhole has opened up on a street in St Albans, forcing the evacuation of several families from their homes in the night.

The 66ft (20m) diameter hole spread across a front garden and driveway on Fontmell Close and is 33ft (10m) deep.

Hertfordshire County Council said five homes were evacuated and 20 people were taken to a centre set up at the nearby Batchwood Sports Centre.

Residents are said to have heard a crash before the huge crater appeared.

Perm region, Russia

Credit: Uralkali Press Service/Odnoklassniki

This huge sinkhole in the Perm region of the Urals in Russia is getting bigger and bigger. The hole appeared when a potash mine collapsed at the end of 2014. It now measures 400ft by 410ft (122 metres by 125 metres) and is believed to be more than 246ft (75 metres deep).

Southwest China

Credit: Quirky China News / Rex Features

A huge 20-metre wide (66 ft) sinkhole formed overnight in the yard of a family home in Leshan, southwest China’s Sichuan Province in January 2011. Zhang Fengrong said he heard a loud roaring sound coming from outside. When he went to investigate he was stunned to discover the huge pit. He said he and several relatives had tried to measure the depth of the pit using a rope attached to a heavy iron, but after they used up the 40-metre long rope the iron still hadn’t hit ground.


Certain corals, with high genetic diversity, may adapt to climate change

Orbicella, a genus of reef-building corals, may be able to survive future climate change. Credit: Monica Medina, NMNH
Orbicella, a genus of reef-building corals, may be able to survive future climate change.
Credit: Monica Medina, NMNH

Half of all coral species in the Caribbean went extinct between 1 and 2 million years ago, probably due to drastic environmental changes. Which ones survived? Scientists working at the Smithsonian Tropical Research Institute (STRI) think one group of survivors, corals in the genus Orbicella, will continue to adapt to future climate changes because of their high genetic diversity.

“Having a lot of genetic variants is like buying a lot of lottery tickets,” said Carlos Prada, lead author of the study and Earl S. Tupper Post-doctoral Fellow at STRI. “We discovered that even small numbers of individuals in three different species of the reef-building coral genus Orbicella have quite a bit of genetic variation, and therefore, are likely to adapt to big changes in their environment.”

“The implications of these findings go beyond basic science,” said Monica Medina, research associate at STRI and the Smithsonian’s National Museum of Natural History and associate professor at Pennsylvania State University. “We can look forward to using similar approaches to predict demographic models to better manage the climate change threatened Orbicella reefs of today.”

To look back in time, the team of researchers working at the Smithsonian’s Bocas del Toro Research Station and Naos Molecular and Marine Laboratories collected fossils from ancient coral reefs and used high-resolution geologic dating methods to determine their ages. They compared the numbers of fossilized coral species at different time points. One of the best-represented groups in the fossil collections were species in the genus Orbicella. In addition to the fossil collections, they also used whole genome sequencing to estimate current and past numbers of several Orbicella species.

Within a single individual there are two copies of their genetic material, in some instances, one copy is different than the other and is called a genetic variant. The authors first assembled the full genomic sequence of an individual from Florida and then, using it as an anchor, reconstructed the genetic variation contained within single individuals. Depending on the amount of the genetic variation at certain intervals across the genome, the authors were able to recover the population sizes of each species at different times in the past.

Between 3.5 to 2.5 million years ago, numbers of all coral species increased in the Caribbean. But from 2 to 1.5 million years ago, a time when glaciers moved down to cover much of the northern hemisphere and sea surface temperatures plunged, the number of coral species in the Caribbean also took a nosedive. Sea levels fell, eliminating much of the original shallow, near-shore habitat.

“Apart from the species that exist today, all species of Orbicella that survived until 2 million years ago suddenly went extinct,” write the authors. When huge numbers of species die out, it makes room for other species to move in and for new species to develop to occupy the space the others held.

Two species that grow best in shallow water doubled in number at about the same time that their sister species and competitor, the organ pipe Orbicella (O. nancyi) disappeared.

When a species declines during an extinction event, it loses more and more genetic variation, and sometimes does not have much to work with during the recovery period. Scientists call this a genetic bottleneck. Orbicella was able to recover after the bottleneck. “It’s incredible how predictions from genetic data correlated so well with observations from the fossil and environmental record,” said Michael DeGiorgio (assistant professor of biology at Pennsylvania State University).

“We see hope in our results that Orbicella species survived a dramatic environmental variation event,” said Prada. “It is likely that surviving such difficult times made these coral populations more robust and able to persist under future climatic change.”

“The in-depth analysis of population size in a now ESA-threatened coral, as well as the release of its genome and that of its close relatives (which are also threatened) would be of great interest to coral reef researchers addressing conservation issues,” said Nancy Knowlton, senior scientist emeritus at STRI, currently at the National Museum of Natural History.

Reference:
Carlos Prada, Bishoy Hanna, Ann F. Budd, Cheryl M. Woodley, Jeremy Schmutz, Jane Grimwood, Roberto Iglesias-Prieto, John M. Pandolfi, Don Levitan, Kenneth G. Johnson, Nancy Knowlton, Hiroaki Kitano, Michael DeGiorgio, Mónica Medina. Empty Niches after Extinctions Increase Population Sizes of Modern Corals. Current Biology, 2016; DOI: 10.1016/j.cub.2016.09.039

Note: The above post is reprinted from materials provided by Smithsonian Tropical Research Institute.

Diaphragm much older than expected

Barrel-shaped trunk, short neck, paddle-like extremities: adaptations for an aquatic life. Credit: Mathew Wedel in Lambertz et al. (2016) Ann. N.Y. Acad. Sci./ The New York Academy of Sciences

“Evolution has brought up some weird animals, such as the caseids.” says Dr. Markus Lambertz, zoologist at the University of Bonn and the Museum Koenig. Caseids are “mammal-like” reptiles that lived about 300-250 million years ago. Especially the barrel-shaped trunk got Dr. Lambertz’ attention. How did these reptiles breathe? Exceptional joints impeded rib motility and allowed for only limited inhalation. Calculations revealed that the ventilatory system was not that effective, but still sufficient for a sedentary grazer. Everything appeared reasonable, because ever since the first description in 1910, it was assumed that these large herbivores were something like “cows” of the Paleozoic.

Sponge-like bones as in osteoporosis

Dr. Christen Shelton of the Steinmann-Institute for Geology, Mineralogy and Paleontology of the university, however, made an important discovery. “The structure of the bone totally surprised me. They were sponge-like as in elderly.” says the now in Cape Town working scientist. But also juvenile specimens revealed the same bone architecture. It was obvious: caseids were aquatic. Whales for instance show similarly “osteoporotic-like” bone. Dr. Lambertz adds: “Suddenly, the barrel-shaped trunk with the short neck made sense. The paddle-like extremities were used for swimming.” They were apparently more the “sea cows” of the Paleozoic.

Those who live and dive in the water and forage for food or look for partners there have to regularly resurface and breathe deeply. “Aquatic vertebrates are specialists in quickly filling their lungs.,” explains Prof. Dr. Steven Perry from the Institute for Zoology of the University of Bonn. Humans can move up to three quarters of their total lung volume, whales even close to all of it. However, caseids managed to move maximally only half it — not enough for a realistic adaptation to such an environment.

“Auxilliary motor” for breathing

There had to be an “auxilliary motor” that supplemented rib breathing. Vertebrates exhibit a multitude of such mechanisms, but the authors were able to exclude each of them except for a diaphragm. And indeed, the closest living relatives of caseids are the mammals. The researchers conclude that already the least common ancestor of caseids and mammals had a diaphragm more than 300 million years ago — that is about 50 million years earlier than previously assumed. An efficient respiratory system is intertwined with the evolution of warmbloodedness, which in turn molded our entire behavior. This assumed early origin of the diaphragm now demands a reevaluation of these developments.

A fossil diaphragm probably will never be found, simply due to its bad chances to become preserved. Science, according to Prof. Perry, therefore depends on functional approximations to trace the origin of this important evolutionary novelty. Dr. Lambertz: “We still don’t know that much about these animals. It has been a long way towards mammals, but the origin of the diaphragm marked a turning point on it.”

Reference:
Markus Lambertz, Christen D. Shelton, Frederik Spindler, Steven F. Perry. A caseian point for the evolution of a diaphragm homologue among the earliest synapsids. Annals of the New York Academy of Sciences, 2016; DOI: 10.1111/nyas.13264

Note: The above post is reprinted from materials provided by University of Bonn.

Related Articles