Large-scale forest fires started by prehistoric hunter-gatherers are probably the reason why Europe is not more densely forested. The finding — by an international team, including climate researcher Professor Jed Kaplan of the University of Lausanne and archaeologist Professor Jan Kolen of Leiden University — was published Nov. 30 in the journal PLOS ONE.
Deliberate or negligent
This research has generated new insights on the role of hunters in the formation of the landscape. It may be that during the coldest phase of the last Ice Age, some 20,000 years ago, hunter-gatherers deliberately lit forest fires in an attempt to create grasslands and park-like forests. They probably did this to attract wild animals and to make it easier to gather vegetable food and raw materials; it also facilitated movement. Another possibility is that the large-scale forests and steppe fires may have been the result of the hunters’ negligent use of fire in these semi-open landscapes.
Large-scale impact of humans on landscape
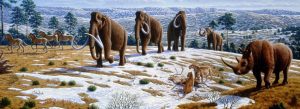
The researchers combined analyses of Ice Age accumulations of silt and computer simulations with new interpretations of archaeological data. They show that hunters throughout Europe, from Spain to Russia, were capable of altering the landscape. This first large-scale impact of humans on landscape and vegetation would have taken place more than 20,000 years before the industrial revolution. The Ice Age is often presented as an era of extreme cold and snow that was ruled by mammoths, bison and giant bears. But the researchers show that humans were also capable of having a significant impact on the landscape.
Layers of ash
Searching for evidence of this human impact explains why there are conflicting reconstructions for this period. Reconstructions of the vegetation based on pollen and plant remains from lakes and marshland suggest that Europe had an open steppe vegetation. But computer simulations based on eight possible climate scenarios show that under natural conditions the landscape in large areas of Europe would have been far more densely forested. The researchers conclude that humans must have been responsible for the difference. Further evidence has been found in the traces of the use of fire in hunting settlements from this period and in the layers of ash in the soil.
Previous Leiden research already suggested human intervention
The team from Lausanne was made up of climate researchers and ecologists Jed Kaplan, Mirjam Pfeiffer and Basil Davis. Archaeologists Jan Kolen and Alexander Verpoorte from Leiden University also worked on the research. An earlier publication by Leiden’s Human Origins research group, that was published in Current Anthropology, had already suggested that hunter-gatherers from the Stone Age may well have modified the natural environment considerably through their use of fire. The new publication in PLOS ONE confirms this hypothesis and may be one of the earliest examples of large-scale human impact on the landscape throughout the whole of Europe.
The research was financed by the European Research Council (ERC) and the Swiss National Science Foundation (SNSF) in the case of the team from Lausanne, and the European HERCULES research programme in the case of the Leiden researchers.
Reference:
Jed O. Kaplan, Mirjam Pfeiffer, Jan C. A. Kolen, Basil A. S. Davis. Large Scale Anthropogenic Reduction of Forest Cover in Last Glacial Maximum Europe. PLOS ONE, 2016; 11 (11): e0166726 DOI: 10.1371/journal.pone.0166726
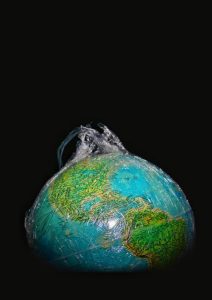
Technosphere includes physical human-made structures such as houses, factories, smartphones, computers and landfill. Credit: Image courtesy of University of Leicester
An international team led by University of Leicester geologists has made the first estimate of the sheer size of the physical structure of the planet’s technosphere — suggesting that its mass approximates to an enormous 30 trillion tons.
The technosphere is comprised of all of the structures that humans have constructed to keep them alive on the planet — from houses, factories and farms to computer systems, smartphones and CDs, to the waste in landfills and spoil heaps.
In a new paper published in the journal The Anthropocene Review, Professors Jan Zalasiewicz, Mark Williams and Colin Waters from the University of Leicester Department of Geology led an international team suggesting that the bulk of the planet’s technosphere is staggering in scale, with some 30 trillion tons representing a mass of more than 50 kilos for every square meter of Earth’s surface.
Professor Zalasiewicz explained: “The technosphere is the brainchild of the USA scientist Peter Haff — also one of the co-authors of this paper. It is all of the structures that humans have constructed to keep them alive, in very large numbers now, on the planet: houses, factories, farms, mines, roads, airports and shipping ports, computer systems, together with its discarded waste.
“Humans and human organisations form part of it, too — although we are not always as much in control as we think we are, as the technosphere is a system, with its own dynamics and energy flows — and humans have to help keep it going to survive.”
The Anthropocene concept — a proposed epoch highlighting the impact humans have made to the planet — has provided an understanding that humans have greatly changed Earth.
Professor Williams said: “The technosphere can be said to have budded off the biosphere and arguably is now at least partly parasitic on it. At its current scale the technosphere is a major new phenomenon of this planet — and one that is evolving extraordinarily rapidly.
“Compared with the biosphere, though, it is remarkably poor at recycling its own materials, as our burgeoning landfill sites show. This might be a barrier to its further success — or halt it altogether.”
The researchers believe the technosphere is some measure of the extent to which we have reshaped our planet.
“There is more to the technosphere than just its mass,” observes Professor Waters. “It has enabled the production of an enormous array of material objects, from simple tools and coins, to ballpoint pens, books and CDs, to the most sophisticated computers and smartphones. Many of these, if entombed in strata, can be preserved into the distant geological future as ‘technofossils’ that will help characterize and date the Anthropocene.”
If technofossils were to be classified as palaeontologists classify normal fossils — based on their shape, form and texture — the study suggests that the number of individual types of ‘technofossil’ now on the planet likely reaches a billion or more — thus far outnumbering the numbers of biotic species now living.
The research suggests the technosphere is another measure of the extraordinary human-driven changes that are affecting Earth.
Professor Zalasiewicz added: “The technosphere may be geologically young, but it is evolving with furious speed, and it has already left a deep imprint on our planet.”
Reference:
J. Zalasiewicz, M. Williams, C. N. Waters, A. D. Barnosky, J. Palmesino, A.-S. Ro nnskog, M. Edgeworth, C. Neal, A. Cearreta, E. C. Ellis, J. Grinevald, P. Haff, J. A. Ivar do Sul, C. Jeandel, R. Leinfelder, J. R. McNeill, E. Odada, N. Oreskes, S. J. Price, A. Revkin, W. Steffen, C. Summerhayes, D. Vidas, S. Wing, A. P. Wolfe. Scale and diversity of the physical technosphere: A geological perspective. The Anthropocene Review, 2016; DOI: 10.1177/2053019616677743
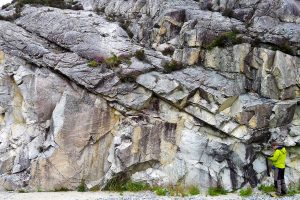
Fault zone in Southern Norway shows 200 million years of reactivation history. Credit: Giulio Viola
200 million years of geological evolution of a fault in Earth’s crust has recently been dated. Published in Nature Communications, these new findings may be used to shed light on poorly understood pathways for methane release from the heart of our planet.
Tectonic plates, big sections of Earth’s crust and blocks underneath them, are constantly moving. The areas where these sections meet and interact are called faults. They appear as scars on the outermost layer of Earth. A lot is going on along the largest of faults: mountains can grow, volcanoes can erupt, continents can separate and earthquakes happen.
Also more discrete events are constantly happening close to faults: The emission of the greenhouse gas methane from ocean floor commonly occurs in gas hydrate provinces along tectonically active continental margins.
Active methane seepage happening frequently This is what makes brittle faults particularly alluring for CAGE/NGU researcher Jochen Knies. He is one of the coauthors of a new study in Nature Communications that, for the first time, precisely dates the evolution of a brittle fault from its initial formation to its later reactivation.
Brittle faults may be important because they open up pathways along which methane, released from the reservoirs deep under Earth’s crust, can migrate to shallower depths or even into the ocean itself.
“Active methane leakage from the sea floor happens episodically, and frequently. Some seeps activate annually, others become active on a millennial scale. We need to better identify and characterize timing and duration of these leaks. It is critical for our understanding of the role the natural gas emissions play on global climate.” says Jochen Knies, researcher at CAGE/NGU.
The story of the faults is the story of methane release Methane is a very potent greenhouse gas. The impacts of the industrial and agricultural release of the gas are well known and mapped. But the effects and quantities of the natural release of the gas, especially from the ocean floor, are poorly understood. Recent studies show that this natural release has been heavily underestimated.
The Nature Communications study focuses on brittle faults and fractures onshore in western Norway. Up to now, applications for directly fingerprinting the age of brittle faulting and reactivation — and thus potentially the timing of gas emission through the crust — did not exist.
“We have managed to precisely date several episodes of faulting and reactivation of brittle faults onshore Norway. Our study unravels and dates a complex evolution of the local brittle deformation, which straddles a 200 million year timespan.” says Giulio Viola, the lead-author of the study .
The onshore study gives scientists the necessary tools to understand the age of offshore faults, which are important for methane release from gas hydrate provinces.
Improving the models and estimates of methane release The innovative method behind the study combines a twofold approach: the detailed structural analysis of faults, and the dating of their history by applying potassium/argon dating of the clay mineral illite. The faulting causes deformations in which illite can form, and just a few milligrams of the clay mineral are enough to do this type of dating.
“Testing this toolbox on fault and fracture systems below active sites of methane leakages, would potentially provide an innovative and unique possibility: By constraining the timing of offshore faulting episodes, we may ultimately be able to identify the events of increased methane emission to the ocean and atmosphere. These episodes are not something that is restricted to the past. They are happening now, and will be happening frequently in the future,” concludes Knies.
The method and the findings may also improve current models that estimate the amounts of methane released from natural sources.
Reference:
G. Viola, T. Scheiber, O. Fredin, H. Zwingmann, A. Margreth, J. Knies. Deconvoluting complex structural histories archived in brittle fault zones. Nature Communications, 2016; 7: 13448 DOI: 10.1038/ncomms13448
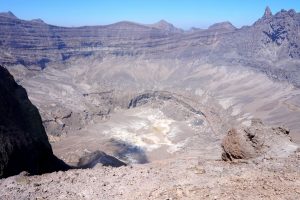
Volcanic crater of Kelud in Indonesia. Credit: Mike Cassidy, JGU
A new study published in Geology uses pockets of melts trapped within crystals to understand the conditions occurring beneath volcanoes before explosive eruptions. Volcanologists from Johannes Gutenberg University Mainz (JGU), Leibniz Universität Hannover in Germany and Uppsala University in Sweden have discovered that the temperature and water content of magmas varies through the lifecycle of a volcano, and that these variations occur in cycles in relation to the fresh input of new magma from below.
The study suggests that the point at which an eruption occurs within these cycles may control whether the resulting eruption is explosive, which produces lots of ash and affects a wide geographical region, or simply erupts effusively creating lava flows or domes, lessening the hazards to nearby populations.
The study was conducted on Kelud volcano in Indonesia, which is considered to be one of the most dangerous volcanoes in the world, with more than two million people living within 30 kilometers of it, and a death toll of more than 5,000 people killed in eruptions in the last century alone. Kelud erupted explosively as recently as 2014, dispersing ash more than 200 kilometers away, leading to the evacuation of 200,000 people, closing three international airports and killing several people. But Kelud, like many volcanoes, is unpredictable in the sense that it often changes the way it erupts. In 2014 the eruption was explosive, but in 2007 the eruption produced little ash and instead created a small lava flow within the crater.
The researchers found that before the 2014 explosive eruption at Kelud, the magma was in a cool and water-rich state, whereas in 2007, before the less explosive lava dome eruption, the magma was hotter and dryer. “Even relatively small changes in the temperature and water content of the magma can drastically alter the chemical and physical properties of the unerupted magma,” explained lead author Dr. Mike Cassidy from the Institute of Geosciences at Mainz University. “For instance, when the temperature drops, this makes the magma stickier, which means the gas finds it harder to escape, thus building up pressure leading to an explosive eruption.”
The hotter and dryer magma conditions are attributed to the fresh input of water-poor magma from below, which mixes and thus dilutes the magma in water content. The study goes some way to explaining why volcanoes erupt in different ways and could in the future help to forecast how explosive an impending eruption will be.
Reference:
Mike Cassidy et al. Volatile dilution during magma injections and implications for volcano explosivity, Geology (2016). DOI: 10.1130/G38411.1
Paleontologists at the Cleveland Museum of Natural History and Dickinson Museum Center (North Dakota) have just published new research describing the behavior of sauropod dinosaurs, the largest animals to ever walk the earth. Sauropods, like the museum’s own Haplocanthosaurus, are famous for their size, but it is their unusual feet that caught the interest of researchers.
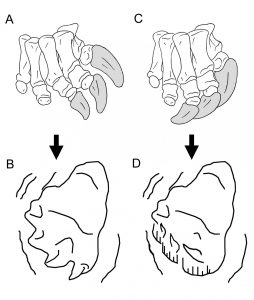
“Sauropod hind-feet possess enlarged, flattened claws which folded across and under the foot when the animal squeezed or ‘flexed’ its foot muscles,” said Lee Hall, Vertebrate Paleontology Preparator at the Cleveland Museum of Natural History and lead author on the study. “When foot muscles are flexed in a human, the toes are pulled straight down. When a sauropod flexed its toes the claws folded across the front of the foot, rotating downwards, creating an overlapping stack of flat scrapers.” This bizarre arrangement is unique among dinosaurs and has puzzled paleontologists: How could such a shape evolve? Does the unusual shape correspond with an unusual behavior?
Several competing hypotheses, or scientific questions, have been proposed. One, the “substrate grip” hypothesis, proposed that the overlapping claws would have been employed in slippery, muddy environments like river banks or lakeshores, providing traction and prevent miring. Another, the “scratch digging” hypothesis, suggested that the claws would have formed an effective scraper, like a garden hoe, and would have been utilized for excavating nests. Both hypotheses were plausible, until scientists looked at a new line of evidence.
Coauthor Dr. Denver Fowler, who led the group’s previous study on sauropod claws added: “dinosaur behavior is a tricky subject to address because most fossils are obviously evidence of dead animals, rather than living ones. However, we can go beyond speculation to actually test hypotheses of behavior if we understand what kinds of subtle evidence is recorded in fossils.”
The eureka moment for the research group came when they considered alternative ways to test their hypothesis. “Prior studies have tried to answer this question by examining the bones of sauropod feet, but no one looked at the tracks those feet left,” said Hall. Trackways are the fossilized impressions left by an animal’s feet after it walked through soft, wet sediment like mud or silt. “We studied over 30 tracks, all of which preserve the morphology of the foot and position of the claws while these animals were walking in muddy substrates. In some cases, impressions of the skin and scales from the bottoms of the feet are visible.”
Hall and his coauthors Ashley Hall (also of the Cleveland Museum of Natural History), and Dr. Denver W. Fowler (Dickinson Museum Center, North Dakota), reached out to researchers across the world for images of well-preserved sauropod tracks, and received a wealth of data and photographs from Texas, to Morocco, to Portugal.
The fossil tracks showed that sauropods did not utilize their unique claw flexing arrangement while walking in deep, wet mud, meaning they did not use them to help ‘grip’ while walking in muddy areas. Instead, the toes were either carried in a neutral position or extended outwards, which was unexpected. The study concludes it is more likely that the claws of sauropods were an adaptation for excavating nests, a behavior corroborated by comparison with similarly shaped claws used by some species of tortoises for digging, and fossil evidence of trench-like nests in which sauropod eggs have been discovered.
“We’re fascinated with the bones of their long necks and size of their gargantuan bodies, but not many have looked at what’s going on with their feet,” said Ashley Hall. “This now begs the question of which sex was building nests? Did males or females have larger claws? Can we test this?”
Fowler added “surely the most exciting thing about dinosaurs is understanding how they lived; our new study takes us one step closer.”
The study, titled “The flexion of sauropod pedal unguals and testing the substrate grip hypotheses using the trackway fossil record,” was published in the book “Dinosaur Tracks: The Next Steps” (Indiana University Press, 2016).
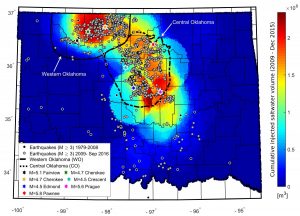
Saltwater disposal and earthquakes in Oklahoma are shown. Credit: Cornelius Langenbruch.
New regulations in Oklahoma that call for reductions in the amount of wastewater being injected into seismically active areas should significantly decrease the rate of manmade, or “induced,” earthquakes in the state, Stanford scientists say.
“Over the past few years, Oklahoma tried a number of measures aimed at reducing the rising number of induced quakes in the state, but none of those actions were effective,” said Mark Zoback, the Benjamin M. Page Professor at Stanford’s School of Earth, Energy & Environmental Sciences.
While wastewater from oil and gas drilling have been disposed of through underground injection in this area for many decades, induced seismicity was not a problem until the volumes being injected were massively increased, starting around 2009. In the past six years, billions of barrels of wastewater were injected into the Arbuckle formation, a highly permeable rock unit sitting directly on top of billion-year-old rocks containing numerous faults.
Research Zoback and his graduate student Rall Walsh published last year established the correlation in space and time between the areas where the massive injection was occurring and the induced earthquakes. They showed how pressure buildup resulting from the wastewater injection can spread out over large areas and trigger earthquakes tens of miles from the injection wells.
In light of these findings, the state’s public utilities commission—called the Oklahoma Corporation Commission —last spring called for a 40 percent reduction in the volume of wastewater being injected. The bulk of that wastewater comes from oil production in several water-bearing rock formations that had not been extensively drilled until a few years ago.
A new physics-based statistical model developed by Stanford postdoctoral fellow Cornelius Langenbruch and Zoback, and detailed online this week in the journal Science Advances, predicts that the continued reduction of injected wastewater will lead to a significant decline in the rate of widely-felt earthquakes—defined as quakes measuring magnitude 3.0 or above—and a return to the historic background level in about five years.
“When the volume of wastewater injection peaked in 2015, Oklahoma was experiencing two or more magnitude 3.0 earthquakes per day. Before 2009, when wastewater injection really started ramping up, the rate was about one per year.
“Several months after wastewater injection began decreasing in mid-2015, the earthquake rate started to decline,” Langenbruch said. “There is no question that there is a significantly lower seismicity rate than there was a year ago.”
Unfortunately, even though the rate of induced quakes will continue declining, the probability of potentially damaging earthquakes like the magnitude 5.8 earthquake that struck the town of Pawnee in September (the largest to have occurred in Oklahoma in historic time) will remain elevated for a number of years, the Stanford scientists say.
“As long as elevated pressure persists throughout this region,” Zoback said, “there will be an increased risk of triggering damaging earthquakes.”
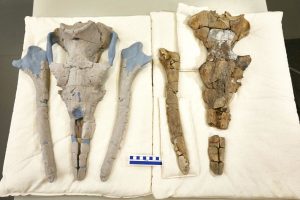
This is Alfred the ‘fossil’ whale skull. Credit: Ben Healley
Monash University scientists have played a key role in discovering the origin of filter feeding in baleen whales — the largest animal known to have ever existed.
The discovery is detailed in a paper co-written with international researchers and palaeontologists from Museum Victoria. ‘Alfred’ the 25- million-year-old fossilised whale skull was unveiled at the Museum today.
“Alfred shows how ancient baleen whales made the evolutionary switch from biting prey with teeth to filtering using baleen,” said Monash Science Senior Research Fellow, Dr Alistair Evans, one of the authors of the paper.
“They first became suction feeders. Feeding in this way resulted in reduced need for teeth, so over time their teeth were lost before baleen appeared.”
There has been a lot of mystery around how and when baleen first formed.
“But we now have long-sought evidence of how whales evolved from having teeth to hair-like baleen — triggering the rise of the biggest beasts on the planet,” said Dr Evans. Nick-named ‘Alfred’, the fossil skull is from an extinct group of whales called aetiocetids, which despite having teeth were an early branch of the baleen whale family tree.
Alfred’s teeth show exceptionally rare evidence of feeding behaviour suggesting an entirely new evolutionary scenario — before losing teeth and evolving baleen, these whales used suction to catch prey.
Today’s baleen whales — such as the Blue and Humpback — don’t have teeth. Instead, they have evolved the hair-like structure called baleen that allows them to filter huge amounts of tiny plankton, like krill, from seawater.
“Filter-feeding is the key to the baleen whales’ evolutionary success,” said Dr Erich Fitzgerald, Senior Curator of Vertebrate Palaeontology, Museums Victoria.
“But what has really eluded scientists since Charles Darwin is exactly how whales made the complex evolutionary change from biting prey with teeth to filtering plankton using baleen.”
This unusual type of tooth wear is only seen in a few living marine mammals (such as walrus) that use a back-and-forth movement of their tongue to suck in prey, and incidentally rough material like sand.
Alfred shows how ancient baleen whales made the evolutionary switch from biting prey with teeth to filtering using baleen: they first became suction feeders. Feeding in this way resulted in reduced need for teeth, so over time their teeth were lost before baleen appeared.
The research team is now uncovering the rest of Alfred’s skeleton, as well as other fossils from Australia that provide exciting insights on how baleen whales began.
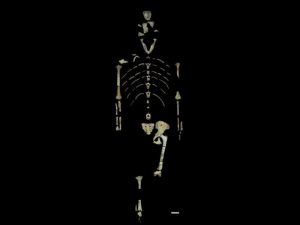
The fossils that make up the Lucy skeleton. Credit: John Kappelman/University of Texas at Austin
Since the discovery of the fossil dubbed Lucy 42 years ago this month, paleontologists have debated whether the 3 million-year-old human ancestor spent all of her time walking on the ground or instead combined walking with frequent tree climbing. Now, analysis of special CT scans by scientists from The Johns Hopkins University and the University of Texas at Austin suggests the female hominin spent enough time in the trees that evidence of this behavior is preserved in the internal structure of her bones. A description of the research study appears November 30 in the journal PLOS ONE.
Analysis of the partial fossilized skeleton, the investigators say, shows that Lucy’s upper limbs were heavily built, similar to champion tree-climbing chimpanzees, supporting the idea that she spent time climbing and used her arms to pull herself up. In addition, they say, the fact that her foot was better adapted for bipedal locomotion (upright walking) than grasping may mean that climbing placed additional emphasis on Lucy’s ability to pull up with her arms and resulted in more heavily built upper limb bones.
Exactly how much time Lucy spent in the trees is difficult to determine, the research team says, but another recent study suggests Lucy died from a fall out of a tall tree. This new study adds to evidence that she may have nested in trees at night to avoid predators, the authors say. An eight-hour slumber would mean she spent one-third of her time up in the trees, and if she also occasionally foraged there, the total percentage of time spent above ground would be even greater.
Lucy, housed in the National Museum of Ethiopia, is a 3.18 million-year-old specimen of Australopithecus afarensis — or southern ape of Afar — and is among the oldest, most complete fossil skeletons ever found of any adult, erect-walking human ancestor. She was discovered in the Afar region of Ethiopia in 1974 by Arizona State University anthropologist Donald Johanson and graduate student Tom Gray. The new study analyzed CT scan images of her bones for clues to how she used her body during her lifetime. Previous studies suggest she weighed less than 65 pounds and was under 4 feet tall.
“We were able to undertake this study thanks to the relative completeness of Lucy’s skeleton,” says Christopher Ruff, Ph.D., a professor of functional anatomy and evolution at the Johns Hopkins University School of Medicine. “Our analysis required well-preserved upper and lower limb bones from the same individual, something very rare in the fossil record.”
The research team first had a look at Lucy’s bone structure during her U.S. museum tour in 2008, when the fossil was detoured briefly to the High-Resolution X-Ray Computed Tomography Facility in the University of Texas at Austin Jackson School of Geosciences. For 11 days, John Kappelman, Ph.D., anthropology and geological sciences professor, and geological sciences professor Richard Ketcham, Ph.D., both of the University of Texas at Austin, carefully scanned all of her bones to create a digital archive of more than 35,000 CT slices. High-resolution CT scans were necessary because Lucy is so heavily mineralized that conventional CT is not powerful enough to image the internal structure of her bones.
“We all love Lucy,” Ketcham says, “but we had to face the fact that she is a rock. The time for standard medical CT scanning was 3.18 million years ago. This project required a scanner more suited to her current state.”
The new study uses CT slices from those 2008 scans to quantify the internal structure of Lucy’s right and left humeri (upper arm bones) and left femur (thigh bone).
“Our study is grounded in mechanical engineering theory about how objects can facilitate or resist bending,” says Ruff, “but our results are intuitive because they depend on the sorts of things that we experience about objects — including body parts — in everyday life. If, for example, a tube or drinking straw has a thin wall, it bends easily, whereas a thick wall prevents bending. Bones are built similarly.”
“It is a well-established fact that the skeleton responds to loads during life, adding bone to resist high forces and subtracting bone when forces are reduced,” explains Kappelman. “Tennis players are a nice example: Studies have shown that the cortical bone in the shaft of the racquet arm is more heavily built up than that in the nonracquet arm.”
A major issue in the debate over Lucy’s tree climbing has been how to interpret skeletal features that might be simply “leftovers” from a more primitive ancestor that had relatively long arms, for example. The advantage of the new study, Ruff says, is that it focused on characteristics that reflect actual behavior during life.
Lucy’s scans were compared with CT scans from a large sample of modern humans, who spend the majority of their time walking on two legs on the ground, and with chimpanzees, a species that spends more of its time in the trees and, when on the ground, usually walks on all four limbs.
“Our results show that the upper limbs of chimpanzees are relatively more heavily built because they use their arms for climbing, with the reverse seen in humans, who spend more time walking and have more heavily built lower limbs,” says Ruff. “The results for Lucy are convincing and intuitive.”
Other comparisons carried out in the study suggest that even when Lucy walked upright, she may have done so less efficiently than modern humans, limiting her ability to walk long distances on the ground, Ruff says. In addition, all of her limb bones were found to be very strong relative to her body size, indicating that she had exceptionally strong muscles, more like those of modern chimpanzees than modern humans. A reduction in muscle power later in human evolution may be linked to better technology that reduced the need for physical exertion and the increased metabolic demands of a larger brain, the researchers say.
“It may seem unique from our perspective that early hominins like Lucy combined walking on the ground on two legs with a significant amount of tree climbing,” says Kappelman, “but Lucy didn’t know she was “unique” — she moved on the ground and climbed in trees, nesting and foraging there, until her life was likely cut short by a fall — probably out of a tree.”
Graduate student M. Loring Burgess of the Johns Hopkins University School of Medicine was also an author on the paper.
The study was funded by the Paleoanthropology Lab Fund, the University of Texas at Austin College of Liberal Arts and the Houston Museum of Natural Science. The University of Texas High-Resolution X-Ray CT Facility was supported by U.S. National Science Foundation grants EAR-0646848, EAR-0948842 and EAR-1258878. Comparative data were gathered with support from U.S. National Science Foundation grants BCS-0642297 and BCS-1316104.
Reference:
Christopher B. Ruff , M. Loring Burgess, Richard A. Ketcham, John Kappelman. Limb Bone Structural Proportions and Locomotor Behavior in A.L. 288-1 (“Lucy”). PLOS ONE, 2016 DOI: 10.1371/journal.pone.0166095
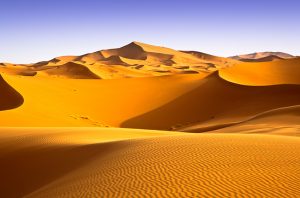
As little as 6,000 years ago, the vast Sahara Desert was covered in grassland that received plenty of rainfall, but shifts in the world’s weather patterns abruptly transformed the vegetated region into some of the driest land on Earth. A Texas A&M university researcher is trying to uncover the clues responsible for this enormous climate transformation — and the findings could lead to better rainfall predictions worldwide.
Robert Korty, associate professor in the Department of Atmospheric Sciences, along with colleague William Boos of Yale University, have had their work published in the current issue of Nature Geoscience.
The two researchers have looked into precipitation patterns of the Holocene era nd compared them with present-day movements of the intertropical convergence zone, a large region of intense tropical rainfall. Using computer models and other data, the researchers found links to rainfall patterns thousands of years ago.
“The framework we developed helps us understand why the heaviest tropical rain belts set up where they do,” Korty explains.
“Tropical rain belts are tied to what happens elsewhere in the world through the Hadley circulation, but it won’t predict changes elsewhere directly, as the chain of events is very complex. But it is a step toward that goal.”
The Hadley circulation is a tropical atmospheric circulation that rises near the equator. It is linked to the subtropical trade winds, tropical rainbelts, and affects the position of severe storms, hurricanes, and the jet stream. Where it descends in the subtropics, it can create desert-like conditions. The majority of Earth’s arid regions are located in areas beneath the descending parts of the Hadley circulation.
“We know that 6,000 years ago, what is now the Sahara Desert was a rainy place,” Korty adds.
“It has been something of a mystery to understand how the tropical rain belt moved so far north of the equator. Our findings show that that large migrations in rainfall can occur in one part of the globe even while the belt doesn’t move much elsewhere.
“This framework may also be useful in predicting the details of how tropical rain bands tend to shift during modern-day El Niño and La Niña events (the cooling or warming of waters in the central Pacific Ocean which tend to influence weather patterns around the world).”
The findings could lead to better ways to predict future rainfall patterns in parts of the world, Korty believes.
“One of the implications of this is that we can deduce how the position of the rainfall will change in response to individual forces,” he says. “We were able to conclude that the variations in Earth’s orbit that shifted rainfall north in Africa 6,000 years ago were by themselves insufficient to sustain the amount of rain that geologic evidence shows fell over what is now the Sahara Desert. Feedbacks between the shifts in rain and the vegetation that could exist with it are needed to get heavy rains into the Sahara.”
Reference:
William R. Boos, Robert L. Korty. Regional energy budget control of the intertropical convergence zone and application to mid-Holocene rainfall. Nature Geoscience, 2016; 9 (12): 892 DOI: 10.1038/ngeo2833
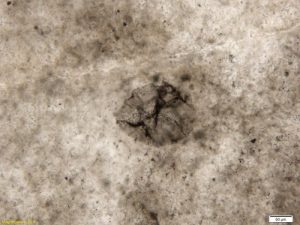
This is a microscopic image of 2.5 billion-year-old sulfur-oxidizing bacterium. Credit: Andrew Czaja, UC assistant professor of geology
Somewhere between Earth’s creation and where we are today, scientists have demonstrated that some early life forms existed just fine without any oxygen.
While researchers proclaim the first half of our 4.5 billion-year-old planet’s life as an important time for the development and evolution of early bacteria, evidence for these life forms remains sparse including how they survived at a time when oxygen levels in the atmosphere were less than one-thousandth of one percent of what they are today.
Recent geology research from the University of Cincinnati presents new evidence for bacteria found fossilized in two separate locations in the Northern Cape Province of South Africa.
“These are the oldest reported fossil sulfur bacteria to date,” says Andrew Czaja, UC assistant professor of geology. “And this discovery is helping us reveal a diversity of life and ecosystems that existed just prior to the Great Oxidation Event, a time of major atmospheric evolution.”
The 2.52 billion-year-old sulfur-oxidizing bacteria are described by Czaja as exceptionally large, spherical-shaped, smooth-walled microscopic structures much larger than most modern bacteria, but similar to some modern single-celled organisms that live in deepwater sulfur-rich ocean settings today, where even now there are almost no traces of oxygen.
In his research published in the December issue of the journal Geology of the Geological Society of America, Czaja and his colleagues Nicolas Beukes from the University of Johannesburg and Jeffrey Osterhout, a recently graduated master’s student from UC’s department of geology, reveal samples of bacteria that were abundant in deep water areas of the ocean in a geologic time known as the Neoarchean Eon (2.8 to 2.5 billion years ago).
“These fossils represent the oldest known organisms that lived in a very dark, deep-water environment,” says Czaja. “These bacteria existed two billion years before plants and trees, which evolved about 450 million years ago. We discovered these microfossils preserved in a layer of hard silica-rich rock called chert located within the Kaapvaal craton of South Africa.”
With an atmosphere of much less than one percent oxygen, scientists have presumed that there were things living in deep water in the mud that didn’t need sunlight or oxygen, but Czaja says experts didn’t have any direct evidence for them until now.
Czaja argues that finding rocks this old is rare, so researchers’ understanding of the Neoarchean Eon are based on samples from only a handful of geographic areas, such as this region of South Africa and another in Western Australia.
According to Czaja, scientists through the years have theorized that South Africa and Western Australia were once part of an ancient supercontinent called Vaalbara, before a shifting and upending of tectonic plates split them during a major change in the Earth’s surface.
Based on radiometric dating and geochemical isotope analysis, Czaja characterizes his fossils as having formed in this early Vaalbara supercontinent in an ancient deep seabed containing sulfate from continental rock. According to this dating, Czaja’s fossil bacteria were also thriving just before the era when other shallow-water bacteria began creating more and more oxygen as a byproduct of photosynthesis.
“We refer to this period as the Great Oxidation Event that took place 2.4 to 2.2 billion years ago,” says Czaja.
Early recycling
Czaja’s fossils show the Neoarchean bacteria in plentiful numbers while living deep in the sediment. He contends that these early bacteria were busy ingesting volcanic hydrogen sulfide — the molecule known to give off a rotten egg smell — then emitting sulfate, a gas that has no smell. He says this is the same process that goes on today as modern bacteria recycle decaying organic matter into minerals and gases.
“The waste product from one [bacteria] was food for the other,” adds Czaja.
“While I can’t claim that these early bacteria are the same ones we have today, we surmise that they may have been doing the same thing as some of our current bacteria,” says Czaja. “These early bacteria likely consumed the molecules dissolved from sulfur-rich minerals that came from land rocks that had eroded and washed out to sea, or from the volcanic remains on the ocean’s floor.
There is an ongoing debate about when sulfur-oxidizing bacteria arose and how that fits into the earth’s evolution of life, Czaja adds. “But these fossils tell us that sulfur-oxidizing bacteria were there 2.52 billion years ago, and they were doing something remarkable.”
Reference:
Andrew D. Czaja, Nicolas J. Beukes, Jeffrey T. Osterhout. Sulfur-oxidizing bacteria prior to the Great Oxidation Event from the 2.52 Ga Gamohaan Formation of South Africa. Geology, 2016; 44 (12): 983 DOI: 10.1130/G38150.1
Carbon and nitrogen are central to life on Earth – life cannot exist without them, but an overabundance in the atmosphere imperils the life we have. So how much carbon and nitrogen is there on (and in) planet Earth? And how much was in the ancient atmosphere? Actually, no one is really sure.
The amount of carbon and nitrogen trapped in minerals in the Earth’s crust is one factor in the equation, and the subject of a three-year research project supported by a $900,000 grant from the U.S. Department of Energy. In their work, researchers will examine the ability of minerals to absorb and retain carbon and nitrogen. By doing so, they may also uncover a new source of information about the ancient atmosphere.
“Life interacts with the Earth’s crust and the atmosphere, and this project can tell us about both by providing insight into which minerals absorb carbon and nitrogen, how well they absorb them, how well they retain them, and how quickly gases escape under certain conditions,” said Bruce Watson, a geochemist and professor of geochemistry at Rensselaer Polytechnic Institute. “With this information, we can deduce the amount of carbon and nitrogen contained in these minerals, and we will also explore the intriguing possibility that they contain a record of the ancient atmosphere.”
Watson, director of the New York Center for Astrobiology, is leading the project, titled “Storage and Diffusion of Carbon and Nitrogen in Crustal Materials,” in collaboration with Morgan Schaller, an assistant professor of earth and environmental sciences, and Suzanne L. Baldwin, a professor at Syracuse University.
Carbon and nitrogen are two of the 83 elements (each with multiple isotopes) found on Earth in varying abundance. Within the crust of the Earth, which can be as much as 30 miles thick, deposits of silica-rich minerals such as quartz, feldspar, and mica contain gases trapped when the minerals formed. In his office, Watson held up a sample of chert, a form of quartz, by way of example.
“Chert is silicon dioxide that precipitates from solution. This sample formed 300 million years ago in an environment similar to a peat bog,” Watson said. “It’s a mineral, but it’s not pure. There are gases in it that were present when it formed – carbon dioxide, nitrogen, oxygen, argon – all the major components of the atmosphere. This piece of chert may contain a sample of the atmosphere as it was 300 million years ago.”
But it’s not that cut and dry. Even a witness as seemingly inert as a rock changes over 300 million years.
“Even as it sits here at room temperature, the atoms in this crystal are vibrating and every now and then, one of those atoms will jump from one site to another,” Watson said. “So the question is, how quickly will that happen to the gases within this mineral? How faithful a recorder of the atmosphere is it?”
To find out, Watson will conduct a series of experiments that measure the solubility and diffusion of carbon and nitrogen within specific minerals, evaluating how much of the relevant gas specific minerals can absorb, and how well they’re retained. For example, researchers will “soak” mineral samples in an atmosphere of carbon, oxygen, hydrogen, and nitrogen at high pressure and temperature. Solubility can be determined through a measurement of the number of molecules per cubic centimeter that can be introduced into the mineral. Researchers can also grow minerals in the presence of those gases, and measure the absorption of gases during formation. To determine the rate at which gases diffuse out of a mineral, researchers will use nuclear reaction analysis to measure the concentration of gases as a function of depth in a sample.
Schaller will provide a “ground truth” of gas concentrations in minerals by using a specialized mass spectrometer to measure the amount of gases found in ancient minerals. Further, Schaller will measure the natural abundance of trapped gases from samples of different time periods throughout geologic history to reconstruct the changes in the concentration of atmospheric gases.
“If we can first demonstrate that certain materials, like cherts, are very retentive of carbon and nitrogen, we have a potentially faithful recorder of the major atmospheric gases through time,” said Schaller. “It’s extremely important to know the concentration of, for example, carbon dioxide during the warmest periods in Earth history because they can inform our understanding of the planet’s current trajectory.”
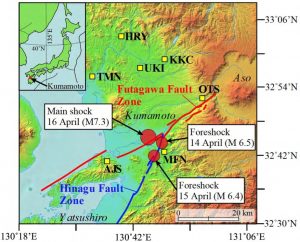
Groundwater samples were obtained from seven locations in the Futagawa-Hinagu fault zones in the Kumamoto region. The locations are marked as yellow squares (denoted HRY, TMN, UKI, KKC, OTS, AJS, and MFN) on the map. The epicenters of the two tremors that preceded the main quake and the main shock are shown in red circles. Credit: 2016 Yuji Sano.
Japanese researchers have revealed a relationship between helium levels in groundwater and the amount of stress exerted on inner rock layers of the earth, found at locations near the epicenter of the 2016 Kumamoto earthquake. Scientists hope the finding will lead to the development of a monitoring system that catches stress changes that could foreshadow a big earthquake.
Several studies, including some on the massive earthquake in Kobe, Japan, in 1995, have indicated that changes to the chemical makeup of groundwater may occur prior to earthquakes. However, researchers still needed to accumulate evidence to link the occurrence of earthquakes to such chemical changes before establishing a strong correlation between the two.
A team of researchers at the University of Tokyo and their collaborators found that when stress exerted on the earth’s crust was high, the levels of a helium isotope, helium-4, released in the groundwater was also high at sites near the epicenter of the 2016 Kumamoto earthquake, a magnitude 7.3 quake in southwestern Japan, which caused 50 fatalities and serious damage.
The team used a submersible pump in deep wells to obtain groundwater samples at depths of 280 to 1,300 meters from seven locations in the fault zones surrounding the epicenter 11 days after the earthquake in April 2016. They compared the changes of helium-4 levels from chemical analyses of these samples with those from identical analyses performed in 2010.
“After careful analysis and calculations, we concluded that the levels of helium-4 had increased in samples that were collected near the epicenter due to the gas released by the rock fractures,” says lead author Yuji Sano, a professor at the University of Tokyo’s Atmosphere Ocean Research Institute.
Furthermore, scientists estimated the amount of helium released by the rocks through rock fracture experiments in the laboratory using rock samples that were collected from around the earthquake region. They also calculated the amount of strain exerted at the sites for groundwater sample collection using satellite data. Combined, the researchers found a positive correlation between helium amounts in groundwater and the stress exertion, in which helium content was higher in areas near the epicenter, while concentrations fell further away from the most intense seismic activity.
“More studies should be conducted to verify our correlation in other earthquake areas,” says Sano. “It is important to make on-site observations in studying earthquakes and other natural phenomena, as this approach provided us with invaluable insight in investigating the Kumamoto earthquake,” he adds.
Credit: Image courtesy of Australian National University
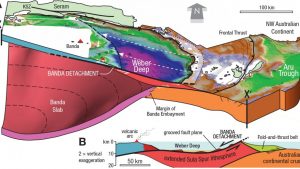
Geologists have for the first time seen and documented the Banda Detachment fault in eastern Indonesia and worked out how it formed.
Lead researcher Dr Jonathan Pownall from The Australian National University (ANU) said the find will help researchers assess dangers of future tsunamis in the area, which is part of the Ring of Fire — an area around the Pacific Ocean basin known for earthquakes and volcanic eruptions.
“The abyss has been known for 90 years but until now no one has been able to explain how it got so deep,” Dr Pownall said.
“Our research found that a 7 km-deep abyss beneath the Banda Sea off eastern Indonesia was formed by extension along what might be Earth’s largest-identified exposed fault plane.”
By analysing high-resolution maps of the Banda Sea floor, geologists from ANU and Royal Holloway University of London found the rocks flooring the seas are cut by hundreds of straight parallel scars.
These wounds show that a piece of crust bigger than Belgium or Tasmania must have been ripped apart by 120 km of extension along a low-angle crack, or detachment fault, to form the present-day ocean-floor depression.
Dr Pownall said this fault, the Banda Detachment, represents a rip in the ocean floor exposed over 60,000 square kilometres.
“The discovery will help explain how one of Earth’s deepest sea areas became so deep,” he said.
Professor Gordon Lister also from the ANU Research School of Earth Sciences said this was the first time the fault has been seen and documented by researchers.
“We had made a good argument for the existence of this fault we named the Banda Detachment based on the bathymetry data and on knowledge of the regional geology,” said Professor Lister.
Dr Pownall said he was on a boat journey in eastern Indonesia in July when he noticed the prominent landforms consistent with surface extensions of the fault line.
“I was stunned to see the hypothesised fault plane, this time not on a computer screen, but poking above the waves,” said Dr Pownall.
He said rocks immediately below the fault include those brought up from the mantle.
“This demonstrates the extreme amount of extension that must have taken place as the oceanic crust was thinned, in some places to zero,” he said.
Dr Pownall also said the discovery of the Banda Detachment fault would help assesses dangers of future tsunamis and earthquakes.
“In a region of extreme tsunami risk, knowledge of major faults such as the Banda Detachment, which could make big earthquakes when they slip, is fundamental to being able to properly assess tectonic hazards,” he said.
Reference:
Jonathan M. Pownall, Robert Hall, Gordon S. Lister. Rolling open Earth’s deepest forearc basin. Geology, 2016; 44 (11): 947 DOI: 10.1130/G38051.1
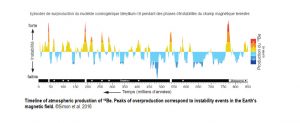
Timeline of atmospheric production of 10Be. Peaks of overproduction correspond to instability events in the Earth’s magnetic field. Credit: Simon et al. 2016
Past variations in the strength of the Earth’s magnetic field are reflected by the production of isotopes in the atmosphere. Researchers from the CNRS, Aix Marseille Université and the French Alternative Energies and Atomic Energy Commission CEA have used an isotope extracted from marine sediments to identify such geomagnetic excursions over a particularly long period. Beryllium-10 provides a timeline stretching back over the past 850,000 years, during which its concentration fluctuated according to the strength of Earth’s magnetic field. The work, published in Journal of Geophysical Research: Solid Earth, provides a new tool to study past variations in the Earth’s magnetic field and its behavior in the future.
The beryllium isotope 10Be forms in the atmosphere under the action of cosmic rays, which are partially deflected by the Earth’s magnetic field. The strength of the field therefore affects the production of 10Be. The isotope is washed out of the atmosphere by rain shortly after it forms and sticks to mineral grains that settle onto the sea floor. Three sediment cores were extracted from the bottom of the Indian and Pacific oceans and analyzed with the aim of comparing 10Be concentrations with those of 9Be, which originates in the Earth’s crust. This ratio was used to estimate the atmospheric production rate of 10Be at the millennial scale over a period of 850,000 years. The production rate was indeed found to change in line with variations in the magnetic field, which were already known from paleomagnetic methods whose reliability needed testing.
Episodes of overproduction of 10Be correspond to collapses of the Earth’s magnetic field, including those associated with its most recent reversal known, the Brunhes-Matuyama reversal 770,000 years ago. Falls in the strength of the magnetic field also coincide with excursions, failed reversals in which the poles finally return to their initial position. Such phenomena occur every 20,000 to 50,000 years, with the most recent one taking place 41,500 years ago. After several attempted reversals, the Earth’s magnetic field might well resume this behavior. Indeed, direct measurements of the magnetic field reveal a rapid decrease in the field, initiated 2,500 years ago. If this continues in the future, it could create conditions favorable to a new excursion, or even a reversal, in two or three thousand years’ time.
Reference:
Quentin Simon et al. AuthigenicBe/Be ratio signatures of the cosmogenic nuclide production linked to geomagnetic dipole moment variation since the Brunhes/Matuyama boundary, Journal of Geophysical Research: Solid Earth (2016). DOI: 10.1002/2016JB013335
Note: The above post is reprinted from materials provided by CNRS.
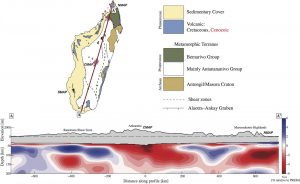
Seismic images showed areas of hotter rock underlying elevated areas of recent volcanism (NMAP and CMAP on the seismic image; red outlines on the inset map). Credit: Martin Pratt
Madagascar, the big island off the east coast of Africa with the lemurs and baobabs, is thought to be sitting in the middle of an old tectonic plate, and so, by the rules of plate tectonics, should be tectonically quiet: few earthquakes and no volcanoes.
But it’s not. The island has been away from tectonic action for the past 80 million years, said Martin Pratt, research scientist in earth and planetary sciences at Washington University in St. Louis, yet it experiences about 500 earthquakes per year.
The island also has volcanoes that have been active within the recent geologic past. “Having active volcanoes in Madagascar is like having erupting volcanoes in St. Louis,” said Michael Wysession, professor of earth and planetary sciences. “You have to ask yourself, ‘What are they doing there?'”
Since this part of the world is geologically complex, there are lots of interesting possible explanations for the volcanoes. To figure it out, the geologists needed to be able to examine not just the island’s accessible surface, but also what lies beneath the rigid crust and upper mantle.
To image Earth’s interior, geologists use a technique called seismic tomography that is similar to the medical CT scan, probing the earth’s strictire with seismic waves from distant earthquakes and ambient noise. But remote and politically unstable Madagascar was largely unexplored by seismic methods until recently.
Starting in 2010, however, three groups, including one led by Washington University seismologists Wysession and Doug Wiens, began to deploy seismic arrays on Madagascar, on nearby islands in the Mozambique channel (between the island and Africa), and on the ocean floor east of Madagascar.
In an article published online Nov. 22 in Earth and Planetary Science Letters, the Washington University scientists report that they found three areas of hot rock within the mantle beneath three separate volcanic provinces on the island.
They also see signs that the bottom of the lithosphere beneath the central volcanic province has peeled off. As the cold rock sank into the mantle, hotter rock flowed around it to the center and the south of the island. The crust, unburdened, bobbed higher. The northern volcanic province, meanwhile, probably taps a different heat source.
A busted-up chunk of an ancient continent
Madagascar, originally part of the ancient continent Gondwana, was formed in two steps. The island, together with India, pulled away from Africa 150 million years ago, stretching and thinning the crust on the island’s west coast before it finally snapped off. The thinned crust on the west coast sagged and the dips filled with sediments, forming deep basins of sedimentary rocks.
Then, about 90 million years ago, when the mini-continent migrated over the Marion hotspot (a mantle plume that now lies beneath the Antarctic plate to the south), brief but voluminous eruptions covered the island in lava. The blast of heat is thought to have cracked the overriding continent into two parts, Madagascar and India, which scraped past the east coast of Madagascar on its way north toward Asia, leaving a very straight coastline there.
But the volcanism in the central, northern, and southern provinces are much younger than the basaltic remains of the 90-million-year-old eruption still found around the perimeter of Madagascar. So the question was: Where did they come from?
What the images show
Lead-author Pratt used three complementary methods to analyze surface waves (seismic waves trapped near Earth’s surface), which are created by distant earthquakes and from sources of seismic noise, such as ocean storms.
“His approach is clever and creative,” Wysession said. “He’s taken three really different data sets, some good at high frequencies that give you better resolution at shallow depths, and some better at low frequencies that give you better resolution at greater depths, and he’s put them all together. It’s a bit like combining an X-ray, an MRI and a CT scan to get a clearer image.”
The images show three low-velocity seismic anomalies corresponding to the upwelling of hotter mantle rock along the island’s backbone.
“We knew about the named volcanic provinces in the center and north,” Wysession said. “But we didn’t know about the one in the southwest. When we saw the third blob in the images, we checked the literature and discovered that, sure enough, there was volcanic activity there as recently as 9 million years ago.”
The cause of the three hot regions in the mantle is a mystery, however. Though there is some indication from the tomographic images that the regions might be connected, particularly the southern two, further modeling of deeper structure will be needed to confirm.
One origin of the hot regions previously has been proposed to be hot rock rising through the mantle as the Comores hot spot, which has created a set of volcanic islands just west of the north end of the island.
The authors have a different idea, however, and it comes from the way that the central and southwestern provinces appear to be connected at depth.
“If you look at the images that Martin has made,” Wysession said, “you can see a horseshoe shape where the central hot mantle anomaly swings west and then comes back east again, connecting the central and southern provinces.
The deflecting obstacle seems to be a slab of colder rock. “We think the lithosphere (the crust and rigid upper mantle) has delaminated, and the bottom of it fell off,” Wysession said. “As the cold, dense slab began to sink, hotter rock flowed up and in to replace it, buoying the central province and, as it tilted, blocking flow to the south.”
But what caused the bottom of the lithosphere to peel off? “We think it may have been the Marion hotspot,” Wysession said. “The underside of the plate was heated by this huge blow torch 95 million years ago, weakening the rock enough that it was able to peel off. So we’re still seeing collateral damage from this ancient event.”
This idea also has the advantage of explaining the unusually high elevations of the northern half of the island. Once the heavy bottom of the plate fell off, it stopped pulling down the crust, which rebounded upward as much as a kilometer as hot rock from below took the place of the delaminated slab.
Something similar happened underneath the Great Basin of the western United States, he said, where the bottom of the lithosphere also split off, forming a large blob of cold material sinking down through the mantle below the surface of central Nevada. There, the blow torch that delaminated the plate was an ocean spreading center that was overridden by the North American plate, Wysession said.
Reference:
Martin J. Pratta, Michael E. Wysessiona, Ghassan Aleqabia, Douglas A. Wiensa, Andrew A. Nybladeb, Patrick Shorea, Gérard Rambolamananac, Fenitra Andriampenomananac, Tsiriandrimanana Rakotondraibec, Robert D. Tuckerd, Guilhem Barruole, Elisa Rindraharisaonaf. Shear velocity structure of the crust and upper mantle of Madagascar derived from surface wave tomography. DOI: 10.1016/j.epsl.2016.10.041
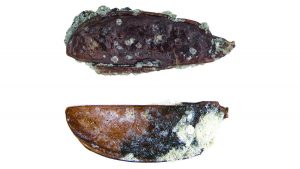
The fossilized forewings of the new ground beetle A. balli. Credit: Dr. Allan Ashworth
Fossilised forewings from two individuals, discovered on the Beardmore Glacier, revealed the first ground beetle known from the southernmost continent. It is also the second beetle for the Antarctic insect fauna with living descendants. The new species, which for now is also the sole representative of a new genus, is to be commonly known as Ball’s Antarctic Tundra Beetle. Scientists Dr Allan Ashworth, North Dakota State University, and Dr Terry Erwin, Smithsonian Institution, published their findings in the open access journal ZooKeys.
The insect fauna in Antarctica is so poor that today it consists of only three species of flightless midges, with one of them having been probably introduced from the subantarctic island of South Georgia. The absence of biodiversity is considered to be a result of lack of moisture, vegetation and low temperatures.
Following their study, the authors conclude that the beetle must have inhabited the sparsely-vegetated sand and gravel banks of a meltwater-fed stream that was once part of an outwash plain at the head of a fjord in the Transantarctic Mountains. Plants associated with the extinct beetle include southern beech, buttercup, moss mats, and cushion plants, all typical for a tundra ecosystem. The species may or may not have been able to fly.
The closest modern relatives to the extinct species live in South America, the Falkland Islands, South Georgia, Tasmania and Australia. Tracking the ancient lineage of this group of beetles, known as the carabid beetle tribe Trechini, confirms that they were once widely distributed in Gondwana, the supercontinent that used to unite what today we recognise as Antarctica, South America, Africa, Madagascar, Australia, the Arabian Peninsula and the Indian Subcontinent. Ball’s Antarctic Tundra Beetle is also an evidence that even after Gondwana broke apart, the tundra ecosystem persevered in Antarctica for millions of years.
“The conflicting signals both in anatomical attributes and biogeography, and in ecological setting as well, leave open the question of relationships, thus giving us no alternative but to flag the species represented by fossil evidence through erection of new genus status, hence drawing attention to it and the need for further paleontological studies in Antarctica,” speak of their discovery the authors.
The new Ball’s Antarctic Tundra Beetle is scientifically identified as Antarctotrechus balli, where the genus name (Antarctotrechus) refers to its being related to the tribe Trechini, and the species name (balli) honours distinct expert of ground beetles Dr. George E. Ball, who celebrated his 90th birthday on 26th September, 2016.
Reference:
Ashworth AC, Erwin TL (2016) Antarctotrechus balli sp. n. (Carabidae, Trechini): the first ground beetle from Antarctica. ZooKeys 635: 109-122. DOI: 10.3897/zookeys.635.10535
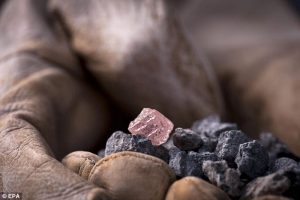
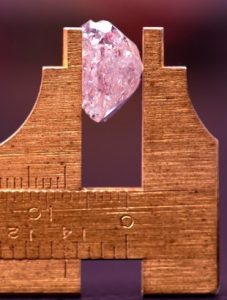
The Argyle Pink Jubilee diamond with a smaller Argyle pink diamond in the background
An Australian mining company says it has found a 12.76-carat pink diamond, the largest rough diamond found in the country.
The rare diamond was found at Rio Tinto’s Argyle diamond mine in Western Australia’s East Kimberly region.
Large stones like the Jubilee usually go to museums or wind up in high-profile auction houses like Christie’s. Christie’s has auctioned 18 painted pink diamonds greater than 10 carats in its 244-year existence. The Jubilee was supposed to travel globally before being sold at an invitation-only auction.
Estimated to be worth millions, it has been named the Argyle Pink Jubilee, and is being cut and polished in Perth.
More than 90% of the pink diamonds in the world come from the Argyle mine, a Rio Tinto statement said.
The Argyle Pink Jubilee is a light pink diamond, the company said. It is similar in colour to The Williamson Pink – the diamond found in Tanzania that Queen Elizabeth II received as a wedding gift and which was subsequently set into a brooch for her coronation.
A Rio Tinto spokesperson said that a diamond of this calibre was ”unprecedented”.
“It has taken 26 years of Argyle production to unearth this stone and we may never see one like this again,” said Argyle Pink Manager Josephine Johnson.
The Argyle Pink Jubilee – Australia’s largest pink diamond – has been donated by Rio Tinto to Melbourne Museum, home to the nation’s most comprehensive natural science display.
In 2010, a rare 24.78-carat “fancy intense pink” diamond was sold for a record-breaking $46 million (£29m), the highest price ever paid for a jewel, to a well-known British dealer at an auction in Geneva.
That diamond had been in a private collection for 60 years.
Source: Rio TintoThe gem was found at Rio Tinto’s Argyle mine in the east Kimberley region of Western AustraliaArgyle Pink Jubilee Diamond
A powerful earthquake rocked northern Japan early on Tuesday “Nov 22, 2016”, briefly disrupting cooling functions at a nuclear plant and generating a small tsunami that hit the same Fukushima region devastated by a 2011 quake, tsunami and nuclear disaster.
The magnitude 7.4 earthquake, which was felt in Tokyo, sent thousands of residents fleeing for higher ground as dawn broke along the northeastern coast.
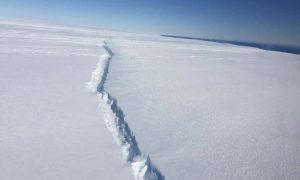
Rift in Pine Island Glacier ice shelf, West Antarctica, photographed from the air during a NASA Operation IceBridge survey flight on Nov. 4, 2016. This rift is the second to form in the center of the ice shelf in the past three years. The first resulted in an iceberg that broke off in 2015. Credit: Credit NASA/Nathan Kurtz.
A key glacier in Antarctica is breaking apart from the inside out, suggesting that the ocean is weakening ice on the edges of the continent.
The Pine Island Glacier, part of the ice shelf that bounds the West Antarctic Ice Sheet, is one of two glaciers that researchers believe are most likely to undergo rapid retreat, bringing more ice from the interior of the ice sheet to the ocean, where its melting would flood coastlines around the world.
A nearly 225-square-mile iceberg broke off from the glacier in 2015, but it wasn’t until Ohio State University researchers were testing some new image-processing software that they noticed something strange in satellite images taken before the event.
In the images, they saw evidence that a rift formed at the very base of the ice shelf nearly 20 miles inland in 2013. The rift propagated upward over two years, until it broke through the ice surface and set the iceberg adrift over 12 days in late July and early August 2015.
They report their discovery in the journal Geophysical Research Letters.
“It’s generally accepted that it’s no longer a question of whether the West Antarctic Ice Sheet will melt, it’s a question of when,” said study leader Ian Howat, associate professor of earth sciences at Ohio State. “This kind of rifting behavior provides another mechanism for rapid retreat of these glaciers, adding to the probability that we may see significant collapse of West Antarctica in our lifetimes.”
While this is the first time researchers have witnessed a deep subsurface rift opening within Antarctic ice, they have seen similar breakups in the Greenland Ice Sheet—in spots where ocean water has seeped inland along the bedrock and begun to melt the ice from underneath.
Howat said the satellite images provide the first strong evidence that these large Antarctic ice shelves respond to changes at their ocean edge in a similar way as observed in Greenland.
“Rifts usually form at the margins of an ice shelf, where the ice is thin and subject to shearing that rips it apart,” he explained. “However, this latest event in the Pine Island Glacier was due to a rift that originated from the center of the ice shelf and propagated out to the margins. This implies that something weakened the center of the ice shelf, with the most likely explanation being a crevasse melted out at the bedrock level by a warming ocean.”
Another clue: The rift opened in the bottom of a “valley” in the ice shelf where the ice had thinned compared to the surrounding ice shelf.
The valley is likely a sign of something researchers have long suspected: Because the bottom of the West Antarctic Ice Sheet lies below sea level, ocean water can intrude far inland and remain unseen. New valleys forming on the surface would be one outward sign that ice was melting away far below.
The origin of the rift in the Pine Island Glacier would have gone unseen, too, except that the Landsat 8 images Howat and his team were analyzing happened to be taken when the sun was low in the sky. Long shadows cast across the ice drew the team’s attention to the valley that had formed there.
“The really troubling thing is that there are many of these valleys further up-glacier,” Howat added. “If they are actually sites of weakness that are prone to rifting, we could potentially see more accelerated ice loss in Antarctica.”
More than half of the world’s fresh water is frozen in Antarctica. The Pine Island Glacier and its nearby twin, the Thwaites Glacier, sit at the outer edge of one of the most active ice streams on the continent. Like corks in a bottle, they block the ice flow and keep nearly 10 percent of the West Antarctic Ice Sheet from draining into the sea.
Studies have suggested that the West Antarctic Ice Sheet is particularly unstable, and could collapse within the next 100 years. The collapse would lead to a sea-level rise of nearly 10 feet, which would engulf major U.S. cities such as New York and Miami and displace 150 million people living on coasts worldwide.
“We need to understand exactly how these valleys and rifts form, and what they mean for ice shelf stability,” Howat said. “We’re limited in what information we can get from space, so this will mean targeting air and field campaigns to collect more detailed observations. The U.S. and the U.K. are partnering on a large field science program targeted at that area of Antarctica, so this will provide another piece to the puzzle.”
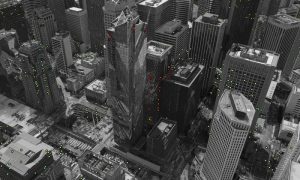
Data from the Sentinel-1 satellites acquired between 22 February 2015 and 20 September 2016 show that Millennium Tower in San Francisco is sinking by about 40 mm a year in the ‘line of sight’ – the direction that the satellite is ‘looking’ at the building. This translates into a vertical subsidence of almost 50 mm a year, assuming no tilting. The coloured dots represent targets observed by the radar. The colour scale ranges from 40 mm a year away from radar (red) to 40 mm a year towards radar (blue). Green represents stable targets. Credit: Contains modified Copernicus Sentinel data (2015–16) / ESA SEOM INSARAP study / PPO.labs / Norut / NGU
The Sentinel-1 satellites have shown that the Millennium Tower skyscraper in the centre of San Francisco is sinking by a few centimetres a year. Studying the city is helping scientists to improve the monitoring of urban ground movements, particularly for subsidence hotspots in Europe.
Completed in 2009, the 58-storey Millennium Tower has recently been showing signs of sinking and tilting. Although the cause has not been pinpointed, it is believed that the movements are connected to the supporting piles not firmly resting on bedrock.
To probe these subtle shifts, scientists combined multiple radar scans from the Copernicus Sentinel-1 twin satellites of the same area to detect subtle surface changes – down to millimetres. The technique works well with buildings because they better reflect the radar beam.
It is also useful for pinpointing displacement hotspots over large areas, thanks to Sentinel-1’s broad coverage and frequent visits.
Working with ESA, the team from Norut, PPO.labs and Geological Survey of Norway have also mapped other areas in the wider San Francisco Bay Area that are moving. These include buildings along the earthquake-prone Hayward Fault, as well as subsidence of the newly reclaimed land in the San Rafael Bay.
An uplift of the land was detected around the city of Pleasanton, possibly from the replenishment of groundwater following a four-year drought that ended in 2015.
European cities experience similar subsidence, and the San Francisco study is helping because it contains a multitude of features.
For example, the area around Oslo’s train station in Norway is reclaimed land. Newer buildings, such as the nearby opera house, have proper foundation into bedrock, but the older parts of the station experience severe subsidence.
“Experience and knowledge gained within the ESA’s Scientific Exploitation of Operational Missions programme give us strong confidence that Sentinel-1 will be a highly versatile and reliable platform for operational deformation monitoring in Norway, and worldwide,” noted John Dehls from the Geological Survey of Norway.
The studies of San Francisco and Oslo are paving the way for moving from targeted case studies to a nationwide or even continental-scale land deformation service.
“The Copernicus Sentinel-1 mission is, for the first time, making it possible to launch operational national deformation mapping services,” said Dag Anders Moldestad from the Norwegian Space Centre.
The open data policy and regular coverage plan of Copernicus promise cost-efficient and reliable services.
“In Norway, we have already initiated a framework project to provide nationwide basic deformation products to the public, with a free and open data policy. Many other countries in Europe are also working towards setting up similar services,” noted Dr Moldestad.
The Sentinel-1 twins provide ‘radar vision’ for Europe’s Copernicus environment monitoring programme. In addition to watching land movements, they feed numerous other services for monitoring Arctic sea ice, routine sea-ice mapping, surveillance of the marine environment, mapping for forest, water and soil management, and mapping to support humanitarian aid and crisis situations.