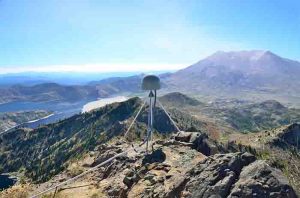
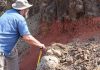
A GPS station near Mount St. Helens in September 2014. Credit: Mike Gottlieb/UNAVCO
Stock traders have long used specialized trackers to decide when to buy or sell a stock, or when the market is beginning to make a sudden swing. A new University of Washington study finds that the same technique can be used to detect gradual movement of tectonic plates, what are called “slow slip” earthquakes. These movements do not unleash damaging amounts of seismic energy, but scientists are just beginning to understand how they may be linked to the Big One.
A new technique can quickly pinpoint slow slips from a single Global Positioning System station. It borrows the financial industry’s relative strength index , a measure of how quickly a stock’s price is changing, to detect slow slips within a string of GPS observations.
The paper was published in December in the Journal of Geophysical Research: Solid Earth.
“I’ve always had an interest in finance, and if you go to any stock ticker website there’s all these different indicators,” said lead author Brendan Crowell, a UW research scientist in Earth and space sciences. “This particular index stood out in its ease of use, but also that it needed no information — like stock volume, volatility or other terms — besides the single line of data that it analyzes for unusual behavior.”
The study tests the method on more than 200 GPS stations that recorded slow slips between 2005 and 2016 along the Cascadia fault zone, which runs from northern California up to northern Vancouver Island.
“Looking at the Cascadia Subduction Zone — which is the most-studied slow slip area in the world — was a good way to validate the methodology,” Crowell said.
The results show that this simple technique’s estimates for the size, duration and travel distance for major slow slip events match the results of more exhaustive analyses of observations along the fault.
Discovered in the early 2000s, slow slips are a type of silent earthquake in which two plates slip harmlessly past one another over weeks or months. In Cascadia the slipping runs backward from the typical motion along the fault. A slow slip slightly increases the chance of a larger earthquake. It also may be providing clues, which scientists don’t yet know how to decipher, to what is happening in the physics at the plate boundary.
Regular earthquake monitoring relies on seismometers to track the shaking of the ground. That doesn’t work for slow slips, which do not release enough energy to send waves of energy through the Earth’s crust to reach seismometers.
Instead, detection of slow slips relies on GPS data.
“If you don’t have much seismic energy, you need to measure what’s happening with something else. GPS is directly measuring the displacement of the Earth,” Crowell said.
At GPS stations, the same type of sensors used in smartphones are secured to steel pipes that are cemented at least 35 meters (115 feet, or about 10 stories) into solid rock. By minimizing the noise, these stations can detect millimeter-scale changes in position at the surface, which can be used to infer movement deep underground.
Using these data to detect slow slips currently means comparing different GPS stations with complex data processing. But thanks to the efforts of stock traders who want to know quickly whether to buy or sell, the new paper shows that the relative strength index can detect a slow slip from a single one of the 213 GPS stations along the Cascadia Subduction Zone.
The initial success suggests the method could have other geological applications.
“I want to be able to use this for things beyond slow slip,” Crowell said. “We might use the method to look at the seismic effects of groundwater extraction, volcanic inflation and all kinds of other things that we may not be detecting in the GPS data.”
The technique could be applied in places that are not as well studied as the Pacific Northwest, where geologic activity is already being closely monitored.
“This works for stations all over the world — on islands, or areas that are pretty sparsely populated and don’t have a lot of GPS stations,” Crowell said.
In related research, Crowell has used an Amazon Catalyst grant to integrate GPS, or geodetic, data into the ShakeAlert earthquake alert system. For really big earthquakes, detecting the large, slow shaking is not as accurate for pinpointing the source and size of the quake. It’s more accurate to use GPS to detect how much the ground has actually moved. Tracking ground motion also improves tsunami warnings. Crowell has used the grant to integrate the GPS data into the network’s real-time alerts, which are now in limited beta testing.
Reference:
Brendan W. Crowell, Yehuda Bock, Zhen Liu. Single-station automated detection of transient deformation in GPS time series with the relative strength index: A case study of Cascadian slow slip. Journal of Geophysical Research: Solid Earth, 2016; 121 (12): 9077 DOI: 10.1002/2016JB013542
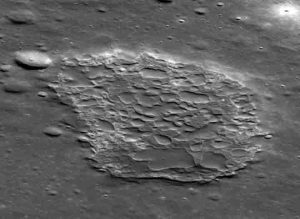
The feature known as Ina, as seen by NASA’s Lunar Reconnaissance Orbiter, was likely formed by an eruption of fluffy ‘magmatic foam,’ new research shows. Credit: NASA/GSFC/ASU
While orbiting the Moon in 1971, the crew of Apollo 15 photographed a strange geological feature — a bumpy, D-shaped depression about two miles long and a mile wide — that has fascinated planetary scientists ever since. Some have suggested that the feature, known as Ina, is evidence of a volcanic eruption Moon within the past 100 million years — a billion years or so after most volcanic activity on the Moon is thought to have ceased.
But new research led by Brown University geologists suggests that Ina is not so young after all. The analysis, published in the journal Geology, concludes that the feature was actually formed by an eruption around 3.5 billion years ago, around the same age as the dark volcanic deposits we see on the Moon’s nearside. It’s the peculiar type of lava that erupted from Ina that helps hide its age, the researchers say.
“As interesting as it would be for Ina to have formed in the recent geologic past, we just don’t think that’s the case,” said Jim Head, co-author of the paper and professor in Brown’s Department of Earth, Environmental and Planetary Sciences. “The model we’ve developed for Ina’s formation puts it firmly within the period of peak volcanic activity on the Moon several billion years ago.”
Youthful appearance
Ina sits near the summit of a gently sloped mound of basaltic rock, leading many scientists to conclude that it was likely the caldera of an ancient lunar volcano. But just how ancient wasn’t clear. While the flanks of the volcano look billions of years old, the Ina caldera itself looks much younger. One sign of youth is its bright appearance relative to its surroundings. The brightness suggests Ina hasn’t had time to accumulate as much regolith, the layer of loose rock and dust that builds up on the surface over time.
Then there are Ina’s distinctive mounds — 80 or so smooth hills of rock, some standing as tall as 100 feet, which dominate the landscape within the caldera. The mounds appear to have far fewer impact craters on them compared to the surrounding area, another sign of relative youth. Over time, it’s expected that a surface should accumulate craters of various sizes at fairly constant rates. So scientists use the number and size of craters to estimate the relative age of a surface. In 2014, a team of researchers did a careful crater-count on Ina’s mounds and concluded that they must have been formed by lava that erupted to the surface within the last 50 to 100 million years.
“That was a really puzzling finding,” Head said. “I think most people agree that the volcano Ina sits on was formed billions of years ago, which means there would have been a pause in volcanic activity for a billion years or more before the activity that formed Ina. We wanted to see if there might be something about geologic structure within Ina that throws off our estimation of its age.”
Not so young?
The researchers looked at well-studied volcanoes on Earth that might be similar to Ina. Ina appears to be a pit crater on a shield volcano, a gently sloping mountain similar to the Kilauea volcano in Hawaii. Kilauea has a pit crater similar to Ina known as the Kilauea Iki crater, which erupted in 1959.
As lava from that eruption solidified, it created a highly porous rock layer inside the pit, with underground vesicles as large as three feet in diameter and surface void space as deep as two feet. That porous surface, Head and his colleagues say, is created by the nature of the lava erupted in the late stages of events like this one. As the subsurface lava supply starts to diminish, it erupts as “magmatic foam” — a bubbly mixture of lava and gas. When that foam cools and solidifies, it forms the highly porous surface.
The researchers suggest that an Ina eruption would have also produced magmatic foam. And because of the Moon’s decreased gravity and nearly absent atmosphere, the lunar foam would have been even fluffier than on Earth, so it’s expected that the structures within Ina are even more porous than on Earth.
It’s the high porosity of those surfaces that throws off date estimates for Ina, both by hiding the buildup of regolith and by throwing off crater counts.
A highly porous surface, the researchers say, would allow loose rock and dust to filter into surface void space, making it appear as though less regolith has built up. That process would be perpetuated by seismic shaking in the region, much of which is caused by ongoing meteor impacts. “It’s like banging on the side of a sieve to make the flour go through,” Head said. “Regolith is jostled into holes rather than sitting on the surface, which makes Ina look a lot younger.”
Porosity could also skew crater counts. Laboratory experiments using a high-speed projectile cannon have shown that impacts into porous targets make much smaller craters. Because of Ina’s extreme porosity, the researchers say, its craters are much smaller than they would normally be, and many craters might not be visible at all. That could drastically alter the age estimate derived from crater counts.
The researchers estimate that the porous surface would reduce by a factor of three the size of craters on Ina’s mounds. In other words, an impactor that would make a 100-foot-diameter crater in lunar basalt bedrock would make a crater of a little over 30 feet in a foam deposit. Taking that scaling relationship into account, the team gets a revised age for the Ina mounds of about 3.5 billion year old. That’s similar to the surface age of the volcanic shield that surrounds Ina, and places the Ina activity within the timeframe of common volcanism on the Moon.
The researchers believe this work offers a plausible explanation for Ina’s formation without having to invoke the puzzling billion-year pause in volcanic activity.
“We think the young-looking features in Ina are the natural consequence of magmatic foam eruptions on the Moon,” Head said. “These landforms created by these foams simply look a lot younger than they are.”
Reference:
Le Qiao, James Head, Lionel Wilson, Long Xiao, Mikhail Kreslavsky, Josef Dufek. Ina pit crater on the Moon: Extrusion of waning-stage lava lake magmatic foam results in extremely young crater retention ages. Geology, 2017; G38594.1 DOI: 10.1130/G38594.1
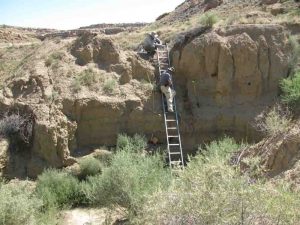
UC Professor Nick Dunning (on ladder) records alluvial stratigraphy in a Chaco Canyon arroyo while UC Professor Vern Scarborough looks on. Credit: University of Cincinnati
Tucked away in a laboratory in University of Cincinnati’s Braunstein Hall are tubes of rock and dirt that quietly tell a story—a story that looks back on ancient society’s early water conservation. UC researchers hope the story will aid in the future preservation of our planet’s most precious resource.
In an effort to help manage the world’s water supply more efficiently, an interdisciplinary team of University of Cincinnati researchers from the departments of anthropology, geography and geology have climbed through rainforests, dug deep under arid deserts and collaborated with scientists around the world to look at how ancient humans manipulated their environment to manage water.
“We begin by asking, ‘What is water to humans, how do we engage with it and how does the environment engage us?” asks Vernon Scarborough, professor and department head in UC’s Department of Anthropology. “When we look at the trajectory of our changing climate, we realize that the issue is not just climate change but also water change. Climate and water work synergistically and can affect one another in critical ways.
“Given the current climate patterns, in this and the next century, we will likely face further rising sea levels, less potable water and a compromised availability of freshwater as a result of drought in many areas and unusually heavy rains and runoff in others.
“So we are looking at how the past can inform the present,” adds Scarborough.
High-tech collaboration
To face future sustainability and water management issues, UC’s interdisciplinary team of real-world “Indiana Jones” employ modern technology to peek inside ancient irrigation communities in obscure places around the globe like the arid American Southwest and humid rainforests in Central America and Southeast Asia.
“The point of these projects is to help, in part, create effective modern water policy,” says Scarborough, who also works closely with the United Nations Educational, Scientific and Cultural Organization (UNESCO). “Exploring all these unique points on the globe is the only way we’re going to get at it, and it’s our teamwork, communication and cooperation that will make this project so successful.”
As a result of their collaboration, several members of UC’s research team will be presenting the outcome of their field work at one or both of two upcoming prestigious scientific annual meetings: the 77th annual Society for Applied Science meeting in Santa Fe, New Mexico, and the 82nd annual Society for American Archaeology meeting in Vancouver, British Columbia, Canada. Both are meeting this week.
For more than two decades, the researchers worked intricately together in remote areas that are known for their seasonal water and environmental challenges. One core investigation lies deep in the ancestral Puebloan community in Chaco Canyon, New Mexico—the ancestors of modern Puebloans that thrived for more than 300 years in a dry desert in the middle of the American Southwest.
Scientists have long debated whether this area was truly a sustainable thriving community based on local resource access or an occasional gathering spot for ceremonial rituals dependent on importing food and related supplies.
To create a comprehensive snapshot for how ancestral Native American Puebloans managed water and survived in the ancient desert, UC’s research team used aerial surface imaging technology, mass spectrometry and geochemical soil sampling, as well as anthropological behavioral and DNA studies and soil excavations around ancient structures to help shed significant light on that mystery.
In the field
Nicholas Dunning and Christopher Carr, both UC professors of geography, looked broadly at the geographic area documenting and sampling the stratified layers of rock and sediment, while Lewis Owen, also a UC professor of geology, used optical-stimulated luminescence, a unique technique to accurately determine the age of core sand and soil samples.
“We found geochemical evidence for corn grown in the area during this time, which is a very water-intensive crop, as well as sophisticated irrigation and water-management techniques,” says Kenneth Tankersley, UC associate professor of anthropology and geology.
To get a 3-D look at the surface of the canyon, Carr used sophisticated LIDAR technology, or light, imaging, detection and ranging technology, to measure the surface elevation of the ground from an airplane.
“This technology uses a laser beam to measure the morphology of the surface and is totally revolutionizing archaeology,” says Carr. “The key thing LIDAR gives us is elevation so we know how the water flows off the mesa tops into the drainage ditches and into the valley floors.
“LIDAR ultimately tells the archaeologists where to excavate and look for evidence of agriculture, canals and water control gates beneath the surface.”
Salty survival
To uncover the thousand-year-old secrets for survival held in the geochemical deep core soil samples, Tankersley, along with Owen and Warren Huff, UC professor of geology, employed laboratory sampling techniques to reveal that the high level of salt in the soil—once thought by scientists to be harmful—was in fact a form of a calcium sulfate mineralization that may have functioned to enhance the soil for the maize (corn) grown in that area.
“The surrounding mesas provided water in their springs after the snow melted,” says Tankersley. “During the rainy season when floodwaters hit, the Puebloans would capture runoff water from small canyons known as the rincons and local periodic streams such as Chaco Wash and Escavada Wash.”
The researchers consider this strategy a reflection of risk aversion. “When it rained in one spot over here the Ancestral Puebloans took advantage of it, and when it rained over there they took advantage of that,” Scarborough says.
Under this expeditious use of landscape, two key members of the Chaco water management project, Stephen Plog, professor of archaeology from the University of Virginia, and Adam Watson at the American Museum of Natural History were also part of the collaborative team that utilized DNA sampling techniques on human remains to reveal a remarkable matrilineal family line connected through the female lineage.
“To effectively manage water requires flexibility and creativity as rainfall is unpredictable in the Southwest,” says Samantha Fladd, an advanced doctoral student from the University of Arizona, also working on the Chaco project here at UC. “The presence of a hierarchical matriline helps to explain how Chaco residents coordinated these activities in order to practice successful water management and agriculture.”
No forests, no rain
In contrast to Chaco Canyon’s desert aridity many of the researchers also spent a significant amount of time in the Guatemalan rainforests around Tikal—a Central American site that coexisted at about the same time as Chaco Canyon more than a thousand years ago.
While the two environments couldn’t be more opposite in climate the researchers found Tikal’s water issues just as challenging. David Lentz, UC professor of biology, with the assistance of Scarborough, Huff, Tankersley, Carr, Owen and NSF-funded Dunning, discovered how the Maya civilization survived in Tikal after suffering several droughts.
“Similar to Chaco Canyon, we found geochemical evidence for corn fields situated in specific environmental niches at Tikal,” says Dunning.
Scarborough speculates the Maya channeled runoff during the rainy season and created elaborate water storage systems, allowing their civilization to thrive for more than three centuries. Eventually the Maya not only suffered from a changing climate, but they had added to their own demise, say the researchers.
“Essentially, they may have affected a change in their own climate,” says Scarborough. “After several years of deforestation—clearing out trees and forests to make room for crops—the Maya unintentionally, but perhaps dramatically upset their annual rainfall, which precipitated degrees of drought that ultimately forced them to abandon the once fertile environment. Sound familiar?”
With recent funding by the National Science Foundation, Dunning, along with Scarborough and other researchers, will spend a fifth season this summer as a co-principal investigator on the Yaxnohcah project along with Carr and four UC students. The focus of this study looks at the development of ancient urbanism in relation to water, land and forest management in the Maya lowlands and will be a presentation topic by Dunning and by Carr at the upcoming annual Society for American Archaeology meeting in Vancouver.
It takes a village
“Our collaborative research as a team is critical—each one of us is an important cog in this investigation,” says Scarborough. “It takes each one of us and our individual expertise to effectively measure how well these early urban and rural communities adapted to climate change and managed their water resources.”
“We still have to deal with those same issues in our environment today. From an archaeological perspective, our changing climate is immediate, but it may be several years before the damage is fully apparent at a truly global scale,” Scarborough adds.
“We will begin to see sea levels rise by a good meter. Because over two-thirds of the largest cities on the planet occupy coastal margins, with estimates suggesting that an anticipated 80 percent of human population will gravitate toward urban settings in the near term, we really are approaching a truly ‘perfect storm.'”
While the researchers look at future water management as the direction of this research, they also focus on the constant changes to the landscape and the creatures that occupy these environments. Scarborough adds that If we are not careful, we will instigate even further change to a wide array of plant and animal species all over the world.
“If you don’t design for that appropriately, you can be building management networks and ways to capture and control water that will wind up getting buried like the build-up behind modern dams, or plans can get abandoned altogether as a river changes,” say Scarborough and Jon-Paul McCool, UC doctoral student under Dunning’s mentorship.
“How past populations dealt with variable precipitation like that identified at Tikal, Chaco Wash or drainage patterns overall has been very dynamic. Such investments in building massive dam projects today is a costly expenditure of money and time that might well benefit from views of the past.
“We don’t want to waste that money on high-priced water infrastructure if we can engage in smaller scale, lower investment strategies like our ancestors did.”
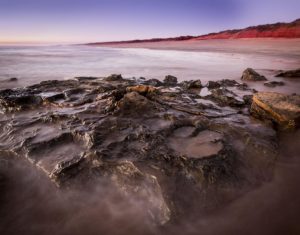
Dinosaur tracks in the Walmadany area are shown. Credit: Damian Kelly
An unprecedented 21 different types of dinosaur tracks have been identified on a 25-kilometre stretch of the Dampier Peninsula coastline dubbed “Australia’s Jurassic Park.”
A team of palaeontologists from The University of Queensland’s School of Biological Sciences and James Cook University’s School of Earth and Environmental Sciences braved sharks, crocodiles, massive tides and the threat of development to unveil the most diverse assemblage of dinosaur tracks in the world in 127 to 140 million-year-old rocks in the remote Kimberley region of Western Australia.
Lead author Dr Steve Salisbury said the diversity of the tracks around Walmadany (James Price Point) was globally unparalleled and made the area the “Cretaceous equivalent of the Serengeti.”
“It is extremely significant, forming the primary record of non-avian dinosaurs in the western half the continent and providing the only glimpse of Australia’s dinosaur fauna during the first half of the Early Cretaceous Period,” Dr Salisbury said.
“It’s such a magical place — Australia’s own Jurassic Park, in a spectacular wilderness setting.”
In 2008, the Western Australian Government selected Walmadany as the preferred site for a $40 billion liquid natural gas processing precinct.
The area’s Traditional Custodians, the Goolarabooloo people, contacted Dr Salisbury and his team, who dedicated more than 400 hours to investigating and documenting the dinosaur tracks.
“We needed the world to see what was at stake,” Goolarabooloo Law Boss Phillip Roe said.
The dinosaur tracks form part of a song cycle that extends along the coast and then inland for 450 km, tracing the journey of a Dreamtime creator being called Marala, the Emu man.
“Marala was the Lawgiver. He gave country the rules we need to follow. How to behave, to keep things in balance,” Mr Roe said said.
“It’s great to work with UQ researchers. We learnt a lot from them and they learnt a lot from us.”
Dr Salisbury said the surrounding political issues made the project “particularly intense,” and he was relieved when National Heritage listing was granted to the area in 2011 and the gas project collapsed in 2013.
“There are thousands of tracks around Walmadany. Of these, 150 can confidently be assigned to 21 specific track types, representing four main groups of dinosaurs, ” Dr Salisbury said.
“There were five different types of predatory dinosaur tracks, at least six types of tracks from long-necked herbivorous sauropods, four types of tracks from two-legged herbivorous ornithopods, and six types of tracks from armoured dinosaurs.
“Among the tracks is the only confirmed evidence for stegosaurs in Australia. There are also some of the largest dinosaur tracks ever recorded. Some of the sauropod tracks are around 1.7 m long.”
“Most of Australia’s dinosaur fossils come from the eastern side of the continent, and are between 115 and 90 million years old. The tracks in Broome are considerably older.”
The research has been published as the 2016 Memoir of the Society of Vertebrate Paleontology.
Reference:
Steven W. Salisbury, Anthony Romilio, Matthew C. Herne, Ryan T. Tucker, Jay P. Nair. The Dinosaurian Ichnofauna of the Lower Cretaceous (Valanginian–Barremian) Broome Sandstone of the Walmadany Area (James Price Point), Dampier Peninsula, Western Australia. Journal of Vertebrate Paleontology, 2017; 36 (sup1): 1 DOI: 10.1080/02724634.2016.1269539
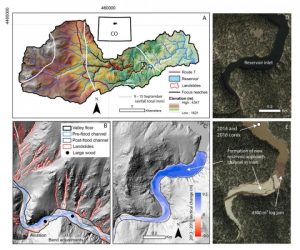
Flood impacts in the North St. Vrain Creek catchment, northern Colorado, USA. Credit: Images in D and E are from Google Earth™
Sara Rathburn of Colorado State University and colleagues have developed an integrated sediment, wood, and organic carbon budget for North St. Vrain Creek in the semi-arid Colorado Front Range following an extreme flooding event in September of 2013. Erosion of more than 500,000 cubic meters, or up to ~115-years-worth of weathering products, occurred through landsliding and channel erosion during this event.
More than half of the eroded sediment was deposited at the inlet and delta of a water supply reservoir, resulting in the equivalent of 100 years of reservoir sedimentation and 2% loss in water storage capacity. The flood discharged 28 mega-grams of carbon from one square kilometer of land (28 Mg C/km2), which is more like what would happen in humid, tectonically active areas.
To get an idea of what that means, Rathburn explains, a mega-gram of carbon (C) eroded from one square kilometer of land is equivalent to about a million paper clips covering an 18-hole golf course. So in this scenario, the flood discharged 28 million paper clips from just a golf course-sized area.
Post-flood remobilization resulted in a further ~100-years-worth of reservoir sedimentation plus export of an additional 1.3 mega-grams of carbon per square kilometer (1.3 Mg C/km2) of wood. Pronounced channel widening during the flood created accommodation space for 40% of flood sediment and storage of wood and eroded carbon. Confined channels, normally dismissed as transport reaches, can store and export substantial amounts of flood constituents.
The results of this study by Rathburn and colleagues indicate that many flood-affected Colorado Front Range rivers will export sediment, wood, and carbon for years to come, posing ongoing challenges for water-supply management, with implications for terrestrial carbon cycling.
Reference:
S.L. Rathburn et al. The fate of sediment, wood, and organic carbon eroded during an extreme flood, Colorado Front Range, USA. Geology, March 2017 DOI: 10.1130/G38935.1
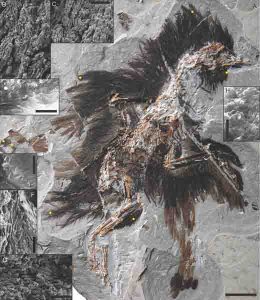
In a new paper published in National Science Review, a team of scientists from the Institute of Vertebrate Paleontology and Paleoanthropology, the Shandong Tianyu Museum of Nature, and the Nanjing Institute of Geology and Paleontology (all in China) described the most exceptionally preserved fossil bird discovered to date.
The new specimen from the rich Early Cretaceous Jehol Biota (approximately 131 to 120 million years old) is referred to as Eoconfuciusornis, the oldest and most primitive member of the Confuciusornithiformes, a group of early birds characterized by the first occurrence of an avian beak. Its younger relative Confuciusornis is known from thousands of specimens but this is only the second specimen of Eoconfuciusornis found. This species comes only from the 130.7 Ma Huajiying Formation deposits in Hebei, which preserves the second oldest known fossil birds. Birds from this layer are very rare.
This new specimen of Eoconfuciusornis, housed in the Shandong Tianyu Museum of Nature, in Eastern China, is a female. The ovary reveals developing yolks that vary in size, similar to living birds. This suggests that confuciusornithiforms evolved a period of rapid yolk deposition prior to egg-laying (crocodilians, which are archosaurs like birds, deposit yolks slowly in all eggs for months with no period of rapid yolk formation), which is indicative of complex energetic profiles similar to those observed in birds.
This means Eoconfuciusornis and its kin, like living birds, was able to cope with extremely high metabolic demands during early growth and reproduction (whereas energetic demands in crocodiles are even, lacking complexity). In contrast, other Cretaceous birds including the more advanced group the Enantiornithes appear to have lower metabolic rates and have required less energy similar to crocodilians and non-avian dinosaurs (their developing yolks show little size disparity indicating no strong peak in energy associated with reproduction, and much simpler energetic profiles, limited by simpler physiologies).
Traces of skin indicate that the wing was supplemented by flaps of skin called patagia. Living birds have numerous wing patagia that help the bird to fly. This fossil helps show how bird wings evolved. The propatagium (the flap of skin that connects the shoulder and wrist) and postpatagium (the flap of skin that extends off the back of the hand and ulna) evolved before the alular patagium (the flap of skin connecting the first digit to the rest of the hand), which is absent in Eoconfuciusornis. Even more unique is the preservation of the internal structure of the propatagium which reveal a collagenous network identical to that in living birds. This internal network gives the skin flap its shape, allowing it to generate aerodynamic lift and aid the bird in flight.
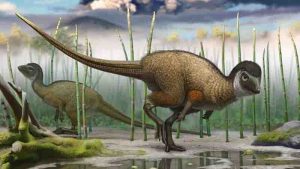
The nearly complete plumage preserves remnants of the original plumage pattern, revealing the presence of spots on the wings and the earliest documentation of sexual differences in plumage within birds. This new specimen suggests that female Eoconfuciusornis were smaller than males and lacked tail feathers, similar to many sexually dimorphic living birds and the younger Confuciusornis in which the plumage of the males and females are different from each other. Samples of the feathers viewed under a microscope reveal differences in color characteristics, allowing scientists to reconstruct the plumage. Female Eoconfuciusornis had black spotted wings and gray body with a red throat patch.
Researchers have not found fossils from any other bird from the Jehol period that reveal so many types of soft tissue (feathers, skin, collagen, ovarian follicles). These remains allow researchers to create the most accurate reconstruction of a primitive early bird (or dinosaur) to date. This information provides better understanding of flight function in the primitive confuciusornithiforms and of the evolution of advanced flight features within birds.
“This new fossil is incredible,” said co-author Dr. Jingmai O’Connor. “With the amount of information we can glean from this specimen we can really bring this ancient species to life. We can understand how it grew, flew, reproduced, and what it looked like. Fossils like this one from the Jehol Biota continue to revolutionize our understanding of early birds.”
Reference:
Xiaoting Zheng, Jingmai K. O’Connor, Xiaoli Wang, Yanhong Pan, Yan Wang, Min Wang, Zhonghe Zhou. Exceptional preservation of soft tissue in a new specimen of Eoconfuciusornis and its biological implications. National Science Review, 2017; DOI: 10.1093/nsr/nwx004
David Grossnickle, Committee on Evolutionary Biology, UChicago. Credit: University of Chicago Medical Center
You probably haven’t given much thought to how you chew, but the jaw structure and mechanics of almost all modern mammals may have something to do with why we’re here today. In a new paper published this week in Scientific Reports, David Grossnickle, a graduate student in the Committee on Evolutionary Biology at the University of Chicago, proposes that mammal teeth, jaw bones and muscles evolved to produce side-to-side motions of the jaw, or yaw, that allowed our earliest ancestors to grind food with their molars and eat a more diversified diet. These changes may have been a contributing factor to their survival of the mass extinction at the end of the Cretaceous Period 66 million years ago.
The terms “pitch” and “yaw” usually describe movements of airplanes, but biologists also use them to describe basic movements of body parts such as the jaw. Pitch rotation results in basic up and down movement, and yaw rotation results in side-to-side, crosswise motion (think of a cow munching away on some grass). Almost all modern mammals, including placental mammals, like humans and deer, and marsupials, like kangaroos and opossums, share similarities in their jaw structures and musculature that allow for both pitch and yaw movements. This allows mammals to have especially diverse diets today, from cutting pieces of meat to grinding tough plants and vegetables. For early mammals, these characteristics meant they could be more resourceful during tough times.
“If you have a very specialized diet you’re more likely to perish during a mass extinction because you’re only eating one thing,” Grossnickle said. “But if you can eat just about anything and 90 percent of your food goes away, you can still live on scraps.”
Using 2D images of early mammal fossils from previous publications and 3D data collected from modern specimens at the Field Museum, Grossnickle analyzed the structure of teeth, jaw bones, and how the muscles that control them were attached to the skull. He saw that as species began to develop a projection on the upper molars that fit into a corresponding cup or basin on their lower counterparts, the musculature of the jaw also changed to provide greater torque for side-to-side yaw movements. This way the animal could grind its food between the molars like a mortar and pestle, as opposed to cutting it with simple up and down pitch movements.
Grossnickle, who works in the lab of Zhe-Xi Luo, PhD, professor of organismal biology and anatomy, studies the early origins of mammals, and is interested in broader questions about why certain mammal groups have diversified through time and survived extinction events. He says the adaptations of the jaws and teeth may have been key.
“Mammals rebounded from those events and kept diversifying and persisting, and that’s one of my interests. Why are we in the Age of Mammals, not still in the Age of Dinosaurs?” he said. “This study begins to address that question from a functional perspective, looking at what changes occurred that might’ve given some mammals functional or dietary advantages over other groups.”
Reference:
David M. Grossnickle, The evolutionary origin of jaw yaw in mammals, Scientific Reports (2017). DOI: 10.1038/srep45094
More than a century of theory about the evolutionary history of dinosaurs has been turned on its head following the publication of new research from scientists at the University of Cambridge and Natural History Museum in London. Their work suggests that the family groupings need to be rearranged, re-defined and re-named and also that dinosaurs may have originated in the northern hemisphere rather than the southern, as current thinking goes.
For 130 years palaeontologists have been working with a classification system in which dinosaur species have been placed in to two distinct categories: Ornithischia and Saurischia. But now, after careful analysis of dozens of fossil skeletons and tens of thousands of anatomical characters, the researchers have concluded that these long-accepted familial groupings may, in fact, be wrong and that the traditional names need to be completely altered.
The classification of dinosaurs dates back to Victorian times. Dinosaurs were first recognised as a unique group of fossil reptiles in 1842 as a result of the work of the anatomist, Professor Richard Owen (who later went on to found the Natural History Museum in London). Over subsequent decades, various species were named as more and more fossils were found and identified. During the latter half of the 19th century it was realised that dinosaurs were anatomically diverse and attempts were made to classify them into groups that shared particular features.
It was Harry Govier Seeley, a palaeontologist trained in Cambridge under the renowned geologist Adam Sedgwick, who determined that dinosaurs fell quite neatly into two distinct groupings, or clades; Saurischia or Ornithischia. This classification was based on the arrangement of the creatures’ hip bones and in particular whether they displayed a lizard-like pattern (Saurischia) or a bird-like one (Ornithischia).
As more dinosaurs were described it became clear that they belonged to three distinct lineages; Ornithischia, Sauropodomorpha and Theropoda. In 1887 Seeley placed the sauropodomorphs (which included the huge ‘classic’ dinosaurs such as Diplodocus and Brontosaurus) together with the theropods (which included T. rex), in the Saurischia. The ornithischians and saurischians were at first thought to be unrelated, each having a different set of ancestors, but later study showed that they all evolved from a single common ancestor.
This new analysis of dinosaurs and their near relatives, published today in the journal Nature, concludes that the ornithischians need to be grouped with the theropods, to the exclusion of the sauropodomorphs. It has long been known that birds (with their obviously ‘bird-like’ hips) evolved from theropod dinosaurs (with their lizard-like hips). However, the re-grouping of dinosaurs proposed in this study shows that both ornithischians AND theropods had the potential to evolve a bird-like hip arrangement- they just did so at different times in their history.
Lead author, Matthew Baron, says: “When we started our analysis, we puzzled as to why some ancient ornithischians appeared anatomically similar to theropods. Our fresh study suggested that these two groups were indeed part of the same clade. This conclusion came as quite a shock since it ran counter to everything we’d learned.”
“The carnivorous theropods were more closely related to the herbivorous ornithischians and, what’s more, some animals, such as Diplodocus, would fall outside the traditional grouping that we called dinosaurs. This meant we would have to change the definition of the ‘dinosaur’ to make sure that, in the future, Diplodocus and its near relatives could still be classed as dinosaurs.”
The revised grouping of Ornithischia and Theropoda has been named the Ornithoscelida which revives a name originally coined by the evolutionary biologist, Thomas Henry Huxley in 1870.
Co-author, Dr David Norman, of the University of Cambridge, says: “The repercussions of this research are both surprising and profound. The bird-hipped dinosaurs, so often considered paradoxically named because they appeared to have nothing to do with bird origins, are now firmly attached to the ancestry of living birds.”
For 130 years palaeontologists have considered the phylogeny of the dinosaurs in a certain way. Our research indicates they need to look again at the creatures’ evolutionary history. This is simply science in action. You draw conclusions from one body of evidence and then new data or theories present themselves and you have to suddenly reconsider and adapt your thinking. All the major textbooks covering the topic of the evolution of the vertebrates will need to be re-written if our suggestion survives academic scrutiny.”
While analysing the dinosaur family trees the team arrived at another unexpected conclusion. For many years, it was thought that dinosaurs originated in the southern hemisphere on the ancient continent known as Gondwana. The oldest dinosaur fossils have been recovered from South America suggesting the earliest dinosaurs originated there. But as a result of a re-examination of key taxa it’s now thought they could just as easily have originated on the northern landmass known as Laurasia, though it must be remembered that the continents were much closer together at this time.
Co-author, Prof Paul Barrett, of the Natural History Museum, says: “This study radically redraws the dinosaur family tree, providing a new framework for unravelling the evolution of their key features, biology and distribution through time. If we’re correct, it explains away many prior inconsistencies in our knowledge of dinosaur anatomy and relationships and it also highlights several new questions relating to the pace and geographical setting of dinosaur origins.”
Reference:
Matthew G. Baron, David B. Norman, Paul M. Barrett. A new hypothesis of dinosaur relationships and early dinosaur evolution. Nature, 2017; 543 (7646): 501 DOI: 10.1038/nature21700
Note: The above post is reprinted from materials provided by University of Cambridge. The original story is licensed under a Creative Commons License.
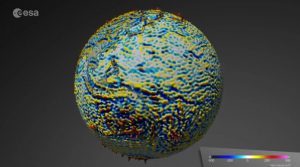
Satellites have been mapping the upper part of the Earth magnetic field by collecting data for three years and found some amazing features about the Earth’s crust. The result is the release of highest resolution map of this field seen from space to date. This ‘lithospheric magnetic field’ is very weak and therefore difficult to detect and map from space. But with the Swarm satellites it has been possible.
“By combining Swarm measurements with historical data from the German CHAMP satellite, and using a new modelling technique, it was possible to extract the tiny magnetic signals of crustal magnetization with unprecedented accuracy,” said professor Nils Olsen from the Technical University of Denmark (DTU), one of the team of scientists behind the new map that has just been released at a Swarm Science Meeting in Banff, Canada.
Most of the Earth magnetic field is generated at depths greater than 3000 km by the movement of molten iron in the outer core. The remaining 6 percent — including the ‘lithospheric magnetic field’ — is partly due to electrical currents in space surrounding Earth, and partly due to magnetised rocks in the upper lithosphere — the rigid outer part of Earth, consisting of the crust and upper mantle.
Swarm is a constellation of three identical satellites launched by the European Space Agency (ESA) to track and study the Earth’s magnetic field.
Possible meteorite impact
The new map shows detailed variations in this field caused by geological structures in Earth’s crust. One of these anomalies occurs in Central African Republic, centred around the city of Bangui, where the magnetic field is significantly sharper and stronger. The cause for this anomaly is still unknown, but scientists speculate that it may be the result of a meteorite impact there some 540 million years ago.
Evidence of flipping poles
The new map also reveals more details about the Earth’s magnetic field that has flipped its polarity many times over the millennia. The magnetic field is in a permanent state of flux. Magnetic north wanders, and every few hundred thousand years the polarity flips so that a compass would point south instead of north.
When new crust is generated through volcanic activity, mainly along the ocean floor, iron-rich minerals in the solidifying magma are oriented towards magnetic north, thus capturing a ‘snapshot’ of the magnetic field in the state it was in when the rocks cooled.
Since magnetic poles flip back and forth over time, the solidified minerals form ‘stripes’ on the seafloor and provide a record of Earth’s magnetic history.
“These magnetic stripes are evidence of pole reversals and analysing the magnetic imprints of the ocean floor allows the reconstruction of past core field changes. They also help to investigate tectonic plate motions,” said Dhananjay Ravat from the University of Kentucky in the USA.
“The new map defines magnetic field features down to about 250 km and will help investigate geology and temperatures in Earth’s lithosphere.”
“Understanding the crust of our home planet is no easy feat. Measurements from space have great value as they offer a sharp global view on the magnetic structure of our planet’s rigid outer shell.”
Earth’s magnetic field can be thought of as a huge cocoon, protecting us from cosmic radiation and charged particles that bombard our planet in solar wind. Without it, life as we know it would not exist.
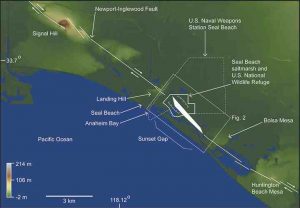
This image shows the Newport-Inglewood fault zone in Southern California and its relative location within the Seal Beach wetlands, as well as the geographic and development features of the region.
A California State University, Fullerton faculty-student study shows evidence of abrupt sinking of the wetlands near Seal Beach, Calif., caused by ancient earthquakes that shook the area at least three times in the past 2,000 years — and it could happen again, the researchers say.
The paleoseismology study reveals that the wetlands at the National Wildlife Refuge Seal Beach, a nearly 500-acre area located within the Naval Weapons Station Seal Beach and next to the communities of Seal Beach and Huntington Harbor, are susceptible to rapid lowering in elevation during large — over 7.0 magnitude — earthquakes.
“Imagine a large earthquake — and it can happen again — causing the Seal Beach wetlands to sink abruptly by up to three feet. This would be significant, especially since the area already is at sea level,” said Matthew E. Kirby, CSUF professor of geological sciences.
Kirby and colleague Brady P. Rhodes, CSUF professor emeritus of geological sciences, and CSUF alumnus Robert J. Leeper, whose master’s thesis is based on the research findings, led the study. The researchers mentored numerous CSUF geology students and collaborated with geologists and earthquake experts, including those from the U.S. Geological Survey (USGS).
The researchers’ study, “Evidence for Coseismic Subsidence Events in a Southern California Coastal Saltmarsh,” was published in Scientific Reports, an open-access, peer-reviewed Nature research journal.
Leeper, now a doctoral student in Earth sciences program at University of California, Riverside, is the lead author of the paper, and CSUF co-authors are Kirby; Rhodes; Joe Carlin, assistant professor of geological sciences; and 2016 geology graduate Angela Aranda, who for her master’s thesis analyzed sediment cores from the wetlands. Other collaborators and co-authors are Katherine Scharer and Scott Starratt of the USGS; Eileen Hemphill-Haley, consulting micropaleontologist; and Simona Avnaim-Katav and Glen MacDonald from UCLA.
Located off Pacific Coast Highway between Belmont Shores and Sunset Beach, the Seal Beach wetlands likely formed due to complex, lateral movement of the Newport-Inglewood fault, said Leeper. The wetlands straddle a segment of the fault system, which extends from Beverly Hills in the north to the San Diego region in the south.
The study identifies three previously undocumented earthquakes in the area over the past 2,000 years, noted Leeper, who earned his bachelor’s degree in 2013 and master’s degree in 2016, both in geology, at Cal State Fullerton. The last big quake to cause the land to abruptly drop occurred approximately 500 years ago, he pointed out.
“These research findings have important implications in terms of seismic hazard and risk assessment in coastal Southern California and are relevant to municipal, industrial and military infrastructure in the region,” added Leeper, a former USGS geologist whose work focused on natural hazards. He recently left the scientific agency to concentrate on his doctoral studies.
This new study stems from National Science Foundation-funded research on past occurrences of tsunamis along Southern California’s coastal wetlands that Kirby and Rhodes began in 2012. As an undergraduate, Leeper joined their study, which turned up no evidence of previous tsunamis in Orange County or the region.
Soil samples analyzed in Kirby’s lab from mud cores collected from the Seal Beach wetlands, combined with the study of microscopic fossils to identify the past environment, pointed the researchers in a new direction. The analyses revealed buried wetland surface layers, signaling evidence of sinking in the area from past massive earthquakes.
“Since that epiphany in 2013, our research evolved and has involved many other collaborators, each providing a skill or expertise that helped to develop our conclusions,” Kirby said.
CSUF’s Carlin, his students and Leeper are continuing to study the Seal Beach wetlands to further investigate potential seismic hazards, as well as the poorly understood Newport-Inglewood fault system.
“We’re looking to identify other past earthquake events in the sediment record from other cores from the wetlands,” Carlin said. “The goal is to get a better understanding of how often earthquakes may have occurred in the past, the hazards associated with this fault — and the probability of the next earthquake.”
Reference:
Robert Leeper, Brady Rhodes, Matthew Kirby, Katherine Scharer, Joseph Carlin, Eileen Hemphill-Haley, Simona Avnaim-Katav, Glen MacDonald, Scott Starratt, Angela Aranda. Evidence for coseismic subsidence events in a southern California coastal saltmarsh. Scientific Reports, 2017; 7: 44615 DOI: 10.1038/srep44615
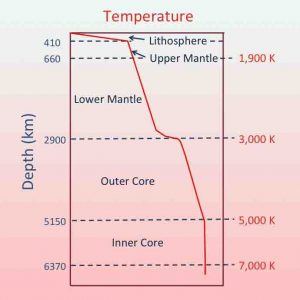
Geothermal gradient adapted from Boehler, R. (1996). Melting temperature of the Earth’s mantle and core: Earth’s thermal structure. Annual Review of Earth and Planetary Sciences, 24(1), 15–40. Credit: Bkilli1/Wikipedia
Geothermal gradient is the rate of increasing temperature with respect to increasing depth in the Earth’s interior. Away from tectonic plate boundaries, it is about 25 °C per km of depth (1 °F per 70 feet of depth) near the surface in most of the world.
Strictly speaking, geo-thermal necessarily refers to the Earth but the concept may be applied to other planets. A line tracing the gradient through the planetary body is called a geotherm on Earth and other terrestrial planets. On the Moon it is called a selenotherm.
The Earth’s internal heat comes from a combination of residual heat from planetary accretion, heat produced through radioactive decay, and possibly heat from other sources.
The major heat-producing isotopes in the Earth are potassium-40, uranium-238, uranium-235, and thorium-232. At the center of the planet, the temperature may be up to 7,000 K and the pressure could reach 360 GPa(3.6 million atm). Because much of the heat is provided by radioactive decay, scientists believe that early in Earth history, before isotopes with short half-lives had been depleted, Earth’s heat production would have been much higher. Heat production was twice that of present-day at approximately 3 billion years ago, resulting in larger temperature gradients within the Earth, larger rates of mantle convection and plate tectonics, allowing the production of igneous rocks such as komatiites that are not formed anymore today.
Last November’s magnitude 7.8 Kaikoura earthquake was so complex and unusual that it is likely to lead to changes in the way scientists think about earthquake hazards in plate boundary zones worldwide, a new study says.
Not only was it a record-setter for its complexity, but it was also one of the best recorded large earthquakes anywhere in the world. This latter feature has enabled scientists to undertake analysis in an unprecedented level of detail.
The paper is the first of a number of studies to be published on the rich array of data collected during and immediately after the earthquake revealing its astonishingly complex nature.
Published today in the journal Science, the paper is titled ‘Complex multi-fault rupture during the 2016 M7.8 Kaikoura earthquake, New Zealand’. Led by GNS Science and with 29 co-authors from 11 national and international institutes, it reports on the analysis of a range of quake data including satellite radar imagery, field observations, GPS data and coastal uplift data.
The authors say the quake has underlined the importance of re-evaluating how rupture scenarios are defined for seismic hazard models in plate boundary zones worldwide.
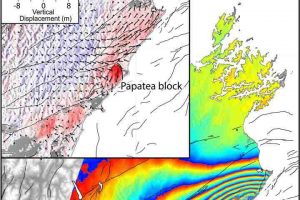
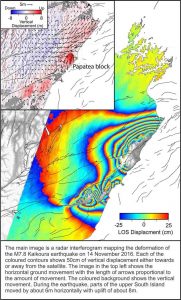
The study shows the quake moved parts of the South Island more than 5 metres closer to the North Island in addition to being uplifted by up to 8m.
The earthquake ruptured at least 12 major crustal faults plus another nine lesser faults and there was also evidence of slip along southern end of the Hikurangi subduction zone plate boundary, which lies about 20km below the North Canterbury and Marlborough coastlines.
The rupture started in North Canterbury and propagated northward for more than 170km along some well-known, and some previously unknown faults. It straddled two distinct active fault domains, rupturing faults in both the North Canterbury Fault zone and the Marlborough Fault system.
The largest movement during the earthquake occurred on the Kekerengu Fault, where pieces of the Earth’s crust were displaced relative to each other up by to 25m at a depth of about 15km. Maximum rupture at the surface was measured at 12m of horizontal displacement.
“This complex earthquake defies many conventional assumptions about the degree to which earthquake ruptures are controlled by individual faults, and provides additional motivation to re-think these issues in seismic hazard models,” the authors say.
Lead author, geodesy specialist Ian Hamling of GNS Science, said the complex and lengthy nature of the rupture hampered early attempts to determine an accurate magnitude of the earthquake, and this could potentially pose issues for earthquake early warning systems.
Dr Hamling said the earthquake had underlined that conventional seismic hazard models were too simple and restrictive.
“The message from Kaikoura is that earthquake science should be more open to a wider range of possibilities when rupture propagation models are being developed.”
However, he noted that insights from several large complex earthquakes worldwide during the past decade were starting to feed into seismic hazard models and helping to relax some of the existing assumptions about the way multi-fault ruptures can occur.
Owing to the long Kaikoura aftershock sequence, there is still an elevated risk of a damaging quake occurring in the central New Zealand region. The latest aftershock probabilities, published on the GeoNet website, show there is a 15% chance of a magnitude 6.0 to 6.9 quake in the next month. While the probabilities are trending down month by month, the figures are still at a level where it is worthwhile to continue with individual and community preparedness measures.
Reference:
Ian J. Hamling et al. Complex multifault rupture during the 20167.8 Kaikōura earthquake, New Zealand, Science (2017). DOI: 10.1126/science.aam7194
Note: The above post is reprinted from materials provided by GNS Science.
Formation of cemented sand located at Tunelboka. Credit: Nikole Arrieta / UPV/EHU
Researchers in the UPV/EHU’s Department of Analytical Chemistry have published a study in which they analyse cemented sand formations that contain industrial waste produced as a result of metallurgical activities. These beachrocks bear witness to the impact of industrial development and its influence on the coastal environment.
“Because certain geological events record everything, studying them helps to reconstruct the environmental past and to determine how human beings have influenced the environment. They will even be able to offer valuable information to tackle possible effects of climate change,” asserted Nikole Arrieta, author of the study analysing beachrocks.
They are rock formations that are produced in intertidal areas, normally in tropical and sub-tropical zones. Despite that, they can also be found on the Biscay coast. The beachrocks studied are recent formations located on the right bank of the Nerbioi-Ibaizabal estuary where they have been severely affected by human activity.
“Their presence in temperate latitudes like ours is rare. There are eight to 10 cases all over the world,” added Arrieta. These sedimentary formations are produced by the intergranular precipitation of carbonate cements (CaCO3). “A cement has formed between the various sediments. So the sand, instead of being loose as on normal beaches, forms these rocks,” explained Arrieta.
Yet even though the cements that the beachrocks are made of are carbonates, the geological formations on the coast also have ferruginous cements. The slag trapped in the cemented blocks has undergone dissolution processes as a result of meteorization or atmospheric events such as acid rain, and has even re-precipitated in the pores as insoluble iron salts. The research focused on the characterisation of these cements.
Firstly, to study the types of cements, innovative spectroscopic techniques were applied and which allowed the various mineral phases to be thoroughly analysed. “On a microscopic scale, various layers of cement appear, and each one provides information on the moment when they precipitated, the conditions that existed, etc.,” said Arrieta.
Secondly, the researchers analysed the materials trapped in these cements where “we found foundry slag from the industrial revolution, even waste bearing the seals of European companies that used to dump their slag when they arrived with their vessels. That is why we can find the so-called technofossils or traces of human activity on the beaches, in this case the industrial waste of international companies, which helps to calculate the age of the beachrock.”
Evidence of the Anthropocene
All this constitutes an example of the geological record of the Anthropocene epoch, currently discussed among specialists around the world. According to the scientific supporters of the Anthropocene, the Earth is in a new geological epoch, “the era of the human being,” since human action is leading to major changes that are leaving their mark on the Earth’s geological strata. Its detractors, by contrast, argue that it is a political rather than a scientific question.
This geological era would include the most recent period of the Quaternary, and right now, is of great interest for specialists all over the world. “The strata of the Tunelboka, a cove located on the right bank of the estuary that is the focus of the research, have been discussed across the world with a view to offering evidence of the Anthropocene,” said Arrieta.
And besides the fact that there are very few locations in the world in temperate latitudes that display this phenomenon, “there are even fewer that display the characteristics of ours; the quantity of slag they contain is mind-boggling. I have collaborated with various researchers of recognised prestige at universities in the United States and Australia, and they are all fascinated when they see the photos or materials of the location.”
Arrieta adds, “We have to keep alive the research into this geological event that is so special and unique and which we have on our coasts, for the geochemical, environmental and historical interest of these formations, their applications in the fields of engineering and restoration, their importance in defining the recent Anthropocene epoch and, why not, the industrial archaeological interest of the materials that form them.”
Reference:
Nikole Arrieta et al. Characterization of ferruginous cements related with weathering of slag in a temperate anthropogenic beachrock, Science of The Total Environment (2017). DOI: 10.1016/j.scitotenv.2016.12.132
The striking north face of the Bernese Alps is the result of a steep rise of rocks from the depths following a collision of two tectonic plates. This steep rise gives new insight into the final stage of mountain building and provides important knowledge with regard to active natural hazards and geothermal energy. The results from researchers at the University of Bern and ETH Zürich are being published in Scientific Reports.
Mountains often emerge when two tectonic plates converge, where the denser oceanic plate subducts beneath the lighter continental plate into the earth’s mantle according to standard models. But what happens if two continental plates of the same density collide, as was the case in the area of the Central Alps during the collision between Africa and Europe?
Geologists and geophysicists at the University of Bern and ETH Zürich examined this question. They constructed the 3-D geometry of deformation structures through several years of surface analysis in the Bernese Alps. With the help of seismic tomography, similar to ultrasound examinations on people, they also gained additional insight into the deep structure of the earth’s crust and beyond down to depths of 400 km in the earth’s mantle.
Viscous rocks from the depths
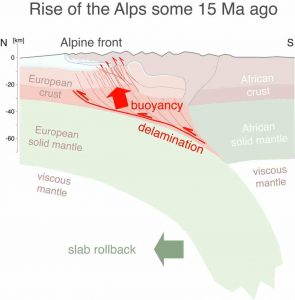
A reconstruction based on this data indicated that the European crust’s light, crystalline rocks cannot be subducted to very deep depths but are detached from the earth’s mantle in the lower earth’s crust and are consequently forced back up to the earth’s surface by buoyancy forces. Steep fault zones are formed here, which push through the earth’s crust and facilitate the steep rise of rocks from the depths. There are textbook examples of these kinds of fault zones in the Hasli valley, where they appear as scars in form of morphological incisions impressively cutting through the glacially polished granite landscape.
The detachment of the earth’s crust and mantle takes place at a depth of 25-30 kilometres. This process is triggered by the slow sinking and receding of the European plate in the upper earth’s mantle towards the north. In specialist terminology, this process is called slab rollback. The high temperatures at these depths make the lower crust’s rocks viscous, where they can subsequently be forced up by buoyant uplift forces.
Together with surface erosion, it is this steep rise of the rocks from lower to mid-crustal levels which is responsible for the Bernese Alps’ steep north front today (Titlis – Jungfrau region – Blüemlisalp range). The uplift data in the range of one millimetre per year and today’s earthquake activity indicate that the process of uplift from the depths is still in progress. However, erosion on the earth’s surface causes continuous ablation which is why the Alps do not carry on growing upwards endlessly.
Important for natural hazards and geothermal energy
The analysis of the steep fault zones are not just of scientific interest though. The seismic partly still active faults are responsible for the rocks weathering more intensively on the surface and therefore landslides and debris flows occurring, for example in the Halsi valley in the extremely steep areas of the Spreitlaui or Rotlaui. The serious debris flows in the Guttannen area are based, among other things, on this structural preconditioning of the host rocks. The leakage of warm hydrothermal water, which it is important to explore for geothermal energy and the 2050 energy policy, can be traced directly back to the brittle fracturing of the upper earth’s crust and the seeping in of cold surface waters. The water is heated up in the depths and arrives at the surface again through the steep fault zones – for example, in the Grimsel region. In this sense, the new findings lead to a deeper understanding of surface processes, which influence our infrastructures, for example the transit axes (rail, roads) through the Alps.
Reference:
Marco Herwegh et al. Large-Scale Crustal-Block-Extrusion During Late Alpine Collision, Scientific Reports (2017). DOI: 10.1038/s41598-017-00440-0
Researchers from the UK and China have found that living birds have a more crouched leg posture than their ancestors, who are generally thought to have moved with straighter limbs similar to those of humans. The study, published in Nature Communications, highlights how birds shifted towards this more crouched posture.
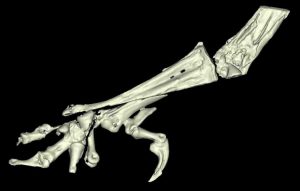
Experts from The University of Manchester, The Royal Veterinary College and China’s Nanjing University studied the lower leg of a Confuciusornis bird, which was fossilised in volcanic ash and lake sediments in China 125-145 million years ago.
They found that the fossil had amazingly well-preserved soft tissues around the ankle joint, including cartilage and ligaments. “These soft tissues were not just preserved as an ashen replacement of the former tissue, as sometimes happens – rather, the structure of the tissues was preserved at a microscopic level”, said Professor Baoyu Jiang, a co-author of the study from Nanjing University.
Imaging methods showed that the detailed anatomical preservation extended to the molecular level, with some of the original chemistry of the bird’s tissues remaining. In particular, the team found evidence of fragments of the collagen proteins that made up the leg ligaments, which matched the preservation at the microscopic tissue level of detail.
These findings tally with an expanding body of evidence that, under special conditions, some biological molecules – including even amino acids or partial proteins – can survive over millions of years in the fossil record.
“The preservation in this fossil was exceptional, and allowed us to resolve subtle but important chemical and structural details within this critical early species of bird,” said Professor Roy Wogelius from The University of Manchester, one of the collaborators on the project.
“The new information we gained about the anatomy of the cartilages and tendons show that this early bird had an ankle whose form fit an intermediate function between that of early dinosaurs and modern birds,” said Professor John R. Hutchinson from the Royal Veterinary College, who led the study. “Overall, this reinforced other lines of evidence that the more crouched, zigzag limb posture of birds evolved gradually from early dinosaurs to birds, with even these early birds having limbs that were built and worked differently from those of living birds, but were approaching the modern condition.”
Reference:
Baoyu Jiang et al. Cellular preservation of musculoskeletal specializations in the Cretaceous bird Confuciusornis, Nature Communications (2017). DOI: 10.1038/ncomms14779
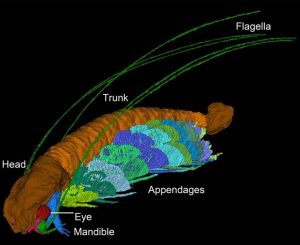
An international team of scientists led by the University of Leicester has discovered a new 430 million-year-old fossil and has named it in honour of Sir David Attenborough – who grew up on the University campus. Credit: Siveter et al
An international team of scientists led by the University of Leicester has discovered a new 430 million-year-old fossil and has named it in honour of Sir David Attenborough – who grew up on the University campus.
The fossil is described as ‘exceptionally well preserved in three-dimensions’ – complete with the soft-parts of the animal, such as legs, eyes and very delicate antennae. The fossil has been determined as an ancient crustacean new to science – a distant relative of the living lobsters, shrimps and crabs. There are about 40,000 crustacean species known today.
The find comes from volcanic ash deposits that accumulated in a marine setting in what is now Herefordshire in the Welsh Borderland.
Professor David Siveter of the Department of Geology at the University of Leicester made the discovery working alongside researchers from the Universities of Oxford, Imperial College London and Yale, USA.
Professor Siveter said: “Such a well-preserved fossil is exciting, and this particular one is a unique example of its kind in the fossil record, and so we can establish it as a new species of a new genus.”
“Even though it is relatively small, at just nine millimetres long, it preserves incredible detail including body parts that are normally not fossilized. It provides scientists with important, novel insights into the evolution of the body plan, the limbs and possible respiratory-circulatory physiology of a primitive member of one of the major groups of Crustacea.”
The fossil is named Cascolus ravitis in honour of Sir David, who grew up on University College Leicester campus (the forerunner of the University), in celebration of his 90th birthday. Cascolus is derived from castrum meaning ‘stronghold’ and colus, ‘dwelling in’, alluding to the Old English source for the surname Attenborough; while ‘ravitis” is a combination of Ratae – the Roman name for Leicester – ‘vita’, life, and ‘commeatis’, a messenger.
Professor Siveter said: “In my youth, David Attenborough’s early programmes on the BBC, such as ‘Zoo Quest’, greatly encouraged my interest in Natural History and it is a pleasure to honour him in this way.”
Sir David Attenborough said: “The biggest compliment that a biologist or palaeontologist can pay to another one is to name a fossil in his honour and I take this as a very great compliment. I was once a scientist so I’m very honoured and flattered that the Professor should say such nice things about me now.”
Professor Siveter added: “The animal lived in the Silurian period of geological time. Some 430 million years ago much of southern Britain was positioned in warm southerly subtropical latitudes, quite close to a large ancient continent of what we now call North America, and was covered by a shallow sea. The crustacean and other animals living there died and were preserved when a fine volcanic ash rained down upon them.”
The fossil specimen has been reconstructed as a virtual fossil by 3D computer modeling.
Reference:
David J. Siveter, Derek E. G. Briggs, Derek J. Siveter, Mark D. Sutton, David Legg. A new crustacean from the Herefordshire (Silurian) Lagerstätte, UK, and its significance in malacostracan evolution. DOI: 10.1098/rspb.2017.0279
This is a male holotype of the new terrestrial crab species Haberma tingkok discovered in Hong Kong. Credit: Dr. Peter K. L. Ng
A new species of terrestrial crab has been found to climb trees on the eastern coast of Hong Kong. All specimens spotted during the survey have been collected at a height of approximately 1.5 – 1.8 m, walking on the bark of the branches at ebbing and low tides. The species is described in the open access journal ZooKeys.
Among the crab’s characteristic traits are squarish predominantly dark brown carapace, very long legs and orange chelipeds. The species is less than a centimetre long, with the studied specimens measuring between 8 and 9 millimetres, irrespective of their sex. However, the chelipeds of the males appear stout, while in females they are distinctly more slender.
The scientists who found the new species (Haberma tingkok), Dr. Stefano Cannicci, the Swire Institute of Marine Science at the University of Hong Kong, and Dr. Peter Ng, National University of Singapore, have placed the new species in a small genus, which now contains merely three species. In fact, Dr. Peter Ng has been involved in the discovery of all of them. He also led the team that established the genus 15 years ago, having collected a small previously undescribed species of mangrove crab from Singapore.
The discovery of the tiny crustacean once again proves how little is known about the diversity of these crabs in Hong Kong. Furthermore, the mangroves that make for the habitat of the new species are under severe impact by both pollution and land reclamation, which underlines the urgent need for their conservation.
Earlier this year, Dr. Peter Ng teamed up with Dr. Jose Christopher Mendoza to describe another new species of crab, collected from the rubble at the island of Guam and named after two of the main characters in J. K. Rowling’s Harry Potter fantasy series.
Reference:
A new species of micro-mangrove crab of the genus Haberma Ng & Schubart, 2002 (Crustacea, Brachyura, Sesarmidae) from Hong Kong. ZooKeys 662: 67-78. DOI: 10.3897/zookeys.662.11908
Note: The above post is reprinted from materials provided by Pensoft Publishers.
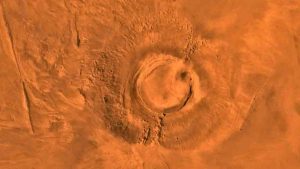
This digital-image mosaic of Mars’ Tharsis plateau shows the extinct volcano Arsia Mons. It was assembled from images that the Viking 1 Orbiter took during its 1976-1980 working life at Mars. Credit: NASA/JPL/USGS
New NASA research reveals that the giant Martian shield volcano Arsia Mons produced one new lava flow at its summit every 1 to 3 million years during the final peak of activity. The last volcanic activity there ceased about 50 million years ago — around the time of Earth’s Cretaceous-Paleogene extinction, when large numbers of our planet’s plant and animal species (including dinosaurs) went extinct.
Located just south of Mars’ equator, Arsia Mons is the southernmost member of a trio of broad, gently sloping shield volcanoes collectively known as Tharsis Montes. Arsia Mons was built up over billions of years, though the details of its lifecycle are still being worked out. The most recent volcanic activity is thought to have taken place in the caldera — the bowl-shaped depression at the top — where 29 volcanic vents have been identified. Until now, it’s been difficult to make a precise estimate of when this volcanic field was active.
“We estimate that the peak activity for the volcanic field at the summit of Arsia Mons probably occurred approximately 150 million years ago — the late Jurassic period on Earth — and then died out around the same time as Earth’s dinosaurs,” said Jacob Richardson, a postdoctoral researcher at NASA’s Goddard Space Flight Center in Greenbelt, Maryland. “It’s possible, though, that the last volcanic vent or two might have been active in the past 50 million years, which is very recent in geological terms.”
Richardson is presenting the findings on March 20, 2017, at the Lunar and Planetary Science Conference in The Woodlands, Texas. The study also is published in Earth and Planetary Science Letters.
Measuring about 68 miles (110 kilometers) across, the caldera is deep enough to hold the entire volume of water in Lake Huron, and then some. Examining the volcanic features within the caldera required high-resolution imaging, which the researchers obtained from the Context Camera on NASA’s Mars Reconnaissance Orbiter.
The team mapped the boundaries of the lava flows from each of the 29 volcanic vents and determined the stratigraphy, or layering, of the flows. The researchers also performed a technique called crater counting — tallying up the number of craters at least 330 feet (100 meters) in diameter — to estimate the ages of the flows.
Using a new computer model developed by Richardson and his colleagues at the University of South Florida, the two types of information were combined to determine the volcanic equivalent of a batting lineup for Arsia Mons’ 29 vents. The oldest flows date back about 200 million years. The youngest flows probably occurred 10 to 90 million years ago — most likely around 50 million years ago.
The modeling also yielded estimates of the volume flux for each lava flow. At their peak about 150 million years ago, the vents in the Arsia Mons’ caldera probably collectively produced about 1 to 8 cubic kilometers of magma every million years, slowly adding to the volcano’s size.
“Think of it like a slow, leaky faucet of magma,” said Richardson. “Arsia Mons was creating about one volcanic vent every 1 to 3 million years at the peak, compared to one every 10,000 years or so in similar regions on Earth.”
A better understanding of when volcanic activity on Mars took place is important because it helps researchers understand the Red Planet’s history and interior structure.
“A major goal of the Mars volcanology community is to understand the anatomy and lifecycle of the planet’s volcanoes. Mars’ volcanoes show evidence for activity over a larger time span than those on Earth, but their histories of magma production might be quite different,” said Jacob Bleacher, a planetary geologist at Goddard and a co-author on the study. “This study gives us another clue about how activity at Arsia Mons tailed off and the huge volcano became quiet.”
Reference:
Jacob A. Richardson, James A. Wilson, Charles B. Connor, Jacob E. Bleacher, Koji Kiyosugi. Recurrence rate and magma effusion rate for the latest volcanism on Arsia Mons, Mars. Earth and Planetary Science Letters, 2017; 458: 170 DOI: 10.1016/j.epsl.2016.10.040
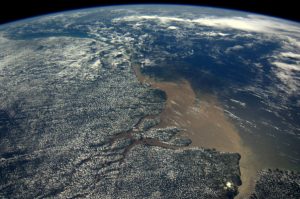
Researchers from the University of Amsterdam (UvA) and the University of Brasilia (Brazil) have determined the age of the formation of the Amazon River at 9.4 to 9 million years ago (Ma) with data that convincingly refutes substantial younger estimates. Their results are published as early view in the journal Global and Planetary Change.
The study comprised geochemical and palynological analyses of sediments from a hydrocarbon exploration borehole, situated offshore of Brazil, that reached more than 4.5 kilometers below sea level.
The results show a distinct change in sediment composition and plant residual matter during the late Miocene (9.4 to 9 Ma). This represents a switch in river source area from the tropical lowlands to the high Andes, which is diagnostic of the onset of the transcontinental Amazon River. The new data contradict younger estimates (c. 2.6 Ma) that have been proposed in recent literature and postdates estimates from an earlier study of this borehole by about 1 to 1.5 million years.
Sediments record evolutionary history
‘We were able to narrow down the age of onset of the Amazon River because we sampled the transition interval in a classical section of the Amazon submarine fan, where the sediments transported by this river are deposited and as a result accurately record its evolutionary history. We applied high resolution analytical techniques not previously performed in the region’, says professor Farid Chemale, senior author from the University of Brasilia (now at Universidade do Vale do Rio dos Sinos, São Leopoldo).
The study also gives novel insights into overall changes in plant composition in the Amazon drainage basin. Particularly, the rise in grass remains suggests that mountain uplift and Quaternary climatic changes strongly affected the landscape and probably opened up new habitats for grass colonization.
Dramatic changes
‘The changes detected in the sediment record lead to the tantalizing question of whether the Amazon region might have changed dramatically during Plio-Pleistocene global cooling’, says Dr Carina Hoorn, lead author and researcher at the UvA’s Institute for Biodiversity and Ecosystem Dynamics. ‘Our new data confirm an old age for the Amazon River and also point at an expansion of grasslands during the Pleistocene that was not known before. Further research on land and at sea may give further answers but will require investment in both continental and marine drilling.’
Largest drainage basin of all rivers
The Amazon River contributes a fifth of the total fresh water supply to the global oceans and has the largest drainage basin of all rivers around the world. The onset of the river is a defining moment in the reorganization of the paleogeography of South America, forming both a bridge and a divider for biota in the Amazon landscape.
The history of the Amazon River and its drainage basin are hard to unravel, as the continental record is scarce and fragmented. The marine record is more complete, yet is equally difficult to access. Sediment aprons in the proximity of major rivers often hold continuous records of terrestrial material accumulated by the river over time. These records provide a unique insight into the historic climate, geography and biome evolution of the land.
Clim-Amazon project
The research was carried out in the context of the Clim-Amazon project, a joint Brazilian-European scientific initiative for climate and geodynamic research on the Amazon River Basin sediment and is supported by the EU (European Union) through the FP7 (Seventh Framework Programme for Research and Technological Development).
Reference:
Carina Hoorn, Giovanni R. Bogotá-A, Millerlandy Romero-Baez, Emmy I. Lammertsma, Suzette G.A. Flantua, Elton L. Dantas, Rodolfo Dino, Dermeval A. do Carmo, Farid Chemale. The Amazon at sea: Onset and stages of the Amazon River from a marine record, with special reference to Neogene plant turnover in the drainage basin. Global and Planetary Change, 2017; DOI: 10.1016/j.gloplacha.2017.02.005
CU Boulder Professor Gifford Miller, shown here, is part of a team that has found the Barnes Ice Cap on Baffin Island, the last remnant of the Laurentide Ice Sheet, will vanish in several hundred years because of rising temperatures caused by human activity. Credit: Gifford Miller, University of Colorado
The last piece of the ice sheet that once blanketed much of North America is doomed to disappear in the next several centuries, says a new study by researchers at Simon Fraser University in British Columbia and the University of Colorado Boulder.
The Barnes Ice Cap, a Delaware-sized feature on Baffin Island in the Canadian Arctic, is melting at a rapid pace, driven by increased greenhouse gases in the atmosphere that have elevated Arctic temperatures. The ice cap, while still 500 meters thick, is slated to melt in about 300 years under business-as-usual greenhouse gas emissions.
The results provide compelling evidence that the current level of warming is almost unheard of in the past 2.5 million years, according to the authors. Only three times at most in that time period has the Barnes Ice Cap been so small, a study of isotopes created by cosmic rays that were trapped in rocks around the Barnes Ice Cap indicated.
“This is the disappearance of a feature from the last glacial age, which would have probably survived without anthropogenic greenhouse gas emissions,” said Adrien Gilbert, a glaciologist at Simon Fraser University in British Columbia in Canada and lead author of the new study published online today in Geophysical Research Letters, a journal of the American Geophysical Union.
While the melting of the Barnes Ice Cap will likely have negligible effects on sea level rise, its end could herald the eventual dissolution of the larger ice sheets like Greenland and Antarctica, said CU-Boulder Professor Gifford Miller, a study co-author.
“I think the disappearance of the Barnes Ice Cap would be just a scientific curiosity if it were not so unusual,” said Miller, the associate director of CU Boulder’s Institute of Arctic and Alpine Research who has conducted research on Baffin Island annually for the past five decades. “One implication derived from our results is that significant parts of the southern Greenland Ice Sheet also may be at risk of melting as the Arctic continues to warm.”
Elevated sea rise created by a melting Greenland would automatically cause the Antarctic Ice Sheet, whose dimensions are controlled by sea level, to also shrink in size, Miller said.
The Barnes Ice Cap is part of the Laurentide Ice Sheet that has covered millions of square miles of North America episodically since the start of Quaternary Period roughly 2.5 million years ago. The ice sheet grew and shrank over time as Earth went through various climate cycles, and the ice was a mile thick at present-day Chicago about 20,000 years ago. It started receding substantially around 14,000 years ago when Earth slipped out of its last ice age.
The ice cap stabilized about 2,000 years ago until the effects of the recent warming caught up with it. Miller was conducting research on Baffin Island in 2009 when he realized the ice cap had shrunk noticeably as compared to images from a few decades earlier. He recruited Gilbert and Gwenn Flowers from Simon Fraser to develop a model of how the ice cap might behave in the future.
In the new study, the researchers used their model to estimate when the ice cap would disappear under different greenhouse gas emissions scenarios. They project that under all future emission scenarios the ice cap will be gone within 200 to 500 years. For a moderate emissions scenario that assumes Earth’s greenhouse gas emissions will peak around the year 2040, they project the ice cap to be gone in 300 years.
“The geological data is pretty clear that the Barnes Ice Cap almost never disappears in the interglacial times,” Miller said. “The fact that it’s disappearing now says we’re really outside of what we’ve experienced in 2.5 million-year interval. We are entering a new climate state.”
The Barnes Ice Cap is like a canary in a coal mine, said Miller, who also is a professor in CU Boulder’s Department of Geological Sciences. Even if humans stopped emitting greenhouse gases today, the ice cap would still disappear in the next few centuries.
In 2010, the project received a boost from Waleed Abdalati, current director of the Cooperative Institute for Research in Environmental Sciences (a joint venture of CUBoulder and NOAA), who was NASA’s chief scientist at the time. Abdalati supported the flight of a NASA plane monitoring ice loss in the Arctic to revisit the Barnes Ice Cap.
In addition to measuring changes in the ice cap’s height, researchers used ice-penetrating radar aboard the aircraft to reveal its hidden, sub-glacial topography. The measurements were key for the computer model subsequently developed by Gilbert and Flowers to predict the evolution of the Barnes Ice Cap.
Reference:
Adrien Gilbert et al. The projected demise of Barnes Ice Cap: evidence of an unusually warm 21st century Arctic. Geophysical Research Letters, March 2017 DOI: 10.1002/2016GL072394