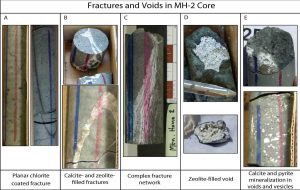
Examples of fractures and vesicles in the MH-2 core. Credit: J.A. Kessler, The Geological Society of America, and Lithosphere
In their study published in Lithosphere this week, James Kessler and colleagues examine the geology of a scientific borehole drilled into the Snake River Plain, Idaho, USA, to investigate the potential for geothermal energy at depth. The site discussed in this paper is on the Mountain Home Air Force Base, where a drillhole in 1984 indicated that geothermal fluids were present at about 1.8 km depth.
With ARRA funding for new energy research and a grant from the International Continental Drilling Program, Kessler and colleagues drilled three 2-km-deep holes in the region. The Snake River Plain is the track of the Yellowstone Hotspot, and consists of rhyolite and basalt. Volcanic rocks near Yellowstone are quite young, whereas at Mountain Home, Idaho, the rocks are three to five million years old. Despite the abundant evidence for heat, the Snake River Plain does not produce geothermal energy due to a cool water aquifer present in the upper 500 m of the rocks.
The work reported in this paper is on the Mountain Home site, where waters of about 150 °C were encounter at 1745 m depth. Kessler and colleagues report on the geology of the basaltic rocks of the borehole, including determining the distribution of the basalts, the presence of faults and fractures at depth, and evidence for older hydrothermal interactions.
They also worked with geophysicists at the University of Alberta to determine the stresses at depth in the site. When holes penetrate rocks at depth, characteristic fractures form and their orientations can be used to determine the orientations of the stresses. The team reports that the maximum horizontal stresses here are at N 45°E, which suggests a complex geology at depth that might contribute to the localization of the geothermal fluids. Kessler and colleagues posit that these stresses are similar to the stresses observed in northern Nevada.
Another high point of this work is that this reports the results of James Kessler’s Ph.D. work; it also included two undergraduates, Mikaela Pulsipher and Fallon Rowe, and master’s student Jerome Varriale as co-authors.
Reference:
J.A. Kessler et al. Geology and in situ stress of the MH-2 borehole, Idaho, USA: Insights into western Snake River Plain structure from geothermal exploration drilling, Lithosphere (2017). DOI: 10.1130/L609.1
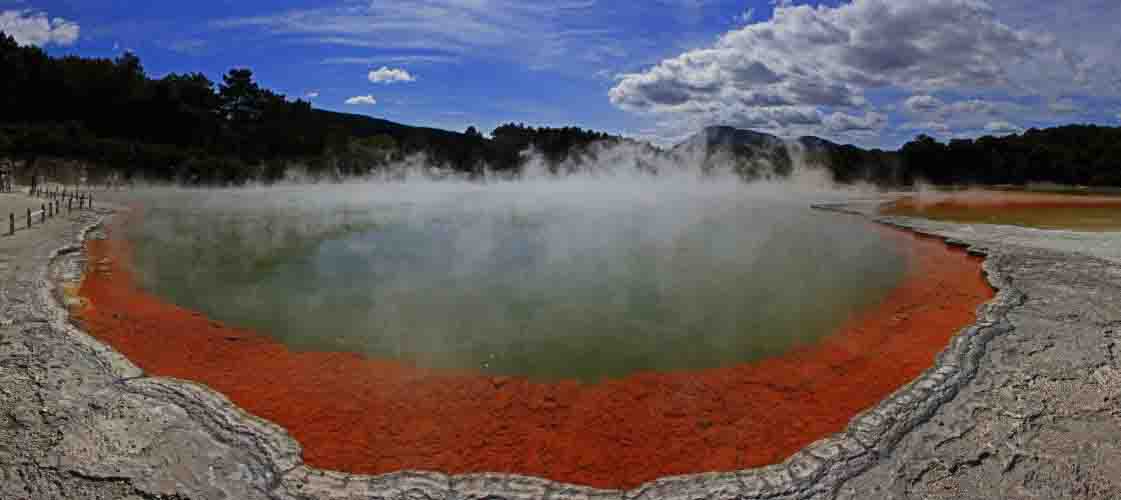
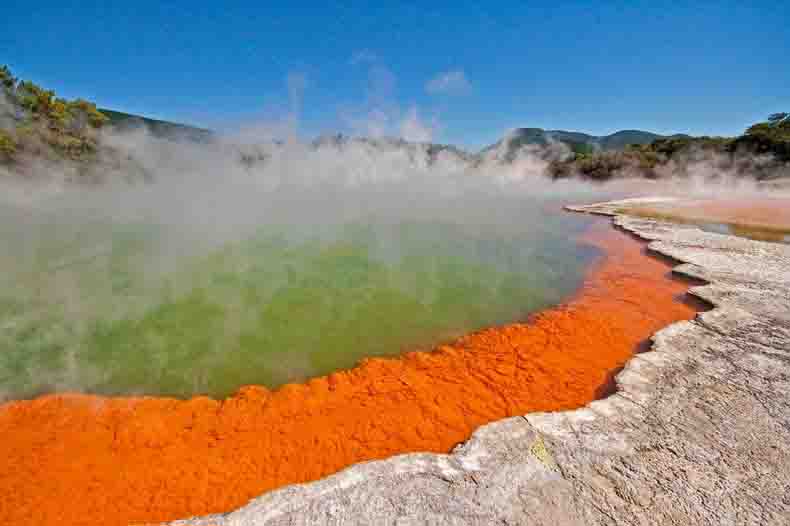
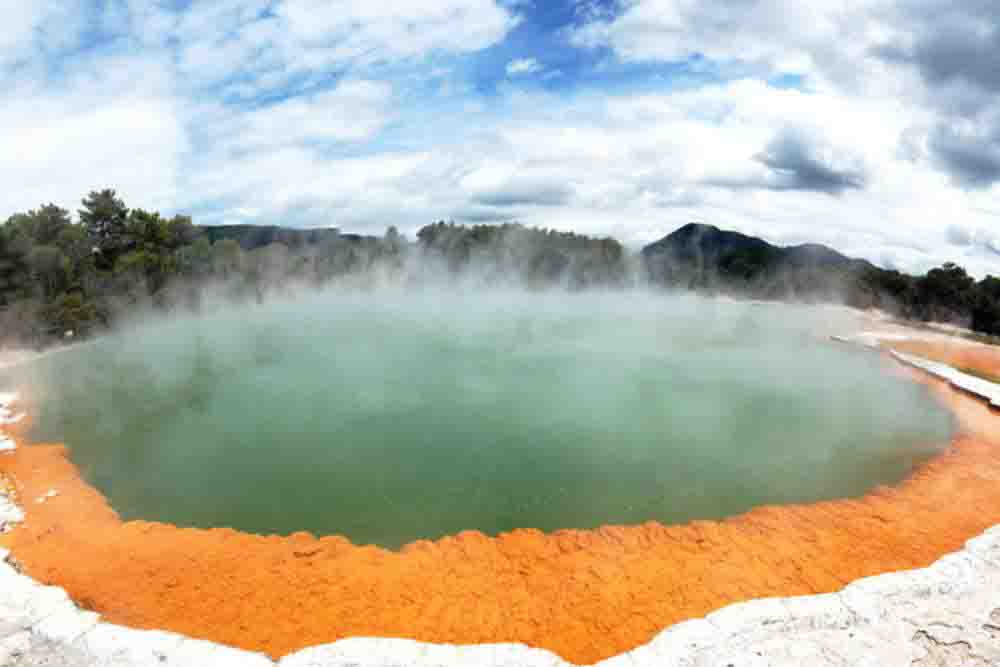
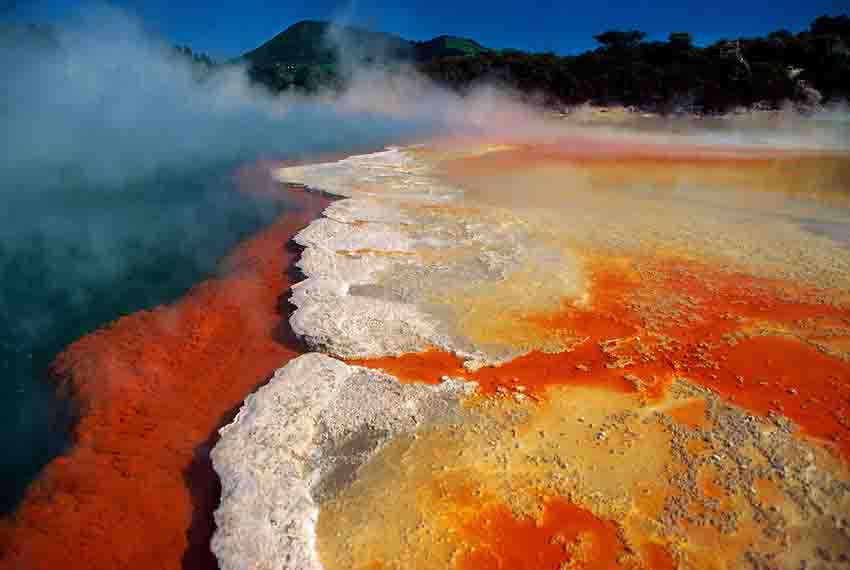
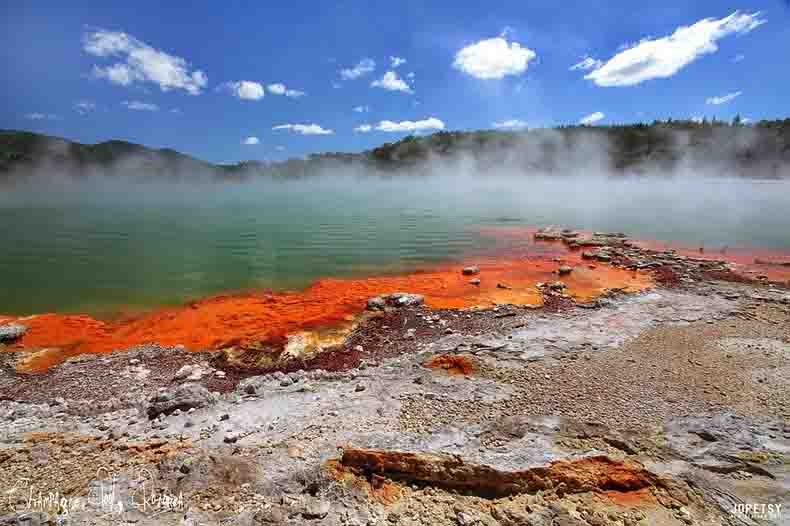
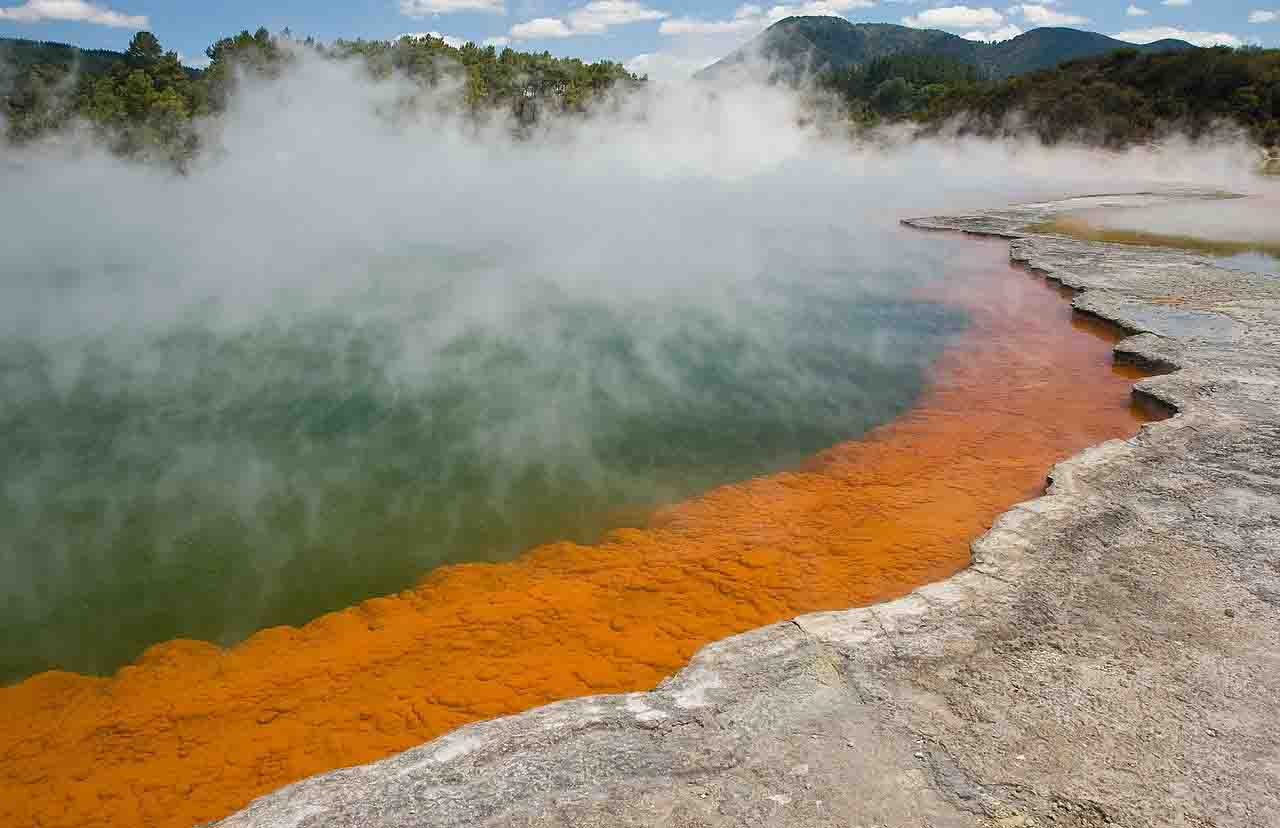
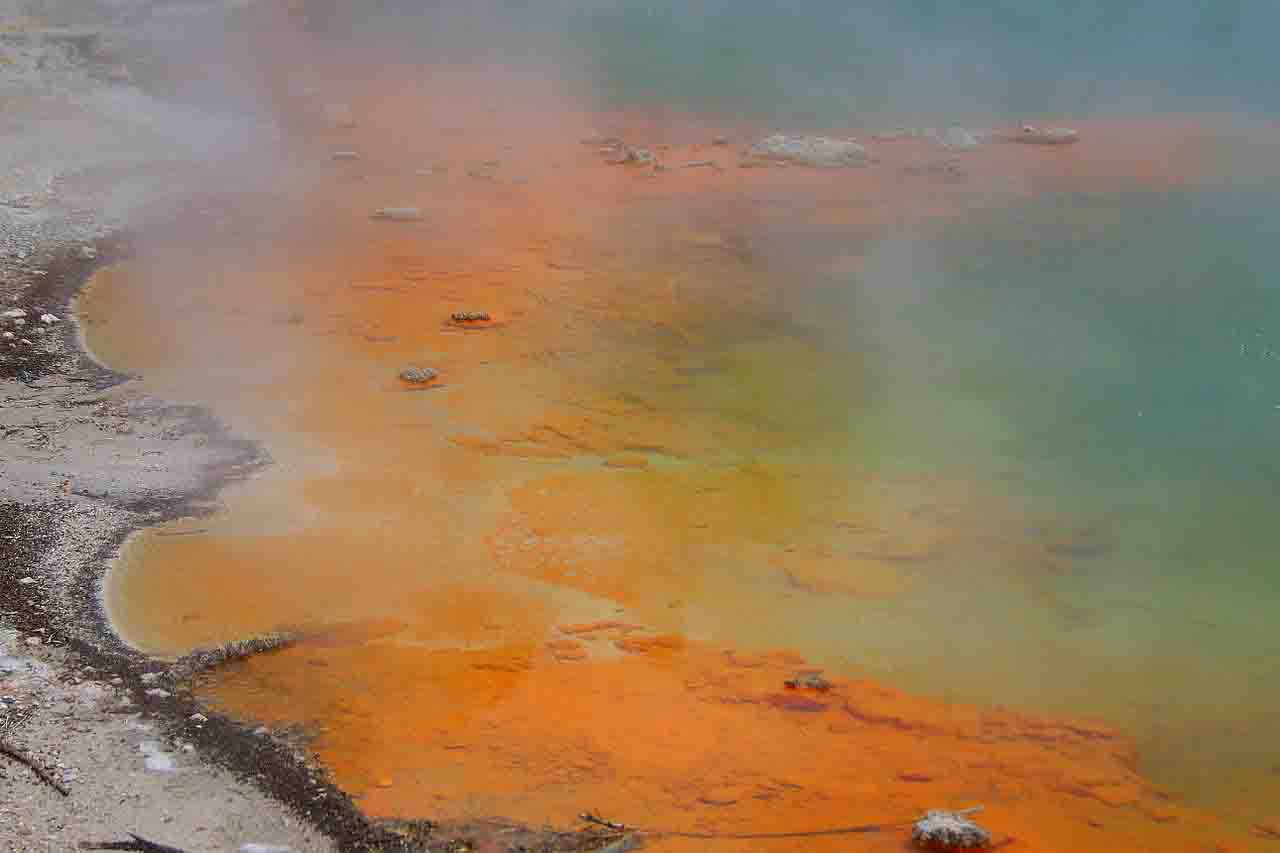
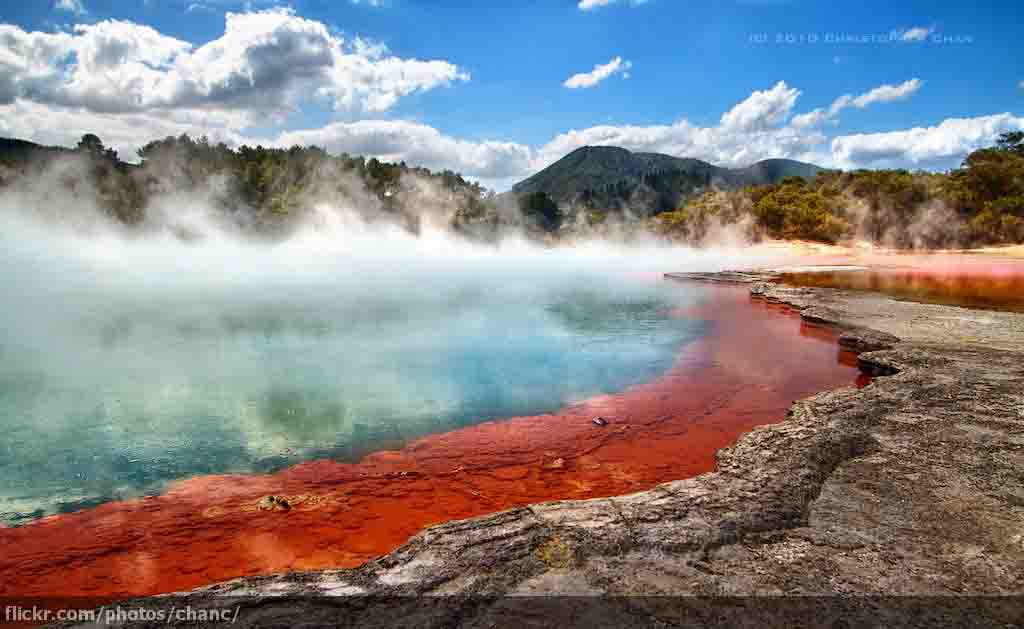
Champagne Pool is a prominent geothermal feature within the Waiotapu geothermal area in the North Island of New Zealand.
The terrestrial hot spring is located about 30 km (20 mi) southeast of Rotorua and about 50 km (30 mi) northeast of Taupo.
The name Champagne Pool is derived from the abundant efflux of carbon dioxide (CO2), similar to a glass of bubbling champagne.
The hot spring was formed 900 years ago by a hydrothermal eruption, which makes it in geological terms a relatively young system. Its crater is around 65 m (213 ft) in diameter with a maximum depth of approximately 62 m (203 ft) and is filled with an estimated volume of 50,000 m3 (1,800,000 cu ft) of geothermal fluid.
Twenty-year-old Alex Yeatts and 22-year-old Abby Wilcox were in a chocolate making class as pastry students at the Culinary Institute of America. They were inspired by chocolate geodes that their professor Peter Greweling had made and wanted to go about creating their own.
Chef Greweling challenged them to figure out the process on their own using their knowledge of chocolate and sugar chemistry. With the guidance of their chef, they made GIANT sparkling chocolate geodes.
They tempered massive amounts of molten chocolate — the largest of the geodes was over 50 pounds — and poured it into egg-shaped molds.
The crystals are actually similar to rock candy that you’d make at home. They used concentrated sugar syrup in beautiful purple and orange hues.
Six months later, in February 2017, they cracked open their collection of 12 geodes of varying sizes — with spectacular results.
The collision between the Indian subcontinent and the Asian landmass resulted in the formation of the Himalayan Mountains and the rise of the Tibetan Plateau, with consequent major climatic and environmental changes around our planet. Placing precise constraints on the timing of the India-Asia continental collision is essential to understanding the subsequent geological and topographic evolution of the orogenic belt as well as the tectonic uplift of the Tibetan Plateau and their effects on climate, environment and life. A recent study has precisely constrained the timing of the initial India-Asia continental collision via the accurate analysis of the sedimentary record preserved along the collision zone.
The related research, titled “Constraining the timing of the India-Asia continental collision by the sedimentary record,” has just been published in Science China Earth Sciences in both Chinese and English. Professor Xiumian Hu from Nanjing University is the first and corresponding author. Based on the detailed study of fossils and detrital minerals contained in strata exposed along both sides of the Yarlung-Zangbo suture zone in Tibet, a team of Chinese and Italian researchers has determined with unprecedented accuracy when India and Asia first came into contact by pinpointing major changes of sedimentary style and in provenance of detritus. In previous studies, researchers have used a variety of approaches to date this major tectonic event, including paleomagnetism and biostratigraphic or radiometric dating of sedimentary magmatic and metamorphic rocks, coupled with structural, stratigraphic and sedimentological observations. Fierce debate often ensued, because different research teams used different indicators and criteria to define continental collision and tentatively assess the chronological sequence of progressing orogeny.
This new research starts from a clear definition of collision onset as the timing of first contact between the opposite edges of the Indian and Asian continental crusts following complete consumption of intervening Neo-Tethyan oceanic lithosphere at a point. By accurately dating with multiple methods the turbiditic deep-sea sediments derived from both India and Asia and deposited in the trench just south of the zone of initial collision, the researchers have precisely constrained the India-Asia collision onset as middle Palaeocene (59±1 million years ago). Initial continent-continent collision preceded by 20 million years the final disappearance of marine seaways from the Himalayas, and by 30 million years, the accumulation of massive fluvial gravel and sand deposits in the Indo-Gangetic plain of northern India. Researchers also show that there was no major diachroneity of collision onset from the central to the western Himalaya.
This study represents a major contribution to understanding plate tectonics and continental dynamics, and is of great significance, not only as far as the India-Asia collision, Himalayan orogeny, Tibetan-Plateau uplift and consequent Cenozoic climatic change are concerned, but also because it provides a reference standard useful to investigate the process of continental collision and to reconstruct its progress in time resulting in the full growth of huge mountain belts.
Reference:
XiuMian Hu et al, Constraining the timing of the India-Asia continental collision by the sedimentary record, Science China Earth Sciences (2017). DOI: 10.1007/s11430-016-9003-6
Note: The above post is reprinted from materials provided by Science China Press.
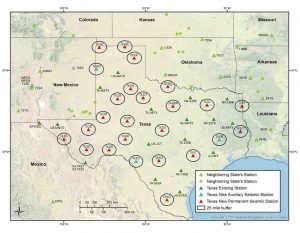
TexNet plans to install at least 22 new permanent and an additional 36 portable stations evenly spaced across Texas. Credit: Bureau of Economic Geology
Almost a decade ago, the ground around the densely populated Dallas-Fort Worth Metroplex started shaking. As the frequency and intensity of earthquakes increased in a region poorly prepared for the seismic activity, the risk became a priority for the state.
“We’ve always had natural earthquake activity in Texas throughout its history. But as earthquakes started to happen more to our good neighbor to the north in Oklahoma, Texas had some more of its own. Irving, Texas. Azle, Texas. Venus, Texas. All in the greater Dallas-Fort Worth area, which got people’s attention,” says Scott W. Tinker, director at the Bureau of Economic Geology in the Jackson School of Geosciences at The University of Texas at Austin.
Residents, politicians and oil-gas industry leaders reached out to the Bureau of Economic Geology.
The bureau is the oldest and second largest research unit at the university, made up of more than 250 scientists, engineers and economists. The organization also functions as the State Geological Survey of Texas—a broker of information among industry, academia and government agencies.
“Between 1980 and about 2010 there were one to two earthquakes per year in the entire state. Between 2010 and 2015 that rate of seismicity changed to up to 15 small earthquakes per year,” says Peter Hennings, a veteran of the petroleum industry and now a co-principal investigator at the Center for Integrated Seismicity Research (CISR), an earthquake research center managed by the bureau.
The number of earthquakes continues to rise, with 28 earthquakes recorded in Texas in 2016.
“Everybody wants to know what is going on. What has changed? And what can be done about it?” says Hennings.
In June 2015, Texas Gov. Greg Abbott and the 84th Legislature authorized $4.47 million for TexNet.
“TexNet is an array of seismometers across Texas that helps us better locate and identify earthquakes, but also measure the levels of ground shaking from these events,” says Ellen Rathje, who is also a co-principal investigator at CISR and a professor of civil engineering at UT Austin’s Cockrell School of Engineering.
TexNet plans to install at least 22 new permanent stations evenly spaced across Texas. These earthquake monitors are called “TexNet’s seismic backbone,” and an additional 36 portable stations will be placed in areas of recent earthquake activity.
As of March 2017, the TexNet team is a little more than half way through their goal. They have installed 14 permanent stations and 18 portable stations, collecting live seismic activity across the state, with 11 of those portable stations in the Dallas-Fort Worth area.
Each of these sensors streams data in real time back to the Bureau of Economic Geology. The data give the researchers the ability to understand when and where the seismicity is occurring. “This research is developing fundamental understanding of the processes that cause earthquakes and how they impact people, their infrastructure and their businesses,” says Rathje.
A big part of the TexNet project is partnering with landowners across the state.
“We have some seismic equipment that sits at the front of the property,” says David Andrews, a landowner Azle, 16 miles northwest of Fort Worth. “There are a lot of questions that people have at the moment with no way of answering. It’s easy to just say it’s the fracking and it’s the injecting, but this is without any real proof.”
Oil and gas have been important parts of Texas history for over a century, and connections have been proposed between earthquakes and drilling since the 1920s. But, says Tinker, “Just because we’re doing something here and an earthquake happens nearby at the same time doesn’t mean that caused that necessarily; but it could have. If human activity is causing the earthquakes, we need to figure out how to stop that.”
Alexandros Savvaidis, who is TexNet project manager, has made a career of operating similar seismic systems in Greece and other parts of Europe. Planning the best locations for the monitors has been challenging, given Texas’ size.
“This has been a big issue for us. The state is big. The ranches are big,” he said. “What is important from our side is that we work proactively in the state in order to provide the necessary information to protect the public and the industrial infrastructure.” Working closely with the communities has been key, and he’s confident the work will pay off soon.
“We were contacted by The University of Texas, and they requested that we help them find a location for the monitor,” said Larry Walden, a county commissioner in Parker County, west of Fort Worth. He was happy to help. “What we continued to hear from the citizens was: Who’s doing something about it? Those people were concerned because they thought that the next one was going to be a big one.”
“We have to make sure that we have a good understanding of the risk of earthquakes and provide that to the public,” says Savvaidis. “Texas will be prepared in case of an earthquake event.”
TexNet hopes to serve as an example on the state, national and international levels for other communities facing these problems.
“This is tough science. It takes smart people from multiple disciplines working together to do this,” says Tinker. “We are working with our colleagues at Southern Methodist University, who have been studying seismicity for many decades now, and at Texas A&M. So, it’s an integrated approach to answer this question. The state, universities, industry and landowners are all working together to address the science of this issue, and this is exactly how it will get solved.”
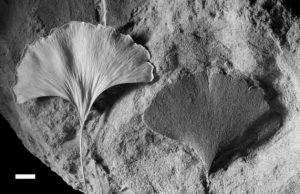
Living Ginkgo leaf (left) and fossil (right). Density of stomata in such leaves is proxy of atmospheric CO2 in past. Credit: Dana Royer
New research led by the University of Southampton suggests that, over the next 100 to 200 years, carbon dioxide concentrations in Earth’s atmosphere will head towards values not seen since the Triassic period, 200 million years ago. Furthermore, by the 23rd century, the climate could reach a warmth not seen in 420 million years.
The study, published in Nature Communications, compiled over 1200 estimates of ancient atmospheric carbon dioxide (CO2) concentrations to produce a continuous record dating back nearly half a billion years. It concludes that if humanity burns all available fossil fuels in the future, the levels of CO2 contained in the atmosphere may have no geologically-preserved equivalent during this 420 million year period.
The researchers examined published data on fossilised plants, the isotopic composition of carbon in soils and the oceans, and the boron isotopic composition of fossil shells. Gavin Foster, lead author and Professor of Isotope Geochemistry at the University of Southampton, explains: “We cannot directly measure CO2 concentrations from millions of years ago. Instead we rely on indirect ‘proxies’ in the rock record. In this study, we compiled all the available published data from several different types of proxy to produce a continuous record of ancient CO2 levels.”
This wealth of data shows that CO2 concentrations have naturally fluctuated on multi-million year timescales over this period, from around 200-400 parts per million (ppm) during cold ‘icehouse’ periods to up to 3000 ppm during intervening warm ‘greenhouse’ periods. Although evidence tells us our climate has fluctuated greatly in the past (with Earth currently in a colder period), it also shows the current speed of climate change is highly unusual.
Carbon dioxide is a potent greenhouse gas and in the last 150 years humanity’s fossil fuel use has increased its atmospheric concentration from 280 ppm in the pre-industrialisation era to nearly 405 ppm in 2016. However, it’s not just CO2 that determines the climate of our planet, ultimately it is both the strength of the greenhouse effect and the amount of incoming sunlight that is important. Changes in either parameter are able to force climate change.
“Due to nuclear reactions in stars, like our sun, over time they become brighter,” adds co-author Dan Lunt, Professor of Climate Science at the University of Bristol. “This means that, although carbon dioxide concentrations were high hundreds of millions of years ago, the net warming effect of CO2 and sunlight was less. Our new CO2 compilation appears on average to have gradually declined over time by about 3-4 ppm per million years. This may not sound like much, but it is actually just about enough to cancel out the warming effect caused by the sun brightening through time, so in the long-term it appears the net effect of both was pretty much constant on average.”
This interplay between carbon dioxide and the sun’s brightness has fascinating implications for the history of life on Earth. Co-author Professor Dana Royer, from Wesleyan University in the US, explains: “Up until now it’s been a bit of a puzzle as to why, despite the sun’s output having increased slowly over time, scant evidence exists for any similar long-term warming of the climate. Our finding of little change in the net climate forcing offers an explanation for why Earth’s climate has remained relatively stable, and within the bounds suitable for life for all this time.”
This long-term view also offers a valuable perspective on future climate change. It is well recognised that the climate today is changing at rates well above the geological norm. If humanity fails to tackle rising CO2 and burns all the readily available fossil fuel, by AD 2250 CO2 will be at around 2000 ppm — levels not seen since 200 million years ago.
Professor Foster adds: “However, because the Sun was dimmer back then, the net climate forcing 200 million years ago was lower than we would experience in such a high CO2 future. So not only will the resultant climate change be faster than anything Earth has seen for millions of years, the climate that will exist is likely to have no natural counterpart, as far as we can tell, in at least the last 420 million years.”
This collaborative study involves the University of Southampton (UK), University of Bristol (UK), and Wesleyan University (US) and is an output from ‘Descent into the Ice House’, one of the four research projects under the umbrella programme ‘The Long-term Co-Evolution of Life and the Planet’ funded the by the National Environment Research Council (NERC).
Reference:
Gavin Foster et al. Future climate forcing potentially without precedent in the last 420 million years. Nature Communications, April 2017 DOI: 10.1038/NCOMMS14845
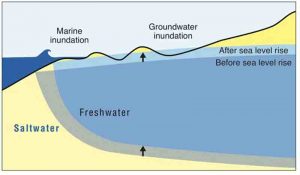
New research from the University of Hawai’i at Manoa (UHM) reveals a large part of the heavily urbanized area of Honolulu and Waikiki, Hawai’i is at risk of groundwater inundation — flooding that occurs as groundwater is lifted above the ground surface due to sea level rise. Shellie Habel, lead author of the study and doctoral student in the UHM Department of Geology and Geophysics, School of Ocean and Earth Science and Technology (SOEST), and colleagues developed a computer model that combines ground elevation, groundwater location, monitoring data, estimates of tidal influence, and numerical groundwater-flow modeling to simulate future flood scenarios in the urban core as sea level rises three feet, as is projected for this century under certain climate change scenarios.
“This flooding will threaten $5 billion of taxable real estate; flood nearly 30 miles of roadway; and impact pedestrians, commercial and recreation activities, tourism, transportation, and infrastructure,” said Habel. “The flooding will occur regardless of seawall construction, and thus will require innovative planning and intensive engineering efforts to accommodate standing water in the streets.”
Surprisingly, the team of researchers also discovered 86% of active cesspools in the study area are likely currently inundated by groundwater. This suggests that cesspool effluent is now entering coastal groundwater and coastal environments in the study area. Sea level rise of approximately three feet would fully inundate 39 cesspools, introducing effluent at the ground surface where people work and live. This presents a serious health concern that will become progressively more serious as contaminated waters begin breaching the ground surface.
They also found that the water table is close to the ground surface — within two feet at high tide — in many places. This narrow unsaturated space means that groundwater inundation will become a serious concern well before the end of the century. When it rains and infiltration fills this space, it is a problem already.
“Waikiki, the gateway of the state’s tourism industry, currently has such narrow unsaturated space that many construction projects working below the ground surface have to dewater the excavation before construction can begin,” said Habel.
“Our findings suggest that coastal communities in Hawai’i and globally are exposed to complex groundwater flooding hazards associated with sea level rise in addition to the typical concerns of coastal erosion and wave overtopping,” said Chip Fletcher, professor of Geology and Geophysics and associate dean in SOEST and principal investigator on the study. “Groundwater inundation will require entirely unique adaptation methods if we are to continue to live in and develop the coastal zone. Coastal planners and community stakeholders will need to work with architects, engineers, geologists, ecologists, economists, hydrologists, and other innovative thinkers in order to manage these problems.”
This study identified particular locations and infrastructure that will be vulnerable to future flooding and is a crucial first step towards addressing future challenges. The team of researchers hope to use this methodology to identify future flooding and at risk infrastructure in other locations, as well as assist in developing adaptation efforts among vulnerable coastal communities.
Reference:
Shellie Habel, Charles H. Fletcher, Kolja Rotzoll, Aly I. El-Kadi. Development of a model to simulate groundwater inundation induced by sea-level rise and high tides in Honolulu, Hawaii. Water Research, 2017; 114: 122 DOI: 10.1016/j.watres.2017.02.035
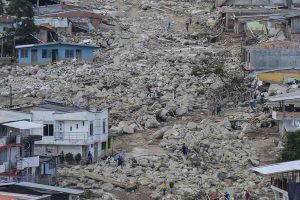
Aerial view of the extensive damage caused by mudslides as a result of heavy rains, in Mocoa, Putumayo department, Colombia on April 3, 2017
It starts with torrential rain in the mountains. Then a wall of mud and boulders comes barreling down the slopes, sweeping away houses, cars and people.
Like a video stuck on repeat, the story has played out over and over again in recent weeks in South America, where hundreds of people have been killed in landslides.
First they hit Peru, where the indigenous Quechua language has a word for these flash flood-landslides: “huaycos.”
More than 100 people have been killed since the start of the year in flooding and landslides in Peru, and more than 100,000 have lost homes or otherwise been affected.
In Colombia, the devastation is even worse.
The southern town of Mocoa was hit by an enormous landslide Friday that killed 262 people, including 43 children.
Why do these natural disasters occur? And why is South America being hit so hard right now?
“Nature has always been like this. Our ancestors understood it better than we do today,” said Peruvian architect Augusto Ortiz de Zevallos.
“Just look at the archaeological sites that remain, sheltered from the onslaught of water,” he told AFP.
Modernization has led to forests being replaced by farms, eliminating the natural barriers that restrain the water from torrential rains.
“During the (floods) of 2010 and 2011… 71 percent of the flooding happened in pasture land that had lost its trees,” the head of the weather warning system for the Colombian meteorological institute, Christian Euscategui, told newspaper El Tiempo.
Colombia’s weather authorities, who keep a close eye on deforestation, say it slowed by 12 percent in 2015. But that still meant forest losses of more than 124,000 hectares (475 square miles).
‘Nature doesn’t forgive’
Global warming, which is melting the region’s glaciers, is also driving the problem.
“Climate change is generating dynamics and we see the tremendous results in terms of intensity, frequency and magnitude of these natural effects, as we have just seen in Mocoa,” said Martin Santiago, UN chief for Colombia.
Experts say chaotic urbanization is also to blame.
Mocoa’s population was swollen by poor migrants and especially people uprooted by Colombia’s half-century civil war.
These displaced residents and their often precarious houses were hit especially hard by the disaster.
“The centralization of society means people try to move closer to cities, no matter where it is, without considering whether a river used to flow there or if it’s a ravine where rain accumulates,” said architect Ortiz de Zevallos.
In the case of Mocoa, the town “was the victim of a lack of urban planning,” said Colombian ecologist Rodrigo Botero.
“That’s the case in nearly every region of Colombia.”
Even Mocoa’s own mayor, Jose Antonio Castro, said it “is not a place where a town should be,” because of all the rivers surrounding it.
Three of them flooded Friday, triggering the landslide.
In the Peruvian capital Lima—also hit hard recently by flooding and landslides—Mayor Luis Castaneda said nature “got the better of engineering.”
But that misses the whole point, said Ortiz de Zevallos.
“Engineering is about understanding nature,” like the ancient Incas did, said the architect.
The bishop of Mocoa, Luis Maldonado, had his own take when asked if God had abandoned the town’s people.
“God always forgives, man sometimes does, but nature doesn’t forgive,” he said.
Note: The above post is reprinted from materials provided by AFP.
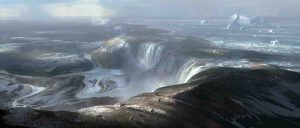
An illustration of what the land bridge connecting Britain to Europe may have looked like before the formation of the Dover Strait. The foreground is around where the port of Calais is today and way in the distance (the background of this illustration) is early Britain. Huge waterfalls cascading over the land bridge represents the beginning of physical separation of Britain from Europe. Credit: Imperial College London/Chase Stone
Researchers have found evidence of how ancient Britain separated from Europe, which happened in two stages, they report today in Nature Communications.
Nearly 450,000 years ago, when Earth was in the grip of an ice age, ice stretched right across the North Sea, from Britain to Scandinavia. The low sea levels meant that the entire English Channel was dry land, a frozen tundra landscape, crisscrossed by small rivers.
Britain’s separation from mainland Europe is believed to be the result of spill over from a proglacial lake – a type of lake formed in front of an ice sheet – in the North Sea, but this has remained unproven. Now, researchers from Imperial College London and their colleagues from institutes in Europe show that the opening of the Dover Strait in the English Channel occurred in two episodes, where an initial lake spill over was followed by catastrophic flooding.
Ten years ago, the researchers from Imperial College London revealed geophysical evidence of giant valleys on the seafloor in the central part of English Channel. They believed these valley networks were evidence of a megaflood gouging out the land, which they speculated may have been caused by a catastrophic breach in a chalk rock ridge joining Britain to France.
The new study by the team, working with their colleagues in Europe, now shows for the first time the details of how this chalk ridge in the Dover Strait, between Dover and Calais, was breached. New geophysical data collected by colleagues from Belgium and France has been combined with seafloor data from the UK showing evidence of huge holes and a valley system located on the seafloor.
The team show that the chalk ridge acted like a huge dam and behind it was a proglacial lake. This lake was first hypothesised by scientists more than 100 years ago and the authors of today’s study show how the lake overflowed in giant waterfalls, eroding the rock escarpment, weakening it and eventually causing it to fail and release huge volumes of water onto the valley floor below.
The team believe that the huge holes that they analysed on the seafloor are plunge pools, created when water cascading over an escarpment hit the ground and eroded rock. The plunge pools in the Dover Strait are huge – up to several kilometres in diameter and around 100 metres deep and were drilled into solid rock. Around seven plunge pools run in a line from the ports of Calais to Dover. The researchers suggest these plunge pools are evidence of an overflow of water from the lake in the southern North Sea.
The straight line of the plunge pools suggests they were cascading off one single rock ridge perhaps 32 kilometres long and 100 metres high- the land bridge between Europe and the UK.
The researchers have also found evidence that a second event fully opened the Dover Strait. Later on, perhaps hundreds of thousands of years later, a new valley system, the Lobourg Channel, was carved by megaflood processes that crossed the Dover Strait. The researchers demonstrate that this valley system is connected to the giant valley network in the central English Channel. They suggest that a spill over of other, smaller lakes in front of the ice sheets in the North Sea may have been responsible for the later episode of flood erosion.
It has taken ten years, but by pulling all the pieces of the geological jigsaw puzzle together the team say they are more confident about what may have caused the megaflood in the English Channel thousands of years ago.
Dr Jenny Collier, a co-author of the study from the Department of Earth Science and Engineering at Imperial College London, said: “Based on the evidence that we’ve seen, we believe the Dover Strait 450,000 years ago would have been a huge rock ridge made of chalk joining Britain to France, looking more like the frozen tundra in Siberia than the green environment we know today. It would have been a cold world dotted with waterfalls plunging over the iconic white chalk escarpment that we see today in the White Cliffs of Dover.
“We still don’t know for sure why the proglacial lake spilt over. Perhaps part of the ice sheet broke off, collapsing into the lake, causing a surge that carved a path for the water to cascade off the chalk ridge. In terms of the catastrophic failure of the ridge, maybe an earth tremor, which is still characteristic of this region today, further weakened the ridge. This may have caused the chalk ridge to collapse, releasing the megaflood that we have found evidence for in our studies.”
Engineers first found evidence of the plunge pools when they were carrying out geological surveys of the Dover Strait seafloor back in the 1960s. No one knew what caused them, but they were called the Fosse Dangeard. The loose gravel and sand infilling these plunge pools meant that the engineers had to move the route of the Channel Tunnel to avoid them. In 1985 a marine geologist named Professor Alec Smith, from Bedford College in London, first proposed that the holes were created by ancient waterfalls, but the lack of hard evidence meant that the assertions were largely forgotten. Now, the authors of today’s study say Smith’s original assertions were right.
The scientists say if it wasn’t for a set of chance geological circumstances, Britain may have still remained connected to mainland Europe, jutting out into the sea similarly to Denmark.
Professor Sanjeev Gupta, a co-author from the Department of Earth Science and Engineering at Imperial, added: “The breaching of this land bridge between Dover and Calais was undeniably one of the most important events in British history, helping to shape our island nation’s identity even today. When the ice age ended and sea levels rose, flooding the valley floor for good, Britain lost its physical connection to the mainland. Without this dramatic breaching Britain would still be a part of Europe. This is Brexit 1.0 – the Brexit nobody voted for.”
The team still do not have an exact timeline of events. In the next step, the researchers would like to take core samples of the in-filled sediments in the plunge pools, which they will analyse to determine the timing of erosion and infill of the plunge pools, the environments represented by these sediments, and the source of the sediments. Developing a timeline of events would enable them to learn more about the distinctive evolution of Britain, compared to mainland Europe. However, this will be a real challenge for the team as getting sediment core samples in the Dover Strait means dealing with huge tidal changes and traversing the world’s busiest shipping lane.
This is Cligga, Cornwall. Credit: Dr Beth Simons (University of Exeter)
The composition of vast swathes of granite found underneath much of the South West peninsula of Britain could offer a vital clue to where deposits of metals crucial for the production of many low carbon technologies can be found.
A team of researchers, led by experts from the world-renowned Camborne School of Mines, part of the University of Exeter, have studied how different types of granite found across the region, most famously seen as rugged tors on the moors, can be associated with certain metal deposits. The world-renowned tin deposits in Cornwall and Devon are known to be associated with the granites.
The team studied the five main granite types found in the South West to determine whether different types — which are defined by their varying grainsize, colour, texture, mineralogy and chemistry — could expose which metal deposits would be found nearby. In particular, the researchers were looking to discover if there were specific concentrations of rare metals — such as tungsten, lithium, indium and tantalum — in the South West, and what natural processes controlled their distribution. Whilst there has been extensive historical mining across South West England, mining declined prior to the need for a number of these rare metals.
They discovered that topaz granites, found on the south coast of Cornwall, around St Austell and close to Okehampton in Devon, are extremely enriched in lithium in particular, as well as having a highest concentration of metals such as tin and tungsten out of any granite in the region. They also demonstrated that tin and tungsten behave differently than expected, with tungsten being associated with older muscovite granites, while tin is more enriched in younger tourmaline granites. This may impact upon where we look for these metals across the region.
The study is published in leading geology journal, Lithos.
The research project was carried out over a three-year period, when the team collected samples of granite from across the South West peninsula. These samples were then crushed, ground, and analysed for their chemical and mineral composition. The researchers then used geochemical modelling equations to try and predict how the different metals behave in the different types of granites found in the region during source melting and granite evolution.
Dr Beth Simons, a Research Fellow at the University of Exeter’s Penryn Campus in Cornwall and lead author of the paper said: “The research gives us a far better understanding of the behaviour of ‘newer’ metals like indium in the crust, which haven’t been so extensively mined or even researched before.
“It is vitally important to improve our knowledge of these metals, not only because they are deemed essential for many low carbon technologies such as solar panels, household goods such as mobile phones and MRI scanners, but also because there are well documented issues relating to security of their supply.
“This research provides important insights into of how tin, tungsten and rare metals evolve in peraluminous, or “tin”, granites, from the granite source, through granite evolution prior to forming mineral deposits. This study could be applied to other peraluminous granites, helping to further our understanding of rare metals and contribute to finding new resources in the future.”
Fractionation of Li, Be, Ga, Nb, Ta, In, Sn, Sb, W and Bi in the peraluminous Early Permian Variscan granites of the Cornubian Batholith: Precursor processes to magmatic-hydrothermal mineralisation by Beth Simons, Jens Anderson and Robin Shail from the Camborne School of Mines, and Frances Jenner from the Open University is published in Lithos.
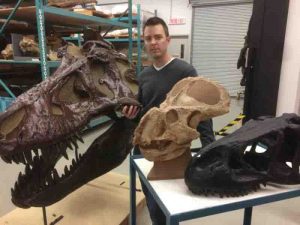
A team of researchers, including UNM Honors College Professor Jason R. Moore, has found a new species of tyrannosaur dinosaur — the most popular of the prehistoric creatures. After the fossils were pulled out of the muddy banks of a Montana river, the team was able to analyze the texture of the facial bones of the new species. The findings suggest that the face of tyrannosaurs was covered in a scaly protective layer with a high degree of tactile sensitivity, similar to crocodiles. Credit: Thomas Carr
A team of researchers, including UNM Honors College Professor Jason R. Moore, has found a new species of tyrannosaur dinosaur — the most popular of the prehistoric creatures.
After the fossils were pulled out of the muddy banks of a Montana river, the team was able to analyze the texture of the facial bones of the new species. The findings suggest that the face of tyrannosaurs was covered in a scaly protective layer with a high degree of tactile sensitivity, similar to crocodiles.
“Being a tyrannosaur, they had really small arms,” says Moore. “They wouldn’t be able to interact with their environment with their hands the way mammals do — find food, build nests, tend to eggs and young. In order to do these things, Daspletosaurus needed to use its feet or head. The discovery and analysis of the tyrannosaur shows that the dinosaur had a developed face sensitivity similar to the sensitivity in our finger tips, suggesting it could use its snout for all those complex ecological interactions, similar to the way crocodiles do today.”
An investigation by a team of scientists from Wisconsin, Australia, Louisiana, Montana and New Mexico has identified and named the new species of the tyrannosaur clan: Daspletosaurus horneri — “Horner’s Frightful Lizard.”
The species is named for the renowned dinosaur paleontologist, John “Jack” R. Horner, formerly curator at the Museum of the Rockies (MOR) in Bozeman, Montana. The tyrannosaur’s name honors his discoveries of numerous dinosaur fossils and his mentorship of so many students that launched them on to accomplished scientific careers. The name-bearing specimens are stored in the research collections of the MOR.
The fossil resources of Montana, where the new tyrannosaur was found, are central to studies of dinosaur evolution.
“Montana, similar to many Rocky Mountain states, has lots of rock exposed at the right time and right environment to contain dinosaurs,” says Moore. “The fossils are found preserved in ancient river channels and flood plains. If you know what you’re looking for, they are widespread.”
The research is led by Thomas Carr of Carthage College’s Department of Biology in Wisconsin, an expert on the evolution and growth of Tyrannosaurus rex and its closest relatives, collectively called tyrannosaurs.
The family tree
In addition to adding a new species to the tyrannosaur family tree, the team’s research provides new information about the mode of evolution and life appearance of tyrannosaurs, specifically the face.
This latest study, published in Nature Publishing Group’s Scientific Reports, found evidence for a rare, nonbranching type of evolution in tyrannosaurs and that tyrannosaurs had scaly, lipless faces and a highly touch-sensitive snout.
“Daspletosaurus horneri was the youngest, and last, of its lineage that lived after its closest relative, D. torosus, which is found in Alberta, Canada,” says Carr. “The geographic proximity of these species and their sequential occurrence suggests that they represent a single lineage where D. torosus has evolved into D. horneri.”
Moore elaborated, “One of the difficulties in demonstrating this style of evolution is establishing that the different species don’t overlap in time. The new radiometric dates we measured help support this temporal separation between D. torosus and D. horneri.”
The research confirms that the ages of the two species shows that the evolution of the dinosaur was slow — happening over a span of 2.3 million years.
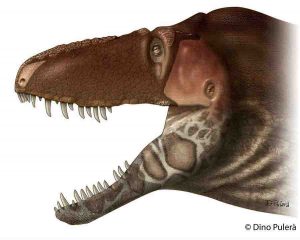
The team’s work literally changes the face of tyrannosaurs, which they found was covered by a lipless ‘mask’ of large flat scales and extensive patches of armor-like skin. This conclusion results from comparison of tyrannosaur skulls with those of crocodylians, birds and mammals, and earlier work by other researchers who had matched bone texture with different types of skin covering.
Jayc Sedlmayr, professor at the Louisiana State University Health Sciences Center New Orleans, explained, “Much of our research … was generated from lab based comparative anatomy, where you get arms deep in ‘blood and guts’ dissecting birds — living dinosaurs and crocodilians — their closest living relatives.”
The crocodile connection
“It turns out that tyrannosaurs are identical to crocodylians in that the bones of their snouts and jaws are rough, except for a narrow band of smooth bone along the tooth row,” explained Carr. “We did not find any evidence for lips in tyrannosaurs: the rough texture covered by scales extends nearly to the tooth row, providing no space for lips.”
“However, we did find evidence for other types of skin on the face, including areas of extremely coarse bone that supported armor-like skin on the snout and on the sides of the lower jaws. The armor-like skin would have protected tyrannosaurs from abrasions, perhaps sustained when hunting and feeding.”
The researchers found that, like in crocodylians, the snout and jaws of the tyrannosaurs are penetrated by numerous small nerve openings, allowing hundreds of branches of nerves to innervate the skin, producing a sensitivity similar to that of human fingertips.
This sensitivity is part of a bigger evolutionary story, explained Sedlmayr. “The trigeminal nerve has an extraordinary evolutionary history of developing into wildly different ‘sixth senses’ in different vertebrates, such as sensing magnetic fields for bird migration, electroreception for predation in the platypus bill or the whisker pits of dolphins, sensing infrared in pit vipers to identify prey, guiding movements in mammals through the use of whiskers, sensing vibrations through the water by alligators and turning the elephant trunk into a sensitive ‘hand’ similar to what has been done to the entire face of tyrannosaurs.”
Reference:
Thomas D. Carr, David J. Varricchio, Jayc C. Sedlmayr, Eric M. Roberts, Jason R. Moore. A new tyrannosaur with evidence for anagenesis and crocodile-like facial sensory system. Scientific Reports, 2017; 7: 44942 DOI: 10.1038/srep44942
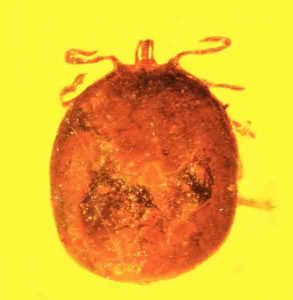
This tick found as a fossil in amber shows two small holes in its back, as if it were just picked off the animal it was feeding on. Credit: Photo by George Poinar, Jr., courtesy of Oregon State University
Two monkeys grooming each other about 20-30 million years ago may have helped produce a remarkable new find — the first fossilized red blood cells from a mammal, preserved so perfectly in amber that they appear to have been prepared for display in a laboratory.
The discovery, published in the Journal of Medical Entomology, also describes the only known fossils of a type of parasite that still exists today, Babesia microti, which infects the blood cells of humans and other animals.
Two small holes in the back of a blood-engorged tick, which allowed blood to ooze out just as the tick became stuck in tree sap that later fossilized into amber, provide a brief glimpse of life in a tropical jungle millions of years ago in what is now the Dominican Republic.
“These two tiny holes indicate that something picked a tick off the mammal it was feeding on, puncturing it in the process and dropping it immediately into tree sap,” said George Poinar, Jr., professor emeritus in the College of Science at Oregon State University, author of the study and an international expert on plant and animal life forms found preserved in amber.
“This would be consistent with the grooming behavior of monkeys that we know lived at that time in this region. The fossilized blood cells, infected with these parasites, are simply amazing in their detail. This discovery provides the only known fossils of Babesia-type pathogens.”
The fossil parasites add to the history of the Order Piroplasmida, of which the Babesiidae is one family. In humans, the parasite B. microti can cause babesiosis, a disease with symptoms that resemble malaria and can be fatal. A related parasite in cattle can cause Texas cattle fever, which has been a historic problem in the plains states, and just this spring is causing another outbreak that has led to quarantines on more than 500,000 acres of land in Texas.
“The life forms we find in amber can reveal so much about the history and evolution of diseases we still struggle with today,” Poinar said. “This parasite, for instance, was clearly around millions of years before humans, and appears to have evolved alongside primates, among other hosts.”
Part of what makes these fossils unique, Poinar said, is the clarity by which the parasites and blood cells are preserved, almost as if they had been stained and otherwise treated in a laboratory for inspection. The parasites were different enough in texture and density to stand out clearly within the red blood cells during the natural embalming process for which amber is famous.
Reference:
George Poinar, Jr. Fossilized Mammalian Erythrocytes Associated With a Tick Reveal Ancient Piroplasms. Journal of Medical Entomology, 2017 DOI: 10.1093/jme/tjw247
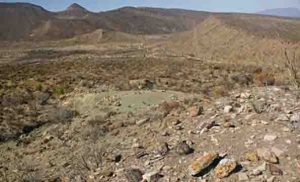
Landscape in the Paredon area: There the researchers encountered fossil imprints while conducting paleontological research. Credit: Wolfgang Stinnesbeck
According to the latest research results of a German-Mexican team of geoscientists, the gradual decline of the dinosaurs and pterosaurs presumably came before the impact of the Chicxulub asteroid and the global mass extinction at the end of the Cretaceous Period. Studies under the direction of Prof. Dr Wolfgang Stinnesbeck of Heidelberg University and Prof. Dr Eberhard Frey of the State Museum of Natural History Karlsruhe also indicate that bird species spread and diversified at the same time the dinosaurs disappeared. Their results were published in the journal Geological Society of America Bulletin.
While conducting paleontological research in northeastern Mexico, the scientists came upon sedimentary rock deposited toward the end of the Cretaceous Period that evidenced an enormous diversity of fossils, including the tracks of birds, dinosaurs and pterosaurs. “Most of the imprints come from at least five different species of birds; dinosaur tracks, however, are rare. Only a single footprint comes from a predatory dinosaur,” explains Prof. Stinnesbeck. The finds therefore indicate a gradual decline of the dinosaurs with a simultaneous increase in the diversity of birds even before the end of the Cretaceous Period. “Until now, it was generally assumed that the dinosaurs died out first and bird species diversified afterward,” states the researcher. “Our data, however, substantiate the theory that birds ascended before dinosaurs became extinct.”
Fossil analysis also showed that the decline of the dinosaurs occurred gradually, with probably only a few species surviving until the end of the Cretaceous Period. The extinction of the dinosaurs is therefore not — as science frequently assumes — due to the impact of the Chicxulub asteroid that struck Earth more than 65 million years ago. “For most of the dinosaurs and pterosaurs, this strike no longer had any effect,” explains Prof. Stinnesbeck. Even the group of cephalopods, the so-called ammonites, was not annihilated by the asteroid strike at the end of the Cretaceous Period. According to Prof. Stinnesbeck, fossil finds of the Sphenodiscus pleurisepta ammonite show their successive decline beyond the Cretaceous Period. “The effects of the Chicxulub impact were therefore not the cause of a global mass extinction, which probably came about considerably less catastrophically than previously assumed,” states the Heidelberg researcher.
Reference:
Wolfgang Stinnesbeck, Eberhard Frey, Belinda Espinoza-Chávez, Patrick Zell, José Flores-Ventura, Héctor E. Rivera-Sylva, Arturo H. González-González, José M. Padilla Gutierrez, Francisco J. Vega. Theropod, avian, pterosaur, and arthropod tracks from the uppermost Cretaceous Las Encinas Formation, Coahuila, northeastern Mexico, and their significance for the end-Cretaceous mass extinction. Geological Society of America Bulletin, 2017; 129 (3-4): 331 DOI: 10.1130/B31554.1
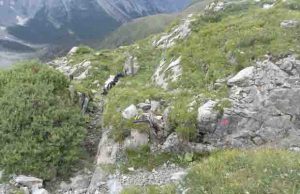
A dark patch of rock on the left marks the Rauchkofel Boden trench, dug in the Cardiola Formation of the Austrian Alps during World War I. Many fossils have been found at the site. Credit: Photo courtesy of Annalisa Ferretti, University of Modena and Reggio Emilia.
An unusual fossil find is giving scientists new ideas about how some of the earliest animals on Earth came to dominate the world’s oceans.
An international research team found 425-million-year-old fossilized remnants of juvenile crinoids, a distant ancestor of today’s sea lilies, encased in iron oxide and limestone in the Austrian Alps.
Researchers collected the rock from a formation on the border between Italy and Austria known as the Cardiola Formation, which was exposed in trenches dug during World War I.
Crinoids were abundant long ago, when they carpeted the sea floor. Most stalked crinoid fossils depict spindly, plantlike animals anchored to sea floor rocks, explained William Ausich, professor of earth sciences at The Ohio State University and co-author of the study in the open-access journal Geologica Acta.
Fossils of juvenile crinoids are rare, he said.
Rarer still is that these newly uncovered crinoids weren’t attached to rocks when they died. Whatever they were attached to during their young lives didn’t survive fossilization.
“The fossils indicate that they were either attached to objects floating in the water at the time, or attached to another bottom dweller that lacked preservable hard parts,” said Ausich said.
They might have clung to free-floating algae beds or swimming cephalopods, either of which could have carried them far away from where they formed as larvae.
Modern sea lilies reproduce by ejecting sperm and eggs into the water. Larvae grow into free-floating juvenile animals and eventually attach to the ocean bottom, where they grow to adulthood within 18 months.
At least, that’s what sea lilies do today. This fossil find suggests that their distant ancestors sometimes settled on objects that carried them far from home before they reached reproductive age.
“We now have important information about the behavior of these ancient organisms, and a clue as to why they had such a wide geographic distribution,” Ausich said.
With long, stem-like bodies topped with feathery fronds, crinoids resembled flowers, though the center of the “flower” was a mouth, and the “petals” were arms that captured plankton for food. At the other end of the creature was star-shaped organ called a holdfast, which gripped the seafloor.
While some of today’s sea lilies are able to detach their holdfasts from the seafloor and walk short distances on their arms, they don’t do it often. If their crinoid ancestors spent their entire adult lives similarly anchored to one spot, they couldn’t have spread worldwide without help.
Fossilized holdfasts are all that remain of the young crinoids uncovered in the Alps, and that’s not unusual, Ausich said.
“The hard part about studying the fossils that I study is that they need to be buried alive in order to be completely preserved,” he explained. “Crinoids and other echinoderms have a skeleton comprised of innumerable individual calcite plates held together by various connective soft tissues. These tissues begin to decompose within a day of an organism’s death.
“So, having only parts [of crinoids] rather than whole organisms is actually the norm — as frustrating as that may be.”
The sediment that eventually covered these young crinoids must have been rich in iron, because the holdfasts were preserved as minerals of iron oxide — and that detail is unusual, he added.
Today, the fossil holdfasts look like rusty star-shaped rings. The stars measure only 1 to 4 millimeters across, meaning they came from very young, post-larval juveniles.
The tiny fossils might have been hard to isolate from the surrounding rock, but researchers were able to take advantage of the presence of iron oxide to dissolve the limestone and pull the fossils from the resulting slurry with a magnet.
Researchers had actually collected rock samples from the Cardiola Formation long ago, Ausich said. The area contains abundant fossils, including ancient corals and trilobites. But only recently did anyone discover that these particular rock samples also contained the crinoid holdfasts.
Researchers are interested in crinoids not just because they’re part of Earth’s history, but because the various crinoid species were able to survive millions of years of climate changes to become the sea lilies we know today.
Reference:
A. Ferretti, W. I. Ausich, C. Corradini, M. G. Corriga, H. P. Schönlaub. Stars in the Silurian sky. A case study from the Carnic Alps, Austria. Geologica Acta, March 2017 DOI: 10.1344/GeologicaActa2016.14.4.1
Note: The above post is reprinted from materials provided by Ohio State University. Original written by Pam Frost Gorder.
An investigation by a team of scientists from Australia, Louisiana, Montana, New Mexico, and Wisconsin has identified and named a new species of the tyrannosaur clan: Daspletosaurus horneri — “Horner’s Frightful Lizard.”
The species is named for renowned dinosaur paleontologist John “Jack” R. Horner, formerly curator at the Museum of the Rockies (MOR) in Bozeman, Montana. The tyrannosaur’s name honors his discoveries of numerous dinosaur fossils and his mentorship of so many students that launched them to accomplished scientific careers. The type (name-bearing) specimens are stored in the research collections of the MOR.
The research is led by Thomas Carr, a professor in Carthage College’s Biology Department and an expert on the evolution and growth of Tyrannosaurus rex and its closest relatives, collectively called tyrannosaurs.
The fossil resources of Montana, where the new tyrannosaur was found, are central to studies of dinosaur evolution, explains Professor David Varricchio of Montana State University: “These specimens emphasize the excellent record of dinosaurs to be found in Montana. They highlight both the quality of the specimens, the preservation revealing the details of how these giant carnivores once looked in life, as well as the overall collection of specimens that provides insight into the evolution of the tyrannosaur group. Montana remains a wonderful place to explore the Cretaceous.”
In addition to adding a new species to the tyrannosaur family tree, the team’s research provides new information about the mode of evolution and life appearance of tyrannosaurs — specifically the face. This latest study, published today in Nature Publishing Group’s Scientific Reports, found evidence for a rare, nonbranching type of evolution in tyrannosaurs and that tyrannosaurs had scaly, lipless faces and a highly touch-sensitive snout.
Carr said: “Daspletosaurus horneri was the youngest, and last, of its lineage that lived after its closest relative, D. torosus, which is found in Alberta, Canada. The close evolutionary relationship between the species taken with their geographic proximity and their sequential occurrence suggests that together they represent a single lineage that changed over geological time, where D. torosus has morphed into D. horneri.”
Jason Moore, a professor in the Honors College at the University of New Mexico, elaborated: “One of the difficulties in demonstrating anagenetic change, as we suggest occurred in the Daspletosaurus lineage, is establishing that the different species in question don’t overlap in time. The new radiometric dates we measured from the Two Medicine Formation not only help support that D. torosus and D. horneri did not live at the same time, but also help us refine the timeline of environmental and ecological changes recorded by the Two Medicine Formation.”
Eric Roberts, a professor in geosciences with the College of Science and Engineering at James Cook University, explained: “Advances in radioisotopic dating of sedimentary deposits is key to testing this and many other evolutionary and ecological questions about dinosaurs and other ancient organisms. New age dates presented in this study are just the tip of the iceberg. Ongoing work in this field will provide unprecedented improvements in the dating of Late Cretaceous dinosaurs from western North America over the next few years.”
Continued Carr, “When we consider the geological ages of the two species, the evolution of Daspletosaurus gives us an indication of how slowly evolution can act on large dinosaurs, which in this case happened over a span of 2.3 million years.
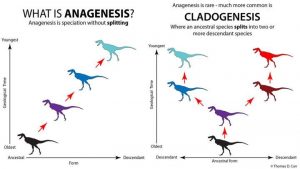
“This type of speciation is called anagenesis, which is different from the more common type called cladogensis, where an ancestral species splits into two or more descendant species. Although uncommon in many evolutionary studies, anagenesis has been reported in some duck- billed dinosaurs and horned dinosaurs. Daspletosaurus and these other dinosaurs point the way forward in picking out the evidence for anagenesis in the fossil record.”
The team’s work literally changes the face of tyrannosaurs, which they found was covered by a lipless “mask” of large flat scales and extensive patches of armor-like skin. This conclusion results from comparison of tyrannosaur skulls with those of crocodilians, birds, and mammals, and earlier work by other researchers who had matched bone texture with different types of skin covering.
Jayc Sedlmayr, a professor at the Louisiana State University Health Sciences Center New Orleans, explained, “Much of our research went beyond field paleontology: it was generated from lab based comparative anatomy, where you get arms deep in “blood and guts” dissecting birds as living dinosaurs and crocodilians as their closest living relatives and based on the similarities of the facial nerves and arteries we found in those same groups that left a trace on the bones, we were able to then reconstruct them in the new tyrannosaur species.”
“It turns out that tyrannosaurs are identical to crocodilians in that the bones of their snouts and jaws are rough, except for a narrow band of smooth bone along the tooth row. In crocodilians, the rough texture occurs deep to large flat scales; given the identical texture, tyrannosaurs had the same covering,” explained Carr. “We did not find any evidence for lips in tyrannosaurs: the rough texture covered by scales extends nearly to the tooth row, providing no space for lips.
“However, we did find evidence for other types of skin on the face, including areas of extremely coarse bone that supported armor-like skin on the snout and on the sides of the lower jaws. The armor-like skin would have protected tyrannosaurs from abrasions, perhaps sustained when hunting and feeding.”
“Strikingly, the large horn behind the eye is elevated beyond the side of the head, indicating a covering of keratin, the hard and shiny material that makes up human fingernails,” he continued.
In crocodilians and tyrannosaurs, the snout and jaws are penetrated by numerous small nerve openings, allowing hundreds of branches of the trigeminal nerve to innervate the skin, producing a sensitivity that, in crocodilians, is as sensitive as human fingertips. “Given that the foramina are identical in tyrannosaurs indicates that they had super-sensitive skin as well,” explained Carr.
This sensitivity is part of a bigger evolutionary story, explained Sedlmayr. “Our findings of a complex sensory web is especially interesting because it is derived from the trigeminal nerve, which has an extraordinary evolutionary history of developing into wildly different ‘sixth senses’ in different vertebrates, such as sensing magnetic fields for bird migration, electroreception for predation in the platypus bill or the whisker pits of dolphins, sensing infrared in pit vipers to identify prey, guiding movements in mammals through the use of whiskers, sensing vibrations through the water by alligators, and turning the elephant trunk into a sensitive ‘hand’ similar to what has been done to the entire face of tyrannosaurs.”
Reference:
Thomas D. Carr, David J. Varricchio, Jayc C. Sedlmayr, Eric M. Roberts, Jason R. Moore. A new tyrannosaur with evidence for anagenesis and crocodile-like facial sensory system. Scientific Reports, 2017; 7: 44942 DOI: 10.1038/srep44942
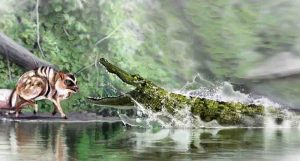
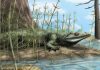
Diplocynodon ratelii, which is very similar in appearance to today’s caimans, stalked small prey, such as rodents and other extinct fish. Credit: José Antonio Peñas (SINC)
Sixteen million years ago, the reptile Diplocynodon ratelii lived in wooded ecosystems among the lakes and pools of what we know today as Catalonia (Spain). Fossils found at the Els Casots site in the Vallès-Penedès Basin confirm not only that these are the most recent remains of the genus in the Iberian Peninsula, but also that temperatures at the time were higher than today’s.
A group of researchers working at the Els Casots site in the 1990s excavated the remains of a species of crocodile that was until then known only to have lived in southern France.
Following several years in storage as they awaited analysis, the fossils have now been confirmed by new research published in the journal Comptes Rendus Palevol to be the first evidence of Diplocynodon ratelii in the Iberian Peninsula, where evidence had previously only been found for other species of this genus.
In addition to this, “these remains represent the latest published evidence of the genus in the Iberian Peninsula, as until now it had only been recorded much less recently, in the Eocene and Oligocene epochs, over 23 million years ago,” Sinc was told by the lead author of the paper, David Alba of the Catalan Institute of Paleontology Miquel Crusafont (ICP).
To reach these conclusions, the study provides the most detailed anatomical descriptions of the species given to date, highlighting the small size of the reptile, which measured no more than a metre long, according to craniums found at the site in Catalonia. Diplocynodon ratelii was a diplocynodon which would have originated prior to the divergence between caimans and alligators.
“The genus Diplocynodon was widely distributed across Europe for over 40 million years (from the Paleocene to the Miocene) and includes many species of small crocodiles similar in appearance to caimans and alligators (the family to which the species belongs, now extinct, is part of the alligatoroidea superfamily, alongside caimans and alligators),” said the researcher.
Fauna in Catalonia during the early Miocene
Today, alligatoroids are more common in the Americas and East Asia, but millions of years ago, they were widespread in Eurasia. Diplocynodon ratelii, which is very similar in appearance to today’s caimans, stalked small prey, such as rodents and other extinct fish and reptile species that were present during the early Miocene. It also hunted larger mammals, such as mouse-deer.
According to remains found in recent years in Els Casots, these crocodiles would also have shared their habitat with large mammals: rhinoceroses, the equid genus Anchitherium, peccaries, mouse-deer, primitive pigs and bovines, extinct relatives of elephants (including the mastodon and a proto-elephant named deinotherium) and some carnivorous species, such as the so-called bear dogs and felids, hyaenids and extinct mustelids.
The presence of crocodiles in this area of the Iberian Peninsula can be explained by evidence from the analysis of other paleo-environmental remains from the site, from 16 million years ago, which indicate that there was once a lake there.
Given the abundance of fauna remains found in Els Casots, which is listed as an Cultural Asset of National Interest, the research group is interested in reopening the excavations. Working in collaboration with the municipal government of Subirats, which owns the land, the scientists intend to recover additional fossil remains that may contribute to improving the available information on the fauna, paleoenvironment and taphonomy of the site as a whole and on the taxonomy and paleobiology of specific species.
“Reopening the site could also be linked to other actions to disseminate paleontology and paleontological heritage, although there still needs to be a discussion into how we would go about doing this,” concludes David Alba.
Reference:
José Luis Díaz Aráez et al. New remains of Diplocynodon (Crocodylia: Diplocynodontidae) from the Early Miocene of the Iberian Peninsula, Comptes Rendus Palevol (2017). DOI: 10.1016/j.crpv.2015.11.003
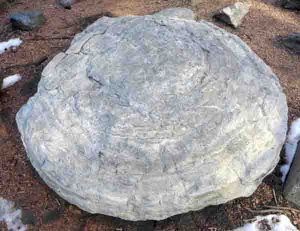
A stromatolite from Northern Wisconsin in the courtyard of Weeks Hall on the UW–Madison campus. Credit: David Tenenbaum
A study that used a new digital library and machine reading system to suck the factual marrow from millions of geologic publications dating back decades has unraveled a longstanding mystery of ancient life: Why did easy-to-see and once-common structures called stromatolites essentially cease forming over the long arc of earth history?
Stromatolites are contorted layers of sediment formed by microbes, and they are often found in limestone and other ancient sedimentary rocks deposited beneath oceans.
“Geologists have known for a long time that stromatolites were abundant in shallow marine environments during the Precambrian, before the emergence of multi-cellular life” more than 560 million years ago, says Jon Husson, a post-doctoral researcher and co-author of a study now online in the journal Geology. “But, stromatolites are rare in the ocean today.”
The new study measures the slide in stromatolite prevalence based on descriptions of rocks sifted from more than 3 million scientific publications.
“Paleontologists have largely attributed the decline in stromatolites to the evolution of animals, starting some 560 million years ago,” says Shanan Peters, a professor of geoscience at University of Wisconsin-Madison and study first author. “Many multi-cellular animals, like snails, eat microbes. The evolution of these big microbe-grazing animals hit ‘reset’ on the stromatolite’s world. Or so the story has gone.”
The new study found a weak correlation between stromatolite occurrence and the diversity of animals, but a stronger link to seawater chemistry.
“The best predictor of stromatolite prevalence, both before and after the evolution of animals, is the abundance of dolomite in shallow marine sediments,” says Husson. Dolomite is a high-magnesium variety of carbonate, the type of sediment that forms limestone. Dolomite is harder to make than low-magnesium carbonate and it forms today in only a narrow range of marine environments.
When the ocean water is super-saturated with carbonate, “that can make it easier for things like stromatolites to form,” says Husson. “In Lake Tanganyika [Africa], there are stromatolites forming today, even though there are animals everywhere, snails and fish. The lake is super-saturated with carbonate, and it’s begging to be precipitated. The microbes come along and help it to precipitate, and the result is an abundance of stromatolites.” Elevated carbonate saturation can also help the formation of dolomite, thereby driving the correlation with stromatolites found in this study.
Measuring the prevalence of stromatolites through all Earth history is difficult because counting the number of stromatolites alone is not sufficient. You must also know how many rocks could potentially have stromatolites, but do not.
The big innovation of this study is the interplay of a new type of digital library and machine reading system called GeoDeepDive with a geological database called Macrostrat. Both were spearheaded by Peters at UW-Madison.
GeoDeepDive is a digital library built on high throughput computing technology that can “read” millions of papers and siphon off specific information. To date, the GeoDeepDive library contains more than 3 million scientific publications from all scientific disciplines; some 10,000 new published papers are added daily.
Macrostrat is a database describing the known geological properties of North America’s upper crust, at different times and depths.
The massive computing capacity at UW-Madison’s Center for High Throughput Computing and HTCondor system, the brainchild of UW-Madison computer scientist Miron Livny, powers GeoDeepDive. Combining the digital library with the geological database allowed the researchers to estimate, at different time periods, the percentage of shallow marine rocks that actually have stromatolites.
The study began in the summer of 2015, when the third author, Julia Wilcots, a Madison-native who was then an undergraduate at Princeton, asked Peters for a summer project. “In my typical fashion I gave Julia a few options,” Peters says. “She picked stromatolites, so I said, ‘Okay, go do it!’ With minimal help from us, she developed a working application to discover and extract every mention of stromatolites from our library.”
Among 10,200 papers that mentioned stromatolites, “our program was able to extract 1,013 with a name of a rock unit, which enabled us to link stromatolite occurrences to Macrostrat,” says Husson.
Wilcots did not have to travel to see stromatolites, Peters says. “In Madison, we are sitting on top of rocks recording one of the biggest rises in stromatolite abundance – at least during the age of animals.”
Scientists long ago observed that stromatolites started a long decline just before the start of the Cambrian era, but that decline represented a “fundamental question of paleobiology,” Husson says. “Stromatolites are the oldest fossils that are visible to the naked eye. If you look at rock that is a billion years old, the chance for seeing evidence of life equals the chance of seeing stromatolites.”
Beyond answering a fundamental question of Earth’s history, the new study “allows us to do the kind of analyses that scientists used to only dream about, Peters says: ‘If we could just compile all the published information on… anything!’
“Doing this study without GeoDeepDive would be all but impossible,” Peters adds. “Reading thousands of papers to pick out references to stromatolites, and then linking them to a certain rock unit and geologic period, would take an entire career, even with Google Scholar. Here we got started with a talented undergrad working on a summer project. GeoDeepDive has greatly lowered the barrier to compiling literature data in order to answer many questions.”
Another beauty of the big data, machine-reading approach is the baked-in capability for replication and improvement. “Now that this study has been done, we can run the stromatolite application again and again. We can refine the searches, and they will evaluate the new data that is being published all the time,” Peters says. “So a rerun could make a better study, with minimal effort.”
For centuries, “geologists have transferred hard-to-get information from the field to hard-to-get information in the literature,” Peters says. “To achieve a broad-scale synthesis, you have to survey all of the published knowledge. There are new discoveries waiting in the scientific literature, if you can see the big picture and get all the data into one place.”
A paleontologist at the Canadian Museum of Nature is countering decades of studies that assert that some dinosaurs can be identified as male or female based on the shapes and sizes of their bones.
Dr. Jordan Mallon, a dinosaur specialist at the museum, argues instead that the fossil evidence for these distinctions is inconclusive and, as a result, it might be time to “rewrite the textbooks.” His report, published today in the online journal Paleobiology, focusses on the biological principle of sexual dimorphism, where males and females of a species can be distinguished based on physical characteristics other than sexual organs.
“I’m not saying that dinosaurs were not dimorphic, but I am saying that there’s no existing fossil evidence to suggest that they were. The jury is still out,” says Mallon.
Mallon made his assessment by revisiting previous studies attributing sexual dimorphism to dinosaurs. The problem, he explains, is that some of those studies not only relied on small sample sizes, but, more importantly, they did not properly analyze the statistical data, which led to invalid conclusions.
“Essentially, if you go back and recrunch the data of those original studies using proper statistical tests such as mixture modelling, then there’s no dimorphism,” explains Mallon. “While others have doubted the existence of dimorphism from the dinosaur fossil record, this is the first published report to show that’s the case.”
Mallon reviewed data on nine species, ranging from horned dinosaurs, to stegosaurs to meat-eating dinos. Among the studies was a seminal 1976 paper assigning sexual dimorphism to about 20 specimens of a horned dinosaur called Protoceratops andrewsi. The author’s analysis said males could be distinguished from females by a broader frill and larger bump on the nose. While the study used a large sample size, Mallon’s retesting of the data shows there is not enough evidence to separate the specimens into two distinct groups based on the shapes of their bones.
Mallon notes that there are ways of distinguishing male dinosaurs from females, but, to date, these sorts of data are sparse and do little to inform an understanding about whether the sexes differed in their external anatomy.
“There are ways of determining the sex of individual females, for example, as some fossils have been found with eggs preserved inside them,” he explains. Mallon also notes that researchers can look for medullary bone, which is a spongy bone deposited in the long bones of egg-laying females, as seen in birds today.
“What we need to do is examine dinosaur specimens that we can positively identify as females, and if you can survey a large enough population of them, you can then say this is what we expect females to look like. One can then study the remainder of the population to compare which ones look like the females that we already know, and which ones don’t. Those would be the males,” says Mallon.
Mallon maintains that he would not be surprised if dimorphism did exist among some dinosaurs, because the phenomenon is seen in living animals such as birds and crocodiles, which are the nearest living relatives of dinosaurs. Male crocodiles, for example, are larger than females, and the male peacock has a large colourful tail.
The challenge for paleontologists is to find fossils of a given species in a large enough number and of similar age to do a proper statistical analysis. And, as Mallon points out, the studies to date are lacking in that regard.
“What I suggest in this paper is that if we want to get at the question of sexual dimorphism in dinosaurs, then it’s going to be really hard to go about it the traditional way,” he explains. “We’ll need to keep searching.”
Reference:
Jordan C. Mallon. Recognizing sexual dimorphism in the fossil record: lessons from nonavian dinosaurs. Paleobiology, 2017; 1 DOI: 10.1017/pab.2016.51
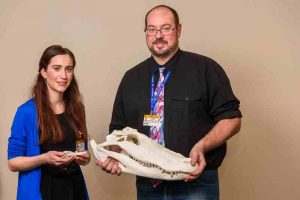
Paleontologists have long assumed that the shape of joints in the skulls of dinosaurs, and their closest modern relatives alligators and birds, reveals how much movement are allowed in their skulls. Researchers from the University of Missouri School Of Medicine recently discovered that although alligators, birds and dinosaurs have a similar skull-joint shape, it no longer can be assumed that this lone fact can determine movement.
“While investigating joints located within the heads of alligators, we found their peg-and-socket shape does not necessarily indicate movement capabilities as it had often been assumed,” said Alida Bailleul, Ph.D., a post-doctoral research fellow in the MU Department of Pathology and Anatomical Sciences. “By examining the joints through a microscope, we were able to see that they were missing the fluid-filled cavity and cartilage needed for movement.”
According to Bailleul, both humans and animals have joints that are built to work like a peg and socket, such as the knee or the elbow joints. She said it is the composition of these peg-and-socket joints, made up of cartilages and fluid-filled cavities, that facilitate movement. There also are pegs and sockets in the heads of alligators that researchers widely assumed were built similar to knee joints with a cavity, fluid and cartilage on both sides. However, when the researchers examined the joints under the microscope, they found that they had a different internal structure with cartilage on only one side, an element that may reflect the bones’ embryological origins.
“We have these two great lineages of archosaurs? alligators on one side and birds on the other? that maintain these joints regardless of how they use their skulls,” said Casey Holliday, Ph.D., associate professor in the Department of Pathology and Anatomical Sciences and co-author of the study. “Despite all the evolutionary changes animals have made, they can’t quite always change everything.”
Although crocodilians’ skulls have evolved to bite down with immense pressure, they still have not managed to lose these joints that, according to Holliday, are vestiges of joints found in the ancestors of birds and crocodiles and are likely useless. On the other hand, the same joints in birds evolved new cartilages and cavities, and increased mobility, an important adaptation for bird feeding behavior and diversity.
Reference:
Alida M. Bailleul, Casey M. Holliday. Joint histology in Alligator mississippiensis challenges the identification of synovial joints in fossil archosaurs and inferences of cranial kinesis. Proceedings of the Royal Society B: Biological Sciences, 2017; 284 (1851): 20170038 DOI: 10.1098/rspb.2017.0038
This visualization is the first global tomographic model constructed based on adjoint tomography, an iterative full-waveform inversion technique. The model is a result of data from 253 earthquakes and 15 conjugate gradient iterations with transverse isotropy confined to the upper mantle. Credit: David Pugmire, ORNL
Because of Earth’s layered composition, scientists have often compared the basic arrangement of its interior to that of an onion. There’s the familiar thin crust of continents and ocean floors; the thick mantle of hot, semisolid rock; the molten metal outer core; and the solid iron inner core.
But unlike an onion, peeling back Earth’s layers to better explore planetary dynamics isn’t an option, forcing scientists to make educated guesses about our planet’s inner life based on surface-level observations. Clever imaging techniques devised by computational scientists, however, offer the promise of illuminating Earth’s subterranean secrets.
Using advanced modeling and simulation, seismic data generated by earthquakes, and one of the world’s fastest supercomputers, a team led by Jeroen Tromp of Princeton University is creating a detailed 3-D picture of Earth’s interior. Currently, the team is focused on imaging the entire globe from the surface to the core-mantle boundary, a depth of 1,800 miles.
These high-fidelity simulations add context to ongoing debates related to Earth’s geologic history and dynamics, bringing prominent features like tectonic plates, magma plumes, and hotspots into view. In 2016, the team released its first-generation global model. Created using data from 253 earthquakes captured by seismograms scattered around the world, the team’s model is notable for its global scope and high scalability.
“This is the first global seismic model where no approximations — other than the chosen numerical method — were used to simulate how seismic waves travel through Earth and how they sense heterogeneities,” said Ebru Bozdag, a coprincipal investigator of the project and an assistant professor of geophysics at the University of Nice Sophia Antipolis. “That’s a milestone for the seismology community. For the first time, we showed people the value and feasibility of running these kinds of tools for global seismic imaging.”
The project’s genesis can be traced to a seismic imaging theory first proposed in the 1980s. To fill in gaps within seismic data maps, the theory posited a method called adjoint tomography, an iterative full-waveform inversion technique. This technique leverages more information than competing methods, using forward waves that travel from the quake’s origin to the seismic receiver and adjoint waves, which are mathematically derived waves that travel from the receiver to the quake.
The problem with testing this theory? “You need really big computers to do this,” Bozdag said, “because both forward and adjoint wave simulations are performed in 3-D numerically.”
In 2012, just such a machine arrived in the form of the Titan supercomputer, a 27-petaflop Cray XK7 managed by the US Department of Energy’s (DOE’s) Oak Ridge Leadership Computing Facility (OLCF), a DOE Office of Science User Facility located at DOE’s Oak Ridge National Laboratory. After trying out its method on smaller machines, Tromp’s team gained access to Titan in 2013 through the Innovative and Novel Computational Impact on Theory and Experiment, or INCITE, program.
Working with OLCF staff, the team continues to push the limits of computational seismology to deeper depths.
Stitching together seismic slices
When an earthquake strikes, the release of energy creates seismic waves that often wreak havoc for life at the surface. Those same waves, however, present an opportunity for scientists to peer into the subsurface by measuring vibrations passing through Earth.
As seismic waves travel, seismograms can detect variations in their speed. These changes provide clues about the composition, density, and temperature of the medium the wave is passing through. For example, waves move slower when passing through hot magma, such as mantle plumes and hotspots, than they do when passing through colder subduction zones, locations where one tectonic plate slides beneath another.
Each seismogram represents a narrow slice of the planet’s interior. By stitching many seismograms together, researchers can produce a 3-D global image, capturing everything from magma plumes feeding the Ring of Fire, to Yellowstone’s hotspots, to subducted plates under New Zealand.
This process, called seismic tomography, works in a manner similar to imaging techniques employed in medicine, where 2-D x-ray images taken from many perspectives are combined to create 3-D images of areas inside the body.
In the past, seismic tomography techniques have been limited in the amount of seismic data they can use. Traditional methods forced researchers to make approximations in their wave simulations and restrict observational data to major seismic phases only. Adjoint tomography based on 3-D numerical simulations employed by Tromp’s team isn’t constrained in this way. “We can use the entire data — anything and everything,” Bozdag said.
Running its GPU version of the SPECFEM3D_GLOBE code, Tromp’s team used Titan to apply full-waveform inversion at a global scale. The team then compared these “synthetic seismograms” with observed seismic data supplied by the Incorporated Research Institutions for Seismology (IRIS), calculating the difference and feeding that information back into the model for further optimization. Each repetition of this process improves global models.
“This is what we call the adjoint tomography workflow, and at a global scale it requires a supercomputer like Titan to be executed in reasonable timeframe,” Bozdag said. “For our first-generation model, we completed 15 iterations, which is actually a small number for these kinds of problems. Despite the small number of iterations, our enhanced global model shows the power of our approach. This is just the beginning, however.”
Automating to augment
For its initial global model, Tromp’s team selected earthquake events that registered between 5.8 and 7 on the Richter scale — a standard for measuring earthquake intensity. That range can be extended slightly to include more than 6,000 earthquakes in the IRIS database — about 20 times the amount of data used in the original model.
Getting the most out of all the available data requires a robust automated workflow capable of accelerating the team’s iterative process. Collaborating with OLCF staff, Tromp’s team has made progress toward this goal.
For the team’s first-generation model, Bozdag carried out each step of the workflow manually, taking about a month to complete one model update. Team members Matthieu Lefebvre, Wenjie Lei, and Youyi Ruan of Princeton University and the OLCF’s Judy Hill developed new automated workflow processes that hold the promise of reducing that cycle to a matter of days.
“Automation will really make it more efficient, and it will also reduce human error, which is pretty easy to introduce,” Bozdag said.
Additional support from OLCF staff has contributed to the efficient use and accessibility of project data. Early in the project’s life, Tromp’s team worked with the OLCF’s Norbert Podhorszki to improve data movement and flexibility. The end result, called Adaptable Seismic Data Format (ASDF), leverages the Adaptable I/O System (ADIOS) parallel library and gives Tromp’s team a superior file format to record, reproduce, and analyze data on large-scale parallel computing resources.
In addition, the OLCF’s David Pugmire helped the team implement in situ visualization tools. These tools enabled team members to check their work more easily from local workstations by allowing visualizations to be produced in conjunction with simulation on Titan, eliminating the need for costly file transfers.
“Sometimes the devil is in the details, so you really need to be careful and know what you’re looking at,” Bozdag said. “David’s visualization tools help us to investigate our models and see what is there and what is not.”
With visualization, the magnitude of the team’s project comes to light. The billion-year cycle of molten rock rising from the core-mantle boundary and falling from the crust — not unlike the motion of globules in a lava lamp — takes form, as do other geologic features of interest.
At this stage, the resolution of the team’s global model is becoming advanced enough to inform continental studies, particularly in regions with dense data coverage. Making it useful at the regional level or smaller, such as the mantle activity beneath Southern California or the earthquake-prone crust of Istanbul, will require additional work.
“Most global models in seismology agree at large scales but differ from each other significantly at the smaller scales,” Bozdag said. “That’s why it’s crucial to have a more accurate image of Earth’s interior. Creating high-resolution images of the mantle will allow us to contribute to these discussions.”
Digging deeper
To improve accuracy and resolution further, Tromp’s team is experimenting with model parameters under its most recent INCITE allocation. For example, the team’s second-generation model will introduce anisotropic inversions, which are calculations that better capture the differing orientations and movement of rock in the mantle. This new information should give scientists a clearer picture of mantle flow, composition, and crust-mantle interactions.
Additionally, team members Dimitri Komatitsch of Aix-Marseille University in France and Daniel Peter of King Abdullah University in Saudi Arabia are leading efforts to update SPECFEM3D_GLOBE to incorporate capabilities such as the simulation of higher-frequency seismic waves. The frequency of a seismic wave, measured in Hertz, is equivalent to the number of waves passing through a fixed point in one second. For instance, the current minimum frequency used in the team’s simulation is about 0.05 hertz (1 wave per 20 seconds), but Bozdag said the team would also like to incorporate seismic waves of up to 1 hertz (1 wave per second). This would allow the team to model finer details in Earth’s mantle and even begin mapping Earth’s core.
To make this leap, Tromp’s team is preparing for Summit, the OLCF’s next-generation supercomputer. Set to arrive in 2018, Summit will provide at least five times the computing power of Titan. As part of the OLCF’s Center for Accelerated Application Readiness, Tromp’s team is working with OLCF staff to take advantage of Summit’s computing power upon arrival.
“With Summit, we will be able to image the entire globe from crust all the way down to Earth’s center, including the core,” Bozdag said. “Our methods are expensive — we need a supercomputer to carry them out — but our results show that these expenses are justified, even necessary.”